see where you stand - ajg.com · u.s. edition see where you stand 2018 benefits strategy &...
TRANSCRIPT
U.S. Edition
SEE WHERE YOU STAND
2018 Benefits Strategy & Benchmarking Survey Executive Summary & Strategic Insights

3GALLAGHER AJG.COM
Table of ContentsSURVEY OVERVIEW ................................................................................................................................................................................................................................4
KEY FINDINGS & IMPLICATIONS .........................................................................................................................................................................................................6
ABOUT GALLAGHER ...............................................................................................................................................................................................................................11
CONTRIBUTORS ........................................................................................................................................................................................................................................12
The intent of this document is to provide you with general information regarding the status of, and/or potential concerns related to, your current employee compensation and benefits environment. It does not necessarily fully address all of your specific issues. It should not be construed as, and is not intended to provide, legal advice. Questions regarding specific issues should be addressed by your general counsel or an attorney who specializes in this practice area.
4 EXECUTIVE SUMMARY & STRATEGIC INSIGHTS2018 BENEFITS STRATEGY & BENCHMARKING SURVEY
Survey OverviewEvery organization wants to perform better. And that means making more informed decisions that lead to a stronger state of organizational wellbeing. Getting there, and staying there, requires strategic investments in the total wellbeing of your people — including their health, financial security and career growth.
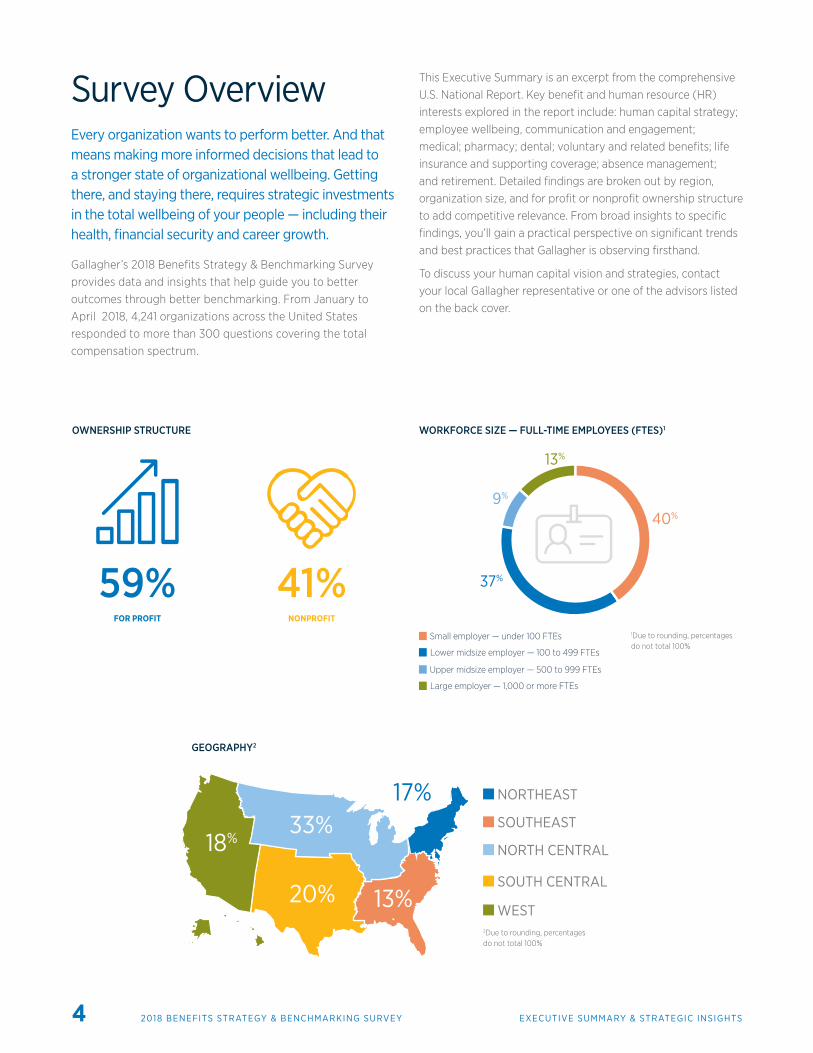
Gallagher’s 2018 Benefits Strategy & Benchmarking Survey provides data and insights that help guide you to better outcomes through better benchmarking. From January to April 2018, 4,241 organizations across the United States responded to more than 300 questions covering the total compensation spectrum.
This Executive Summary is an excerpt from the comprehensive U.S. National Report. Key benefit and human resource (HR) interests explored in the report include: human capital strategy; employee wellbeing, communication and engagement; medical; pharmacy; dental; voluntary and related benefits; life insurance and supporting coverage; absence management; and retirement. Detailed findings are broken out by region, organization size, and for profit or nonprofit ownership structure to add competitive relevance. From broad insights to specific findings, you’ll gain a practical perspective on significant trends and best practices that Gallagher is observing firsthand.
To discuss your human capital vision and strategies, contact your local Gallagher representative or one of the advisors listed on the back cover.
GEOGRAPHY2
SOUTHEAST
SOUTH CENTRAL
NORTHEAST
WEST
NORTH CENTRAL
13%
33%18%
20%
17%
2Due to rounding, percentages do not total 100%
Lower midsize employer — 100 to 499 FTEs
Large employer — 1,000 or more FTEs
Small employer — under 100 FTEs
Upper midsize employer — 500 to 999 FTEs
40%
9%
13%
1Due to rounding, percentages do not total 100%
WORKFORCE SIZE — FULL-TIME EMPLOYEES (FTES)1
37%
OWNERSHIP STRUCTURE
41%NONPROFIT
59%FOR PROFIT
GALLAGHER
SURVEY OVERVIEW
5AJG.COM
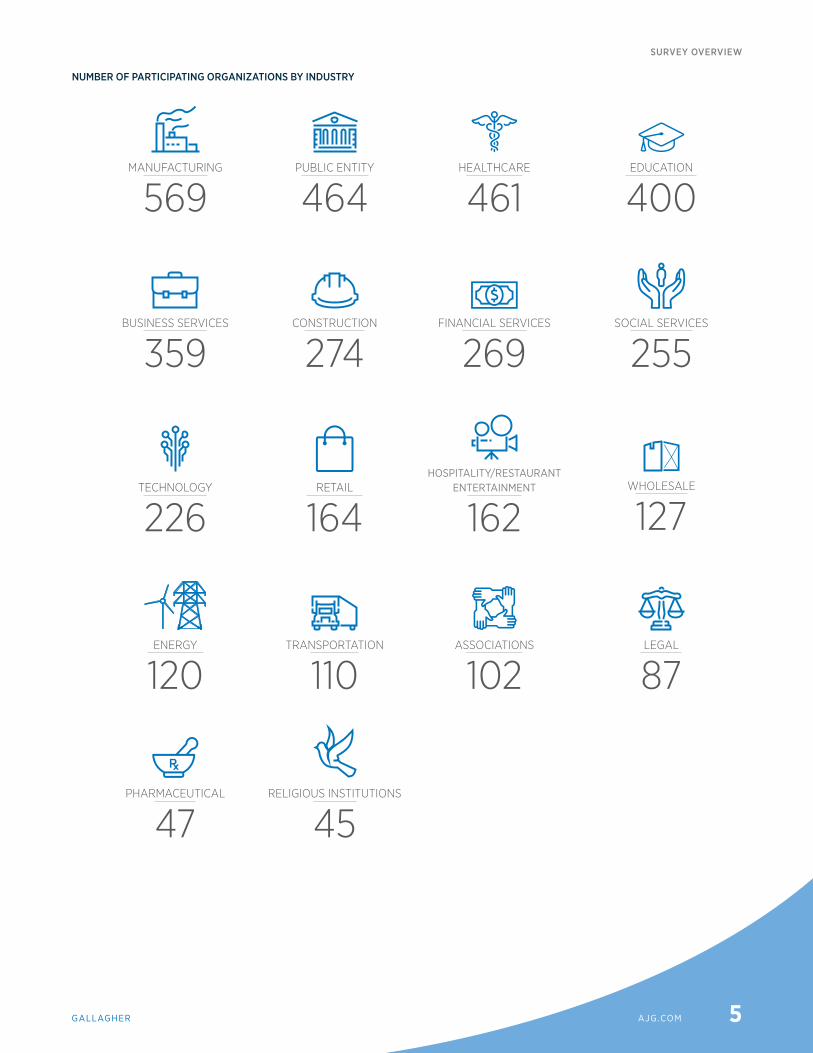
NUMBER OF PARTICIPATING ORGANIZATIONS BY INDUSTRY
PUBLIC ENTITY
464MANUFACTURING
569HEALTHCARE
461EDUCATION
400
BUSINESS SERVICES
359FINANCIAL SERVICES
269
TECHNOLOGY
226
CONSTRUCTION
274SOCIAL SERVICES
255
ENERGY
120
RETAIL
164WHOLESALE
127HOSPITALITY/RESTAURANT
ENTERTAINMENT
162
TRANSPORTATION
110ASSOCIATIONS
102LEGAL
87
RELIGIOUS INSTITUTIONS
45PHARMACEUTICAL
47
KEY FINDINGS & IMPLICATIONS
GALLAGHER
KEY FINDINGS & IMPLICATIONS
7AJG.COM
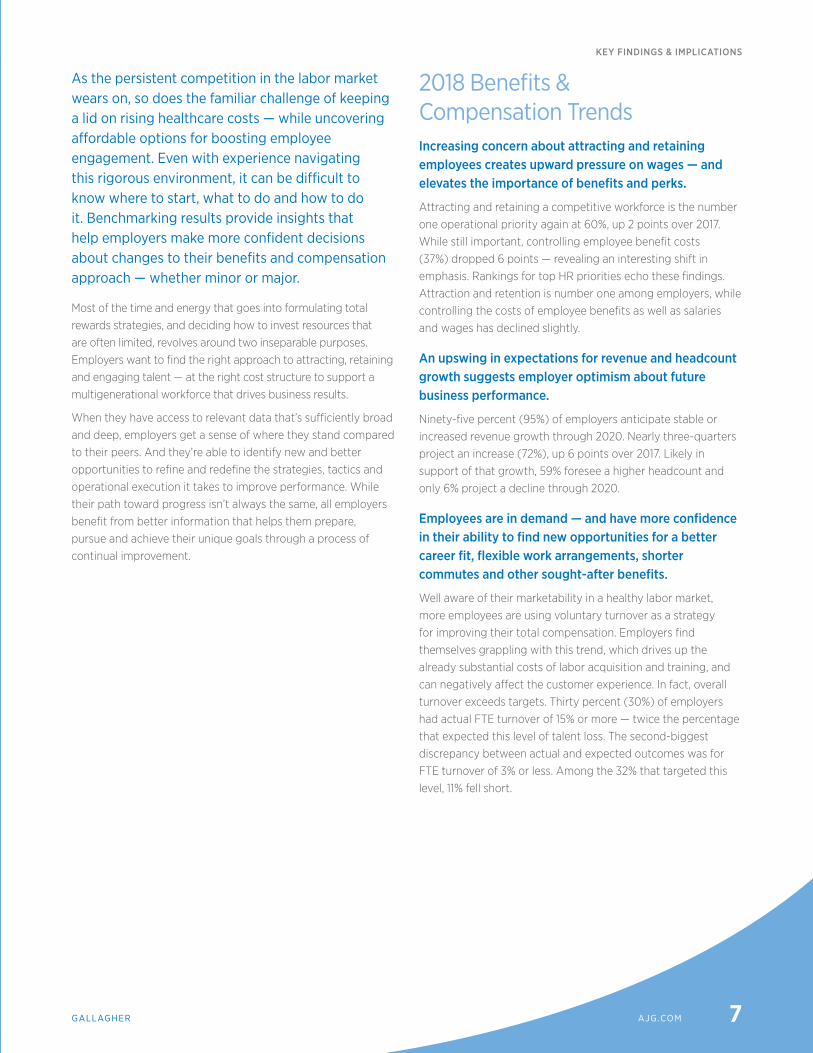
As the persistent competition in the labor market wears on, so does the familiar challenge of keeping a lid on rising healthcare costs — while uncovering affordable options for boosting employee engagement. Even with experience navigating this rigorous environment, it can be difficult to know where to start, what to do and how to do it. Benchmarking results provide insights that help employers make more confident decisions about changes to their benefits and compensation approach — whether minor or major.
Most of the time and energy that goes into formulating total rewards strategies, and deciding how to invest resources that are often limited, revolves around two inseparable purposes. Employers want to find the right approach to attracting, retaining and engaging talent — at the right cost structure to support a multigenerational workforce that drives business results.
When they have access to relevant data that’s sufficiently broad and deep, employers get a sense of where they stand compared to their peers. And they’re able to identify new and better opportunities to refine and redefine the strategies, tactics and operational execution it takes to improve performance. While their path toward progress isn’t always the same, all employers benefit from better information that helps them prepare, pursue and achieve their unique goals through a process of continual improvement.
2018 Benefits & Compensation TrendsIncreasing concern about attracting and retaining employees creates upward pressure on wages — and elevates the importance of benefits and perks.
Attracting and retaining a competitive workforce is the number one operational priority again at 60%, up 2 points over 2017. While still important, controlling employee benefit costs (37%) dropped 6 points — revealing an interesting shift in emphasis. Rankings for top HR priorities echo these findings. Attraction and retention is number one among employers, while controlling the costs of employee benefits as well as salaries and wages has declined slightly.
An upswing in expectations for revenue and headcount growth suggests employer optimism about future business performance.
Ninety-five percent (95%) of employers anticipate stable or increased revenue growth through 2020. Nearly three-quarters project an increase (72%), up 6 points over 2017. Likely in support of that growth, 59% foresee a higher headcount and only 6% project a decline through 2020.
Employees are in demand — and have more confidence in their ability to find new opportunities for a better career fit, flexible work arrangements, shorter commutes and other sought-after benefits.
Well aware of their marketability in a healthy labor market, more employees are using voluntary turnover as a strategy for improving their total compensation. Employers find themselves grappling with this trend, which drives up the already substantial costs of labor acquisition and training, and can negatively affect the customer experience. In fact, overall turnover exceeds targets. Thirty percent (30%) of employers had actual FTE turnover of 15% or more — twice the percentage that expected this level of talent loss. The second-biggest discrepancy between actual and expected outcomes was for FTE turnover of 3% or less. Among the 32% that targeted this level, 11% fell short.
KEY FINDINGS & IMPLICATIONS
8 2018 BENEFITS STRATEGY & BENCHMARKING SURVEY EXECUTIVE SUMMARY & STRATEGIC INSIGHTS
Employers believe their health benefits are more competitive but don’t see any increase in employees’ satisfaction with them — partly due to concerns about the affordability of family coverage.
There’s a rise in employers that consider their health benefits more competitive within their industry or region — to 74% from 71% in 2017 — but they also say employees’ satisfaction with these options hasn’t budged. One likely reason is the expense of family health coverage. Overall, there’s a disparity of 28 points between employers that believe this coverage is affordable (53%) and those that have the same take on their individual coverage (81%). Regardless of size, that gap is at least 20 points.
Managing the cost of health benefits is a top priority for most employers — but less than half have an effective strategy in place.
While nearly three-quarters of employers (74%) consider cost management of their health benefits a top priority, just 44% agree they have an effective strategy to support that objective. The two top healthcare cost-management challenges are medical services (65%) and prescription drugs (50%). Pricey specialty drugs, which are in an expense class of their own, rank relatively high at number four (32%) — just three points behind an unhealthy covered population (35%).
The workforce now consists of five generations, and satisfying the wide-ranging benefit expectations of these diverse employees within an affordable cost structure requires employers to adapt. It’s no longer enough to offer good medical coverage and a competitive retirement plan. As staples of a total rewards program, they need to be rounded out with complementary benefits that work together to promote the total wellbeing of employees. While achieving the right balance may seem daunting, the key is steady improvement — not instant perfection.
2018 Employer Best Practices & Opportunities 1. Increasing benefits choice and flexibility by allowing employees to select a better fit for their different needs and preferences.
People are living longer and that means many are working longer to pay the bills, which often include expenses from taking on a greater share of their employer’s healthcare spend. To better meet the diverse requirements of a multigenerational workforce without substantially increasing costs, employers are adding choice and flexibility — through voluntary benefits, life insurance coverage and related options.
Many of these programs help boost employees’ financial wellbeing through products and services that support a variety of lifestyle needs. By offering them the opportunity to customize their benefits, employers foster greater satisfaction and more productive work-life integration.
Employer best practices include:
• Providing multiple medical plans — the percentage that offer only one option dropped 6 points from 2017.
• Offering employer-sponsored dental plans and group life insurance — percentages for both rose 5 points from 2017.
• Making health savings accounts (HSAs) available as a tax-effective vehicle that helps employees build a reserve of healthcare funds for retirement (24%, up 2 points from 2017).
• Selecting tuition assistance as a voluntary benefit (46%, up 4 points from 2017) — and adopting debt counseling and student loan forgiveness programs to help reduce employee stress.
• Expanding and changing the use of voluntary options — such as coverage for critical illness, legal services, identity theft protection and commuter benefits — to keep benefit offerings distinctly competitive as employee expectations continue to diversify.
An employer opportunity is:
• Extending leave selection beyond the choices of Family and Medical Leave Act (FMLA) and jury programs that most employers offer — large employers are more likely than employers overall to include maternity leave (66% vs. 56%) and paternity leave (44% vs. 38%).
GALLAGHER
KEY FINDINGS & IMPLICATIONS
9AJG.COM
2. Formalizing strategies and policies, conducting contract reviews, and carving out the pharmacy benefit to manage total compensation for better outcomes.
As employers watch healthcare consolidation and other market disruptions unfold, they’re naturally contemplating how these developments will impact them. The reality is they can act independently to operate better within their own healthcare environment right now. Taking steps to manage the pharmacy benefit more effectively should be a top priority, especially high-cost specialty medications. And beyond healthcare concerns, putting well-structured strategies in place for overall benefits and compensation design — as well as specific benefits and polices related to retirement and absence management — will help employers get the most value from their spend while reducing risk.
An employer best practice is:
• Moving from year-to-year benefits planning (64%) to longer cycles of either one to two years or multiple years (36%, up 9 points over 2017) — helping to proactively reconcile employee needs with human capital objectives as well as cost and risk management.
Employer opportunities include:
• Carving out the pharmacy benefit to gain better control over expenses that account for a substantial share of total benefit costs — including large employers whose adoption rate is only 27%, even though they’re more likely to self-insure and are well-positioned to negotiate favorable pharmacy benefit manager (PBM) contracts.
• Managing retirement plans according to a formal investment policy statement to demonstrate compliance with the Employer Retirement Income Security Act (ERISA) — 3 in 10 don’t know if they have a statement, and the 49% that do are more likely to have consistent investment policies.
• Properly administering and managing lost time with the help of an absence management strategy — 65% rank this task as a top priority, but 56% don’t yet have a supporting framework.
3. Increasing the focus on engagement, culture and employee empowerment through education.
Together, employees’ physical, emotional, career and financial wellbeing drives their engagement — which strengthens productivity and organizational wellbeing. Investments in the health, financial security and career growth of the workforce should align with the organization’s employee value proposition and culture. Equally important is supporting these initiatives with well-designed employee communication and education.
By creating a series of strategic touchpoints, employers keep their efforts and targeted outcomes integrated and synchronized.
Compared to 2017, employers are elevating the importance of workforce engagement and productivity (42%, up 5 points), training (40%), and establishing a strong culture (39%, up 6 points) as top HR priorities. Additional advances include greater employee access to resources that promote the wise use of healthcare benefits. However, their proper use and value needs to be clearly communicated or these benefits will miss the mark.
Employers believe that better outreach, stronger integration and more regular execution have the greatest impact on HR management success — and the number one solution for achieving these goals is more effective communications (60%). The other top-three solutions include better collaboration with operations managers and supervisors (46%), and HR policies and programs that are more consistently enforced and more closely followed (43%). In addition, the interest in HR and benefit technologies is on the rise.
Employer best practices include:
• Adopting digital channels as more dynamic pathways for connecting with employees — including the use of mobile apps (10%) and social media (6%), which doubled compared to 2017.
• Planning ahead to optimize HR and benefit technologies to help automate processes, increase employee productivity and support human capital management strategies — by 2020, 38% expect to either replace or expand their HR and benefit technologies, and 8% expect to do both.
• Connecting employees with the charitable causes they champion to support their physical and emotional wellbeing — 82% offer volunteer opportunities and 66% provide the chance to engage with the community.
KEY FINDINGS & IMPLICATIONS
10 2018 BENEFITS STRATEGY & BENCHMARKING SURVEY EXECUTIVE SUMMARY & STRATEGIC INSIGHTS
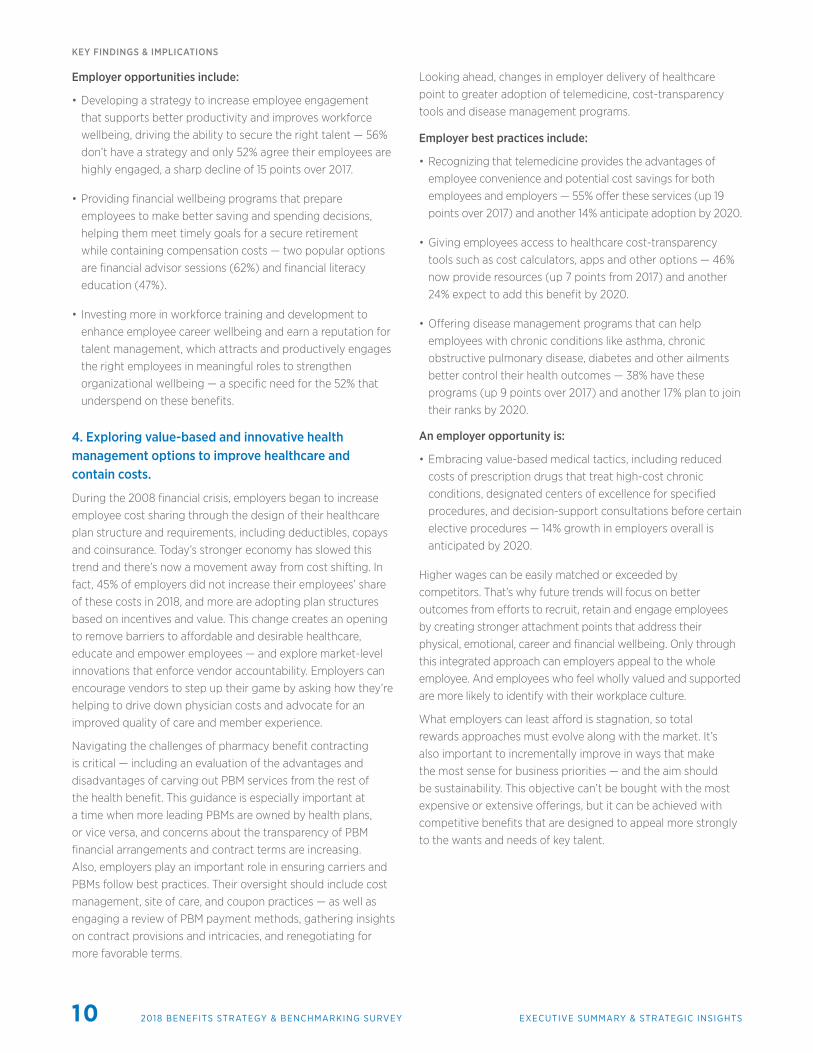
Employer opportunities include:
• Developing a strategy to increase employee engagement that supports better productivity and improves workforce wellbeing, driving the ability to secure the right talent — 56% don’t have a strategy and only 52% agree their employees are highly engaged, a sharp decline of 15 points over 2017.
• Providing financial wellbeing programs that prepare employees to make better saving and spending decisions, helping them meet timely goals for a secure retirement while containing compensation costs — two popular options are financial advisor sessions (62%) and financial literacy education (47%).
• Investing more in workforce training and development to enhance employee career wellbeing and earn a reputation for talent management, which attracts and productively engages the right employees in meaningful roles to strengthen organizational wellbeing — a specific need for the 52% that underspend on these benefits.
4. Exploring value-based and innovative health management options to improve healthcare and contain costs.
During the 2008 financial crisis, employers began to increase employee cost sharing through the design of their healthcare plan structure and requirements, including deductibles, copays and coinsurance. Today’s stronger economy has slowed this trend and there’s now a movement away from cost shifting. In fact, 45% of employers did not increase their employees’ share of these costs in 2018, and more are adopting plan structures based on incentives and value. This change creates an opening to remove barriers to affordable and desirable healthcare, educate and empower employees — and explore market-level innovations that enforce vendor accountability. Employers can encourage vendors to step up their game by asking how they’re helping to drive down physician costs and advocate for an improved quality of care and member experience.
Navigating the challenges of pharmacy benefit contracting is critical — including an evaluation of the advantages and disadvantages of carving out PBM services from the rest of the health benefit. This guidance is especially important at a time when more leading PBMs are owned by health plans, or vice versa, and concerns about the transparency of PBM financial arrangements and contract terms are increasing. Also, employers play an important role in ensuring carriers and PBMs follow best practices. Their oversight should include cost management, site of care, and coupon practices — as well as engaging a review of PBM payment methods, gathering insights on contract provisions and intricacies, and renegotiating for more favorable terms.
Looking ahead, changes in employer delivery of healthcare point to greater adoption of telemedicine, cost-transparency tools and disease management programs.
Employer best practices include:
• Recognizing that telemedicine provides the advantages of employee convenience and potential cost savings for both employees and employers — 55% offer these services (up 19 points over 2017) and another 14% anticipate adoption by 2020.
• Giving employees access to healthcare cost-transparency tools such as cost calculators, apps and other options — 46% now provide resources (up 7 points from 2017) and another 24% expect to add this benefit by 2020.
• Offering disease management programs that can help employees with chronic conditions like asthma, chronic obstructive pulmonary disease, diabetes and other ailments better control their health outcomes — 38% have these programs (up 9 points over 2017) and another 17% plan to join their ranks by 2020.
An employer opportunity is:
• Embracing value-based medical tactics, including reduced costs of prescription drugs that treat high-cost chronic conditions, designated centers of excellence for specified procedures, and decision-support consultations before certain elective procedures — 14% growth in employers overall is anticipated by 2020.
Higher wages can be easily matched or exceeded by competitors. That’s why future trends will focus on better outcomes from efforts to recruit, retain and engage employees by creating stronger attachment points that address their physical, emotional, career and financial wellbeing. Only through this integrated approach can employers appeal to the whole employee. And employees who feel wholly valued and supported are more likely to identify with their workplace culture.
What employers can least afford is stagnation, so total rewards approaches must evolve along with the market. It’s also important to incrementally improve in ways that make the most sense for business priorities — and the aim should be sustainability. This objective can’t be bought with the most expensive or extensive offerings, but it can be achieved with competitive benefits that are designed to appeal more strongly to the wants and needs of key talent.
11GALLAGHER AJG.COM
About GallagherBetter. It’s something all companies strive for. Better outcomes from better performance. But how do you get there?
You start by building a better workplace. One that attracts, engages and retains top talent. What does that look like? It’s a workplace where people feel they belong — where there’s a stronger sense of developing a career than punching a clock. And a culture of opportunity that draws new talent because it inspires employees to deliver their personal and professional best.
Gallagher’s comprehensive approach to benefits, compensation, retirement, employee communication and workplace culture aligns your human capital strategy with your overall business goals. It centers on the full spectrum of organizational wellbeing — strategically investing in your people’s health, talent, financial security and career growth. And developing benefit and HR programs at the right cost structures to support a multigenerational workforce.
From evaluating the demographics of your workforce to surveying and analyzing competitor trends, Gallagher helps you gather new insights and apply best practices that promote productivity and growth. A data-driven focus allows you to continually improve.
That’s what it means to create a better workplace culture. It’s about never being content to rest each time you reach your best. Your better is never finished.
As you develop and sustain this destination workplace culture, your people can thrive and perform at a higher level — optimizing your annual talent investment and mitigating organizational risk to maximize your profitability. Best of all, you gain a competitive advantage as a workplace that simply works better.
Arthur J. Gallagher & Co. (NYSE: AJG), an international insurance brokerage and risk management services firm, is headquartered in Rolling Meadows, Illinois, has operations in 34 countries and offers client-service capabilities in more than 150 countries around the world through a network of correspondent brokers and consultants.
Contributors
Terms of Use
www.ajg.com
25075A_NBSES
“World’s Most Ethical Companies” and “Ethisphere” names and marks are registered trademarks of Ethisphere LLC.
The intent of this Survey is to provide you with general information regarding current practice within the employee benefits environment. The data does not constitute recommendations or other advice regarding employee benefit programs, and the user is in no way obligated to accept or implement any information for use within their organization(s). The decision to utilize any information provided rests solely with the user, and application of the data contained does not guarantee compliance with applicable laws or regulations regarding employee benefits. Information provided by the Survey, even if generally applicable, cannot possibly take into account all of the various factors that may affect a specific individual or situation. Additionally, practices described within the Survey should not be construed as, nor are they intended to provide, legal advice.
The Web Site and the Content do not constitute accounting, consulting, investment, insurance, legal, tax or any other type of professional advice, and should be used only in conjunction with the services of a Gallagher consultant and any other appropriate professional advisors who have full knowledge of the user’s situation.
Gallagher does not represent or warrant that the Content will be correct, accurate, timely or otherwise reliable. Gallagher may make changes to the Content at any time. Gallagher assumes no responsibility of any kind, oral or written, express or implied, including but not limited to fitness for a particular purpose, accuracy, omissions and completeness of information. Gallagher shall in no event whatsoever be liable to licensee or any other party for any indirect, special, consequential, incidental, or similar damages, including damages for lost data or economic loss, even if Gallagher has been notified of the possibility of such loss. For the purposes of this section the term “Gallagher” shall be construed so as to include Gallagher Surveys as a marketing division and/or Gallagher Benefit Services, Inc. and its affiliates.
Consulting and insurance brokerage services to be provided by Gallagher Benefit Services, Inc. and/or its affiliate Gallagher Benefit Services (Canada) Group Inc. Gallagher Benefit Services, Inc., a non-investment firm and subsidiary of Arthur J. Gallagher & Co., is a licensed insurance agency that does business in California as “Gallagher Benefit Services of California Insurance Services” and in Massachusetts as “Gallagher Benefit Insurance Services.” Certain appropriately licensed individuals of Arthur J. Gallagher & Co. subsidiaries or affiliates offer securities through Kestra Investment Services, LLC (Kestra IS), member FINRA/SIPC and or investment advisory services through Kestra Advisory Services, LLC (Kestra AS), an affiliate of Kestra IS. Neither Kestra IS nor Kestra AS is affiliated with Arthur J. Gallagher & Co., or Gallagher Benefit Services, Inc. Neither Kestra AS, Kestra IS, Arthur J. Gallagher & Co., nor their affiliates provide accounting, legal, or tax advice. GBS/Kestra-CD(299303)Exp(102019)
© 2018 Gallagher Benefit Services, Inc.
All rights reserved. No part of this book, including the text, data, graphics, interior design and cover design may be reproduced or transmitted in any form, without explicit consent from Arthur J. Gallagher & Co.
ABSENCE MANAGEMENT Agnes Nines [email protected]
COMMUNICATION Matt Frost [email protected]
Pepper Krach [email protected]
DENTAL Graham Thompson [email protected]
ENGAGEMENT Chris Dustin [email protected]
David Rowlee [email protected]
LIFE INSURANCE Rich Brock [email protected]
MEDICAL Kevin Cipoletti [email protected]
Glen Evelyn [email protected]
Kristy Ventimiglia [email protected]
Adam Wolff [email protected]
James Wright [email protected]
PHARMACY Seth Friedman [email protected]
Mark Rosenberg [email protected]
RESEARCH & REPORTING Stephanie Bauman [email protected]
RETIREMENT Dean Clune [email protected]
SURVEY DEVELOPMENT Thomas Cummins [email protected]
TOTAL REWARDS Scott Hamilton [email protected]
Kent Lonsdale [email protected]
Joseph Milano [email protected]
VOLUNTARY Tim Easterwood [email protected]
Jim Evans [email protected]
WELLBEING Ali Payne [email protected]