seea eea revision expert consultation working …...seea eea revision – expert consultation 4 case...
TRANSCRIPT

SEEA EEA Revision
Expert Consultation
Working group 2: Ecosystem condition
Review copy of: Supplement to Discussion paper 2.2: Review of
ecosystem condition accounting case studies: Lessons learned and options for developing condition accounts
Consultation date: 13 March 2019 Disclaimer: This paper has been prepared by the authors listed below as part of the work on the SEEA EEA Revision coordinated by the United Nations Statistics Division. The views expressed in this paper do not necessarily represent the views of the United Nations. Maes, J., Driver, A., Czúcz, B., Keith, H., Jackson, B., Bland, L., Nicholson, E., Dasoo, M. (2019) Supplement to discussion paper 2.2: Review of ecosystem condition accounting case studies: Lessons learned and options for developing condition accounts. Paper submitted to the SEEA EEA Technical Committee as input to the revision of the technical recommendations in support of the System on Environmental-Economic Accounting. Version of 13 March 2019. 44 pp.
DEPARTMENT OF ECONOMIC AND SOCIAL AFFAIRS STATISTICS DIVISION UNITED NATIONS

SEEA EEA Revision – Expert Consultation
Research area #2: Ecosystem condition
Supplement to Discussion paper 2.2: Review of ecosystem
condition accounting case studies: Lessons learned and options for
developing condition accounts
Lead authors: Joachim Maes, Amanda Driver
Contributing authors: Bálint Czúcz, Heather Keith, Bethanna Jackson, Lucie Bland Emily Nicholson,
and Malik Dasoo
Contents
Type A case studies: Ecosystem accounts that include ecosystem condition tables 1
Type B case studies: Ecosystem accounts that include relevant information for developing condition
accounts 32

SEEA EEA Revision – Expert Consultation
1
Type A case studies: Ecosystem accounts that include ecosystem condition
tables
Table A2. List of case studies
Number Country Reference
Type A case studies (Strict condition accounts)
1 Australia Eigenraam, M., McCormick, F., Contreras, Z. (2016) .Marine and Coastal Ecosystem Accounting: Port Phillip Bay. Report to the Commissioner for Environmental Sustainability. ISBN 978-1-76047-395-2
2 Australia- Information Paper: An Experimental Ecosystem Account for the Great Barrier Reef Region (2015). Available here
3 Australia Eigenraam, M., Chua, J., Hasker, J. (2013). Environmental-Economic Accounting: Victorian Experimental Ecosystem Accounts, Version 1.0. Department of Sustainability and Environment, State of Victoria.
4 Australia Keith, H., Vardon, M., Stein, J., Stein, J., Lindenmayer, D. (2017) Experimental Ecosystem Accounts for the Central Highlands of Victoria (A scientific article is available as Keith, H., Vardon, M., Stein, J.A., Stein, J.L., Lindenmayer, D., 2017. Ecosystem accounts define explicit and spatial trade-offs for managing natural resources. Nature Ecology & Evolution 1, 1683-1692.)
5 Australia Wentworth Group (2016) Accounting for Nature- A scientific method for constructing environmental asset condition accounts. ISBN: 978-0-9944577-3-8
6 Australia Varcoe, T., Betts O’Shea, H., Contreras, Z. (2015) Valuing Victoria’s Parks Accounting for ecosystems and valuing their benefits: Report of first phase findings.
7 Canada Statistics Canada Environment Accounts and Statistics Division (2013) Human Activity and the Environment. Measuring ecosystem goods and services in Canada.
8 Netherlands de Jong, R., Edens, B., van Leeuwen, N., Schenau, S, Remme, R., Hein, L. (2014) Ecosystem Accounting Limburg Province, the Netherlands Part I: Physical supply and condition accounts
9 South Africa Nel, J.L., Driver, A. (2015) National River Ecosystem Accounts for South Africa. Discussion document for Advancing SEEA Experimental Ecosystem Accounting Project. South African National Biodiversity Institute, Pretoria
10 UK Eftec (2015). Developing UK Natural Capital Accounts: Woodland Ecosystem Accounts. Report prepared for the Department for Environment, Food and Rural Affairs (Defra), March 2015.
11 UK Khan, J., Din, F. (2015) UK Natural Capital – Freshwater Ecosystem Assets and Services Accounts. Office for National Statistics
12 UK White, C., Dunscombe, R., Dvarskas, A., Eves, C., Finisdore, J., Kieboom, E., Maclean, I., Obst, C., Rowcroft, P. & Silcock, P. (2015), ‘Developing ecosystem accounts for protected areas in England and Scotland: Main Report’, Department for Food, Environment & Rural Affairs/The Scottish Government
13 UK Forest Enterprise England (2017) Natural capital accounts. Forestry Commission England
14 UK Office for National Statistics (2018) UK natural capital: ecosystem

SEEA EEA Revision – Expert Consultation
2
accounts for urban areas Initial natural capital accounts containing information about green space in urban areas. Statistical Bulletin
Type B case studies: Accounts that discuss aspects of condition but don’t include condition account tables
15 Australia Thackway, R., Lesslie, R. (2005) Vegetation Assets, States and Transitions (VAST): Accounting for vegetation condition in the Australian landscape. BRS Technical Report, Bureau of Rural Sciences, Canberra
16 Australia Smith, B., Summers, D., Vardon, M. (2017) Environmental-Economic Accounting for ACT State of the Environment Reporting – Proof of Concept. Office of the Commissioner for Sustainability and the Environment.
17 EU UNEP-WCMC (2017) Developing Ecosystem Condition Accounts for the EU and Member States
18 South Africa Driver, A., Nel, J.L., Smith, J., Daniels, F., Poole, C.J., Jewitt, D., Escott, B.J. (2015) Land and ecosystem accounting in KwaZulu‐Natal, South Africa. Discussion document for Advancing SEEA Experimental Ecosystem Accounting Project. South African National Biodiversity Institute, Pretoria
19 Uganda UNEP-WCMC & IDEEA (2017) Experimental Ecosystem Accounts for Uganda. Cambridge, UK.
20 UK Office for National Statistics (2017) UK natural capital: developing UK mountain, moorland and heathland ecosystem accounts.
21 UK Office for National Statistics (2018) UK natural capital: developing semi-natural grassland ecosystem accounts
22 UK Office for National Statistics (2016) Scoping UK coastal margin ecosystem accounts
23 UK Dickie I, Evans C and Smyth MA (2015) Scoping the Natural Capital Accounts for Peatland, work package 3 of Report NR0165 for Defra

SEEA EEA Revision – Expert Consultation
3
Case study 1. Australia: Marine and Coastal Ecosystem Accounting: Port Phillip Bay
This report contains accounts consistent with the SEEA. It reports extent and condition and
illustrates the accounts with example tables where condition is reported as opening and closing
scores under different condition levels. However, the condition accounts shown are hypothetical,
not based on actual data. Lack of ecosystem condition data and spatially referenced data was a key
constraint in populating the accounts for ecosystem assets. The accounts for ecosystem services and
benefits are more fully developed.
Specific information about the reporting of the condition account
Ecosystem or asset types Marine inlets, transitional waters and coastal ecosystems Ecosystem extent reported Yes Ecosystem condition reported
Yes
Realm Marine and terrestrial Spatial unit for analysis Basic Spatial Unit – seems to be a 1 ha grid although the size of the
BSU is not explicitly stated Spatial unit of reporting 5 geographic areas within Port Phillip Bay Condition indicators Nitrogen load and water quality index
Currently developing condition indicators for 4 marine ecosystem types
Aggregated index An example account in presented suggesting 5 condition classes with a composite condition score ranging from 0 to 10
Condition categories 5 classes Classification of indicators No Reference levels No (although reference condition of “10”?) How is condition reported Opening and closing stocks of area under different condition levels
(ha)
Reported condition table (this is a hypothetical account, not based on real data)

SEEA EEA Revision – Expert Consultation
4
Case study 2. Australia: An Experimental Ecosystem Account for the Great Barrier Reef Region
This account presents summary information by indexing measures of condition of terrestrial and
marine ecosystems, as well as the flow of river loads, to provide an overview of the ecosystem
characteristics within the region. A rationale as to why these indicators have been selected to assess
ecosystem condition is lacking. It refers to the SEEA EEA.
Specific information about the reporting of the condition account
Ecosystem or asset types Shelf and ocean ecosystems, coral reef system, also river catchments
Ecosystem extent reported No Ecosystem condition reported
Yes
Realm Marine, inland water Spatial unit of analysis Not specified Spatial unit of reporting Whole Great Barrier Reef region, not spatially disaggregated Condition indicators For rivers: River loads (solids, nitrogen, phosphorus); For marine:
coral, water quality, seagrass and fish numbers – although it is not clear what the metric was for “coral” or “seagrass”; For terrestrial: NPP.
Aggregated indicator No Condition categories No Classification of indicators No Reference levels No (but a baseline year of 2007/8 is used) How is condition reported Indicator values rescaled between 0 and 100 whereby 100 is the
baseline value for a selected year
Reported condition table
The condition table compares ecosystem condition based on indicators relative to a baseline year.

SEEA EEA Revision – Expert Consultation
5
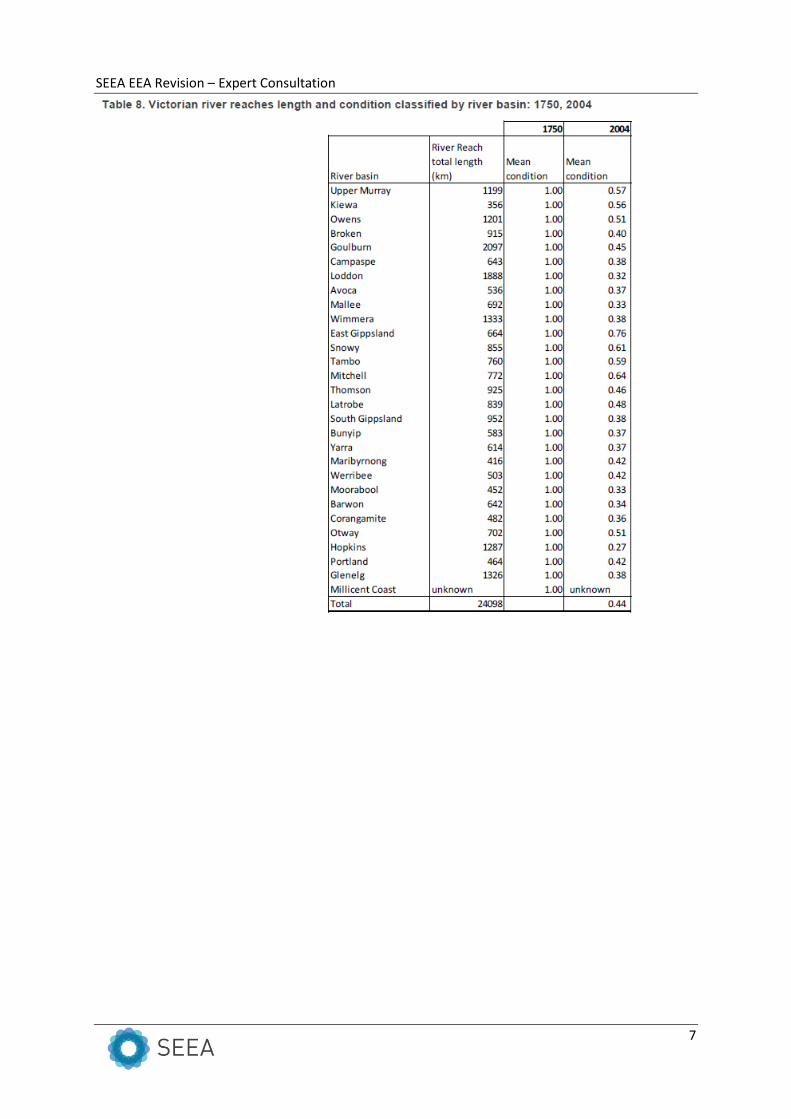
Case study 3. Australia: Victorian Experimental Ecosystem Accounts
A set of asset accounts including the extent and condition for major vegetation types, wetlands and
rivers with table reporting the condition for a specific year against a reference year (1750). All tables
report condition as a single, aggregated index (condition in 1750 = 100). It refers to the SEEA EEA.
Specific information about the reporting of the condition account
Ecosystem or asset types Major vegetation groups, wetland systems, rivers Ecosystem extent reported
Yes
Ecosystem condition reported
Yes
Realm Terrestrial, inland water Spatial unit of analysis Basic Spatial Unit - seems to be a 1 ha grid although the size of the
BSU is not explicitly stated Spatial unit of reporting 10 catchment regions within State of Victoria; also bioregions within
State of Victoria Condition indicators Habitat hectares approach based on 10 indicators (Large trees, Tree
(canopy) cover, Understorey (non-tree) strata, Lack of weeds, Recruitment, Organic litter, Logs, Patch size, Neighbourhood, Distance to core area)
Aggregated indicator Mean condition per hectare for terrestrial ecosystem types based on the habitat hectares approach. Condition for wetland and for rivers based on an Index of Wetland Condition and an Index of Stream Condition, respectively. References to separate documents for calculation of these indices. The index of wetland condition is based on the weighted sum for 6 sub-index scores. The sub index scores are derived from 13 metrics. The index of stream condition is built in a similar way: 5 sub-indices and 23 metrics. Each river reach assessed is given an overall ISC score of between 0-50. This score is then categorized into one of five broad condition bands – excellent, good, moderate, poor or very poor.
Classification of indicators Indicators assorted to site conditions and landscape context. Index of wetland condition and stream condition is built on sub-indices which constitute a classification.
Reference levels Yes, the 1750 undisturbed situation is set to 1 How is condition reported Opening and closing stocks of area under different condition levels
(ha)
Reported condition tables
Three tables are included here to illustrate the accounts (major vegetation types, wetlands and
rivers) but more are available in the report. The accounts report either at subnational scale
(vegetation types and different types of wetland) or at basin scale (for rivers). The accounts report
extent and an aggregated index for ecosystem condition for different years relative to the 1750
reference year.

SEEA EEA Revision – Expert Consultation
6
SEEA EEA Revision – Expert Consultation
7
SEEA EEA Revision – Expert Consultation
8
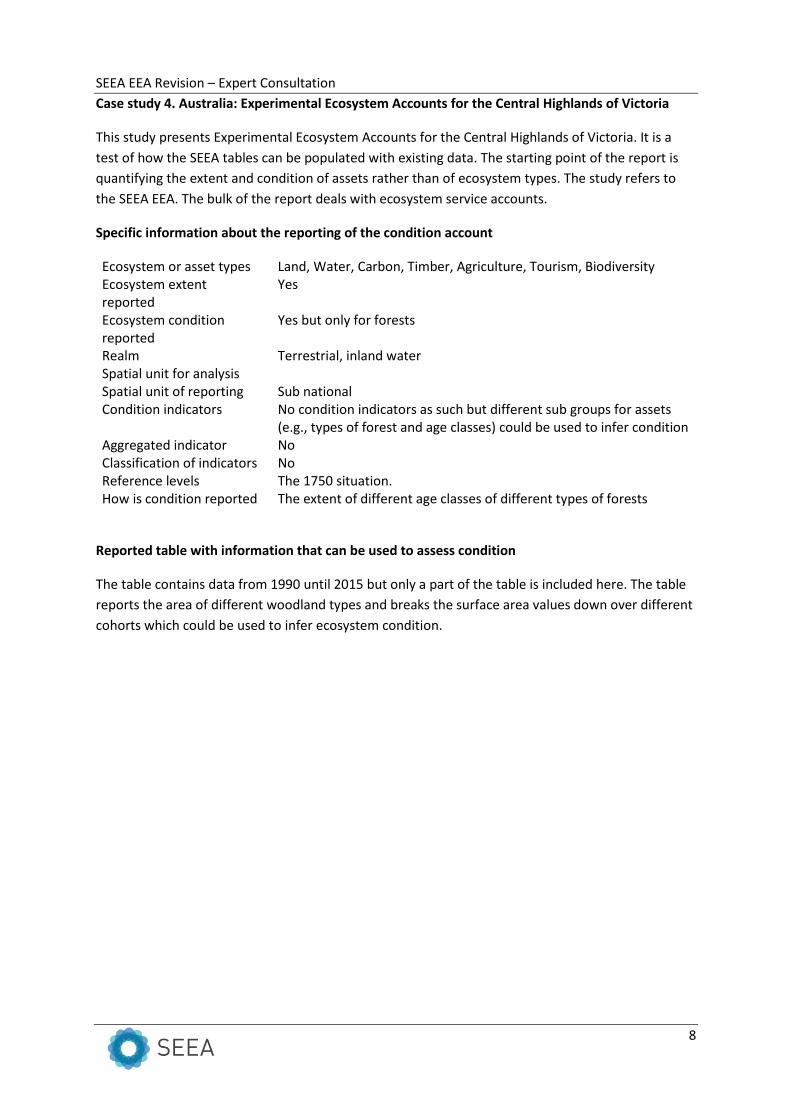
Case study 4. Australia: Experimental Ecosystem Accounts for the Central Highlands of Victoria
This study presents Experimental Ecosystem Accounts for the Central Highlands of Victoria. It is a
test of how the SEEA tables can be populated with existing data. The starting point of the report is
quantifying the extent and condition of assets rather than of ecosystem types. The study refers to
the SEEA EEA. The bulk of the report deals with ecosystem service accounts.
Specific information about the reporting of the condition account
Ecosystem or asset types Land, Water, Carbon, Timber, Agriculture, Tourism, Biodiversity Ecosystem extent reported
Yes
Ecosystem condition reported
Yes but only for forests
Realm Terrestrial, inland water Spatial unit for analysis Spatial unit of reporting Sub national Condition indicators No condition indicators as such but different sub groups for assets
(e.g., types of forest and age classes) could be used to infer condition Aggregated indicator No Classification of indicators No Reference levels The 1750 situation. How is condition reported The extent of different age classes of different types of forests
Reported table with information that can be used to assess condition
The table contains data from 1990 until 2015 but only a part of the table is included here. The table
reports the area of different woodland types and breaks the surface area values down over different
cohorts which could be used to infer ecosystem condition.

SEEA EEA Revision – Expert Consultation
9

SEEA EEA Revision – Expert Consultation
10
Case study 5. Australia: Accounting for Nature- A scientific method for constructing environmental
asset condition accounts
This report is a step by step guide with real case examples of how to assess condition and structure a
condition account. The study refers to SEEA and includes table structure, method and indicators for
condition accounts, with examples of condition tables for South East Queensland.
Specific information about the reporting of the condition account
Ecosystem or asset types Five asset classes: Land (e.g. native vegetation, soil), Water (e.g. rivers, wetlands), Coasts (e.g. estuaries, beaches), Marine (e.g. reefs, seagrass), Atmosphere (e.g. air quality)
Ecosystem extent reported Yes Ecosystem condition reported
Yes
Realm Terrestrial, inland water, marine Spatial unit for analysis Spatial unit of reporting National and sub-national Condition indicators Nitrogen, sediment, and phosphorous loads; Physical/chemical index;
Chlorophyll-a; Dissolved Oxygen; Total Nitrogen; Total Phosphorus; Turbidity; Biological Health Rating; Mixing Plots; δ15N; Foreshore/riparian habitat extent; Total Foreshore/riparian habitat extent; various biological habitat health indices
Aggregated indicator Yes, Econd, a composite indicator between 0 and 100 Classification of indicators Not formal classification but recognition of ecological processes,
biodiversity, physical/chemical Reference levels 1788 situation (=100) How is condition reported The account reports the indicator values, aggregated values and the
composite indicator Econd as opening and closing stock per ecosystem type in combination with extent information
Reported condition tables
The three accounting tables which are here included are structured from summarizing condition for
high-level asset classes (figure 10), aggregated information for one asset (figure 11) through to
detailed condition indicators for an individual estuary (figure 12).
The first table is hierarchically structured (from left to right) and contains aggregated information for
terrestrial, inland water, coastal and marine ecosystems. The second table for estuaries reports
values for the same three sub-indices as the first table does for estuaries (physical/chemical,
biological health rating and foreshore and riparian habitat extent) but it reports the values for
individual estuaries. A third table finally includes data for the different indicators that compose the
sub-indices.

SEEA EEA Revision – Expert Consultation
11

SEEA EEA Revision – Expert Consultation
12

SEEA EEA Revision – Expert Consultation
13
Case study 6. Australia: Valuing Victoria’s Parks Accounting for ecosystems and valuing their
benefits
This account covers the total area of parks and reserves in Victoria and reports ecosystem condition
for various asset types. The report refers to SEEA.
Specific information about the reporting of the condition account
Ecosystem or asset types Native vegetation, Wetlands, Rivers, Marine Ecosystem extent reported yes Ecosystem condition reported
yes
Realm Terrestrial, inland water, marine Spatial unit for analysis Spatial unit of reporting Subnational Condition indicators For each ecosystem type an aggregated indicator is calculated based
on specific metrics (Vegetation score, index of wetland condition is a hierarchical index on a 10-point score scale based on six key characteristics that define wetlands, namely wetland catchment, physical form, hydrology, soils, water properties and biota; index of stream condition is based on a 50-point score scale and is made up of five sub-indices describing the condition of a river reach, namely hydrology, streamside zone, physical form, water quality and aquatic life; Marine condition based on Parks Victoria’s marine monitoring program and marine report cards which assesses condition of key habitats across multiple parks, as follows: VG = Very Good, F = Fair
Aggregated indicator Index per ecosystem type Classification of indicators No Reference levels No but probably dependent on the construction of the index; the
vegetation score takes 1750 as reference How is condition reported Extent and condition reported for areas under different levels of
protection (using the IUCN classification) and per ecosystem type for different subtypes
Reported condition tables
The condition of different ecosystem types or assets is reported for different levels of protection
using a condition index which is specific per ecosystem or asset type. The table reports extent and
condition data for different years. Separate tables are available per ecosystem type but they report
extent only. A detailed breakdown of the extent, condition and significance (representation) of each
native vegetation type is provided as well to compare average condition within parks with condition
outside (Table 4.2 of the report but this table is not included here).

SEEA EEA Revision – Expert Consultation
14

SEEA EEA Revision – Expert Consultation
15
Case study 7. Canada: Measuring ecosystem goods and services in Canada
The report considers ecosystem condition as “ecosystem quality” (page 19 of the report) which is
measured as human landscape modification. Landscape modification indicators presented in
detailed tables in an appendix, but not as a condition account. The report includes an accounting
table on ecosystem quality. Condition is measured using a set of indicators which are reported for
different sub-drainage areas.
Specific information about the reporting of the condition account
Ecosystem or asset types Forest and woodland, agro-ecosystems, urban, and marine inlets, transitional waters and coastal ecosystems
Ecosystem extent reported Yes Ecosystem condition reported
Yes
Realm Terrestrial, inland water and marine Spatial unit of analysis Spatial unit of reporting National Condition indicators Degree of modification from natural state (human landscape
modification): five measures of ecosystem quality: landscape type, natural land parcel size, distance to natural land parcel, barrier density and population density
Aggregated indicator N/a Classification of indicators N/a Reference levels N/a How is condition reported Indicator values
Reported condition table
The table included here is an extract from a larger table. It reports the values of three indicators per
sub drainage area for 2011. For one indicator there is also data for 2001.

SEEA EEA Revision – Expert Consultation
16
Case study 8. Netherlands: Ecosystem Accounting Limburg Province (Physical supply and condition
accounts)
This study is a test case for the Netherlands. It contains a conceptual proposal for a condition
account. An elaborated condition account for the Netherlands is currently in review and will be
published later so this account could not be included in this paper. The report refers to the SEEA.
Specific information about the reporting of the condition account
Ecosystem or asset types Cropland, Forest and woodland, Rivers and lakes, urban and grassland
Ecosystem extent reported Yes Ecosystem condition reported
Yes
Realm Terrestrial, inland water Spatial unit of analysis In principle mapped at high spatial resolution (1 ha) Spatial unit of reporting Sub-national (province) Condition indicators nitrogen content, heavy metal content, PM2.5 concentration, PM10
concentration, nitrous oxide exceedance days, annual rainfall, annual no. growing days, depth to groundwater table, degree of fragmentation, naturalness of biota, species richness, red-listed species, water quality
Aggregated indicator Classification of indicators Physical state, environmental state (chemical quality) and ecosystem
state Reference levels How is condition reported reported as indicator values together with the extent per ecosystem
type
Reported condition table
The table reports both extent of ecosystem units (EU) and condition for 6 ecosystem types.
Condition is reported using a set of indicators assorted by three different categories. Indicator values
refer to a single year and still many data gaps are evident

SEEA EEA Revision – Expert Consultation
17

SEEA EEA Revision – Expert Consultation
18
Case study 9. South Africa: National River Ecosystem Accounts
This report links condition accounts to extent accounts and presents a fairly complete reporting of
indicators, aggregated indicators and a composite index. The study refers to SEEA. Condition
accounts presented in various forms (see Figure A from the report).
Specific information about the reporting of the condition account
Ecosystem or asset types Rivers Ecosystem extent reported Yes Ecosystem condition reported
Yes
Realm Inland water Spatial unit for analysis River reaches (at quaternary and sub-quaternary catchment level) Spatial unit of reporting National, also sub-national (Water Management Area) Condition indicators Ecological condition indicators (Flow, water quality, instream
habitat, riparian habitat), Aggregated indicator Aggregated ecological condition category (natural state and three
classes or levels of modification) and ecological condition index Classification of indicators Implicit typology Reference levels Natural state (ecological condition index =100) while the other states
are defined based on percentiles How is condition reported Complete reporting (indicator values, aggreagted values, index, +
linked to the extent account in km)
Reported condition tables
The study reports condition accounts using on four indicators for main rives as well as a table with
data for an aggregated condition category. A final table aggregates the information of the second
table into a single index.

SEEA EEA Revision – Expert Consultation
19

SEEA EEA Revision – Expert Consultation
20

SEEA EEA Revision – Expert Consultation
21
Case study 10. United Kingdom. Developing UK Natural Capital Accounts: Woodland Ecosystem
Accounts.
This report is part of a series of DEFRA and ONS (Office for National Statistics ) reports on accounts
of various ecosystem types in the UK. It describes the account making reference to the SEEA EEA.
Specific information about the reporting of the condition account
Ecosystem or asset types Woodland Ecosystem extent reported Yes Ecosystem condition reported
Yes
Realm Terrestrial Spatial unit for analysis High spatial resolution (gridded data sets used <1km2) Spatial unit of reporting National Condition indicators Extent of species type and volume, age, biomass stock, carbon
biomass stock, Site of Special Scientific Interest extent, woodland in flood risk areas, soil carbon stocks
Aggregated indicator No Classification of indicators No Reference levels No as per principle: The reference condition should not be adopted
and changes should simply be measured as differences between opening and closing stocks
How is condition reported Asset account with combined information on extent and condition. As a closing stock (indicator values)
Reported condition tables
Table 4.1 presents the physical ecosystem stock account (closing stock) showing total extent of
woodland and the condition of woodland measured by stock values (extent for certain types or for
certain designations, biomass, carbon)
SEEA EEA Revision – Expert Consultation
22
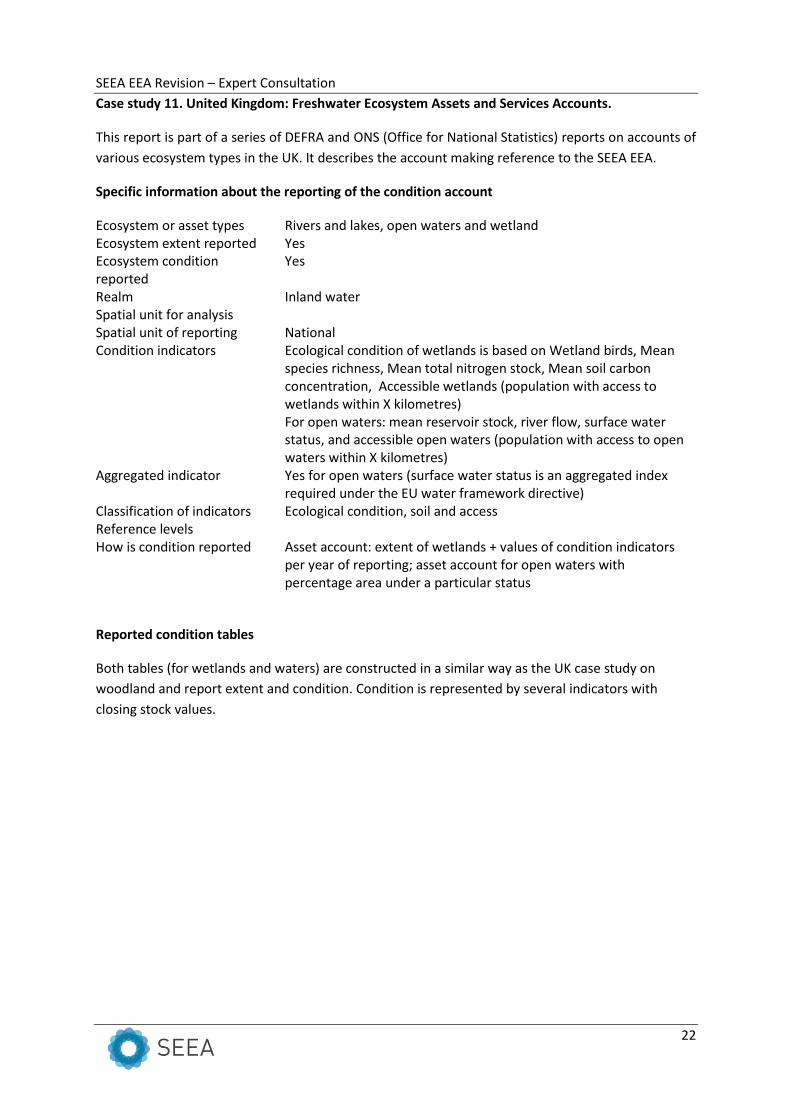
Case study 11. United Kingdom: Freshwater Ecosystem Assets and Services Accounts.
This report is part of a series of DEFRA and ONS (Office for National Statistics) reports on accounts of
various ecosystem types in the UK. It describes the account making reference to the SEEA EEA.
Specific information about the reporting of the condition account
Ecosystem or asset types Rivers and lakes, open waters and wetland Ecosystem extent reported Yes Ecosystem condition reported
Yes
Realm Inland water Spatial unit for analysis Spatial unit of reporting National Condition indicators Ecological condition of wetlands is based on Wetland birds, Mean
species richness, Mean total nitrogen stock, Mean soil carbon concentration, Accessible wetlands (population with access to wetlands within X kilometres) For open waters: mean reservoir stock, river flow, surface water status, and accessible open waters (population with access to open waters within X kilometres)
Aggregated indicator Yes for open waters (surface water status is an aggregated index required under the EU water framework directive)
Classification of indicators Ecological condition, soil and access Reference levels How is condition reported Asset account: extent of wetlands + values of condition indicators
per year of reporting; asset account for open waters with percentage area under a particular status
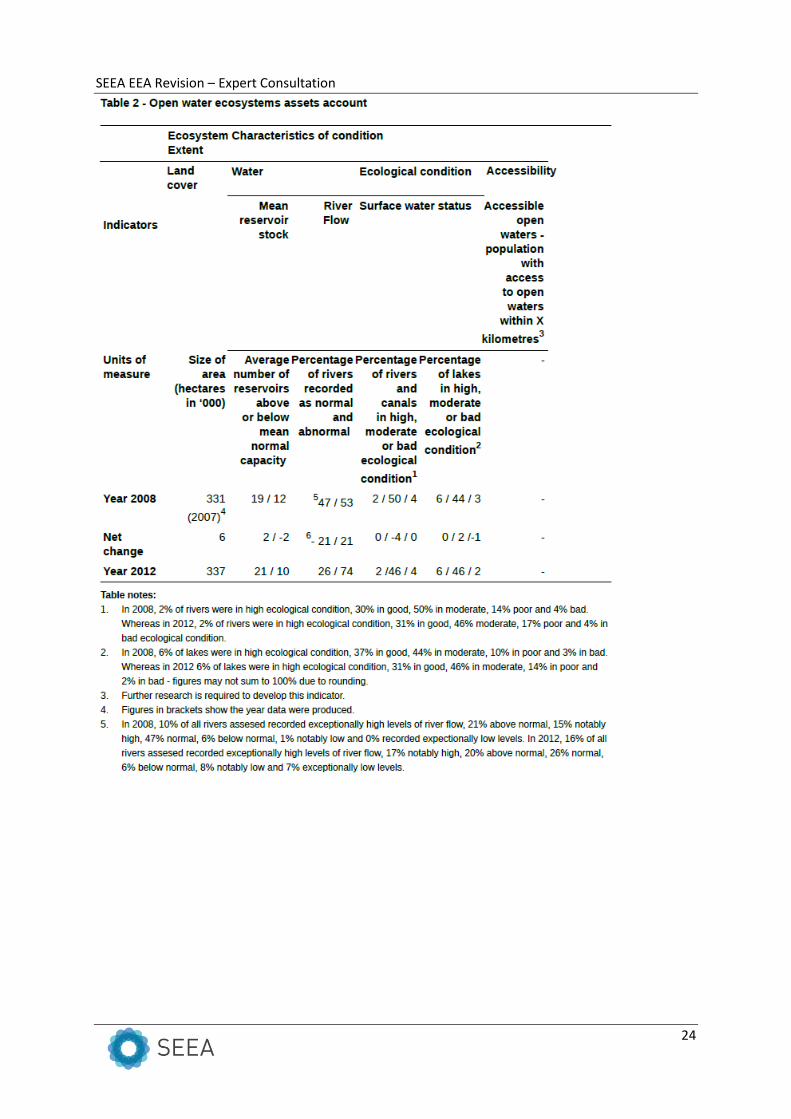
Reported condition tables
Both tables (for wetlands and waters) are constructed in a similar way as the UK case study on
woodland and report extent and condition. Condition is represented by several indicators with
closing stock values.

SEEA EEA Revision – Expert Consultation
23
SEEA EEA Revision – Expert Consultation
24

SEEA EEA Revision – Expert Consultation
25
Case study 12. United Kingdom: Developing ecosystem accounts for protected areas in England
and Scotland
This study contains a series of accounting tables for different ecosystem types situated within
protected areas. It refers to the SEEA. The technical annex of about 150 pages gives a huge amount
of detail especially on ecosystem services.
Specific information about the reporting of the condition account
Ecosystem or asset types Farmland, grassland, forest and woodland, open waters wetlands rivers, groundwater, and heathland and sparsely vegetated land, coastal ecosystems
Ecosystem extent reported Yes Ecosystem condition reported
Yes
Realm Terrestrial, inland water and marine Spatial unit for analysis Spatial unit of reporting National Condition indicators A mix of indicators (see technical annex) for Biomass/carbon,
biodiversity, soil quality, water quality (water framework directive), access and conservation status
Aggregated indicator No aggregation Classification of indicators Yes: biomass, biodiversity, soil and water quality, accessibility and
conservation status Reference levels To some extent (e.g. for indicators on the WFD or other EU directives)
Reported condition tables
The study contains tables for various assets (extent and condition) and report indicator values as
closing stocks for a given year.

SEEA EEA Revision – Expert Consultation
26

SEEA EEA Revision – Expert Consultation
27

SEEA EEA Revision – Expert Consultation
28

SEEA EEA Revision – Expert Consultation
29
Case study 13. United Kingdom: Natural capital accounts for assets managed by the public forests
estate (PFE)
This report published an account for natural assets on land managed by the public forest estate
(PFE). It does not refer to the SEEA.
Specific information about the reporting of the condition account
Ecosystem or asset types Focus on woodland but including accounting information for other asset types managed by the PFE: grassland, mountains, moors and heathland, enclosed farmland, freshwater, urban, coastal
Ecosystem extent reported Yes Ecosystem condition reported
Yes
Realm Terrestrial and freshwater Spatial unit of reporting National Condition indicators A mix of aggregated indicators (5 status classes + individual
indicators on birds, forest structure, carbon, standing stock, spatial configuration, accessibility)
Aggregated indicator Yes: for woodland and other asset types 5 status classes Classification of indicators There is a grouping of indicators but somewhat inconsistent for the
different asset types) Reference levels No but a baseline is used and some indicators which are measured
under EU legislation have reference values. How is condition reported A mix of aggregated indicators as a percentage and indicator values;
condition reported together with extent
Reported condition tables
The tables report extent and condition of ecosystem assets. Here only the condition tables are
presented. The account contains values for indicators for a reporting year relative to a baseline year.

SEEA EEA Revision – Expert Consultation
30

SEEA EEA Revision – Expert Consultation
31
Case study 14: United Kingdom: Initial ecosystem accounts for urban areas
This report is part of a series of DEFRA and ONS (Office for National Statistics) reports on accounts of
various ecosystem types in the UK. It describes the account making reference to the SEEA EEA.
Specific information about the reporting of the condition account
Ecosystem or asset types urban areas Ecosystem extent reported yes Ecosystem condition reported yes Realm terrestrial Spatial unit of reporting national Condition indicators condition of sites of special scientific interest (SSSI) sites and
number of sites awarded Green Flag status; also accessibility and proximity of green space
Aggregated indicator SSSI indicator are aggregated indicators Classification of indicators No Reference levels No (but there is a favourable and unfavourable level for the first
indicator) How is condition reported Linked to extent accounts and broken down over two condition
classes
Reported condition table
The table breaks down the extent of urban green space over two condition categories: favourable
and unfavourable.
SSSI: sites of special scientific interest

SEEA EEA Revision – Expert Consultation
32
Type B case studies: Ecosystem accounts that include relevant information
for developing condition accounts
Case study 15. Australia: Accounting for vegetation condition in the Australian landscape
This document describes a method for estimating ecosystem condition based on the modification of
vegetation. No accounting table is presented. But the method can be used to assess different
ecosystem types and to break down their extent over different degrees of modification. Although
the term “accounting” appears in the title and in the document, there’s no reference to “ecosystem
accounts” or SEEA and there are no accounting tables.
Specific information about the reporting of the condition account
Ecosystem or asset types Heathland and shrub, cropland, forest and woodland Ecosystem extent reported No Ecosystem condition reported
No
Realm Terrestrial Spatial unit for analysis Spatial unit of reporting
Condition indicators Degree of modification from natural state and non-native vegetation cover
Aggregated indicator 7 status classes of vegetation cover Classification of indicators Reference levels How is condition reported Area of different classes of vegetation status
Table 1 shows the VAST classification. The table elaborates the seven states, the diagnostic criteria used to distinguish them, and provides examples. These states can be mapped onto the landscape as vegetation condition classes where appropriate input data and information satisfy the required diagnostic criteria.

SEEA EEA Revision – Expert Consultation
33
Case study 16. Australia: Environmental-Economic Accounting for ACT State of the Environment
Reporting – Proof of Concept
This report presents accounts on land, environmental condition, biodiversity, water, air emissions,
solid waste and environmental expenditure. Chapter 3 deals with “environmental condition
accounts”, including for land and water ecosystems. It includes condition scores for a range of
indicators and categories, reported in graphs rather than condition account tables. The study refers
to SEEA.
Specific information about the reporting of the condition account
Ecosystem or asset types Land and water Ecosystem extent reported Yes, land accounts are reported Ecosystem condition reported
Yes
Realm Terrestrial, Inland water Spatial unit of assessment Water: river reaches
Spatial unit of reporting Land: Subnational (Australian Capital Territory, ACT) Water: three catchment areas within the ACT
Condition indicators
Land: tree cover, soil exposure, leaf area, river inflow, inundation and carbon uptake Water: chemical composition, macro-invertebrate diversity and riparian condition of natural and managed waterways, based on the data from the Catchment Health Indicator Program (CHIP)
Aggregated indicator
Land: Environmental Condition Score (ECS). Water: The CHIP scores and the individual indicators are scored from one to five. A score of 1 signifies an ‘excellent’ condition system, 2 a ‘good’ condition, 3 a ‘fair’ condition, 4 a ‘poor’ condition and 5 is ‘degraded’.
Classification of indicators Reference levels How is condition reported In figures
The condition is not reported in accounting tables but presented in graphs.

SEEA EEA Revision – Expert Consultation
34
Figure 3 Environmental Condition Score for the Australian Capital Territory
Figure 6 Catchment Health Indicator Program Scores aggregated for select rivers across the ACT

SEEA EEA Revision – Expert Consultation
35
Case study 17. European Union. Developing Ecosystem Condition Accounts for the EU and Member
States
This report presents bird accounts based on the reporting under Art.12 of the EU Birds Directive and species accounts based on the reporting under Art.17 of the EU Habitats Directive. The accounts are not directly usable as condition accounts but should be used a species accounts.
Specific information about the reporting of the condition account
Ecosystem or asset types MAES typology for ecosystems for the EU with 7 terrestrial types, 1 freshwater and 4 marine
Ecosystem extent reported No Ecosystem condition reported
No, instead species accounts are published
Realm Terrestrial, Inland water, Marine Spatial unit of reporting Biogeographical regions of the EU Condition indicators No
Aggregated indicator Yes, species conservation status and bird conservation status which are aggregated indicators based on several sub assessments
Classification of indicators No Reference levels No
How is condition reported The number of species assessments over three conservation status classes
Table 6 is an extract of an account with the number of assessments of conservation status per
bioregion and per ecosystem type. Table 8 is a species abundance account using all bird species
records for which population estimates meet certain criteria.

SEEA EEA Revision – Expert Consultation
36

SEEA EEA Revision – Expert Consultation
37
Case study 18. South Africa: Land and ecosystem accounting in KwaZulu‐Natal
The focus of this report is on presenting land accounts but the tables contain information about the
extent of each reported area (biome, vegetation type, municipality) under natural or degraded state,
which could form the basis for a condition account. The study refers to the SEEA.
Specific information about the reporting of the condition account
Ecosystem or asset types Vegetation types, biomes Ecosystem extent reported Yes Ecosystem condition reported
Yes
Realm Terrestrial Spatial unit for analysis 1 hectare grid Spatial unit of reporting Sub-national Condition indicators Aggregated indicator A proposal for an indicator with three levels based on degree of
modification from natural state Classification of indicators Reference levels Yes (the natural state) How is condition reported Reported together with the extent account under different levels of
condition (natural state versus degraded); assessment based on land cover and land use. Not reported as an explicit ecosystem condition account.
Reported table (example)
In Table 17 we show a breakdown of land cover change within a few vegetation types in KZN.

SEEA EEA Revision – Expert Consultation
38
Case study 19. Uganda: Experimental Ecosystem Accounts
This report presents extent and biodiversity accounts. The extent accounts includes some information on condition (linked to degree of modification from natural based on land cover classes), which could be used as a starting point for a condition account. The study refers to the SEEA
Specific information about the reporting of the condition account
Ecosystem or asset types Grassland, Forest and woodland, and wetland Ecosystem extent reported Yes Ecosystem condition reported No Realm Terrestrial Spatial unit for analysis Spatial unit of reporting National Condition indicators Species richness and biodiversity values are used for species
accounts Aggregated indicator Red list index (for species accounts) Classification of indicators Reference levels How is condition reported Indicator values (number of species and red list index); not
linked to the extent account

SEEA EEA Revision – Expert Consultation
39
Case study 20. United Kingdom: UK natural capital: developing UK mountain, moorland and
heathland ecosystem accounts
This article scopes the development of ecosystem accounts for mountains, moorlands and
heathlands and discusses several methodological challenges arising from the unique characteristics
of these habitats. The document contains an extent account but no condition account. Yet, the
scoping paper provides relevant information for developing condition accounts. A set of indicators
for condition is proposed with a rationale as to why to include them. The article refers to the SEEA
EEA.
Specific information about the reporting of the condition account
Ecosystem or asset types Mountains, moorlands and heathlands Ecosystem extent reported Yes Ecosystem condition reported No Realm Terrestrial Spatial unit for analysis Spatial unit of reporting National Condition indicators Carbon content, Soil ammonia and nitrogen levels, Specialist
bird populations, Mammal populations, Species richness scores, Invertebrates:, Sites of Special Scientific Interest (SSSI) and Areas of Special Scientific Interest, (ASSI) condition status, Wildfire, Managed burning, Water quality, Proximity of human habitation to MMH habitat, Length of National Trails, Volume of sheep grazing, Volume of air pollutants
Aggregated indicator Classification of indicators Seven dimensions of quality for which condition can be
indicated. The dimensions are as follows: relevant volume estimates, biodiversity indicators, soil indicators, ecological condition indicators, spatial configuration, access, management practises, Managed burning
Reference levels NA How is condition reported NA

SEEA EEA Revision – Expert Consultation
40
Case study 21. United Kingdom: UK natural capital: developing semi-natural grassland ecosystem
accounts
This article scopes the development of ecosystem accounts for semi-natural grasslands and
discusses several methodological challenges arising from the unique characteristics of these
habitats. The document contains no final accounting tables. Yet, the scoping paper provides relevant
information for developing condition accounts. A set of indicators for condition is proposed with a
rationale as to why to include them. The proposed indicators are also connected to key ecosystem
services. For most of the proposed data no or limited data is available. The article refers to the SEEA
EEA.
Specific information about the reporting of the condition account
Ecosystem or asset types Semi-natural grasslands (acid grassland, neutral grassland, calcareous grassland, purple moor grass and rush pasture)
Ecosystem extent reported No (but different data sources and statistics about extent are reported)
Ecosystem condition reported No Realm Terrestrial Spatial unit for analysis Spatial unit of reporting National Condition indicators Plant species richness, Characteristic species, Invertebrate
abundancy, Cutting and grazing, Sites of Special Scientific Interest, and Areas of Special Scientific Interest, Grazing intensity, Air quality, Naturalness of water levels, Proximity to insect pollinated crops, Fragmentation, Access
Aggregated indicator Classification of indicators Soil indicators
Biodiversity indicators Management Indicators Ecological Condition Indicators Spatial Configuration Indicators
Reference levels NA How is condition reported NA

SEEA EEA Revision – Expert Consultation
41
Case study 22. United Kingdom: Scoping UK coastal margin ecosystem accounts
This article scopes the development of ecosystem accounts for coastal margins. The document
contains no final accounting tables. Extent is estimated based on a number of studies and
predictions up till 2060. The scoping paper also proposes a set of indicators for developing the
condition account. The article refers to the SEEA EEA.
Specific information about the reporting of the condition account
Ecosystem or asset types Sand dunes, shingle, machair, salt marches, coastal lagoons and seacliffs
Ecosystem extent reported No (but different data sources and statistics about extent are reported)
Ecosystem condition reported No Realm Terrestrial Spatial unit for analysis Spatial unit of reporting National Condition indicators Carbon stock in the soil, different biodiversity indicators,
Designated areas, SSSI condition status, Blue flag status, Compliance with the Bathing Water Directive, Good status under the EU water framework directive, Access to coastal margins
Aggregated indicator Classification of indicators Soil
Biodiversity Conservation status Water Access
Reference levels NA How is condition reported NA

SEEA EEA Revision – Expert Consultation
42
Case study 23. United Kingdom: Scoping UK coastal margin ecosystem accounts This note scopes the development of a peatland account within the developing UK environmental
accounts. Peatland is defined as the presence of deep peat soils according to national definitions, i.e.
organic soils of at least a minimal depth. The note cites the SEEA.
Specific information about the reporting of the condition account
Ecosystem or asset types Peatland Ecosystem extent reported No Ecosystem condition reported No Realm Terrestrial Spatial unit for analysis Spatial unit of reporting National Condition indicators NA Aggregated indicator The note proposes a list of potential condition categories based
on specific land cover (going from near natural to modified, presence of woodland, fens and cropland) assessed together with pressures on peatland and management practices in order to infer condition.
Classification of indicators Reference levels NA How is condition reported NA