seed (system energy efficiency display) -...
TRANSCRIPT

Presented by
SEED (System Energy Efficiency Display) -Energy Efficiency Monitor for a coal fired power station
Diwakar Kaushik, AGM(ERP), NTPC Ltd., NOIDARaj Pal Singh, AGM(ERP), NTPC Ltd., NOIDADated: 09.10.2014, Mumbai
AGENDA
About NTPC
PI System implementation in NTPC
Business Challenge
Solution - SEED (System Energy Efficiency
Display)
OSISoft Products employed
SEED – Results / Benefits
Future Roadmap
Conclusion

NTPC Contributes More Than One-fourth of India’s Total Power Generation with Less Than One-fifth Capacity
Installed Capacity – MW (as on 31.03.14)
Generation - BU (Year 2013-14)
NTPC Power Share
243029
43108
AllIndiaNTPC
966
248
AllIndiaNTPC
17.7% 25.7%

4
About NTPCSet up in 1975 with 100% Government Ownership
Awarded “MahaRatna” Status in May 2010
Target of 1,28,000 MW capacity by 2032
Only PSU among the top 35 companies, ranked 6th in the prestigious study of The Economic Times and Great Place to Work Institute'' for 2013
No.1 Independent Power Producer globally in 2013 in top250 Global Energy Companies’ list by Platts
5
2675 MW of new commercial
capacity addition
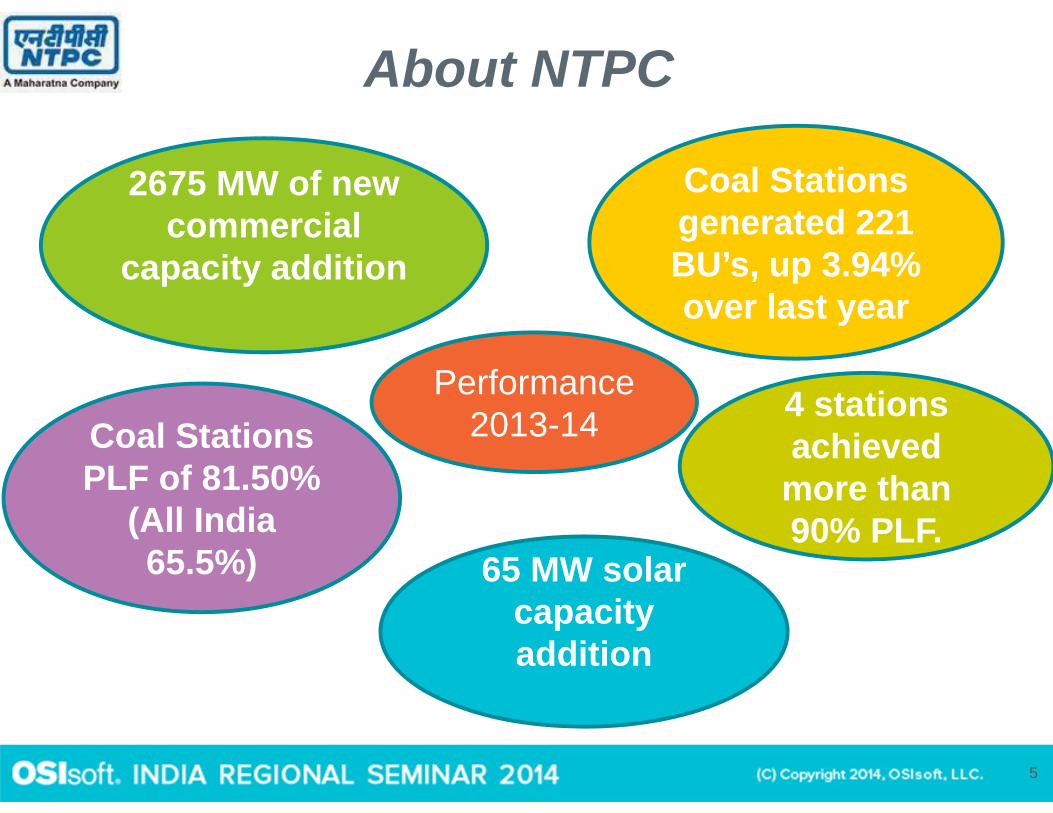
About NTPC
Performance 2013-14Coal Stations
PLF of 81.50% (All India 65.5%)
Coal Stations generated 221 BU’s, up 3.94% over last year
4 stations achieved more than 90% PLF.
65 MW solar capacity addition

6
NTPC – PAN INDIA PRESENCE
Type of Plant
Count
Coal based 16 (33015 MW)
Gas / Liquid Fuel based
07 (4017 MW)
Renewables 07 (95 MW)
JV’s (Coal & Gas)
08 (6001 MW)

PI System Implementation
PI System implemented in NTPC at
17 Coal stations (latest Barh) 7 Gas stations Corporate office
Note: PI Server-2012 installed at last two stations of Mouda & Barh.
Business Challenge• Auxiliaries Energy Consumption
Amount of energy consumed by auxiliaryequipments in a power stationIncreased auxiliaries energy consumptionreduces the Energy sent out to theconsumers & hence the accrued revenues.
Auxiliaries Energy Consumption requiresclose monitoring
8

Business Challenge
Auxiliary Energy Consumption Monitoring Requirements
• Monitoring electrical power vis-a-vis itsprocess contribution
• Intra-unit & inter-unit, system wisecomparison
• Trending over a period• Early Identification of less efficient
equipments for remedial action.
9

Problem Background• OLEMS (On Line Energy Management System)had been in use for monitoring power plantauxiliaries energy consumption using energymeters measuring KW, Current, Voltage and p.f.
• Meters connected to OLEMS server for displayand archiving
However ..•OLEMS provides only KW data (no process data)
•Data is available only at 2 or 3 places in the station
Challenges Envisaged • Integration of OLEMS data with Process data
already available at PI server
• Identification of systems for energy monitorbased on availability of KW and process data
• Deciding indices to monitor auxiliary energyconsumption & its configuration in the PISystem
• Providing the required information to the usersin desired formats

SEED – Steps Followed• Ensured OLEMS System OPC Compliance &connected to PI server
• Systems identified for covering under SEEDsuch as Draft system, Milling System,Condensate, ESP etc.
• SEC & ECI chosen indices to monitor energyefficiency
• PI Tags required for SEED created in the stationPI Server using PI Performance Equations
System Energy Efficiency Display (SEED)
An Energy Consumption Monitoring system for power plant auxiliaries using PI server
Integration of Data available on PI server 1. Process Parameter from DAS/DDCMIS2. Electrical data from OPC compliant OLEMS
The Solution

Specific Energy Consumption (SEC) Kw/Ton
Energy Consumption, KwhFlow , TPH
Energy Consumption Index (ECI) Kw/MW
Energy Consumption, KwhGeneration in MWh
SEED – Indices Used
SEED OUTPUT
• SEED Process Book Displays withvalues & trends for auxiliary energyefficiency analysis.
• SEED Process Book Displaysavailability at Station / RHQ / OS LAN
• Regular Review of SEED Indices atStations for identifying actionable points.

SEED SCREENSHOTS
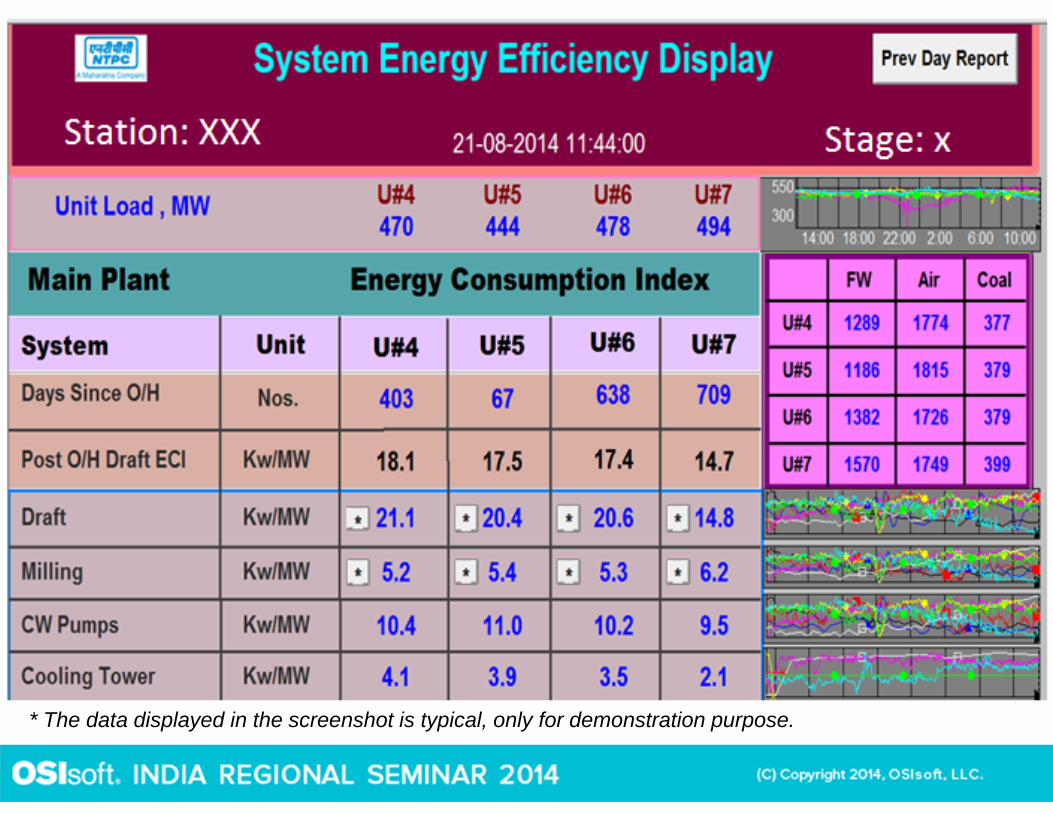
* The data displayed in the screenshot is typical, only for demonstration purpose.

* The data displayed in the screenshot is typical, only for demonstration purpose.

* The data displayed in the screenshot is typical, only for demonstration purpose.

* The data displayed in the screenshot is typical, only for demonstration purpose.

* The data displayed in the screenshot is typical, only for demonstration purpose.

22
• PI Server
• PI Performance Equations
• PI Process Book
• PI Data Link
•PI System Management Tools (PISMT)
•PI Tag Configurator
OSISoft Products Used
23
• Improved operator awareness of criticalplant auxiliaries energy efficiency
• Allows operators to make system wiseintra-unit & inter-unit energy efficiencycomparisons
• Helps operator to decide most efficientcombination of auxiliaries in the system
• Integration of process data with OLEMSdata for MIS & other applications
SEED Results / Benefits

24
• Incorporating more systems forSEED analysis.
• Improving availability & reliability ofSEED information
• Creation of Region / Company levelSEED displays for reviews at HQ
• Completing SEED roll out at allNTPC stations
SEED Future Roadmap
25
• Real time process monitoring & decisionmaking is the need of the hour in view ofthe stricter commercial regulations
• Information availability to the operators tofacilitate quick operational decisionspromoting energy efficiency
• Increasing comfort level of operators inusing PI System based applications &hence the demand for newer applications
Conclusion

26
Summary
Helps operator tocorrectly identifyauxiliaries consumingmore energy & decideoptimum combination ofauxiliaries in the system
SEED – System Energy Efficiency Display
Real time Monitoringof auxiliaries energyconsumption vis-a-visits contribution to theprocess
An Energy ConsumptionMonitoring system forpower plant auxiliariesusing PI serverintegrating Data availableon PI server
• Higher auxiliaries energyconsumption directly impactsthe power plant revenues,hence real time relevant inputto the operators facilitatesquick decisions promotingenergy efficiency
Solution Results and BenefitsBusiness Challenge
Contact Information
Diwakar Kaushik,AGM(ERP), NTPC [email protected] Pal Singh,AGM(ERP), NTPC [email protected]
27

Brought to you by
THANKYOU
28