seeing is predicting: water clarity-based nowcast models
TRANSCRIPT

Global Journal of Health Science; Vol. 11, No. 3; 2019 ISSN 1916-9736 E-ISSN 1916-9744
Published by Canadian Center of Science and Education
140
Seeing is Predicting: Water Clarity-Based Nowcast Models for E. coli Prediction in Surface Water
Christopher A. Dada1 1 Streamlined Environmental Ltd, 510 Grey Street, Hamilton, Hamilton East, New Zealand Correspondence: Dr Christopher A. Dada, Streamlined Environmental Ltd, 510 Grey Street, Hamilton, PO Box 7003, Hamilton East, 3247, New Zealand. E-mail: [email protected] Received: November 20, 2018 Accepted: February 3, 2019 Online Published: February 28, 2019 doi:10.5539/gjhs.v11n3p140 URL: https://doi.org/10.5539/gjhs.v11n3p140 Abstract Given the 24–48 h turn-around time of conventional surveillance approaches, methods are needed that improve the timeliness and accuracy of recreational water quality risk assessments. Although one useful approach is to combine existing monitoring programmes with predictive faecal indicator bacteria (FIB) models, these models are largely ‘top-down’ in their approach to safeguarding public health. Beyond being simply ‘advised when to avoid swimming’, there is an increasing awareness amongst the general public regarding the role they can play in water quality monitoring. Using quantile, maximum value and optimized incremental modelling approaches, this study reports on the possibility of developing intuitive, public-friendly models that are based on the physical appearance of water (clarity), to estimate 8103 nation-wide E. coli concentrations in rivers, and to assess whether water is safe to swim in. If swimmers were to avoid river waters with <1.1 m black disc visibility during autumn and summer, and river waters with values <0.5 m black disc visibility during spring and winter, they would also avoid microbial hazards that are associated with exceedances of the 540 CFU/100 mL single sample bathing water standard. Regardless of the climatic season, stream order classification, catchment land cover or geology of streams considered, the clarity-based E. coli models performed well as they presented with sensitivity, specificity and accuracy values of at least 72%. The developed models offer the benefit of providing a faster method for estimating E. coli concentration, potentially engaging the public in water monitoring, and allowing them to make informed decisions on whether it is safe to swim. Keywords: faecal indicator bacteria, water clarity, predictive model, water quality, public health 1. Introduction Surface waters are prone to contamination from various point and nonpoint sources and can therefore serve as a vehicle for transmission of potentially pathogenic bacteria (Dada & Hamilton, 2016; Devane, Gilpin, & Moriarty, 2015; Praveena et al., 2018). Consequently, beach monitoring programmes have been adopted and implemented in many nations to protect beachgoers from health risks caused by potentially harmful bacteria. In New Zealand, policies such as the National Policy Statement on Freshwater (NPS, 2014) provide guidelines for regulators to ensure that monitoring programs are in place to warn the public about the risk of exposure to these pathogens during recreational contact. Current risk assessment is based on microbiological culturing of Escherichia coli, and results are thus used to inform the issuance of swimming advisories to reduce the risks of exposure to potentially pathogenic bacteria at recreational sites. However, given the 24–48 h turn-around time before swimming advisories are released, advisories issued to protect public health effectively only indicate ‘it may be unsafe to swim yesterday’. Thus, while dissemination of accurate and timely information is critical to preventing illness, water quality advisories often do not present accurate assessments of such risk in a timely manner. Predictive modelling for faecal indicator bacteria (FIB) concentrations can complement the current culture-based monitoring approach to recreational water risk assessment. Predictive FIB models provide a rapid estimation of the bacteriological condition, potentially assisting local beach managers in the decision process related to the issue of swimming advisories. In recent years, many beach managers have increasingly adopted predictive tools, of which the most widely applied are models developed through multi-variable linear regression (e.g., Olyphant, 2005; Nevers & Whitman, 2005; Feng et al., 2015). Process-based models, which couple hydrodynamic models with a microbe transport-fate model involving microbial loading, transport, and fate processes, have also been demonstrated to make predictions (e.g., Sanders et al., 2005; Hipsey et al., 2008; Feng et al., 2013, 2015; Thupaki

gjhs.ccsenet.org Global Journal of Health Science Vol. 11, No. 3; 2019
141
et al., 2013). While these predictive faecal indicator bacteria (FIB) models have been used to estimate bacteriological water-quality, they have largely adopted a ‘top-down’ approach to safeguarding public health (i.e. models are run by science staff of regulatory bodies who simply advise the public when it’s safe or not safe to swim). Beyond being simply ‘advised when to avoid swimming’, there is an increasing awareness amongst the general public regarding the role they can play in water quality monitoring. This presents novel opportunities for citizen participation in predictive FIB modeling. This study presents a classic example of developing intuitive, ‘public-friendly’ and ‘public-usable’ models, using the physical appearance of water (as measured by water clarity) as a way of estimating E. coli concentrations in surface water, to assess whether water is safe to swim in. The goal of this study was to evaluate the possibility of using clarity models for E. coli nowcast prediction, at both a local and national scale throughout New Zealand. This will constitute a milestone in efforts geared towards developing and deploying site-specific river clarity-based E. coli models at local scales for nowcast prediction of E. coli concentrations at popular recreational sites in New Zealand and other nations worldwide. 2. Methods 2.1 Study Sites A total of 145,040 water quality datasets, which have been routinely collected by regional authorities from as early as the late 1980s for most New Zealand rivers and tributaries (https://data.mfe.govt.nz/), was used in the analysis. These datasets contained measured values for several parameters including ammoniacal nitrogen, total nitrogen, nitrate-nitrogen, dissolved reactive phosphorus, total phosphorus, and E.coli. All E.coli datasets were extracted (n=8170). Of these, a total of 8103 E.coli datasets that had corresponding discharge data were subsequently used for the analysis. E.coli data used thus spanned the period 2005 to 2013 at a total of 77 freshwater swimming sites representing 49 rivers and tributaries throughout New Zealand. The frequency of sampling varied across the sites represented in the dataset from fortnightly to quarterly. While constraints and objectives associated with the design of regional sampling programs tend to influence variability in the geographical coverage of the sites in the database (as noted in McDowell et al., 2017) (Figure 1), we consider that the sites in our dataset adequately represent river sites nationally. Climatological, geological and land use characteristics for the sites are as described in the NZ River Environment Classification scheme (McDowell et al 2017). 2.2 Determination of E. coli and Water Clarity As part of the national bathing site E. coli surveillance program, water samples from New Zealand rivers and tributaries are collected during recreational seasons and low flow months, particularly between October and March of every year (Davies-Colley, 1988). Microbiological water quality analyses are completed using the membrane filtration method (EPA, 2002) for E. coli. Counts are recorded as colony forming units (CFU/100 mL) and entered into spreadsheets. At these sites, water clarity is typically measured using a black disc which is placed in the water and viewed through an underwater viewing box at increasing distances until the black disc disappears from sight (Davies–Colley, 1988). 2.3 Data Management, Statistical Analysis, and Modeling E. coli concentrations rarely fit into a normal distribution. Hence, they were log transformed before any exploratory data analysis was done to achieve normality (following Francy et al., 2013). Data applied were split in a ratio 2:1 between model development and validation (Gramatica, 2007). To fit the 8103 E. coli datasets based on their clarity, three approaches were used (as schematically represented in Figure 2).
i. Quantile approach: A classification scheme was applied that resolved the water clarity datasets into quantiles. To achieve this, quartiles were determined on the basis of stream order. Hence, quartile classes specific to each stream order were applied. Water clarity values less than the first, second, third and fourth quartiles were designated as Q1, Q2, Q3 and Q4, while water clarity values higher than the fourth quartile were designated as Q5.
ii. Maximum value approach: The maximum observed log E. coli concentrations per unique water clarity values were fitted using a linear regression model. This produced specific equations that predicted E. coli concentrations using water clarity values.
iii. Gradient/incremental approach: Incremental ‘trigger’ values or water clarity ‘thresholds’ (i.e. from lowest to highest) were applied as ‘thresholds’ to predict exceedances and non-exceedances of the national bathing water standard. These triggers or thresholds are water clarity values that would warrant additional site-based investigation, as they are indicative of

gjhs.ccsenet.org Global Journal of Health Science Vol. 11, No. 3; 2019
142
conditions of elevated faecal indicator bacteria levels higher than the national bathing water standard of 540 CFU/100mL.
Figure 1. 77 New Zealand freshwater swimming sites (49 rivers and tributaries) in the E.coli predictive modeling
using water clarity as a predictor variable
2.4 Model Performance and Swimming Advisory Assessment Exceedances of bathing water thresholds applied in this study were compared against national and international guidelines. An exceedance (or a positive model outcome) was recorded when sampled or predicted E. coli levels exceeded the bathing water standard (BWS) of 235 CFU/100 mL (USEPA guidelines), or 260 and 540 CFU/100 mL (as stipulated in the New Zealand National Policy Statement for Freshwater Management) (NPS, 2014). A type I error (or a false positive outcome) was identified when the modelled E. coli level was above the thresholds, but the observed E. coli level was below the thresholds. When the modelled and observed E. coli levels were both above the thresholds, this was considered a true positive. On the other hand, a false negative result (type II error) was inferred when the modeled E. coli level was less than the thresholds but the observed E. coli level was higher. In such a case, potential microbial contamination would be undetected by the model and no swimming advisory would be issued. When the modeled and observed E. coli levels are both below the thresholds, this is identified as a true negative. Model accuracy was determined in the study as the percentage of correct advisory predictions. Sensitivity and specificity are defined as the rates of correctly predicted exceedances and non-exceedances, respectively. Specificity, sensitivity, and accuracy of the model were determined using the following equations: 𝑀𝑜𝑑𝑒𝑙 𝑆𝑒𝑛𝑠𝑖𝑡𝑖𝑣𝑖𝑡𝑦 % = Number of True Positives ∗ 100Number of True Positives Number of False Negatives
𝑀𝑜𝑑𝑒𝑙 𝑆𝑝𝑒𝑐𝑖𝑓𝑖𝑐𝑖𝑡𝑦 % = Number of True Negatives ∗ 100Number of True Negatives Number of False Positives
𝑀𝑜𝑑𝑒𝑙 𝐴𝑐𝑐𝑢𝑟𝑎𝑐𝑦 % = Number of True Negatives Number of True Positives ∗ 100Total number of observations
One-way analysis of variance (ANOVA) was conducted to compare significant differences between the modelled and observational results. Additionally, the correlation coefficient, R2 (an estimate of the proportion of total variation in the data series which is explained by the model) and the residual root mean square error (RMSE) were used to measure the goodness-of-fit of the FIB models developed. The RMSE is a measure of variation of the observed E. coli concentration from its model-predicted value.

gjhs.ccsenet.org Global Journal of Health Science Vol. 11, No. 3; 2019
143
Figure 2. Methodology for Determining Water Clarity-based E. coli Predictions
gjhs.ccsenet.org Global Journal of Health Science Vol. 11, No. 3; 2019
144
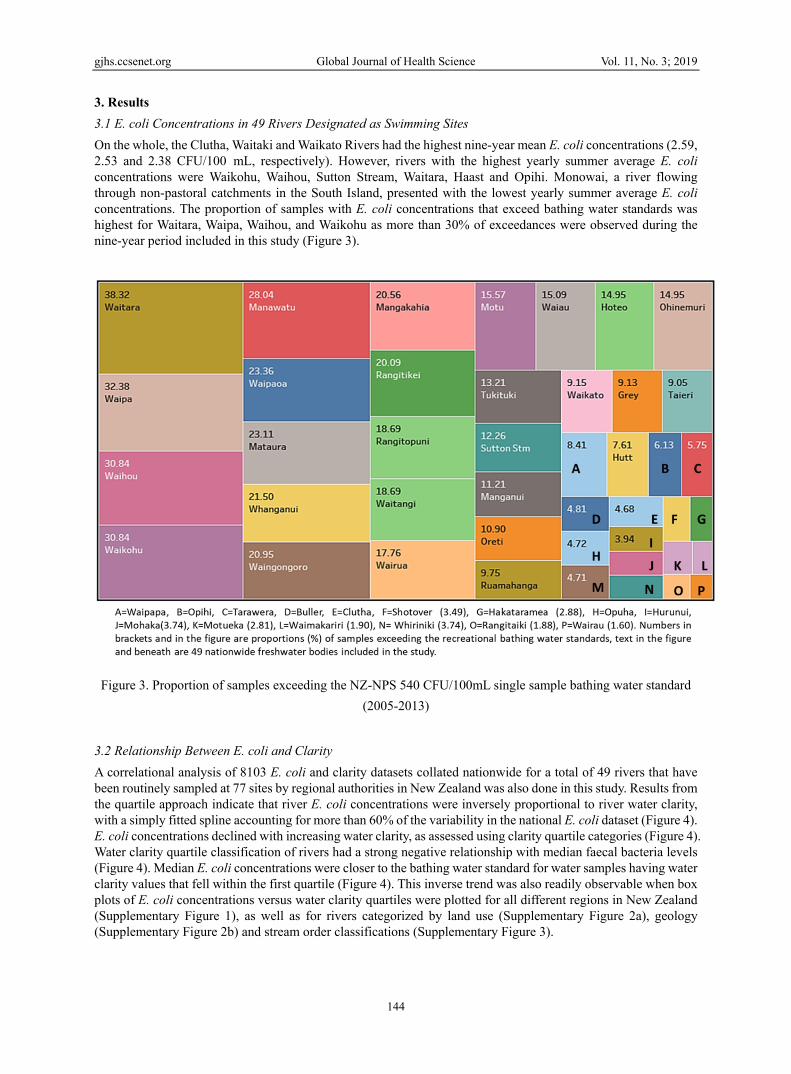
3. Results 3.1 E. coli Concentrations in 49 Rivers Designated as Swimming Sites On the whole, the Clutha, Waitaki and Waikato Rivers had the highest nine-year mean E. coli concentrations (2.59, 2.53 and 2.38 CFU/100 mL, respectively). However, rivers with the highest yearly summer average E. coli concentrations were Waikohu, Waihou, Sutton Stream, Waitara, Haast and Opihi. Monowai, a river flowing through non-pastoral catchments in the South Island, presented with the lowest yearly summer average E. coli concentrations. The proportion of samples with E. coli concentrations that exceed bathing water standards was highest for Waitara, Waipa, Waihou, and Waikohu as more than 30% of exceedances were observed during the nine-year period included in this study (Figure 3).
Figure 3. Proportion of samples exceeding the NZ-NPS 540 CFU/100mL single sample bathing water standard (2005-2013)
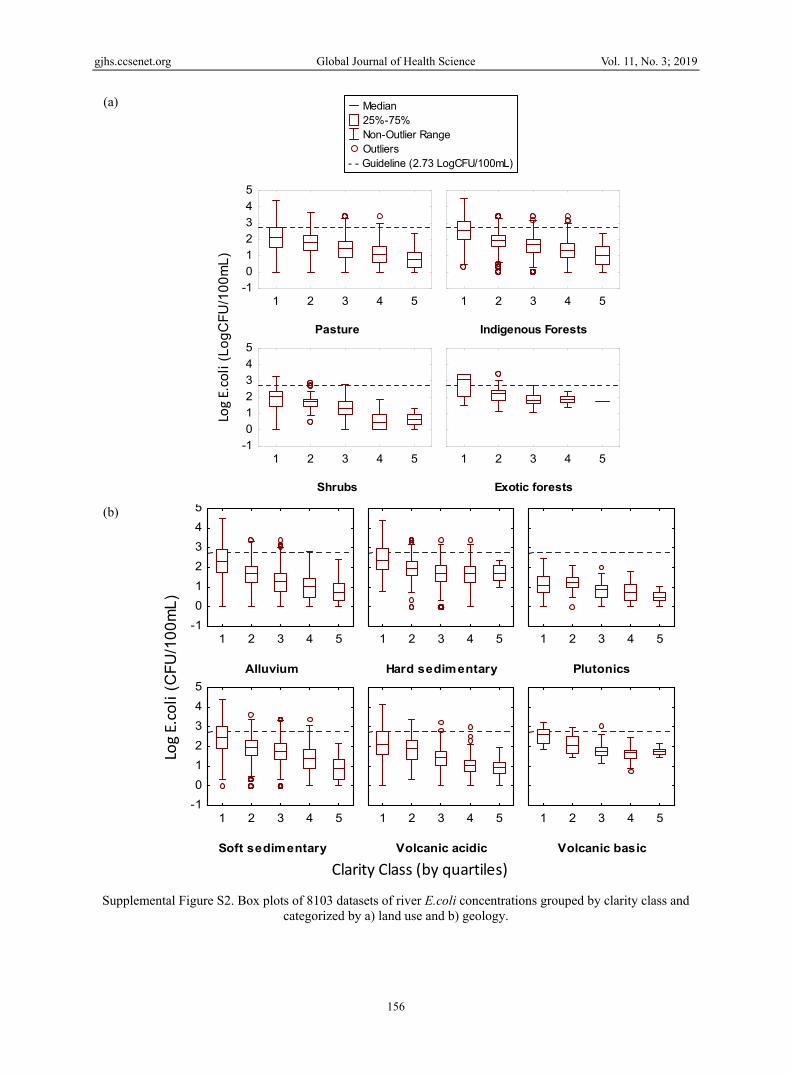
3.2 Relationship Between E. coli and Clarity A correlational analysis of 8103 E. coli and clarity datasets collated nationwide for a total of 49 rivers that have been routinely sampled at 77 sites by regional authorities in New Zealand was also done in this study. Results from the quartile approach indicate that river E. coli concentrations were inversely proportional to river water clarity, with a simply fitted spline accounting for more than 60% of the variability in the national E. coli dataset (Figure 4). E. coli concentrations declined with increasing water clarity, as assessed using clarity quartile categories (Figure 4). Water clarity quartile classification of rivers had a strong negative relationship with median faecal bacteria levels (Figure 4). Median E. coli concentrations were closer to the bathing water standard for water samples having water clarity values that fell within the first quartile (Figure 4). This inverse trend was also readily observable when box plots of E. coli concentrations versus water clarity quartiles were plotted for all different regions in New Zealand (Supplementary Figure 1), as well as for rivers categorized by land use (Supplementary Figure 2a), geology (Supplementary Figure 2b) and stream order classifications (Supplementary Figure 3).

gjhs.ccsenet.org Global Journal of Health Science Vol. 11, No. 3; 2019
145
1 2 3 4 5
Clarity Class (by quartiles)
-1
0
1
2
3
4
5
Log
E.co
li Log E.coli: F(4,8098) = 784.4945, p = 0.0000;KW-H(4,8103) = 2208.3219, p = 0.0000
Median 25%-75% Non-Outlier Range Outliers
--Guideline (2.73Log CFU/100mL)
Figure 4. Plots of 8103 E.coli concentrations versus quartile distribution of water clarity. R-squared = 0.613. Red line is the line of fit that runs across median E.coli concentrations at different water clarity quartiles
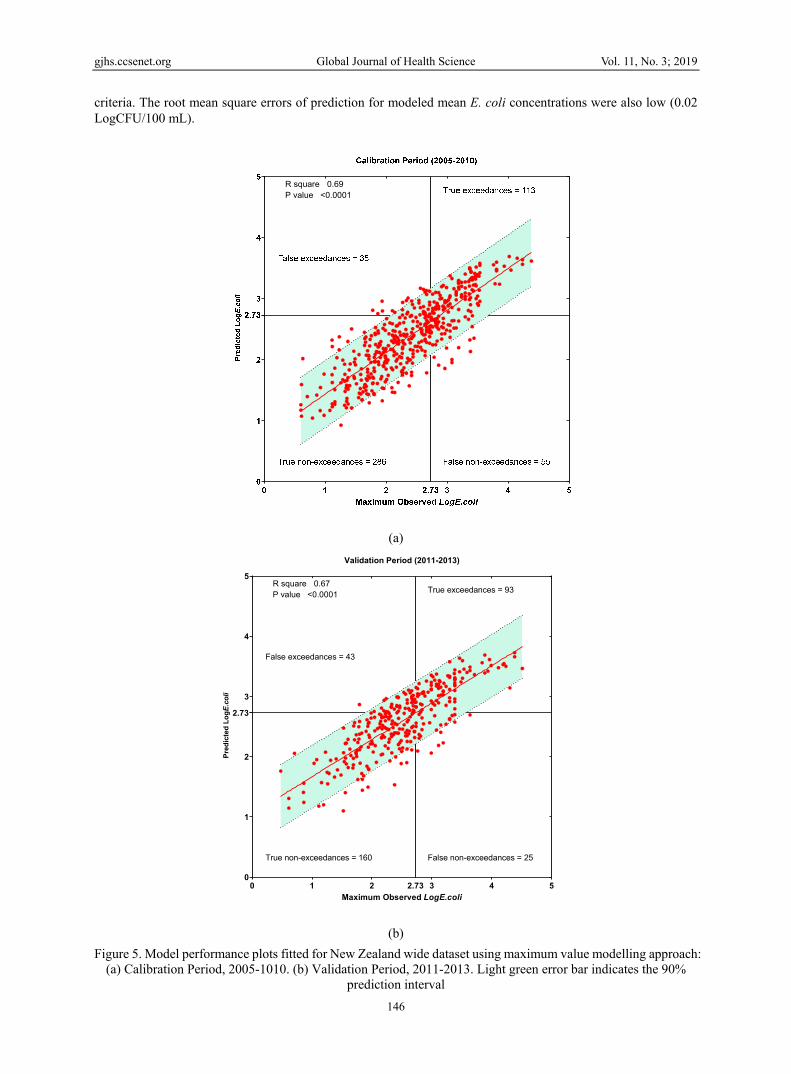
3.3 Nation-Wide Trigger Values: Application of Clarity-Based Model for Estimating E. coli Concentrations in New Zealand Rivers The applicability of water clarity-based E. coli models for use on a national scale was tested using the datasets described earlier. This was done with a view to developing a clarity-based classification scheme that could potentially identify exceedances of bathing water standards in recreational water using an easily measured indicator. This approach thus identifies trigger clarity ranges or thresholds that could initiate further investigation to confirm whether there is a problem related to faecal contamination. Using the maximum value approach stated in Section 2.3, maximum E. coli concentrations per unique water clarity value (in meters) were fitted using a regression model. Based on unique water clarity values, a predictive E. coli model was developed for rivers and tributaries in New Zealand with the equation below: Maximum Log𝐸. 𝑐𝑜𝑙𝑖 = 3.82 − 0.91 ∗ 𝑆𝑞𝑢𝑎𝑟𝑒𝑑𝑟𝑜𝑜𝑡[𝑊𝑎𝑡𝑒𝑟𝐶𝑙𝑎𝑟𝑖𝑡𝑦 𝑚 ] The water clarity-based E. coli model adequately captured the variability in E. coli data during the modeling period. Based on the obtained R-squared values, nearly 70% of the variability in maximum E. coli concentrations was explained by the model (Table 1 and Figure 5a). When model performance was assessed against the NZ NPS-FM bathing water criterion of 540 CFU/100 mL, a total of 113 out of the 168 exceedances (67%) in the calibration period were correctly predicted by the model (Figure 5a), with a sensitivity and specificity of 67 and 89%, respectively. The model was at least 81% accurate as it correctly predicted 399 exceedances and non-exceedances out of the 489 observations in the calibration period (Figure 5a). The model also performed well when validated against the E. coli concentrations measured in rivers and tributaries during the validation period, 2011-2013 (Figure 5b). For instance, the model accurately predicted more than 75% of all exceedances in the E. coli data (Table 1) when assessed against the NPS-FM and USEPA bathing water
gjhs.ccsenet.org Global Journal of Health Science Vol. 11, No. 3; 2019
146
criteria. The root mean square errors of prediction for modeled mean E. coli concentrations were also low (0.02 LogCFU/100 mL).
(a)
(b)
Figure 5. Model performance plots fitted for New Zealand wide dataset using maximum value modelling approach: (a) Calibration Period, 2005-1010. (b) Validation Period, 2011-2013. Light green error bar indicates the 90%
prediction interval
R square 0.69 P value <0.0001
0 1 2 3 4 50
1
2
3
4
5
Validation Period (2011-2013)
Maximum Observed LogE.coli
Pred
icte
d Lo
gE.coli
R square 0.67 P value <0.0001
False non-exceedances = 25True non-exceedances = 160
True exceedances = 93
False exceedances = 43
2.73
2.73

gjhs.ccsenet.org Global Journal of Health Science Vol. 11, No. 3; 2019
147
Table 1. FIB model performance during calibration (2005-2010) and validation (2011-2013) period. Performance of the classification scheme was assessed against a BWS of 540 CFU/100 mL, 260 CFU/100 mL, and 235 CFU/100 mL, respectively as in the New Zealand National Policy Statement on Freshwater Management and the USEPA guidelines
Model Statistics Calibration Period (2005-2010) Validation Period (2011-2013
NPS-540 NPS-260 USEPA-235 NFP-540 NPS-260 USEPA-235
Sensitivity (%) 67.26 82.86 82.94 78.81 85.41 87.37
Specificity (%) 89.10 84.02 79.75 78.82 62.50 60.31
Accuracy (%) 81.60 83.44 81.39 78.82 75.70 76.32
RMSE (LogCFU/100mL) 0.02 0.02 0.02 0.02 0.02 0.02
R Squared 0.69 0.69 0.69 0.67 0.67 0.67
Pearson Correlation 0.83 0.83 0.83 0.82 0.82 0.82
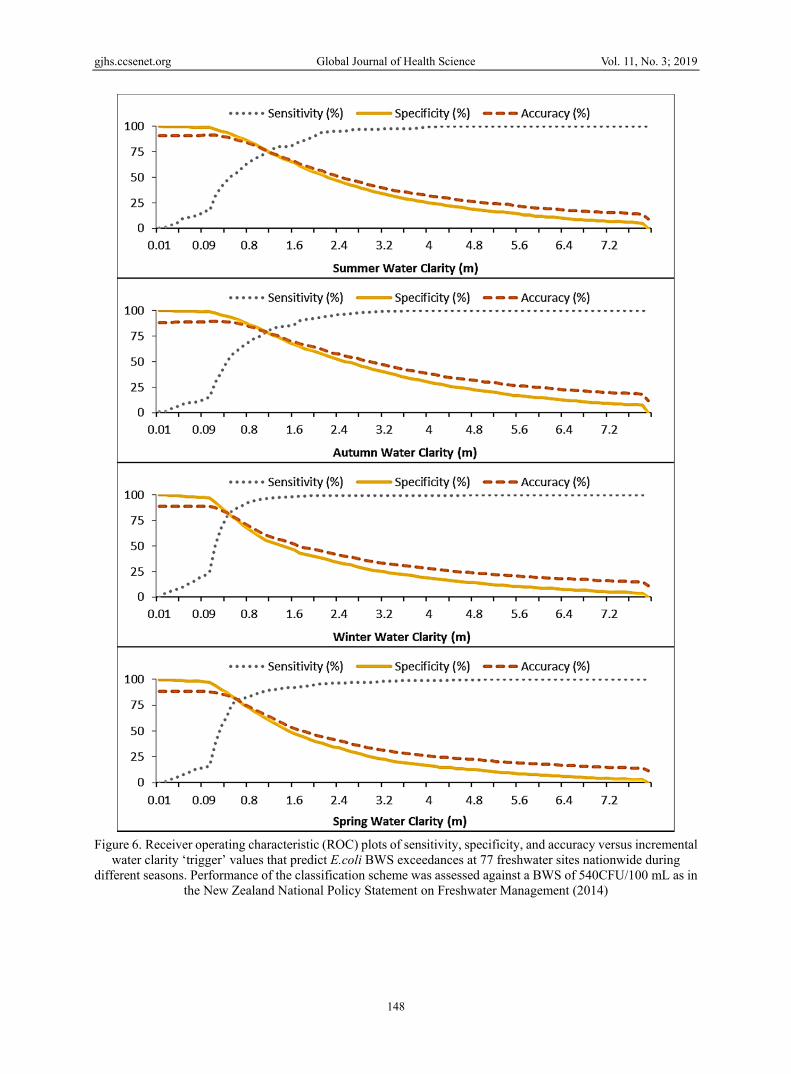
Figure 6 presents the receiver operating characteristic (ROC) curve of sensitivity, specificity and accuracy obtained when incremental water clarity ‘thresholds’ were applied to predict exceedances and non-exceedances of 8103 E. coli datasets, against a national bathing water standard of 540 CFU/100 mL, for each season. Table 2 summarizes the model performance data. With increasing water clarity ‘trigger value’, the sensitivity of the model increases: there is an increase in the proportion of correctly predicted true exceedances but a concomitant reduction in the specificity of the model; i.e. decreases in the proportion of correctly predicted BWS non-exceedances. A plot of sensitivity and specificity versus potential trigger values quite easily delineated a crossover value. This crossover value is the optimum decision threshold where the maximum number of exceedances are correctly identified and is a reasonable trade-off between sensitivity, specificity, and accuracy (Arad, Housh, Perelman, & Ostfeld, 2013). Regardless of the season considered, the E. coli clarity models performed well as they presented with at least 75% sensitivity, specificity and accuracy at the crossover value (Figure 6, Table 2). During summer and autumn, the crossover (trigger) value was observed to be 1.1m (Figure 6); i.e. on a nation-wide scale, there is a high likelihood that elevated levels of faecal indicator bacteria, above the E. coli BWS, would be present in rivers when the stream or river water clarity was lower than 1.1m. At this trigger value, 324 out of the 423 total E. coli BWS exceedances observed in the summers and autumns of the 9-year period were correctly predicted (i.e. 133 +191, see Table 2). During winter and spring, the crossover (trigger) value was observed to be lower; 0.5m and 0.6m respectively (Figure 6), i.e. on a nation-wide scale, during these seasons, there is a high likelihood that elevated levels of faecal indicator bacteria, above the E. coli BWS, would be present in rivers when the stream or river water clarity is lower than 0.6m. At this trigger value, at least 383 out of the 465 exceedances observed in the winters and springs over the 9-year period were correctly predicted (i.e. 195+198, see Table 2). This trigger value also correctly predicted a high proportion of the non-exceedances observed in the winters and springs of the 9-year period, with a minimum specificity of 79% (Table 2). Regardless of the scenario of river catchment land use, geology, and stream order classifications considered in this study, the E. coli clarity models performed well as they presented with sensitivity, specificity and accuracy that ranged between 72.82% and 100% (Table 2). On the whole, these results show that if swimmers were to avoid river waters with <1.1 m black disc visibility during summer and autumn or river waters with <0.5m black disc visibility during spring and winter, they would also avoid microbial hazards that are associated with exceedances of the 540 CFU/100 mL single sample bathing water standard (Table 2).
gjhs.ccsenet.org Global Journal of Health Science Vol. 11, No. 3; 2019
148
Figure 6. Receiver operating characteristic (ROC) plots of sensitivity, specificity, and accuracy versus incremental
water clarity ‘trigger’ values that predict E.coli BWS exceedances at 77 freshwater sites nationwide during different seasons. Performance of the classification scheme was assessed against a BWS of 540CFU/100 mL as in
the New Zealand National Policy Statement on Freshwater Management (2014)

gjhs.ccsenet.org Global Journal of Health Science Vol. 11, No. 3; 2019
149
Table 2. Model performance of seasonal water clarity trigger values used to fit exceedances and non-exceedances of E.coli data Land cover
EF P S IF
Trigger Value (m) 1.1 0.9 1 0.7
True Exceedances of BWS 11 296 7 380
Total number of exceedances 11 391 9 476
Total number of observations 106 4306 207 3484
Sensitivity (%) 100 75.7 77.78 79.83
Specificity (%) 90.53 72.82 78.79 80.55
Accuracy (%) 91.51 73.08 78.74 80.45
Season
Summer Autumn Winter Spring All seasons
Trigger Value (m) 1.1 1.1 0.5 0.6 0.8
True Exceedances of BWS 133 191 195 188 698
Total number of exceedances 181 242 231 234 887
Total number of observations 1952 2064 2043 2044 8103
Sensitivity (%) 73.48 78.93 84.42 80.34 78.69
Specificity (%) 76.76 79.36 79.08 80.22 77.63
Accuracy (%) 76.46 79.31 79.69 80.23 77.75
Stream order
1 2 3 4 5 6
Trigger Value (m) 0.6 0.6 1 0.7 0.6 0.8
True Exceedances of BWS 25 100 174 241 118 31
Total number of exceedances 32 133 230 301 154 37
Total number of observations 526 839 2518 2428 1266 526
Sensitivity (%) 78.13 75.19 75.65 80.07 76.62 83.78
Specificity (%) 79.35 76.35 74.83 79.5 79.84 83.44
Accuracy (%) 79.28 76.16 74.9 79.57 79.45 83.46
Geology
VA SS PI HS VB AL
Trigger Value (m) 0.7 0.8 N/A 0.6 1.8 0.8
True Exceedances of BWS 75 298 0 132 5 174
Total number of exceedances 97 398 0 179 6 207
Total number of observations 950 2846 207 1372 106 2622
Sensitivity (%) 77.32 74.87 0 73.74 83.33 84.06
Specificity (%) 75.85 77.61 N/A 77.03 87 81.78
Accuracy (%) 76 77.23 N/A 76.6 86.79 81.96
EF= exotic forest, P = Pastoral, S = Scrub, IF= Indigenous forest, VA = Volcanic acidic, VB = Volcanic basic, Pl = Plutonics, HS = Hard sedimentary, ss = Soft sedimentary, AL = Alluvium, as in McDowell et al (2017), N/A = Not applicable, since no exceedances were observed for streams and rivers with plutonic geology throughout the entire 9-year modelling period. Trigger values were obtained from cross over plots for each scenario of river land use type, season, stream order and geology. Performance of the classification scheme was assessed against a single sample BWS of 540 CFU/100 mL as in the New Zealand National Policy Statement on Freshwater Management (NPS 2014).

gjhs.ccsenet.org Global Journal of Health Science Vol. 11, No. 3; 2019
150
4. Discussion The goal of this study was to develop predictive models, based on the visual clarity of a waterbody, which could be used by the general public, as well as by the water science staff in regulatory institutions to predict the concentrations of E. coli in rivers and tributaries before water quality tests results are ready or during days when monitoring is not conducted. One critical goal was to build the model using relatively basic numerical concepts that could be relayed to and be useable by the public. In this way, the public can make smarter, faster decisions on the bacteriological quality of water at their favourite swimming spot. In order to achieve this objective, this study focused on water clarity as a potential environmental surrogate for E. coli in the development of predictive FIB models. The use of water clarity to predict stream bacteriological water quality in our study is logical since it has been shown that this variable is strongly correlated with turbidity, which also influences water quality in a water body (Dada & Hamilton, 2016), and is related to E. coli concentration. A number of studies have previously shown strong relationships between E. coli and turbidity (Christensen, 2001; Rasmussen and Ziegler, 2003, Riverkeeper et al., 2008) and between E. coli and other variables that influence turbidity, including antecedent rainfall, suspended solids, and phosphorus nutrient enrichment. Gregory and Frick (2000) reported that faecal coliform bacteria densities in the Chattahoochee River were highest after rainstorms, when the river was turbid. Dada and Hamilton (2016) reported an increase in total phosphorus (TP) and suspended solids at some streams in New Zealand in relation to E. coli. For example, like phosphorus, faecal bacteria tend to be bound to particulate matter, and are often transported in a particle-facilitated manner (Hong et al., 2010). Also, suspended solids include a wide variety of material (such as silt, decaying plant and animal matter and wastes) (Kannel et al., 2007), which could provide attachment surfaces for bacteria, a process important for the growth and survival of organisms in the aquatic environment. With increased concentrations of suspended solids in these streams, E. coli may be able to attach to more particle surfaces by adsorption. Fries et al. (2006) reported that 34 to 42 percent of E. coli in surface-water samples were attached to particles in the water column. The presence of suspended solids in the water column increases the survival rates of E. coli by limiting the inactivating effects of sunlight (Sinton et al., 2002; Stapleton et al., 2004; Kay et al., 2005; Liu et al., 2006). Unlike turbidity or suspended solids, however, water clarity can be easily measured with very minimal training and basic equipment. Additionally, in instances where there is no equipment, a water clarity-based predictive system, when translated into specific meter measurements, could potentially help the public make fast, informed decisions on the bacteriological quality of the water they are about to wade into. For instance, regional authorities can harness historical water clarity and E. coli data to mathematically determine water clarity thresholds that tend to be mostly associated with exceedances of the bathing water standard. In this study, our results show that if swimmers were to avoid river waters with <1.1 m black disc visibility during autumn and summer or river waters with <0.5 m black disc visibility during spring and winter, they would also avoid microbial hazards that are associated with exceedances of the 540 CFU/100 mL single sample bathing water standard. These water clarity thresholds could then be used by relevant authorities to build an early warning system, which could be communicated to the public. This could result in warnings like, ‘if you cannot see your feet in ankle-deep water, don’t go swimming’ (see Figure 2). We used water clarity to calibrate and validate FIB models to predict E. coli concentrations on a nation-wide scale for all rivers in New Zealand. The E. coli model built using the maximum value approach showed high predictive power, which could account for more than 67% of the variability in the E. coli data (R2 ranged between 0.67 and 0.69 during the calibration and validation period). Based on a recent literature study, de Brauwere et al. (2014) reported that the performance (adjusted R2) of multiple linear regression models varies widely, ranging from 0.29 to 0.99, thus emphasizing their extreme case-sensitivity. The models developed in this study were also able to advise on exceedances or non-exceedances of existing BWS. Model performances, in terms of predicting whether a warning should be issued, varied among the rivers and streams considered depending on the season, land cover, geology and stream order classification. However, in most instances, the model sensitivity and specificity were higher than 70% in most scenarios of season, land cover, geology and stream order classification. The variability observed in our model performance is in agreement with the observations of Thoe et al. (2014). Also, model performances, in terms of predicting whether a warning should be issued, varied among the modelling approaches used. For instance, while model specificity, specificity and accuracy ranged from 67.26% to 89.1% for the gradient modelling approach, higher values of model specificity, specificity and accuracy (range 72.8% - 100%) were recorded for the incremental modelling approach. These results suggest that the best approach to using water clarity to predict E. coli concentrations is the incremental modeling approach, coupled with an ROC-curve

gjhs.ccsenet.org Global Journal of Health Science Vol. 11, No. 3; 2019
151
optimization to determine water clarity ‘thresholds’ that best predict exceedances of the bathing water standard. From a public health protection perspective, Thoe et al. (2014) suggested that a model ready for management applications should predict a greater percentage of beach postings (water quality warnings) than the current method, without the expense of excessive ‘false alarms’. Given this background, criteria were proposed by Thoe et al. (2014) to determine whether a model is effective for beach management. These conditions require that the selected model should have (i) sensitivity greater than 30% and (ii) specificity greater than 80%. The water clarity-based FIB models developed in this study using the incremental approach largely satisfy these criteria. Despite the performance of these models, some exceedances of the bathing water standards were still missed. This suggests that there are factors other than clarity affecting E. coli concentrations, which are not captured by the model. Notwithstanding this limitation, our model was able to accurately predict more than 75% of the exceedances and non-exceedances recorded at these sampling sites (1990-2013); hence, it is a useful tool for bacteriological water quality management. Under varying scenarios of water clarity conditions, water science managers and the public at large can make a reliable prediction of current E. coli concentrations faster than the turn-around period of currently available, conventional assay-based methods. We believe that the approach used in this study could be adapted for wide-spread use in local water bodies in New Zealand and beyond. While a number of studies globally have reported correlations of E. coli concentrations with the physical appearance of water (e.g. turbidity and water clarity), these studies are often site-specific (Collins, 2003, Dwivedi et al 2013, Francy et al 2013). It thus becomes logical to argue that strong correlations reported for one site do not necessarily mean the same is true for other rivers not covered in any given study. Besides, the characteristics of every river will differ, typically reflective of the catchments they run through. Our unique approach goes beyond exploring water clarity and E. coli concentrations at a site-specific level and covers entire national datasets, capturing multi-river considerations and differing land use, geology, river order classification and seasons. A recent article (Davies-Colley et al., 2018) published during the preparation of this paper, operates at a national level. Davies-Colley et al. (2018) described a uniform water clarity threshold across different conditions, suggesting that ‘if swimmers were to avoid river waters <1.6 m black disc visibility, they would also avoid microbial hazards about 99% of the time’. The current study advances these findings reported by Davies-Colley et al. (2018) by showing that there are differences in the ability of water clarity to predict E. coli concentrations depending on climatic seasons, land use, geology, and stream order classifications. Kelly et al. (2018) reported that swimming site geomorphology was highly associated with exceedance of regulatory standards. Similarly, Paule-Marcado et al. (2016) and Donahue et al. (2017) reported that faecal indicator bacteria exceedances were associated with land use. Our study also successfully applied receiver operating characteristic (ROC) curves to optimize the determination of water clarity ‘thresholds’ that predict exceedances of the bathing water standard (as in Figure 6). This ROC-guided crossover value is the optimum decision threshold where the maximum number of exceedances are correctly identified and is a reasonable trade-off between sensitivity, specificity, and accuracy (Arad, Housh, Perelman, & Ostfeld, 2013). The ROC approach was able to optimize the water clarity thresholds in this report, rather than applying a single uniform water clarity threshold across different seasons and land use conditions. For instance, applying a single threshold of 1.6m without the ROC optimization will predict that a stream is safe for recreation when it actually contains E. coli at concentrations above the bathing water standard (at least half of the predicted times, based on the low model specificity and accuracy of 47.7% and 52.5%, respectively (see supplementary sheet)). The findings of this research have important policy implications because site-specific considerations for water clarity-based E. coli prediction could be implemented in other parts of the country and around the world to augment conventional culture-based approaches in a way that improves the timeliness of swimming water advisories. We note however that there are potential limitations to the modelling approach in our study. For instance, in summer, 133 out of 183 exceedances of the BWS were predicted by the water clarity-based model. This suggests that there are situations when water clarity may prove to be a poor model for E. coli levels (i.e. erosion of sediments with little microbial input or clear water in urban systems despite high concentrations of microbial pollutants). Also, while our focus was to model the relationship between water clarity and faecal indicator bacteria, it does not differentiate between contributions of faecal bacteria from the sediment bed and from the watershed. There was also no delineation between free and particle-associated faecal bacteria. In the future, sediment deposition and resuspension fluxes of faecal bacteria across the sediment bed–water interface at river-specific levels could be incorporated into the model. Based on this, it would be possible to apply the model to hypothetical scenarios that can potentially evaluate the impact of varying catchment management conditions as well as settling
gjhs.ccsenet.org Global Journal of Health Science Vol. 11, No. 3; 2019
152
and resuspension conditions on E. coli concentrations observable in the water column. Another limitation to our approach is spatial variability. For instance, bacteriological water quality at designated sampling sites is thought to be representative of that particular water body. However, considerable spatial variability has been documented over scales of 10 m and more (Schang et al, 2018; Boehm et al 2009). It is thus hoped that future studies will combine E. coli and water clarity data with geographic information systems in a way that dynamically captures both spatial and temporal dimensions. A similar approach was adopted by Money et al. (2009) in a study that combined E. coli and turbidity data in a river-based space/time geostatistical framework for basin-wide assessment of faecal contamination. This can harness the power of aerial photography and satellite-based remote sensing to provide real-time aerial prediction of E. coli conditions. We note that the assessment of recreational water, depending on the location, may require consideration for other parameters apart from E. coli. These include, for instance, nuisance algae and floating trash that may contribute to the overall suitability of a water body for contact recreation. In the future, studies will emerge that attempt to aggregate a range of environmental variables other than E. coli into a single index that comprehensively assesses risk and that is understandable to the public and decision makers. The use of comprehensive contact recreation attributes rather than single E. coli-based measures have recently emerged (e.g. SafeSwim-Auckland Council, Milne et al., 2016, 2017; Lopes et al., 2018) and show potential for national and global application. 5. Conclusion In this study, a direct negative correlation between water clarity and E. coli concentrations was observed for most major rivers and tributaries in New Zealand. This correlation was used to develop predictive models that can produce estimates of E. coli concentrations rather than waiting for the 24-48-hour reporting time that conventional monitoring procedures require. Water clarity trigger values defined by the model can be used by authorities to alerts recreational users of possible high faecal bacteria values. Water clarity trigger values defined for specific bathing sites can also be incorporated into early warning systems, which could be communicated to the public. This could result in warnings like, ‘if you cannot see your feet in ankle-deep water, don’t go swimming’. The developed models can provide a faster estimation of E. coli concentrations, allowing the public to engage in water quality monitoring, and also to make informed decisions on whether it is safe to swim at their favourite swimming spot. Acknowledgments Thanks to Dr Ngaire Phillips for review comments and Dr Lars Brabyn for providing an aerial plot of sampling sites. Aspects of this study was presented (oral presentation) at the Water NZ 2018 Conference, Hamilton New Zealand. Competing Interests Statement The authors declare that there are no competing or potential conflicts of interest. References Arad, J., Housh, M., Perelman, L., & Ostfeld, A. (2013). A dynamic thresholds scheme for contaminant event
detection in water distribution systems. Water Research, 47(5), 1899-1908. https://doi.org/10.1016/j.watres.2013.01.017
Boehm, A. B., Ashbolt, N. J., Colford, J. M., Dunbar, L. E., Fleming, L. E., Gold, M. A., ... & Soller, J. A. (2009). A sea change ahead for recreational water quality criteria. Journal of Water and Health, 7(1), 9-20. https://doi.org/10.2166/wh.2009.122
Burkhardt, W., Calci, K. R., Watkins, W. D., Rippey, S. R., & Chirtel, S. J. (2000). Inactivation of indicator microorganisms in estuarine waters. Water Research, 34(8), 2207-2214. https://doi.org/10.1016/S0043-1354(99)00399-1
Christensen, V. G. (2001). Characterization of surface-water quality based on real-time monitoring and regression analysis, Quivira National Wildlife Refuge, south-central Kansas, December 1998 through June 2001: U.S. Geological Survey Water-Resources Investigations Report 01–4248, 28.
Collins, R. (2003). Relationships between streamwater E.coli concentrations and environmental factors in New Zealand. In Diffuse Pollution, 3, 170-180.
Dada, A. C., & Hamilton, D. P. (2016). Predictive Models for Determination of E.coli Concentrations at Inland Recreational Beaches. Water, Air and Soil Pollution, 227(9), 347.
Davies-Colley, R., Valois, A., & Milne, J. (2018). Faecal pollution and visual clarity in New zealand rivers:
gjhs.ccsenet.org Global Journal of Health Science Vol. 11, No. 3; 2019
153
Correlation of key variables affecting swimming suitability. Journal of Water and Health, wh2018214. https://doi.org/10.2166/wh.2018.214
de Brauwere, A., Ouattara, N. K., & Servais, P. (2014). Modeling fecal indicator bacteria concentrations in natural surface waters: a review. Critical Reviews in Environmental Science and Technology, 44, 21, 2380-2453. https://doi.org/10.1080/10643389.2013.829978
Devane, M., Gilpin, B., & Moriarty, E. (2015). Human health risks of faecal pollution from different sources: A review of the literature. Prepared for Environment Canterbury, Community & Public Health.
Donahue, A., Feng, Z., Kelly, E., Reniers, A., & Solo-Gabriele, H. M. (2017). Significance of beach geomorphology on fecal indicator bacteria levels. Marine pollution bulletin, 121(1-2), 160-167. https://doi.org/10.1016/j.marpolbul.2017.05.024
Dwivedi, D., Mohanty, B. P., & Lesikar, B. J. (2013). Estimating Escherichia coli loads in streams based on various physical, chemical, and biological factors. Water resources research, 49(5), 2896-2906. https://doi.org/10.1002/wrcr.20265
Francy, D. S., Stelzer, E. A., Duris, J. W., Brady, A. M., Harrison, J. H., Johnson, H. E., & Ware, M. W. (2013). Predictive models for Escherichia coli concentrations at inland lake beaches and relationship of model variables to pathogen detection. Applied and Environmental Microbiology, 79(5), 1676-1688. https://doi.org/10.1128/AEM.02995-12
Fries, J. S., Characklis, G. W., and Noble, R. T. (2006), Attachment of fecal indicator bacteria to particles in the Neuse River Estuary, North Carolina. Journal of Environmental Engineering, 132(10), 1338-1345. https://doi.org/10.1061/(ASCE)0733-9372(2006)132:10(1338)
Gramatica, P. (2007). Principles of QSAR models validation: internal and external. QSAR & combinatorial science, 26(5), 694-701. https://doi.org/10.1002/qsar.200610151
Gregory, M. B., & Frick, E. A. (2000). Fecal-coliform bacteria densities in streams of the Chattahoochee River National Recreation Area, Metropolitan Atlanta, Georgia, May–October 1994 and 1995: U.S. Geological Survey Water-Resources Investigations Report 00–4139, p. 8.
Kay, D., Stapleton, C., Wyer, M., McDonald, A., Crowther, J., Paul, N., Jones, K., Francis, C., Watkins, J. and Wilkinson, J. (2005). Decay of intestinal enterococci concentrations in high-energy estuarine and coastal waters: towards real-time T 90 values for modelling faecal indicators in recreational waters. Water Research, 39(4), 655-667. https://doi.org/10.1016/j.watres.2004.11.014
Kelly, E. A., Feng, Z., Gidley, M. L., Sinigalliano, C. D., Kumar, N., Donahue, A. G., ... & Solo-Gabriele, H. M. (2018). Effect of beach management policies on recreational water quality. Journal of environmental management, 212, 266-277. https://doi.org/10.1016/j.jenvman.2018.02.012
Liu, L., Phanikumar, M. S., Molloy, S. L., Whitman, R. L., Shively, D. A., Nevers, M. B., … Rose, J. B. (2006). Modeling the transport and inactivation of E.coli and enterococci in the near-shore region of Lake Michigan. Environmental Science & Technology, 40, 16, 5022-5028. https://doi.org/10.1021/es060438k
Lopes F., Davies-Colley R. Valois, A., & Scott, R. (2018). Should we swim here? An indexing approach for contact recreation on the Hutt River, Wellington. Presentation to the New Zealand Freshwater Sciences Society (NZFSS) Conference, Nelson, 10-14 December 2018.
McDowell, R. W., Cox, N., & Snelder, T. H. (2017). Assessing the Yield and Load of Contaminants with Stream Order: Would Policy Requiring Livestock to Be Fenced Out of High-Order Streams Decrease Catchment Contaminant Loads? Journal of environmental quality, 46(5), 1038-1047. https://doi.org/10.2134/jeq2017.05.0212
Milne J., & Davies-Colley R. (2016). Beyond E. coli: A more integrated assessment of 'swimmability' under the NPS-FM. Oral presentation to the New Zealand Freshwater Sciences Society (NZFSS) 'Freshwaters on the edge' Water Conference, Invercargill, 5–8 November 2016.
Milne, J.R., Madarasz-Smith, A., Davies, T. (2017) Recreational water quality monitoring and reporting in New Zealand: A discussion paper for Regional and Unitary Councils. NIWA Science and Technology Series Report No. 82.
Money, E. S., Carter, G. P., & Serre, M. L. (2009). Modern space/time geostatistics using river distances: data integration of turbidity and E. coli measurements to assess fecal contamination along the Raritan River in New Jersey. Environmental science & technology, 43(10), 3736-3742. https://doi.org/10.1021/es803236j

gjhs.ccsenet.org Global Journal of Health Science Vol. 11, No. 3; 2019
154
NPS. (2014). National Policy Statement for Freshwater Management 2014. Retrieved from www.mfe.govt.nz/publications/fresh-water/national-policy-statement-freshwater-management-2014
Paule-Mercado, M. A., Ventura, J. S., Memon, S. A., Jahng, D., Kang, J. H., & Lee, C. H. (2016). Monitoring and predicting the fecal indicator bacteria concentrations from agricultural, mixed land use and urban stormwater runoff. Science of the Total Environment, 550, 1171-1181. https://doi.org/10.1016/j.scitotenv.2016.01.026
Praveena, S. M., Shamira, S. S., & Aris, A. Z. (2018). Beach Sand Quality and Its Associated Health Effects of Port Dickson Beaches (Malaysia): An Analysis of Beach Management Framework. In Beach Management Tools-Concepts, Methodologies and Case Studies (pp. 821-829). Springer, Cham. https://doi.org/10.1007/978-3-319-58304-4_41
Rasmussen, P. P., & Ziegler, A. C. (2003). Comparison and continuous estimates of fecal coliform and Escherichia coli bacteria in selected Kansas streams, May 1999 through April 2002: U.S. Geological Survey Water-Resources Investigations Report 03–4056, 87.
Riverkeeper, U. C., & Cobb County, G. (2008). Escherichia coli Bacteria Density in Relation to Turbidity, Streamflow Characteristics, and Season in the Chattahoochee River near Atlanta, Georgia, October 2000 through September 2008—Description, Statistical Analysis, and Predictive Modeling.
Schang, C., Lintern, A., Cook, P. L. M., Rooney, G., Coleman, R., Murphy, H. M., ... & McCarthy, D. (2018) Escherichia coli survival and transfer in estuarine bed sediments. River Research and Applications. https://doi.org/10.1002/rra.3281
Sinton, L. W., Hall, C. H., Lynch, P. A., & Davies-Colley, R. J. (2002). Sunlight inactivation of fecal indicator bacteria and bacteriophages from waste stabilization pond effluent in fresh and saline waters. Applied and Environmental Microbiology, 68(3), 1122-1131. https://doi.org/10.1128/AEM.68.3.1122-1131.2002
Stapleton, C., Crowther, J., Falconer, R., Francis, C., Humphrey, N., Kashefipour, S., … Watkins, J. (2004). Modelling the fate and transport of particles in water (Phase II). Bristol, Environment Agency: 232p.
Thoe, W., Gold, M., Griesbach, A., Grimmer, M., Taggart, M., & Boehm, A. (2014). Predicting water quality at Santa Monica Beach: evaluation of five different models for public notification of unsafe swimming conditions. Water Research, 67, 105-117. https://doi.org/10.1016/j.watres.2014.09.001

gjhs.ccsenet.org Global Journal of Health Science Vol. 11, No. 3; 2019
155
Supplemental Material
Clarity Class
LogE
.col
i
Region: 1
1 2 3 4 5-1
0
1
2
3
4
5
Region: 2
1 2 3 4 5Region: 3
1 2 3 4 5Region: 4
1 2 3 4 5
Region: 5
1 2 3 4 5-1
0
1
2
3
4
5
Region: 6
1 2 3 4 5Region: 7
1 2 3 4 5Region: 8
1 2 3 4 5
Region: 9
1 2 3 4 5-1
0
1
2
3
4
5
Region: 10
1 2 3 4 5Region: 11
1 2 3 4 5Region: 12
1 2 3 4 5
Region: 13
1 2 3 4 5-1
0
1
2
3
4
5
Region: 14
1 2 3 4 5Region: 15
1 2 3 4 5
Median 25%-75% Non-Outlier Range Outliers Extremes
--Guideline (2.73 LogCFU/100mL)
Supplemental Figure S1. Box plots of 8103 datasets of river E.coli concentrations grouped by clarity class and
categorized by region. Region 1=AC, 2=BOP, 3=ECAN, 4=ES, 5=EW, 6=GDC, 7=GWRC, 8=HBRC, 9=HRC, 10=MDC, 11=NRC, 12=ORC, 13=TDC, 14=TRC, 15=WCRC
gjhs.ccsenet.org Global Journal of Health Science Vol. 11, No. 3; 2019
156
(a)
(b)
Supplemental Figure S2. Box plots of 8103 datasets of river E.coli concentrations grouped by clarity class and
categorized by a) land use and b) geology.
Log E
.coli
(Log
CFU
/100
mL)
Pasture
1 2 3 4 5-1012345
Indigenous Forests
1 2 3 4 5
Shrubs
1 2 3 4 5-1012345
Exotic forests
1 2 3 4 5
Median 25%-75% Non-Outlier Range Outliers
- - Guideline (2.73 LogCFU/100mL)
Clarity Class (by quartiles)
Log E
.coli
(CFU
/100
mL)
Alluvium
1 2 3 4 5-1012345
Hard sedimentary
1 2 3 4 5
Plutonics
1 2 3 4 5
Soft sedimentary
1 2 3 4 5-1012345
Volcanic acidic
1 2 3 4 5
Volcanic basic
1 2 3 4 5

gjhs.ccsenet.org Global Journal of Health Science Vol. 11, No. 3; 2019
157
Supplemental Figure S3. Box plots of 8103 datasets of river E.coli concentrations grouped by clarity class and
categorized by stream order classification
Clarity Class (by quartiles)
Log E
.coli (
LogC
FU/1
00m
L)
Stream Order: 1
1 2 3 4 5-1012345
Stream Order: 2
1 2 3 4 5
Stream Order: 3
1 2 3 4 5
Stream Order: 4
1 2 3 4 5-1012345
Stream Order: 5
1 2 3 4 5
Stream Order: 6
1 2 3 4 5
Median 25%-75% Non-Outlier Range Outliers
- - Guideline (2.73LogCFU/100mL)

gjhs.ccsenet.org Global Journal of Health Science Vol. 11, No. 3; 2019
158
Supplemental Table S1. Sensitivity, specificity, and accuracy associated with various incremental water clarity ‘trigger’ values (in meters) when used to predict E.coli BWS exceedances at 77 freshwater sites nationwide during spring.
Incr
emen
tal w
ater
clar
ity va
lues
True
Exc
eede
nces
of B
WS
True
Non
-exc
ceed
ance
s of B
WS
False
Non
-exc
eeda
nceS
of B
WS
False
exc
eeda
nceS
of B
WS
Tota
l exc
eeda
nces
Tota
l non
-exc
eeda
nces
Tota
l obs
erva
tions
Sens
itivit
y (%
)
Spec
ificit
y (%
)
Accu
racy
(%)
Sensitivity - Specificity (%)
0.01 0 1808 234 1 234 1809 2043 0.00 99.94 88.50 -99.90.02 3 1803 231 6 234 1809 2043 1.28 99.67 88.40 -98.40.03 7 1799 227 10 234 1809 2043 2.99 99.45 88.40 -96.50.04 12 1793 222 16 234 1809 2043 5.13 99.12 88.35 -94.00.05 17 1789 217 20 234 1809 2043 7.26 98.89 88.40 -91.60.06 22 1786 212 23 234 1809 2043 9.40 98.73 88.50 -89.30.07 28 1781 206 28 234 1809 2043 11.97 98.45 88.55 -86.50.08 33 1777 201 32 234 1809 2043 14.10 98.23 88.60 -84.10.09 33 1773 201 36 234 1809 2043 14.10 98.01 88.40 -83.90.1 39 1763 195 46 234 1809 2043 16.67 97.46 88.20 -80.80.2 89 1698 145 111 234 1809 2043 38.03 93.86 87.47 -55.80.3 127 1635 107 174 234 1809 2043 54.27 90.38 86.25 -36.10.4 150 1584 84 225 234 1809 2043 64.10 87.56 84.88 -23.50.5 178 1517 56 292 234 1809 2043 76.07 83.86 82.97 -7.8
0.6* 188 1451 46 358 234 1809 2043 80.34 80.21 80.23 0.10.7 191 1370 43 439 234 1809 2043 81.62 75.73 76.41 5.90.8 195 1309 39 500 234 1809 2043 83.33 72.36 73.62 11.00.9 200 1245 34 564 234 1809 2043 85.47 68.82 70.73 16.61 205 1191 29 618 234 1809 2043 87.61 65.84 68.33 21.8
1.1 207 1129 27 680 234 1809 2043 88.46 62.41 65.39 26.11.2 211 1075 23 734 234 1809 2043 90.17 59.43 62.95 30.71.3 211 1016 23 793 234 1809 2043 90.17 56.16 60.06 34.01.4 214 964 20 845 234 1809 2043 91.45 53.29 57.66 38.21.5 216 900 18 909 234 1809 2043 92.31 49.75 54.63 42.6
1.6** 216 862 18 947 234 1809 2043 92.31 47.65 52.77 44.71.7 218 822 16 987 234 1809 2043 93.16 45.44 50.91 47.71.8 219 790 15 1019 234 1809 2043 93.59 43.67 49.39 49.91.9 220 752 14 1057 234 1809 2043 94.02 41.57 47.58 52.42 223 717 11 1092 234 1809 2043 95.30 39.64 46.01 55.7
2.1 224 689 10 1120 234 1809 2043 95.73 38.09 44.69 57.62.2 225 661 9 1148 234 1809 2043 96.15 36.54 43.37 59.62.3 226 630 8 1179 234 1809 2043 96.58 34.83 41.90 61.82.4 226 609 8 1200 234 1809 2043 96.58 33.67 40.87 62.92.5 226 581 8 1228 234 1809 2043 96.58 32.12 39.50 64.52.6 227 547 7 1262 234 1809 2043 97.01 30.24 37.89 66.82.7 227 523 7 1286 234 1809 2043 97.01 28.91 36.71 68.12.8 228 501 6 1308 234 1809 2043 97.44 27.69 35.68 69.72.9 228 471 6 1338 234 1809 2043 97.44 26.04 34.21 71.43 228 448 6 1361 234 1809 2043 97.44 24.77 33.09 72.7
3.1 229 423 5 1386 234 1809 2043 97.86 23.38 31.91 74.53.2 231 408 3 1401 234 1809 2043 98.72 22.55 31.28 76.23.3 231 394 3 1415 234 1809 2043 98.72 21.78 30.59 76.93.4 231 369 3 1440 234 1809 2043 98.72 20.40 29.37 78.33.5 232 354 2 1455 234 1809 2043 99.15 19.57 28.68 79.63.6 232 344 2 1465 234 1809 2043 99.15 19.02 28.19 80.13.7 232 330 2 1479 234 1809 2043 99.15 18.24 27.51 80.97.7 234 53 0 1756 234 1809 2043 100.00 2.93 14.05 97.17.8 234 49 0 1760 234 1809 2043 100.00 2.71 13.85 97.320 234 0 0 1809 234 1809 2043 100.00 0.00 11.45 100.0
Optimum threshold (spring), this study, **1.6m threshold reported in Davies-Colley et al (2018)

gjhs.ccsenet.org Global Journal of Health Science Vol. 11, No. 3; 2019
159
Copyrights Copyright for this article is retained by the author(s), with first publication rights granted to the journal. This is an open-access article distributed under the terms and conditions of the Creative Commons Attribution license (http://creativecommons.org/licenses/by/4.0/).