seeking yield in equities - fidelity
TRANSCRIPT
Q3 2013 market update | investment insights
Seeking Yield in Equities
With U.S. interest rates near historically low levels, and an aging population seeking income, investors are looking for ways to boost portfolio income potential, while managing the volatility added by riskier assets.
Corporate Balance Sheets Are Healthy, Enabling a Focus on Investor Returns
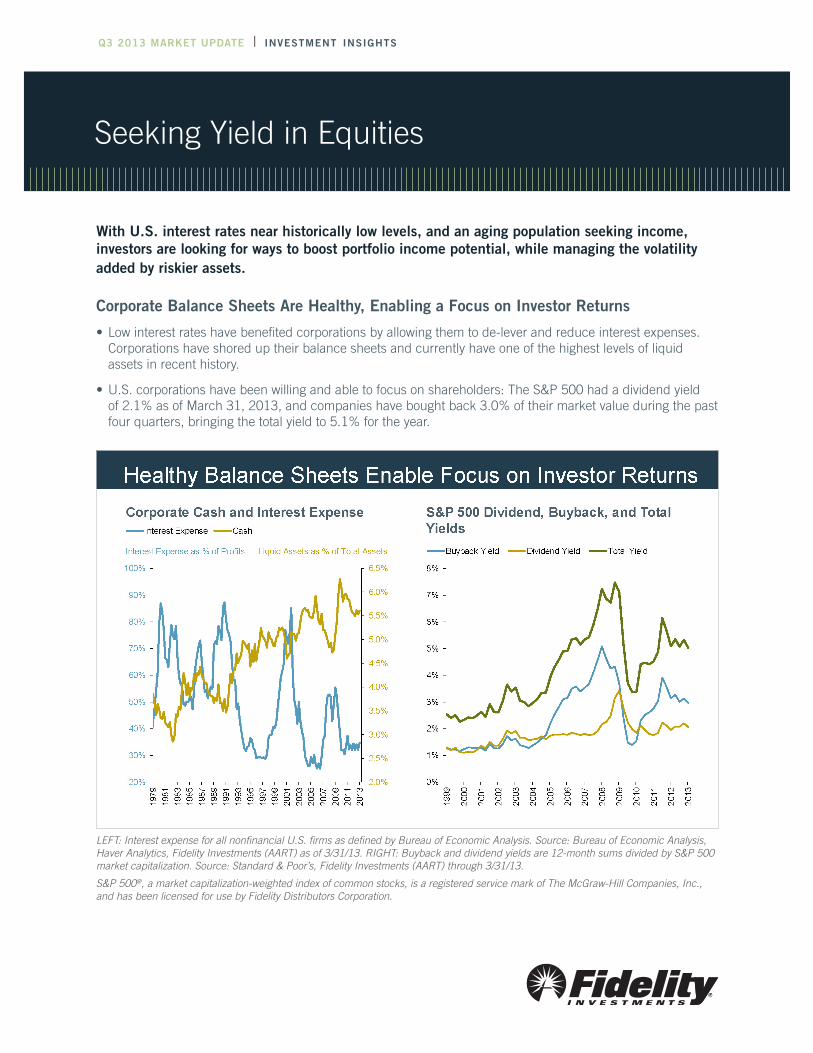
•Lowinterestrateshavebenefitedcorporationsbyallowingthemtode-leverandreduceinterestexpenses.Corporationshaveshoreduptheirbalancesheetsandcurrentlyhaveoneofthehighestlevelsofliquidassetsinrecenthistory.
•U.S.corporationshavebeenwillingandabletofocusonshareholders:TheS&P500hadadividendyieldof2.1%asofMarch31,2013,andcompanieshaveboughtback3.0%oftheirmarketvalueduringthepastfourquarters,bringingthetotalyieldto5.1%fortheyear.
LEFT: Interest expense for all nonfinancial U.S. firms as defined by Bureau of Economic Analysis. Source: Bureau of Economic Analysis, Haver Analytics, Fidelity Investments (AART) as of 3/31/13. RIGHT: Buyback and dividend yields are 12-month sums divided by S&P 500 market capitalization. Source: Standard & Poor’s, Fidelity Investments (AART) through 3/31/13.
S&P 500®, a market capitalization-weighted index of common stocks, is a registered service mark of The McGraw-Hill Companies, Inc., and has been licensed for use by Fidelity Distributors Corporation.

Seeking Yield in Equities
2
Opportunities for Equity Income as Market Revalues Dividends
•Thecurrentmarketenvironmentofhistoricallyhighequityyieldsrelativetobondyieldsprovidesattractiveopportunitiesforgeneratingincomefromequitiesandothernon-bondinvestmentcategories.
•Stockswithhigherpayoutratioshaveenjoyedhighervaluationsasthemarkethaspaidapremiumforthestabilityofdistributedearnings,indicatingapotentiallong-termshiftininvestorpreferences.Manystocksstillhavelowpayoutratiosandmaybenefitfromraisingtheirdividends.
Payout ratio is the dividend paid out over the year divided by the earnings over the year (a low payout ratio indicates dividend growth potential, while a high payout ratio indicates less cash to increase dividends). Past performance and dividend rates are historical and do not guaran-tee future results. LEFT: Source: Standard & Poor’s, Federal Reserve Board, Haver Analytics, Fidelity Investments (AART) through 6/30/13. RIGHT: Source: FactSet, Fidelity Investments (AART) as of 6/30/13.

Q3 2013 market update
3
Equity Income and Non-Bond Opportunities to Boost Yield
•Duringthepastdecade,highdividend-payingstockshavedeliveredaveragedividendyieldsandhigherrisk-adjustedreturnsthanseveralotherequitycategories.
•Bytakingaglobalapproachandcombiningvariousnon-bondsourcesofincomewithdifferentriskandreturncharacteristics,portfolioyieldsandSharperatioshavebeenboostedevenfurther.
•Whencombined,thesecategoriesmaycreatediversificationbenefitsbyloweringthepotentialvolatilityandraisingtheexpectedrisk-adjustedreturnprofileoftheentireportfolio.
Sharpe ratio compares portfolio returns above the risk-free rate relative to overall portfolio volatility (a higher Sharpe ratio implies better risk-adjusted returns). Standard deviation measures the degree of variation from the average (a low standard deviation means data points are close to average). The efficient frontier is at the core of the modern portfolio theory. It represents those portfolios with the highest expected return given a level of risk. Past performance is no guarantee of future results. Diversification does not ensure a profit or guarantee against loss. LEFT: High dividend stocks are subsets of their respective indices containing securities with greater than average dividend yields and reasonable dividend per share growth and dividend payouts. Index returns represented by: U.S. Stocks – MSCI USA Index; Non-U.S. Developed-Country Stocks – MSCI EAFE Index; Global Stocks – MSCI All-Country World Index. Source: Morningstar Encorr, Fidelity Invest-ments (AART). Left chart as of 12/31/12. RIGHT: Efficient frontier represents the optimal risk-return combinations of the four assets. Index returns represented by: High dividend stocks – MSCI USA High Dividend Index; Preferred stocks – BofA ML U.S. Fixed Rate Preferred Securities Index; Real Estate Investment Trusts (REITs) – FTSE NAREIT Equity REIT Index; Convertibles – BofA ML All U.S. Convertibles Index. Portfolio allocation is 50% High Dividend Stocks, 20% Preferred Stocks, 15% Convertibles, and 15% REITs. Source: Morningstar EnCorr, Fidelity Investments (AART) as of 3/31/13.
MSCI® USA Index is a free float-adjusted, market capitalization-weighted index designed to measure the equity market performance of the United States. MSCI Europe, Australasia, Far East Index (EAFE) is an unmanaged market capitalization-weighted index designed to rep-resent the performance of developed stock markets outside the U.S. and Canada. MSCI All-Country World Index is a free float-adjusted, market capitalization-weighted index designed to measure the equity market performance of developed and emerging markets. MSCI USA High Dividend Index is an unmanaged index that tracks the performance of U.S. high dividend-yield equities. Bank of America Merrill Lynch (BofA ML) U.S. Fixed Rate Preferred Securities Index is an unmanaged index that tracks the performance of fixed-rate preferred securities publicly issued in the U.S. domestic market. FTSE NAREIT Equity REIT Index is a market value-weighted index based on the last closing price of the month for tax-qualified REITs listed on the NYSE. BofA ML All U.S. Convertibles Index is an unmanaged index that tracks the performance of all U.S. convertible securities.
Seeking Yield in Equities
4
ThisreportisaproductoftheAssetAllocationResearchTeam(AART).AARTconductseconomic,fundamental,andquantitativeresearchtodevelopassetallocationrecommendationsforFidelity’sportfoliomanagersandinvestmentteams.AARTisresponsibleforanalyzingandsynthesizinginvestmentperspectivesacrossFidelity’sassetmanagementunittogenerateinsightsonmacroeconomicandfinancialmarkettrendsandtheirimplicationsforassetallocation.
Formoreinformationaboutseekingyieldinequities,pleaserefertotheQuarterly Market Update.
Asinvestors’desireforincomecontinuestoincrease,webelieveastrategythatleadstoprudentrisktakingmaymitigateportfoliovolatilityandhelpinvestorspursuetheirincomegoals.
Viewsexpressedareasofthedateindicated,basedontheinformationavailableatthattime,andmaychangebasedonmarketandotherconditions.Unlessotherwisenoted,theopinionsprovidedarethoseoftheauthorandnotnecessarilythoseofFidelityInvestmentsoritsaffiliates.Fidelitydoesnotassumeanydutytoupdateanyoftheinformation.
Past performance, dividend rates, and share buybacks are historical and do not guarantee future results.
Investmentdecisionsshouldbebasedonanindividual’sowngoals,timehorizon,andtoleranceforrisk.
Investing involves risk, including risk of loss.
Neitherassetallocationnordiversificationensuresaprofitorguaranteesagainstaloss.
Generally,amongassetclasses,stocksaremorevolatilethanbondsorshort-terminstrumentsandcandeclinesignificantlyinresponsetoadverseissuer,industry,political,regulatory,market,oreconomicdevelopments.
Changesinrealestatevaluesoreconomicdownturnscanhaveasignificantnegativeeffectonissuersintherealestateindustry.
ForeignmarketscanbemorevolatilethanU.S.marketsduetoincreasedrisksofadverseissuer,political,marketoreconomicdevelopments,allofwhicharemagnifiedinemergingmarkets.
Indicesareunmanaged.Itisnotpossibletoinvestdirectlyinanindex.
Third-partymarksarethepropertyoftheirrespectiveowners;allothermarksarethepropertyofFMRLLC.
IfreceivingthispiecethroughyourrelationshipwithFidelityFinancialAdvisorSolutions(FFAS),thispublicationisprovidedtoinvestmentprofessionals,plansponsors,institutionalinvestors,andindividualinvestorsbyFidelityInvestmentsInstitutionalServicesCompany,Inc.
IfreceivingthispiecethroughyourrelationshipwithFidelityPer-sonal&WorkplaceInvesting(PWI),FidelityFamilyOfficeServices(FFOS),orFidelityInstitutionalWealthServices(IWS),thispublica-tionisprovidedthroughFidelityBrokerageServicesLLC,MemberNYSE,SIPC.
IfreceivingthispiecethroughyourrelationshipwithNationalFinan-cialorFidelityCapitalMarkets,thispublicationisFOR INSTITU-TIONAL INVESTOR USE ONLY.ClearingandcustodyservicesareprovidedthroughNationalFinancialServicesLLC,MemberNYSE,SIPC.
654530.1.0
©2013FMRLLC.Allrightsreserved.
Portfolio Implications
• Interestratesandinflationarecurrentlynearhistoricallowsbutareunlikelytostaythereindefinitely.Inves-torscanlookbeyondfixedincomeforhigheryieldstohelpmeettheirincomeneeds,whilealsomanagingoverallportfoliorisk.
•Dividend-payingstockshavegenerallyofferednotonlyhigheryieldsbutalsopotentiallysteadyrevenuestreamstohelpkeepvolatilityrelativelylow.
•Diversifyingaportfoliobyincludingglobalequityandothernon-bondsourcesofincomemayhelpboostincomepotentialandrisk-adjustedreturns.