seepage investigation on the rio grande from below caballo ... · vi tables 1. locations of u.s....
TRANSCRIPT

U.S. Department of the InteriorU.S. Geological Survey
Scientific Investigations Report 2014–5197
Seepage Investigation on the Rio Grande from Below Caballo Reservoir, New Mexico, to El Paso, Texas, 2012
Prepared in cooperation with the New Mexico Interstate Stream Commission

21
4
3
Cover.1. View of Westside Canal at Diversion at Mesilla Diversion Dam near Mesilla, New Mexico, June 27, 2012 (photograph by Jay Cederberg,
U.S. Geological Survey).2. View of Percha Dam recreation area at Caballo Lake State Park across Arrey Canal Diversion near Arrey, New Mexico, June 26, 2013
(photograph by Jay Cederberg, U.S. Geological Survey).3. U.S. Geological Survey hydrologist Jay Cederberg conducting discharge measurement in Pence Lateral Wasteway 34A near Canutillo,
Texas, June 28, 2012 (photograph by Rachel Powell, U.S. Geological Survey).4. View downstream at Leasburg Main Canal near Radium Springs, New Mexico, June 27, 2012 (photograph by Jay Cederberg, U.S.
Geological Survey).

Seepage Investigation on the Rio Grande from Below Caballo Reservoir, New Mexico, to El Paso, Texas, 2012
By Mark A. Gunn and D. Michael Roark
Prepared in cooperation with the New Mexico Interstate Stream Commission
Scientific Investigations Report 2014–5197
U.S. Department of the InteriorU.S. Geological Survey
U.S. Department of the InteriorSALLY JEWELL, Secretary
U.S. Geological SurveySuzette M. Kimball, Acting Director
U.S. Geological Survey, Reston, Virginia: 2014
For more information on the USGS—the Federal source for science about the Earth, its natural and living resources, natural hazards, and the environment, visit http://www.usgs.gov or call 1–888–ASK–USGS.
For an overview of USGS information products, including maps, imagery, and publications, visit http://www.usgs.gov/pubprod
To order this and other USGS information products, visit http://store.usgs.gov
Any use of trade, firm, or product names is for descriptive purposes only and does not imply endorsement by the U.S. Government.
Although this information product, for the most part, is in the public domain, it also may contain copyrighted materials as noted in the text. Permission to reproduce copyrighted items must be secured from the copyright owner.
Suggested citation:Gunn, M.A., and Roark, D.M., 2014, Seepage investigation on the Rio Grande from below Caballo Reservoir, New Mexico, to El Paso, Texas, 2012: U.S. Geological Survey Scientific Investigations Report 2014–5197, 17 p., http://dx.doi.org/10.3133/sir20145197.
ISSN 2328-0328 (online)

iii
Acknowledgments
The authors gratefully acknowledge the generous assistance of Derrick O’Hara, Rio Grande Project of the Bureau of Reclamation; James Narvez, Elephant Butte Irrigation District; and Robert Rios, El Paso County Water Improvement District No. 1, for maintaining a constant state of the river and irrigation works during the measurements and providing their knowledge of the area and the irrigation system. The authors acknowledge Dr. Nabil Shafike for providing his review comments and assisting with initial planning efforts in the investigation. The authors also acknowledge assistance from Jerry Melendez, Bureau of Reclamation, with discharge measurements.
The authors acknowledge assistance from Jason Short, Anthony McGlone, Jay Cederberg, Lauren Sherson, Rachael Powell, Mike Carlson, Andrew Bernard, Patrick Swift, and John Summers, U.S. Geological Survey, with discharge measurements and Dianna Crilley, Anne Marie Matherne, Nicole Thomas, and Lauren Breitner, U.S. Geological Survey, for technical assistance.

iv

v
Contents
Abstract ..........................................................................................................................................................1Introduction.....................................................................................................................................................1Purpose and Scope .......................................................................................................................................1Description of the Study Area and Measurement Locations .................................................................2Methods...........................................................................................................................................................2
Measurement of Surface-Water Discharge ....................................................................................2Seepage Computation ........................................................................................................................10
Estimation of Uncertainty .........................................................................................................10Net Seepage Gain or Loss and Estimation of Uncertainty ..................................................10
Results of Seepage Investigation on the Rio Grande from Below Caballo Reservoir, New Mexico, to El Paso, Texas ....................................................................................................11
Reach 1, Rio Grande Below Caballo Reservoir to Rio Grande at Haynor Bridge ...................................................................................................................11
Reach 2, Rio Grande at Haynor Bridge to Rio Grande Below Mesilla Diversion Dam .........................................................................................................11
Reach 3, Rio Grande from Below Mesilla Diversion Dam to Rio Grande at Anthony–EP No. 1 ..................................................................................................................11
Reach 4, Rio Grande at Anthony–EP No. 1 to Rio Grande at El Paso .........................................15Summary........................................................................................................................................................17References Cited..........................................................................................................................................17
Figures 1. Map showing locations of U.S. Geological Survey Rio Grande
discharge-measurement sites from below Caballo Reservoir, New Mexico, to El Paso, Texas, June 26–28, 2012 ..................................................................3
2. Diagram showing locations of U.S. Geological Survey Rio Grande discharge measurement sites from below Caballo Reservoir, New Mexico, to El Paso, Texas, June 26–28, 2012, and the relation of diversions, drains, and inflows to the river channel along the study reach .......................4

vi
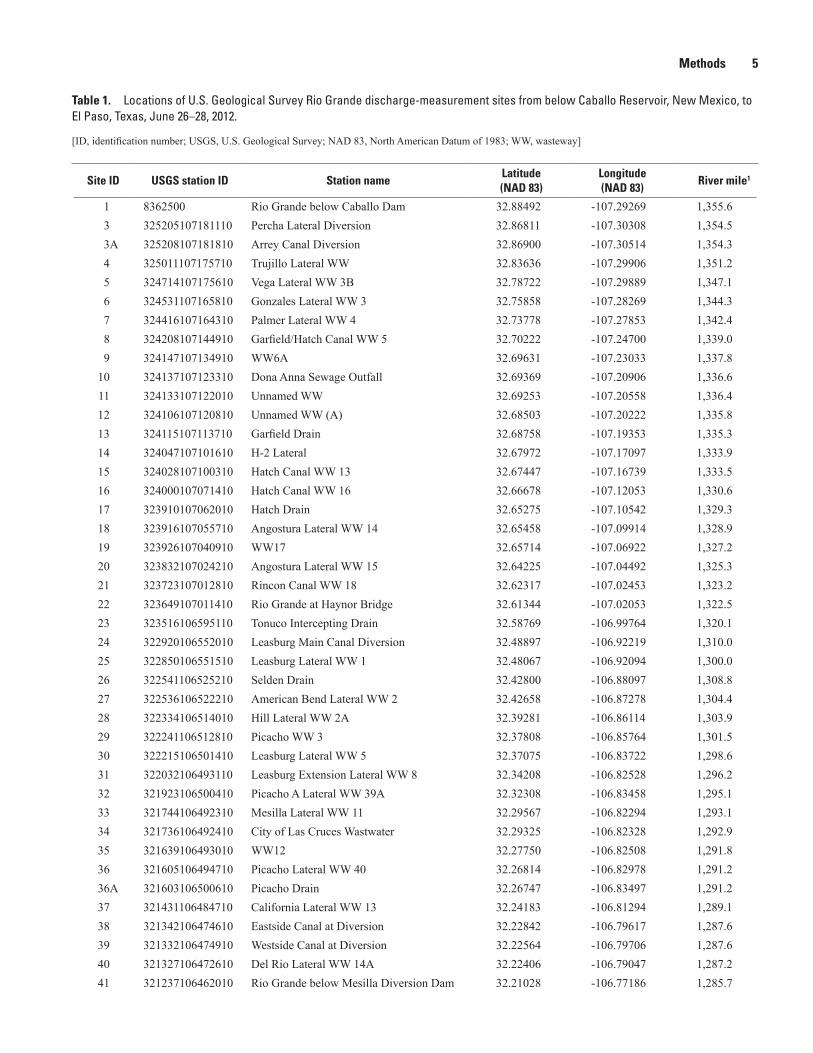
Tables 1. Locations of U.S. Geological Survey Rio Grande discharge-measurement
sites from below Caballo Reservoir, New Mexico, to El Paso, Texas, June 26–28, 2012 ...........................................................................................................................5
2. Field measurements and observations, Rio Grande seepage investigation, June 26–28, 2012 ...........................................................................................................................7
3. Summary of measured discharge and the computed net seepage gain or loss in Reach 1, Rio Grande seepage investigation, June 26, 2012 ...............................12
4. Summary of measured discharge and the computed net seepage gain or loss in Reach 2, Rio Grande seepage investigation, June 27, 2012 ...............................13
5. Summary of measured discharge and the computed net seepage gain or loss in Reach 3, Rio Grande seepage investigation, June 28, 2012 ...............................14
6. Summary of measured discharge and the computed net seepage gain or loss in Reach 4, Rio Grande seepage investigation, June 28, 2012 ...............................16
vii
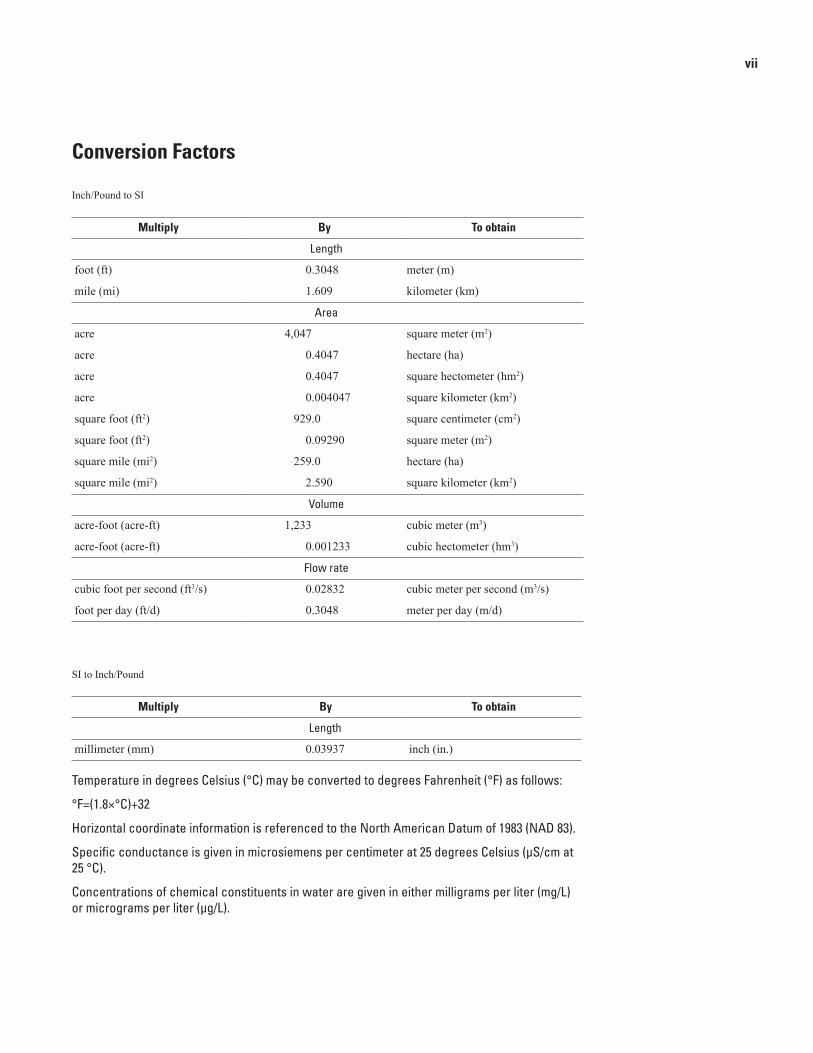
Conversion Factors
Inch/Pound to SI
Multiply By To obtain
Length
foot (ft) 0.3048 meter (m)
mile (mi) 1.609 kilometer (km)
Area
acre 4,047 square meter (m2)
acre 0.4047 hectare (ha)
acre 0.4047 square hectometer (hm2)
acre 0.004047 square kilometer (km2)
square foot (ft2) 929.0 square centimeter (cm2)
square foot (ft2) 0.09290 square meter (m2)
square mile (mi2) 259.0 hectare (ha)
square mile (mi2) 2.590 square kilometer (km2)
Volume
acre-foot (acre-ft) 1,233 cubic meter (m3)
acre-foot (acre-ft) 0.001233 cubic hectometer (hm3)
Flow rate
cubic foot per second (ft3/s) 0.02832 cubic meter per second (m3/s)
foot per day (ft/d) 0.3048 meter per day (m/d)
SI to Inch/Pound
Multiply By To obtain
Length
millimeter (mm) 0.03937 inch (in.)
Temperature in degrees Celsius (°C) may be converted to degrees Fahrenheit (°F) as follows:
°F=(1.8×°C)+32
Horizontal coordinate information is referenced to the North American Datum of 1983 (NAD 83).
Specific conductance is given in microsiemens per centimeter at 25 degrees Celsius (µS/cm at 25 °C).
Concentrations of chemical constituents in water are given in either milligrams per liter (mg/L) or micrograms per liter (µg/L).

viii

Seepage Investigation on the Rio Grande from Below Caballo Reservoir, New Mexico, to El Paso, Texas, 2012
By Mark A. Gunn and D. Michael Roark
Abstract A seepage investigation was conducted by the U.S.
Geological Survey, in cooperation with the New Mexico Interstate Stream Commission, along an approximately 106-mile reach of the Rio Grande from below Caballo Reservoir, New Mexico, to El Paso, Texas, during June 26–28, 2012, to determine gain or loss of streamflow due to seepage to or from the river channel. Discharge measurements were made during the irrigation season at high flow including 5 sites along the Rio Grande, 5 diversions, and 63 inflows. The net gain or loss of flow in the river channel was computed for four reaches within the 106-mile reach of the Rio Grande. The normalized percentage difference was computed for each reach to determine the difference between discharge measured at upstream and downstream sites, and the normalized percentage uncertainty was computed to determine if a computed gain or loss exceeded cumulative uncertainty associated with measurement of discharge.
IntroductionThe Rio Grande Compact (New Mexico State
Annual § 75–34–3 (1953), Act of May 31, 1939, ch. 155, 53 Stat. 785), signed into law by Congress in 1938, apportions the waters of the Rio Grande above Fort Quitman, Texas, among the States of Colorado, New Mexico, and Texas and establishes water delivery obligations for Colorado and New Mexico and normal release for the Rio Grande below Elephant Butte Reservoir. The Bureau of Reclamation manages Elephant Butte and Caballo Reservoirs, located on the Rio Grande in New Mexico, for power supply and for irrigation water supply. On the Rio Grande below Caballo Reservoir, the Elephant Butte Irrigation District and El Paso County Water Improvement District No. 1 operate and maintain a system of irrigation canals and laterals that provides delivery of irrigation water to 90,640 acres of land within New Mexico and 68,000 acres within Texas (Bureau of Reclamation, 2008).
The U.S. Geological Survey (USGS), in cooperation with the New Mexico Interstate Stream Commission, conducted a seepage investigation on the Rio Grande from below Caballo Reservoir, N. Mex., to El Paso, Tex., to determine streamflow loss or gain in this approximately 106-mile reach of the Rio Grande. Increasing drought conditions have resulted in reduced water available for domestic, agricultural, and recreational uses (Crilley and others, 2013). A better understanding of the spatial distribution of streamflow gains and losses during high flow conditions in this reach of the Rio Grande is needed to better manage the available water.
The intent of the investigation was to determine gains and losses from the river during a period of flows associated with irrigation deliveries along the Rio Grande during the summer of 2012 and to determine the component of those gains and losses associated with surface-water/groundwater interaction. Previous seepage investigations were conducted along portions of the study area during winter months by measuring periods of base flow in the Rio Grande (Crilley and others, 2013).
Purpose and ScopeThis report describes the methods used to obtain
flow measurements and presents the results of the seepage investigation conducted on the Rio Grande between Caballo Reservoir, N. Mex., and El Paso, Tex., during June 26–28, 2012. Discharge measurements at 73 sites, which include 5 river sites, 5 irrigation diversions, and 63 inflow sites (50 irrigation return flows to the river, 8 drains, and 5 wastewater treatment outfalls) are presented. The calculated streamflow gains and losses attributed to interactions with groundwater along four reaches of the Rio Grande are also presented. Field measurements and observations recorded at discharge measurement locations are presented and include water temperature, specific conductance, instantaneous discharge measurement, discharge measurement type, and discharge rating related to each site.

2 Seepage Investigation on the Rio Grande from Below Caballo Reservoir, New Mexico, to El Paso, Texas, 2012
Description of the Study Area and Measurement Locations
The Rio Grande flows for 1,896 miles from southwestern Colorado south through New Mexico, forming the international boundary between Texas and Mexico outside the study area below El Paso, Tex. The study area encompasses the lower third of the Rio Grande in New Mexico, a 106-mile reach from below Caballo Reservoir, N. Mex., to El Paso, Tex. (fig. 1).
Measurement locations included sites along the river and all diversion and inflow locations that provided potential gain or loss of streamflow to the river system. The river system includes the main channel, tributaries, and manmade features such as diversions and canals. River miles are referenced upstream from site 69, at USGS streamgage Rio Grande at El Paso, which is designated as river mile 1,249.9 (Hendricks, 1964). The relative locations of measurement sites are shown in figure 2, and associated river miles are presented in table 1.
MethodsThe seepage investigation was conducted over a 3-day
period in June 2012 during the irrigation season at high flow. Instantaneous discharge was measured at sites along the river channel, at points of diversion, and at inflows along each study reach. The net gain or loss of flow in the river channel was computed for four reaches along the Rio Grande (fig. 1). A reach is defined as the interval between two adjacent river discharge-measurement locations. The reaches were designated as follows: Reach 1, Rio Grande below Caballo Reservoir (site 1, river mile 1,355.6) to Rio Grande at Haynor Bridge (site 22, river mile 1,322.5); Reach 2, Rio Grande at Haynor Bridge (site 22, river mile 1,322.5) to Rio Grande below Mesilla Diversion Dam (site 41, river mile 1,285.7); Reach 3, Rio Grande below Mesilla Diversion Dam (site 41, river mile 1,285.7) to Rio Grande at Anthony–EP no. 1 (site 59, river mile 1,265.9); and Reach 4, Rio Grande at Anthony–EP no. 1 (site 59, river mile 1,265.9) to Rio Grande at El Paso (site 69, river mile 1,249.9) (figs. 1 and 2; table 1).
Gains or losses in the river can result from seepage to or from the streambed, bank storage, or evaporation from the water surface. Releases from Caballo Reservoir were maintained at a constant rate during the study to minimize gains or losses from bank storage (Jay Powell, Bureau of Reclamation, oral commun., May 24, 2012).
Measurement of Surface-Water Discharge
Discharge measurements at the sites during the seepage investigation were derived from field discharge measurements following standard USGS protocols (Rantz and others, 1982; Kilpatrick and Schneider, 1983; Nolan and Shields, 2000; Oberg and others, 2005; Turnipseed and Sauer, 2010) and from reported values from wastewater treatment plants. Surface-water depth and velocity were determined primarily through the use of an acoustic Doppler current profiler (ADCP) or an acoustic Doppler velocimeter (ADV) depending on site characteristics. The ADCP provides a continuous series of data throughout the cross section of a channel, whereas the ADV measures point velocities at 25–30 vertical sections that subdivide the channel such that no section contains more than 5 percent of the total cross-sectional discharge (Oberg and others, 2005). Discharge measurements were assigned a qualitative measurement uncertainty on the basis of field assessment of flow and measurement conditions of excellent (less than or equal to 2 percent), good (less than or equal to 5 percent), fair (less than or equal to 8 percent), or poor (greater than 8 percent) (Turnipseed and Sauer, 2010).
Multiple instantaneous discharge measurements were made at river sites 1, 22, 41, 59, and 69 (table 2) throughout the duration of the investigation to monitor stability of flow within the Rio Grande. Average values for each day and reach were computed and used to calculate gain or loss within the respective reach.
Effluent from wastewater treatment plants that discharged to the Rio Grande was reported as the daily mean discharge computed from the total discharge for the day metered by the plant (reported-MDI) (table 2). Discharge data for all effluent sites are designated as “reported-MDI” with an uncertainty in measurement greater than or equal to 8 percent, with the exception of site 10, which had no discharge during this investigation.
Specific conductance and water temperature were measured at all sites with multiparameter water-quality meters calibrated according to standard USGS protocols (Wilde and Radtke, variously dated) and are reported in table 2. Water temperature at site 69 was averaged for four measurements, each consisting of six cross-sectional transits of the channel (table 2). Specific conductance at site 69 was averaged for five measurements, each consisting of six cross-sectional transits of the channel. Water quality parameters were collected to verify field conditions to enable ADCPs and ADVs to compute the speed of sound correctly to accurately measure velocities, depths, and compute discharge (Rantz and others, 1982).

Methods 3
Figure 1. Locations of U.S. Geological Survey Rio Grande discharge-measurement sites from below Caballo Reservoir, New Mexico, to El Paso, Texas, June 26–28, 2012.
laf13-0569_fig 01
El Paso
Anthony
Las Cruces
Leasburg
MESILLA DIVERSION DAM
AMERICAN DAM
LEASBURG DAM
CABALLO DAM
10
10
25 £¤70
TEXAS
NEW MEXICO
UNITED STATESMEXICO
Rio Grande
CaballoReservoir
987
65
431
696867
6665
64
62
6160
5958
55 575656A
545351
5049
4746454444A
434241393836
35
3231
2928
272625
24
2322
21
191817
161514
1312
3A
36A3433
37
40
30
63
48
52
59A
2010
11
0 10 20 30 MILES
0 10 20 30 KILOMETERS
TEXAS
COLORADO
NEWMEXICORi
o G
rand
e
MEXICO
UNITED STATES
Area enlargedFort Quitman
Elephant ButteReservoir
CaballoReservoir
EXPLANATIONStudy reach of the Rio Grande from below Caballo Reservoir, New Mexico to El Paso, Texas Reach 1 Reach 2 Reach 3 Reach 4
Discharge-measurement site and identification number5
Base from U.S. Geological Survey digital dataUniversal Transverse Mercator, zone 13North American Datum of 1983
106°30' 106°20'106°40'106°50'
32°20'
32°10'
32°00'
31°50'
33°00'
32°50'
32°40'
32°30'
107°00'107°10'107°20'

4 Seepage Investigation on the Rio Grande from Below Caballo Reservoir, New Mexico, to El Paso, Texas, 2012
1,270
1,250
1,255
1,260
1,265
1,245
1,240
1,360
1,340
1,345
1,350
1,355
1,335
1,330
1,330
1,310
1,315
1,320
1,325
1,305
1,300
River miles are referenced upstream from the Rio Grande atEl Paso, Texas, which is designated as river mile 1,249.9 (Hendricks, 1965).
1,300
1,280
1,285
1,290
1,295
1,275
1,270
Dist
ance
alo
ng th
e Ri
o Gr
ande
, in
river
mile
s
68
59A
60
61
626364
65
66
6745
46
47
48
50 49
51
5253 54
55
56A 5657
58
20
19
1817
30
31
32
3334
3536/36A
37
39 3840
44/44A
4243
3
29
28
2726
25
24
23
21
1312
1110
9
8
7
6
5
4
3A
16
1514
EXPLANATION
River
Inflow
Discharge-measurement siteand identification number
69
Diversion
Reach 1
Reach 2
Reach 3
Reach 4
22
1
41
59
69
Figure 2. Locations of U.S. Geological Survey Rio Grande discharge-measurement sites from below Caballo Reservoir, New Mexico, to El Paso, Texas, June 26–28, 2012, and the relation of diversions, drains, and inflows to the river channel along the study reach.
Methods 5
Table 1. Locations of U.S. Geological Survey Rio Grande discharge-measurement sites from below Caballo Reservoir, New Mexico, to El Paso, Texas, June 26–28, 2012.
[ID, identification number; USGS, U.S. Geological Survey; NAD 83, North American Datum of 1983; WW, wasteway]
Site ID USGS station ID Station name Latitude (NAD 83)
Longitude (NAD 83)
River mile1
1 8362500 Rio Grande below Caballo Dam 32.88492 -107.29269 1,355.63 325205107181110 Percha Lateral Diversion 32.86811 -107.30308 1,354.53A 325208107181810 Arrey Canal Diversion 32.86900 -107.30514 1,354.34 325011107175710 Trujillo Lateral WW 32.83636 -107.29906 1,351.25 324714107175610 Vega Lateral WW 3B 32.78722 -107.29889 1,347.16 324531107165810 Gonzales Lateral WW 3 32.75858 -107.28269 1,344.37 324416107164310 Palmer Lateral WW 4 32.73778 -107.27853 1,342.48 324208107144910 Garfield/Hatch Canal WW 5 32.70222 -107.24700 1,339.09 324147107134910 WW6A 32.69631 -107.23033 1,337.8
10 324137107123310 Dona Anna Sewage Outfall 32.69369 -107.20906 1,336.611 324133107122010 Unnamed WW 32.69253 -107.20558 1,336.412 324106107120810 Unnamed WW (A) 32.68503 -107.20222 1,335.813 324115107113710 Garfield Drain 32.68758 -107.19353 1,335.314 324047107101610 H-2 Lateral 32.67972 -107.17097 1,333.915 324028107100310 Hatch Canal WW 13 32.67447 -107.16739 1,333.516 324000107071410 Hatch Canal WW 16 32.66678 -107.12053 1,330.617 323910107062010 Hatch Drain 32.65275 -107.10542 1,329.318 323916107055710 Angostura Lateral WW 14 32.65458 -107.09914 1,328.919 323926107040910 WW17 32.65714 -107.06922 1,327.220 323832107024210 Angostura Lateral WW 15 32.64225 -107.04492 1,325.321 323723107012810 Rincon Canal WW 18 32.62317 -107.02453 1,323.222 323649107011410 Rio Grande at Haynor Bridge 32.61344 -107.02053 1,322.523 323516106595110 Tonuco Intercepting Drain 32.58769 -106.99764 1,320.124 322920106552010 Leasburg Main Canal Diversion 32.48897 -106.92219 1,310.025 322850106551510 Leasburg Lateral WW 1 32.48067 -106.92094 1,300.026 322541106525210 Selden Drain 32.42800 -106.88097 1,308.827 322536106522210 American Bend Lateral WW 2 32.42658 -106.87278 1,304.428 322334106514010 Hill Lateral WW 2A 32.39281 -106.86114 1,303.929 322241106512810 Picacho WW 3 32.37808 -106.85764 1,301.530 322215106501410 Leasburg Lateral WW 5 32.37075 -106.83722 1,298.631 322032106493110 Leasburg Extension Lateral WW 8 32.34208 -106.82528 1,296.232 321923106500410 Picacho A Lateral WW 39A 32.32308 -106.83458 1,295.133 321744106492310 Mesilla Lateral WW 11 32.29567 -106.82294 1,293.134 321736106492410 City of Las Cruces Wastwater 32.29325 -106.82328 1,292.935 321639106493010 WW12 32.27750 -106.82508 1,291.836 321605106494710 Picacho Lateral WW 40 32.26814 -106.82978 1,291.236A 321603106500610 Picacho Drain 32.26747 -106.83497 1,291.237 321431106484710 California Lateral WW 13 32.24183 -106.81294 1,289.138 321342106474610 Eastside Canal at Diversion 32.22842 -106.79617 1,287.639 321332106474910 Westside Canal at Diversion 32.22564 -106.79706 1,287.640 321327106472610 Del Rio Lateral WW 14A 32.22406 -106.79047 1,287.241 321237106462010 Rio Grande below Mesilla Diversion Dam 32.21028 -106.77186 1,285.7
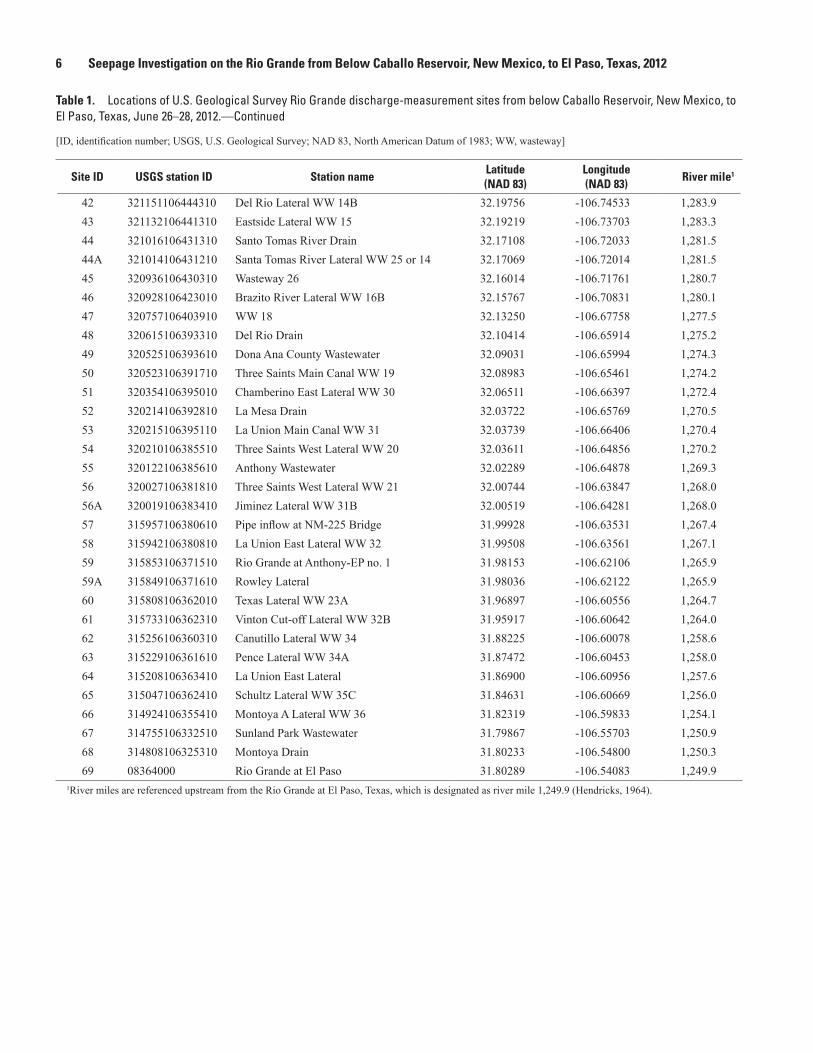
6 Seepage Investigation on the Rio Grande from Below Caballo Reservoir, New Mexico, to El Paso, Texas, 2012
Site ID USGS station ID Station name Latitude (NAD 83)
Longitude (NAD 83)
River mile1
42 321151106444310 Del Rio Lateral WW 14B 32.19756 -106.74533 1,283.943 321132106441310 Eastside Lateral WW 15 32.19219 -106.73703 1,283.344 321016106431310 Santo Tomas River Drain 32.17108 -106.72033 1,281.544A 321014106431210 Santa Tomas River Lateral WW 25 or 14 32.17069 -106.72014 1,281.545 320936106430310 Wasteway 26 32.16014 -106.71761 1,280.746 320928106423010 Brazito River Lateral WW 16B 32.15767 -106.70831 1,280.147 320757106403910 WW 18 32.13250 -106.67758 1,277.548 320615106393310 Del Rio Drain 32.10414 -106.65914 1,275.249 320525106393610 Dona Ana County Wastewater 32.09031 -106.65994 1,274.350 320523106391710 Three Saints Main Canal WW 19 32.08983 -106.65461 1,274.251 320354106395010 Chamberino East Lateral WW 30 32.06511 -106.66397 1,272.452 320214106392810 La Mesa Drain 32.03722 -106.65769 1,270.553 320215106395110 La Union Main Canal WW 31 32.03739 -106.66406 1,270.454 320210106385510 Three Saints West Lateral WW 20 32.03611 -106.64856 1,270.255 320122106385610 Anthony Wastewater 32.02289 -106.64878 1,269.356 320027106381810 Three Saints West Lateral WW 21 32.00744 -106.63847 1,268.056A 320019106383410 Jiminez Lateral WW 31B 32.00519 -106.64281 1,268.057 315957106380610 Pipe inflow at NM-225 Bridge 31.99928 -106.63531 1,267.458 315942106380810 La Union East Lateral WW 32 31.99508 -106.63561 1,267.159 315853106371510 Rio Grande at Anthony-EP no. 1 31.98153 -106.62106 1,265.959A 315849106371610 Rowley Lateral 31.98036 -106.62122 1,265.960 315808106362010 Texas Lateral WW 23A 31.96897 -106.60556 1,264.761 315733106362310 Vinton Cut-off Lateral WW 32B 31.95917 -106.60642 1,264.062 315256106360310 Canutillo Lateral WW 34 31.88225 -106.60078 1,258.663 315229106361610 Pence Lateral WW 34A 31.87472 -106.60453 1,258.064 315208106363410 La Union East Lateral 31.86900 -106.60956 1,257.665 315047106362410 Schultz Lateral WW 35C 31.84631 -106.60669 1,256.066 314924106355410 Montoya A Lateral WW 36 31.82319 -106.59833 1,254.167 314755106332510 Sunland Park Wastewater 31.79867 -106.55703 1,250.968 314808106325310 Montoya Drain 31.80233 -106.54800 1,250.369 08364000 Rio Grande at El Paso 31.80289 -106.54083 1,249.9
1River miles are referenced upstream from the Rio Grande at El Paso, Texas, which is designated as river mile 1,249.9 (Hendricks, 1964).
Table 1. Locations of U.S. Geological Survey Rio Grande discharge-measurement sites from below Caballo Reservoir, New Mexico, to El Paso, Texas, June 26–28, 2012.—Continued
[ID, identification number; USGS, U.S. Geological Survey; NAD 83, North American Datum of 1983; WW, wasteway]

Methods 7
Table 2. Field measurements and observations, Rio Grande seepage investigation, June 26–28, 2012.
[ID, identification number; site ID: see table 1 and figures 1 and 2 for location of sites. °C, degrees Celsius; μS/cm, microsiemens per centimeter; ft³/s, cubic foot per second ; ──, not applicable; ADCP, acoustic Doppler current meter; ADV, acoustic Doppler velocimeter; EST, estimate; reported-MDI, instantaneous discharge computed from the reported mean daily total discharge; E, excellent (within 2 percent); G, good (within 5 percent); F, fair (within 8 percent); P, poor (greater than 8 percent); U, unspecified (rated as fair, within 8 percent); LB, left bank; RB, right bank; Av, measurement average]
Site ID Sample dateSample time
(military)
Water temperature
(°C)
Specific conductance at 25 °C (μS/cm)
Instantaneous discharge
measurement (ft³/s)
Discharge measurement
type
Discharge rating
1 6/26/2012 1037 23.1 ── 1,680 ADCP G1 6/26/2012 1146 24.1 ── 1,670 ADCP G1 6/26/2012 1251 24.1 ── 1,660 ADCP G3 6/26/2012 0900 ── ── ── ── E3 6/26/2012 1047 ── ── ── ── E3A 6/26/2012 0921 22.7 ── 187 ADCP G3A 6/26/2012 1014 ── ── 192 ADCP G4 6/26/2012 1000 ── ── ── ── E5 6/26/2012 1015 ── ── ── E
6 6/26/2012 1025 24.5 752 0.08 EST F7 6/26/2012 1035 21.8 1,310 0.01 EST F8 6/26/2012 1045 24.9 746 0.55 EST P9 6/26/2012 1100 ── ── ── ── E
10 6/26/2012 1105 ── ── ── ── E11 6/26/2012 1113 ── ── ── ── E12 6/26/2012 1108 ── ── ── ── E13 6/26/2012 1111 ── ── ── ── E14 6/26/2012 1117 ── ── ── ── E15 6/26/2012 1145 25.8 723 4.76 ADV F16 6/26/2012 1210 26.2 745 0.10 ADV F17 6/26/2012 1221 ── ── ── ── E18 6/26/2012 1225 ── ── ── ── E19 6/26/2012 1222 ── ── ── ── E20 6/26/2012 1230 ── ── ── ── E21 6/26/2012 1224 ── ── 0.25 EST P22 6/26/2012 0951 24.0 738 1,420 ADCP G22 6/26/2012 1059 24.3 732 1,410 ADCP G22 6/26/2012 1142 ── ── 1,420 ADCP G22 6/26/2012 1209 24.8 735 1,410 ADCP G22 6/26/2012 1301 ── ── 1,430 ADCP G22 6/27/2012 0859 23.4 738 1,390 ADCP F22 6/27/2012 0944 23.5 735 1,420 ADCP G22 6/27/2012 1027 23.8 721 1,390 ADCP G22 6/27/2012 1115 24.1 732 1,390 ADCP G22 6/27/2012 1208 24.4 731 1,420 ADCP G22 6/27/2012 1251 24.7 731 1,400 ADCP G22 6/27/2012 1328 25.1 726 1,400 ADCP G22 6/27/2012 1402 25.3 726 1,400 ADCP G

8 Seepage Investigation on the Rio Grande from Below Caballo Reservoir, New Mexico, to El Paso, Texas, 2012
Site ID Sample dateSample time
(military)
Water temperature
(°C)
Specific conductance at 25 °C (μS/cm)
Instantaneous discharge
measurement (ft³/s)
Discharge measurement
type
Discharge rating
22 6/27/2012 1440 25.6 729 1,400 ADCP G22 6/27/2012 1512 25.8 731 1,410 ADCP G22 6/27/2012 1550 26.1 732 1,410 ADCP G22 6/27/2012 1632 26.3 734 1,390 ADCP G23 6/27/2012 0900 19.1 1,933 2.46 EST P24 6/27/2012 1135 24.9 730 193 ADCP G25 6/27/2012 1128 ── ── ── ── E26 6/27/2012 1222 ── ── ── ── P27 6/27/2012 1230 ── ── ── ── E28 6/27/2012 1240 28.2 701 0.34 EST F29 6/27/2012 1128 25.0 744 4.64 ADV P30 6/27/2012 1320 ── ── ── ── E31 6/27/2012 1333 27.0 753 1.36 ADV P32 6/27/2012 1400 ── ── ── ── E33 6/27/2012 1405 ── ── ── ── E34 6/27/2012 1410 28.7 1,305 7.00 EST P35 6/27/2012 1420 27.8 750 0.25 EST P36 6/27/2012 1431 26.6 1,033 5.32 ADV F36A 6/27/2012 1510 ── ── ── ── E37 6/27/2012 1242 ── ── ── ── E38 6/27/2012 1317 27.0 ── 172 ADCP G39 6/27/2012 1624 28.7 732 437 ADCP G40 6/28/2012 0957 ── ── ── ── E41 6/27/2012 1027 24.8 750 364 ADCP P41 6/27/2012 1128 25.6 751 408 ADCP P41 6/27/2012 1250 26.7 754 404 ADCP P41 6/27/2012 1414 28.1 753 366 ADCP P41 6/27/2012 1630 28.7 754 382 ADCP P41 6/28/2012 0953 24.8 757 353 ADCP F41 6/28/2012 1050 25.5 753 351 ADCP F41 6/28/2012 1146 26.3 754 354 ADCP F41 6/28/2012 1256 27.0 757 352 ADCP F41 6/28/2012 1344 27.8 754 361 ADCP F41 6/28/2012 1449 28.7 753 334 ADCP F41 6/28/2012 1549 29.5 751 334 ADCP F41 6/28/2012 1642 29.8 755 318 ADCP F42 6/28/2012 1006 ── ── ── EST E43 6/28/2012 1010 24.5 776 0.25 EST P44 6/28/2012 1023 ── ── ── EST E44A 6/28/2012 1022 22.9 728 0.12 EST P
Table 2. Field measurements and observations, Rio Grande seepage investigation, June 26–28, 2012.—Continued
[ID, identification number; site ID: see table 1 and figures 1 and 2 for location of sites. °C, degrees Celsius; μS/cm, microsiemens per centimeter; ft³/s, cubic foot per second ; ──, not applicable; ADCP, acoustic Doppler current meter; ADV, acoustic Doppler velocimeter; EST, estimate; reported-MDI, instantaneous discharge computed from the reported mean daily total discharge; E, excellent (within 2 percent); G, good (within 5 percent); F, fair (within 8 percent); P, poor (greater than 8 percent); U, unspecified (rated as fair, within 8 percent); LB, left bank; RB, right bank; Av, measurement average]

Methods 9
Site ID Sample dateSample time
(military)
Water temperature
(°C)
Specific conductance at 25 °C (μS/cm)
Instantaneous discharge
measurement (ft³/s)
Discharge measurement
type
Discharge rating
45 6/28/2012 1028 25.5 759 0.42 EST P46 6/28/2012 1036 25.6 772 1.00 EST P47 6/28/2012 1045 26.3 713 0.25 EST P48 6/28/2012 1053 ── ── ── ── E49 6/28/2012 1106 29.1 1,340 6.00 Reported-MDI P50 6/28/2012 1120 26.9 775 0.03 EST P51 6/28/2012 1115 ── ── ── ── E52 6/28/2012 1135 ── ── ── ── E53 6/28/2012 1138 ── ── ── ── E54 6/28/2012 1145 26.6 782 0.01 EST P55 6/28/2012 1150 29.2 2,094 1.50 Reported-MDI P56 6/28/2012 1156 ── ── ── ── E56A 6/28/2012 1210 22.9 769 0.02 EST P57 6/28/2012 1132 29.3 66 0.01 EST P58 6/28/2012 1013 26.4 745 9.39 ADV G59 6/28/2012 1149 27.8 738 395 ADCP F59 6/28/2012 1231 28.3 771 394 ADCP F59 6/28/2012 1302 29.0 760 397 ADCP F59 6/28/2012 1335 29.6 760 385 ADCP F59 6/28/2012 1409 30.2 767 393 ADCP F59 6/28/2012 1442 30.7 770 396 ADCP F59 6/28/2012 1519 31.3 771 392 ADCP F59 6/28/2012 1559 31.7 772 399 ADCP F59 6/28/2012 1632 31.9 776 405 ADCP F59 6/28/2012 1709 32.0 779 413 ADCP F59A 6/28/2012 1009 ── ── ── ── E60 6/28/2012 1201 28.7 725 3.21 ADV G61 6/28/2012 1257 ── ── ── ── E62 6/28/2012 1305 27.4 741 3.66 ADV G63 6/28/2012 1315 28.2 742 3.62 ADV G64 6/28/2012 1416 26.7 823 11.0 ADV G65 6/28/2012 1433 ── ── ── ── E66 6/28/2012 1445 28.6 789 6.36 ADV P67 6/28/2012 1500 ── ── ── ── E68 6/28/2012 1700 31.2 345 8.88 ADCP P69 6/28/2012 1020 25.4 (Av) 822 (Av) 399 ADCP F69 6/28/2012 1125 26.3 (Av) 814 (Av) 393 ADCP F69 6/28/2012 1203 26.0 875 388 ADCP F69 6/28/2012 1232 28.4 873 385 ADCP F69 6/28/2012 1334 29.4 781 (Av) 385 ADCP F69 6/28/2012 1417 30.0 900 383 ADCP F69 6/28/2012 1526 30.5 (Av) 746 (Av) 376 ADCP F69 6/28/2012 1619 30.5 (Av) 796 (Av) 370 ADCP F69 6/28/2012 1656 30.8 872 370 ADCP F

10 Seepage Investigation on the Rio Grande from Below Caballo Reservoir, New Mexico, to El Paso, Texas, 2012
Seepage Computation
The mass balance equation used for calculating net seepage gain or loss in a reach is as follows (Simonds and Sinclair, 2002):
(1)
where QG is the net seepage gain or loss for a reach, in
cubic feet per second; Qds is the discharge measured at the downstream
end of the reach, in cubic feet per second; Qin is the sum of inflows, in cubic feet per second; Qus is the discharge measured at the upstream end
of the reach, in cubic feet per second; and Qout is the sum of the outflows, in cubic feet per
second.The result is the estimated net flux of water gained or lost from the river for the reach. Positive values indicate a gaining reach, and negative values indicate a losing reach. If Qds is greater than Qus plus Qin minus Qout, then the algebraic sign of the estimated flux is positive (+), which signifies a gain for that reach. Conversely, if Qds is less than Qus plus Qin minus Qout (that is, if less discharge was measured at the downstream section of the reach than was measured at the upstream section plus any inflow to that reach and minus any outflows [equation 1]), then the algebraic sign of the estimated flux in equation 1 is negative (-), which signifies a loss.
Estimation of UncertaintyThe percentage of uncertainty for individual discharge
measurements was determined by a qualitative evaluation of the measurement uncertainty and a subjective evaluation by the hydrographer considering objective factors that could affect measurement quality (Sauer and Meyer, 1992). These factors include number and distribution of vertical sections where velocity is measured, average velocity, uniformity of flow, regularity and firmness of channel bottom, steadiness of stage and discharge during the measurement, and presence or absence of ice, wind, or debris in the flow that could affect the ability of the current meter to accurately measure the current velocity (Wilberg and Stolp, 2005). If a site had zero flow (dry channel), then the uncertainty for that individual measurement was 0, and the uncertainty for that measurement did not contribute numerically to the cumulative uncertainty estimation for the reach. For purposes of computation, the uncertainty in the measurement of discharge was assigned a numerical value as follows: dry channel, 0 percent; excellent, 2 percent; good, 5 percent; fair, 8 percent; and poor, 10 percent.
The cumulative measurement uncertainty estimation associated with the computed net seepage gain or loss for a reach was determined by the following equation (Wheeler and Eddy-Miller, 2005):
(2)
where δQG is the absolute value of the cumulative
measurement uncertainty in the computation of seepage gain or loss, in cubic feet per second;
a1, a2,... an is measurement uncertainty, in percent; and Q1, Q2,... Qn is the measured discharge, in cubic feet per
second. A gain or loss was determined to be substantial when it
exceeded the cumulative uncertainty associated with the net seepage computation.
Net Seepage Gain or Loss and Estimation of Uncertainty
Wilberg and others (2001) developed a technique used to determine if the difference between discharge measured at upstream and downstream sites in a specified reach exceeded the cumulative measurement uncertainty at those sites. Each reach was normalized to the maximum discharge within that reach to allow for comparison between reaches with varying discharges. These computations, as modified from Wilberg and Stolp (2005), are as follows:
(3)
where Nd is the normalized seepage difference, in
percent; and MaxQ is the maximum discharge measured along a
reach as either the downstream discharge plus any outflow or the upstream discharge plus any inflow, in cubic feet per second.
(4)
where Ne is the normalized cumulative uncertainty, in
percent.A computed loss or gain for a reach is considered
substantial if the normalized percentage difference (Nd%) was greater than or equal to the normalized percentage uncertainty (Ne%).
Q Q Q Q QG ds in us out�= − − +
δQ a Q a Q a QG n n= ± ⋅( ) + ± ⋅( ) …+ ± ⋅( )1 12
2 22 2 �
N QMaxQd
G
Q Q Q Qus in ds out
= ×+( ) + ( )
100
N QMaxQe
G
Q Q Q Qus in ds out
= ± ×+( ) +
δ
( )
100

Results of Seepage Investigation on the Rio Grande from Below Caballo Reservoir, New Mexico, to El Paso, Texas 11
Results of Seepage Investigation on the Rio Grande from Below Caballo Reservoir, New Mexico, to El Paso, Texas
The seepage investigation focused on a 106-mile reach of the Rio Grande and included 73 measurement locations from site 1 below Caballo Reservoir, N. Mex., to site 69, the Rio Grande at El Paso streamgage, in Texas (fig. 1; table 1). Releases and diversions were coordinated with the Bureau of Reclamation, Elephant Butte Irrigation District, and El Paso County Water Improvement District No. 1 to provide stable flow conditions during the course of the investigation. Of the 73 measurement locations, a total of 39 sites had measurable discharge (5 river sites, 4 diversions, and 30 inflow sites), with specific conductance and water temperature measured at each site (table 2). The averages of multiple instantaneous discharge measurements at main-stem sites 1, 22, 41, 59, and 69 (table 2) on days of data collection for a specific reach were used for the instantaneous discharge measurement values that are used in the computation of gain and loss.
Reach 1, Rio Grande Below Caballo Reservoir (Site 1) to Rio Grande at Haynor Bridge (Site 22)
Reach 1 consists of 31.1 miles along the Rio Grande from site 1 below Caballo Reservoir to site 22 at Haynor Bridge (fig. 1). Of the 22 measurement locations, a total of 9 sites had measurable discharge (2 river, 1 diversion, and 6 inflow sites; table 3), with specific conductance and water temperature measured at each site (table 2). Zero flow was observed at 1 diversion and 12 inflow sites.
Uncertainty in the measurement of discharge was good at sites 1, 3A, and 22 (table 2). All measured inflow sites were rated fair to poor. The discharge measurement at site 15 was not assigned any measurement uncertainty at the time of collection and was categorized as unspecified; a rating of fair was assigned for the purpose of analysis on the basis of the discharge and channel conditions. Discharge measured on June 26 at site 1 (average of 1,670 cubic feet per second [ft3/s]) and site 22 (average of 1,420 ft3/s) indicated stable flow conditions on the basis of variability of multiple measurements at each site (tables 2 and 3). The computed net seepage gain or loss was less than the cumulative uncertainty, indicating that the estimated gain or loss within Reach 1 cannot be considered substantial. The sum of seepage gains and losses within the reach was a loss of 66.8 ft3/s (table 3).
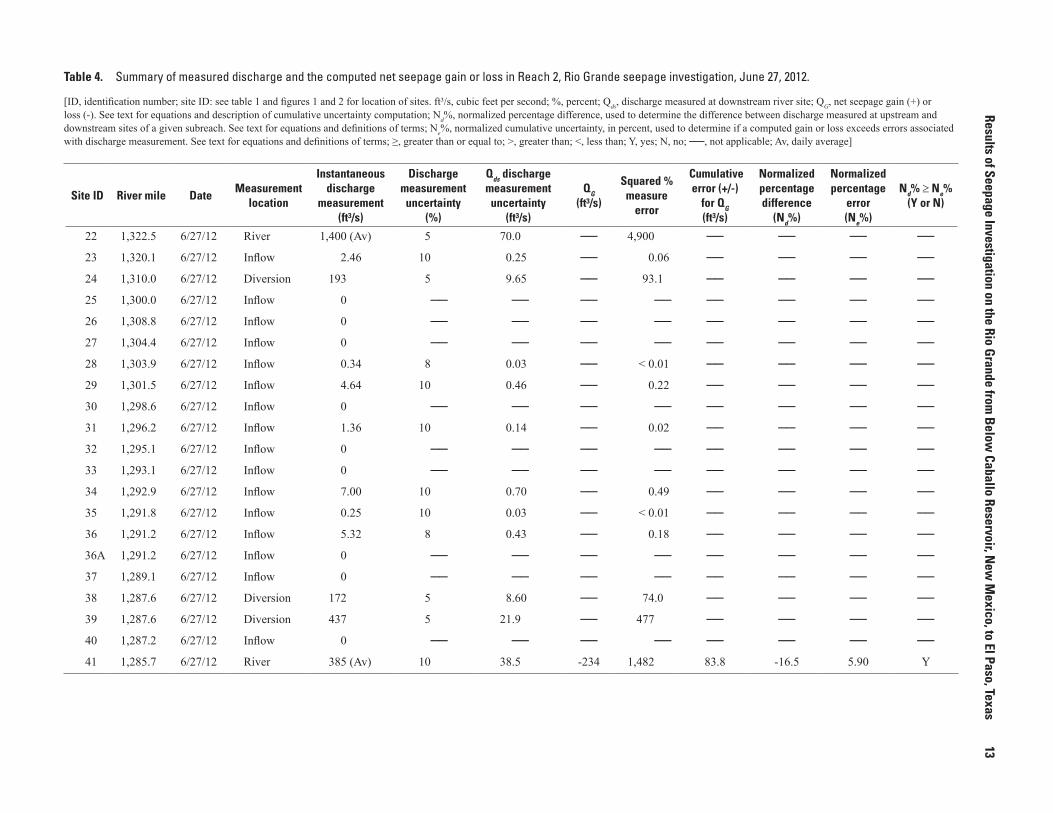
Reach 2, Rio Grande at Haynor Bridge (Site 22) to Rio Grande Below Mesilla Diversion Dam (Site 41)
Reach 2 consists of 36.8 miles along the Rio Grande and includes sites 22 to 41 beginning at Haynor Bridge and ending below Mesilla Diversion Dam (fig. 1). Of the 21 measurement locations, a total of 12 sites had measurable discharge (2 river, 3 diversion, and 7 inflow sites; table 4), with specific conductance and water temperature measured at each site (table 2). Zero flow was observed at 9 inflow sites.
Uncertainty in the measurement of discharge was good at sites 22, 24, 38, and 39 (table 2). All measured inflow sites were rated fair to poor. Site 28 was not assigned any measurement uncertainty at the time of collection and was categorized as unspecified; site 28 was categorized as fair for the purpose of analysis on the basis of the discharge and channel conditions. Discharge measured on June 27 at site 22 (average of 1,400 ft3/s) and site 41 (average of 385 ft3/s) indicated stable flow conditions on the basis of variability of multiple measurements at each site (tables 2 and 4). The computed net seepage gain or loss was greater than the cumulative uncertainty, indicating that seepage losses across the reach were substantial. The sum of seepage gains and losses within the reach was a loss of 234 ft3/s (table 4).
Reach 3, Rio Grande from Below Mesilla Diversion Dam (Site 41) to Rio Grande at Anthony–EP No. 1 (Site 59)
Reach 3 consists of 19.8 miles along the Rio Grande and includes sites 41 to 59 beginning below Mesilla Diversion Dam and ending at the Rio Grande at Anthony–EP no. 1 (fig. 1). Of the 21 measurement locations, a total of 14 sites had measurable discharge (2 river and 12 inflow sites; table 5), with specific conductance and water temperature measured at each site (table 2). Zero flow conditions were observed at seven inflow sites.
Uncertainty in the measurement of discharge was good at inflow site 58 (table 2). All river sites were rated fair, and the other measured inflow sites were rated poor. Discharge measured on June 28 at site 41 (average of 345 ft3/s) and site 59 (average of 397 ft3/s) indicated stable flow conditions on the basis of variability of multiple measurements at each site (tables 2 and 5). The computed net gain or loss was less than the cumulative uncertainty, indicating that the estimated gain or loss in Reach 3 cannot be considered substantial. The sum of seepage gains and losses within the reach was a gain of 33.0 ft3/s (table 5).

12
Seepage Investigation on the Rio Grande from Below
Caballo Reservoir, New
Mexico, to El Paso, Texas, 2012
Table 3. Summary of measured discharge and the computed net seepage gain or loss in Reach 1, Rio Grande seepage investigation, June 26, 2012.
[ID, identification number; site ID: see table 1 and figures 1 and 2 for location of sites. ft³/s, cubic feet per second; %, percent; Qds, discharge measured at downstream river site; QG, net seepage gain (+) or loss (-). See text for equations and description of cumulative uncertainty computation; Nd%, normalized percentage difference, used to determine the difference between discharge measured at upstream and downstream sites of a given subreach. See text for equations and definitions of terms; Ne%, normalized cumulative uncertainty, in percent, used to determine if a computed gain or loss exceeds errors associated with discharge measurement. See text for equations and definitions of terms; ≥, greater than or equal to; >, greater than; <, less than; Y, yes; N, no; ──, not applicable; Av, daily average]
Site ID River mile DateMeasurement
location
Instantaneous discharge
measurement (ft³/s)
Discharge measurement uncertainty
(%)
Qds discharge measurement uncertainty
(ft³/s)
QG
(ft³/s)
Squared % measure
error
Cumulative error (+/-)
for QG (ft³/s)
Normalized percentage difference
(Nd%)
Normalized percentage
error (Ne%)
Nd% ≥ Ne% (Y or N)
1 1,355.6 6/26/12 River 1,670 (Av) 5 83.5 ── 6,972 ── ── ── ──
3 1,354.3 6/26/12 Diversion 0 ── ── ── ── ── ── ── ──
3A 1,354.3 6/26/12 Diversion 189 (Av) 5 9.45 ── 89.3 ── ── ── ──
4 1,351.2 6/26/12 Inflow 0 ── ── ── ── ── ── ── ──
5 1,347.1 6/26/12 Inflow 0 ── ── ── ── ── ── ── ──
6 1,344.3 6/26/12 Inflow 0.08 8 0.01 ── < 0.01 ── ── ── ──
7 1,342.4 6/26/12 Inflow 0.01 8 < 0.001 ── < 0.01 ── ── ── ──
8 1,339.0 6/26/12 Inflow 0.55 10 0.06 ── < 0.01 ── ── ── ──
9 1,337.8 6/26/12 Inflow 0 ── ── ── ── ── ── ── ──
10 1,336.6 6/26/12 Inflow 0 ── ── ── ── ── ── ── ──
11 1,336.4 6/26/12 Inflow 0 ── ── ── ── ── ── ── ──
12 1,335.8 6/26/12 Inflow 0 ── ── ── ── ── ── ── ──
13 1,335.3 6/26/12 Inflow 0 ── ── ── ── ── ── ── ──
14 1,333.9 6/26/12 Inflow 0 ── ── ── ── ── ── ── ──
15 1,333.5 6/26/12 Inflow 4.76 8 0.38 ── 0.15 ── ── ── ──
16 1,330.6 6/26/12 Inflow 0.10 8 < 0.01 ── < 0.01 ── ── ── ──
17 1,329.3 6/26/12 Inflow 0 ── ── ── ── ── ── ── ──
18 1,328.9 6/26/12 Inflow 0 ── ── ── ── ── ── ── ──
19 1,327.2 6/26/12 Inflow 0 ── ── ── ── ── ── ── ──
20 1,325.3 6/26/12 Inflow 0 ── ── ── ── ── ── ── ──
21 1,323.2 6/26/12 Inflow 0.25 10 0.03 ── < 0.01 ── ── ── ──
22 1,322.5 6/26/12 River 1,420 (Av) 5 71.0 -66.8 5,041 110 -3.98 6.56 N
Results of Seepage Investigation on the Rio Grande from Below
Caballo Reservoir, New
Mexico, to El Paso, Texas
13
Table 4. Summary of measured discharge and the computed net seepage gain or loss in Reach 2, Rio Grande seepage investigation, June 27, 2012.
[ID, identification number; site ID: see table 1 and figures 1 and 2 for location of sites. ft³/s, cubic feet per second; %, percent; Qds, discharge measured at downstream river site; QG, net seepage gain (+) or loss (-). See text for equations and description of cumulative uncertainty computation; Nd%, normalized percentage difference, used to determine the difference between discharge measured at upstream and downstream sites of a given subreach. See text for equations and definitions of terms; Ne%, normalized cumulative uncertainty, in percent, used to determine if a computed gain or loss exceeds errors associated with discharge measurement. See text for equations and definitions of terms; ≥, greater than or equal to; >, greater than; <, less than; Y, yes; N, no; ──, not applicable; Av, daily average]
Site ID River mile DateMeasurement
location
Instantaneous discharge
measurement (ft³/s)
Discharge measurement uncertainty
(%)
Qds discharge measurement uncertainty
(ft³/s)
QG
(ft³/s)
Squared % measure
error
Cumulative error (+/-)
for QG (ft³/s)
Normalized percentage difference
(Nd%)
Normalized percentage
error (Ne%)
Nd% ≥ Ne% (Y or N)
22 1,322.5 6/27/12 River 1,400 (Av) 5 70.0 ── 4,900 ── ── ── ──
23 1,320.1 6/27/12 Inflow 2.46 10 0.25 ── 0.06 ── ── ── ──
24 1,310.0 6/27/12 Diversion 193 5 9.65 ── 93.1 ── ── ── ──
25 1,300.0 6/27/12 Inflow 0 ── ── ── ── ── ── ── ──
26 1,308.8 6/27/12 Inflow 0 ── ── ── ── ── ── ── ──
27 1,304.4 6/27/12 Inflow 0 ── ── ── ── ── ── ── ──
28 1,303.9 6/27/12 Inflow 0.34 8 0.03 ── < 0.01 ── ── ── ──
29 1,301.5 6/27/12 Inflow 4.64 10 0.46 ── 0.22 ── ── ── ──
30 1,298.6 6/27/12 Inflow 0 ── ── ── ── ── ── ── ──
31 1,296.2 6/27/12 Inflow 1.36 10 0.14 ── 0.02 ── ── ── ──
32 1,295.1 6/27/12 Inflow 0 ── ── ── ── ── ── ── ──
33 1,293.1 6/27/12 Inflow 0 ── ── ── ── ── ── ── ──
34 1,292.9 6/27/12 Inflow 7.00 10 0.70 ── 0.49 ── ── ── ──
35 1,291.8 6/27/12 Inflow 0.25 10 0.03 ── < 0.01 ── ── ── ──
36 1,291.2 6/27/12 Inflow 5.32 8 0.43 ── 0.18 ── ── ── ──
36A 1,291.2 6/27/12 Inflow 0 ── ── ── ── ── ── ── ──
37 1,289.1 6/27/12 Inflow 0 ── ── ── ── ── ── ── ──
38 1,287.6 6/27/12 Diversion 172 5 8.60 ── 74.0 ── ── ── ──
39 1,287.6 6/27/12 Diversion 437 5 21.9 ── 477 ── ── ── ──
40 1,287.2 6/27/12 Inflow 0 ── ── ── ── ── ── ── ──
41 1,285.7 6/27/12 River 385 (Av) 10 38.5 -234 1,482 83.8 -16.5 5.90 Y

14
Seepage Investigation on the Rio Grande from Below
Caballo Reservoir, New
Mexico, to El Paso, Texas, 2012
Table 5. Summary of measured discharge and the computed net seepage gain or loss in Reach 3, Rio Grande seepage investigation, June 28, 2012.
[ID, identification number; site ID: see table 1 and figures 1 and 2 for location of sites. ft³/s, cubic feet per second; %, percent; Qds, discharge measured at downstream river site; QG, net seepage gain (+) or loss (-). See text for equations and description of cumulative uncertainty computation; Nd%, normalized percentage difference, used to determine the difference between discharge measured at upstream and downstream sites of a given subreach. See text for equations and definitions of terms; Ne%, normalized cumulative uncertainty, in percent, used to determine if a computed gain or loss exceeds errors associated with discharge measurement. See text for equations and definitions of terms; ≥, greater than or equal to; >, greater than; <, less than; Y, yes; N, no; ──, not applicable; Av, daily average]
Site ID River mile DateMeasurement
location
Instantaneous discharge
measurement (ft³/s)
Discharge measurement uncertainty
(%)
Qds discharge measurement uncertainty
(ft³/s)
QG
(ft³/s)
Squared % measure
error
Cumulative error (+/-)
for QG (ft³/s)
Normalized percentage difference
(Nd%)
Normalized percentage
error (Ne%)
Nd% ≥ Ne% (Y or N)
41 1,285.7 6/28/12 River 345 (Av) 8 27.6 ── 762 ── ── ── ──
42 1,283.9 6/28/12 Inflow 0 ── ── ── ── ── ── ── ──
43 1,283.3 6/28/12 Inflow 0.25 10 0.03 ── < 0.01 ── ── ── ──
44 1,281.5 6/28/12 Inflow 0 ── ── ── ── ── ── ── ──
44A 1,281.5 6/28/12 Inflow 0.12 10 0.01 ── < 0.01 ── ── ── ──
45 1,280.7 6/28/12 Inflow 0.42 10 0.04 ── < 0.01 ── ── ── ──
46 1,280.1 6/28/12 Inflow 1.00 10 0.10 ── 0.01 ── ── ── ──
47 1,277.5 6/28/12 Inflow 0.25 10 0.03 ── < 0.01 ── ── ── ──
48 1,275.2 6/28/12 Inflow 0 ── ── ── ── ── ── ── ──
49 1,274.3 6/28/12 Inflow 6.00 10 0.60 ── 0.36 ── ── ── ──
50 1,274.2 6/28/12 Inflow 0.03 10 < 0.01 ── < 0.01 ── ── ── ──
51 1,272.4 6/28/12 Inflow 0 ── ── ── ── ── ── ── ──
52 1,270.5 6/28/12 Inflow 0 ── ── ── ── ── ── ── ──
53 1,270.4 6/28/12 Inflow 0 ── ── ── ── ── ── ── ──
54 1,270.2 6/28/12 Inflow 0.01 10 < 0.01 ── < 0.01 ── ── ── ──
55 1,269.3 6/28/12 Inflow 1.50 10 0.15 ── 0.02 ── ── ── ──
56 1,268.0 6/28/12 Inflow 0 ── ── ── ── ── ── ── ──
56A 1,268.0 6/28/12 Inflow 0.02 10 < 0.01 ── < 0.01 ── ── ── ──
57 1,267.4 6/28/12 Inflow 0.01 10 < 0.01 ── < 0.01 ── ── ── ──
58 1,267.1 6/28/12 Inflow 9.39 5 0.47 ── 0.22 ── ── ── ──
59 1,265.9 6/28/12 River 397 (Av) 8 31.8 33.0 1,009 42.1 8.31 10.6 N

Results of Seepage Investigation on the Rio Grande from Below Caballo Reservoir, New Mexico, to El Paso, Texas 15
Reach 4, Rio Grande at Anthony–EP No. 1 (Site 59) to Rio Grande at El Paso (Site 69)
Reach 4 consists of 16.0 miles along the Rio Grande and includes sites 59 to 69 beginning at the Rio Grande at Anthony–EP no. 1 and ending at the Rio Grande at El Paso (fig. 1). Of the 12 measurement locations, a total of 8 sites had measurable discharge (2 river and 6 inflow sites; table 6), with specific conductance and water temperature measured at each site (table 2). Zero flow conditions were observed at four inflow sites.
Uncertainty in the measurement of discharge was good at sites 60, 62, 63, and 64 (table 2). All river sites were rated fair, and measured inflow sites were rated good or poor. Discharge measured on June 28 at site 59 (average of 397 ft3/s) and site 69 (average of 383 ft3/s) indicated stable flow conditions on the basis of variability of multiple measurements at each site (table 6). The computed net seepage gain or loss was greater than the cumulative uncertainty, indicating that losses occurred across the reach and were substantial compared to the uncertainties associated with measuring streamflow. The sum of gains and losses within the reach was a loss of 50.7 ft3/s (table 6).

16
Seepage Investigation on the Rio Grande from Below
Caballo Reservoir, New
Mexico, to El Paso, Texas, 2012
Table 6. Summary of measured discharge and the computed net seepage gain or loss in Reach 4, Rio Grande seepage investigation, June 28, 2012.
[ID, identification number; site ID: see table 1 and figures 1 and 2 for location of sites. ft³/s, cubic feet per second; %, percent; Qds, discharge measured at downstream river site; QG, net seepage gain (+) or loss (-). See text for equations and description of cumulative uncertainty computation; Nd%, normalized percentage difference, used to determine the difference between discharge measured at upstream and downstream sites of a given subreach. See text for equations and definitions of terms; Ne%, normalized cumulative uncertainty, in percent, used to determine if a computed gain or loss exceeds errors associated with discharge measurement. See text for equations and definitions of terms; ≥, greater than or equal to; >, greater than; <, less than; Y, yes; N, no; ──, not applicable; Av, daily average]
Site ID River mile DateMeasurement
location
Instantaneous discharge
measurement (ft³/s)
Discharge measurement uncertainty
(%)
Qds discharge measurement uncertainty
(ft³/s)
QG
(ft³/s)
Squared % measure
error
Cumulative error (+/-)
for QG (ft³/s)
Normalized percentage difference
(Nd%)
Normalized percentage
error (Ne%)
Nd% ≥ Ne% (Y or N)
59 1,265.9 6/28/12 River 397 (Av) 8 31.8 ── 1,009 ── ── ── ──
59A 1,265.9 6/28/12 Inflow 0 ── ── ── ── ── ── ── ──
60 1,264.7 6/28/12 Inflow 3.21 5 0.16 ── 0.03 ── ── ── ──
61 1,264.0 6/28/12 Inflow 0 ── ── ── ── ── ── ── ──
62 1,258.6 6/28/12 Inflow 3.66 5 0.18 ── 0.03 ── ── ── ──
63 1,258.0 6/28/12 Inflow 3.62 5 0.18 ── 0.03 ── ── ── ──
64 1,257.6 6/28/12 Inflow 11.0 5 0.55 ── 0.30 ── ── ── ──
65 1,256.0 6/28/12 Inflow 0 ── ── ── ── ── ── ── ──
66 1,254.1 6/28/12 Inflow 6.36 10 0.64 ── 0.40 ── ── ── ──
67 1,250.9 6/28/12 Inflow 0 ── ── ── ── ── ── ── ──
68 1,250.3 6/28/12 Inflow 8.88 10 0.89 ── 0.79 ── ── ── ──
69 1,249.9 6/28/12 River 383 (Av) 8 30.6 -50.7 939 44.1 -11.7 10.2 Y

References Cited 17
Summary
A seepage investigation was conducted in 2012 on the Rio Grande from below Caballo Reservoir, New Mexico, to El Paso, Texas, by the U.S. Geological Survey, in cooperation with the New Mexico Interstate Stream Commission. A total of 73 sites including river channel, diversions, and inflows associated with irrigation systems were selected for four reaches on the Rio Grande. The most upstream site was located immediately below Caballo Reservoir, and the most downstream site was located at the U.S. Geological Survey streamgage Rio Grande at El Paso.
Discharge was measured at 40 of the 73 sites during June 26–28, 2012, during the irrigation season at high flow. Cumulative gains or losses, which include estimated seepage gains or losses, were calculated for each of the four reaches by using the instantaneous discharge values for each site. Reach 1 had a calculated loss of 66.8 cubic feet per second (ft3/s) that was less than the estimated measurement uncertainty. Reach 2 had a calculated loss of 234 ft3/s that was greater than the estimated measurement uncertainty. Reach 3 had a calculated gain of 33.0 ft3/s that was less than the estimated measurement uncertainty. Reach 4 had a calculated loss of 50.7 ft3/s that was greater than the estimated measurement uncertainty.
References Cited
Bureau of Reclamation, 2008, Operating agreement for the Rio Grande Project: Bureau of Reclamation, 23 p. [Also available at http://www.usbr.gov/uc/albuq/rm/RGP/pdfs/Operating-Agreement2008.pdf.]
Crilley, D.M., Matherne, A.M., Thomas, Nicole, and Falk, S.E., 2013, Seepage investigations of the Rio Grande from below Leasburg Dam, Leasburg, New Mexico, to above American Dam, El Paso, Texas, 2006–13: U.S. Geological Survey Open-File Report 2013–1233, 34 p.
Hendricks, E.L., 1964, Compilation of records of surface waters of the United States, October 1950 to September 1960: U.S. Geological Survey Water-Supply Paper 1732, 574 p. [Also available at http://pubs.usgs.gov/wsp/1732/report.pdf.]
Kilpatrick, F.A., and Schneider, V.R., 1983, Use of flumes in measuring discharge: U.S. Geological Survey Techniques of Water-Resources Investigations, book 3, chap. A14, 46 p. [Also available at http://pubs.usgs.gov/twri/twri3-a14/.]
Nolan, K.M., and Shields, R.R., 2000, Measurement of stream discharge by wading: U.S. Geological Survey Water-Resources Investigations Report 00–4036, CD-ROM.
Oberg, K.A., Morlock, S.E., and Caldwell, W.S., 2005, Quality assurance plan for discharge measurements using acoustic Doppler current profilers: U.S. Geological Survey Scientific Investigations Report 2005–5183, 35 p. [Also available at http://pubs.usgs.gov/sir/2005/5183/SIR_2005-5183.pdf.]
Rantz, S.E., and others, 1982, Measurement and computation of streamflow, volume 1—Measurement of stage and discharge: U.S. Geological Survey Water-Supply Paper 2175, 284 p. [Also available at http://pubs.usgs.gov/wsp/wsp2175/.]
Sauer, V.B., and Meyer, R.W., 1992, Determination of error in individual discharge measurements: U.S. Geological Survey Open-File Report 92–144, 21 p. [Also available at http://pubs.usgs.gov/of/1992/ofr92-144/.]
Simonds, F.W., and Sinclair, K.A., 2002, Surface water-groundwater interactions along the Lower Dungeness River and vertical hydraulic conductivity of streambed sediments, Clallam County, Washington, September 1999–July 2001: U.S. Geological Survey Water-Resources Investigations Report 02–4161, 60 p.
Turnipseed, D.P., and Sauer, V.B., 2010, Discharge measurements at gaging stations: U.S. Geological Survey Techniques and Methods, book 3, chap. A8, 87 p. [Also available at http://pubs.usgs.gov/tm/tm3-a8/.]
Wheeler, J.D., and Eddy-Miller, C.A., 2005, Seepage investigation on selected reaches of Fish Creek, Teton County, Wyoming, 2004: U.S. Geological Survey Scientific Investigations Report 2005–5133, 22 p.
Wilberg, D.E., and Stolp, B.J., 2005, Seepage investigation and selected hydrologic data for the Escalante River drainage basin, Garfield and Kane Counties, Utah, 1909–2002: U.S. Geological Survey Scientific Investigations Report 04–5233, 39 p. [Also available at http://pubs.usgs.gov/sir/2004/5233/PDF/SIR2004_5233.pdf.]
Wilberg, D.E., Swenson, R.L., Slaugh, B.A., Howells, J.H., and Christiansen, H.K., 2001, Seepage investigation for Leap, South Ash, Wet Sandy, and Leeds Creek in the Pine Valley Mountains, Washington County, Utah, 1998: U.S. Geological Survey Water-Resources Investigations Report 01–4237, 42 p.
Wilde, F.D., and Radtke, D.B., eds., variously dated, Field measurements: U.S. Geological Survey Techniques of Water-Resources Investigations, book 9, chap. A6. [Also available at http://water.usgs.gov/owq/FieldManual/Chapter6/Ch6_contents.html.]
Publishing support provided byLafayette Publishing Service Center

18 Seepage Investigation on the Rio Grande from Below Caballo Reservoir, New Mexico, to El Paso, Texas, 2012

Gunn and Roark—
Seepage Investigation on the Rio Grande from Below
Caballo Reservoir, New
Mexico, to El Paso, Texas, 2012—
SIR 2014–5197
ISSN 2328-0328 (online)http://dx.doi.org/10.3133/sir20145197