segmentation of the car market in china
TRANSCRIPT

Segmentation of the car
market in China
2013
Authors: Adrien SAINT
Imran SYED
Tutor: Anders Pehrsson
Examiner: Sarah Philipson
Subject: Marketing
Level: Master

1
Table of Contents
Abstract ...................................................................................................................................... 5
1. Introduction ............................................................................................................................ 6
1.1 Background ...................................................................................................................... 6
1.1.1 The growing Chinese car market ............................................................................... 6
1.1.2 Government intervenes to control the car market ..................................................... 7
1.1.3 Changes in Chinese market segments ....................................................................... 7
1.2 Problematization ........................................................................................................... 7
1.3 Research questions ........................................................................................................... 8
1.4 Problem formulation ........................................................................................................ 9
1.5 Delimitations .................................................................................................................... 9
1.6 Outline of the thesis.......................................................................................................... 9
2. Theory .................................................................................................................................. 10
2.1 Market segmentation ...................................................................................................... 10
2.2 Bases for Market Segmentation ..................................................................................... 11
2.2.1 Geographic segmentation ........................................................................................ 11
2.2.2 Demographic segmentation ..................................................................................... 12
2.2.3 Psychographic segmentation ................................................................................... 13
2.2.4 Behavioural segmentation ....................................................................................... 13
2.3 Macro Segmentation ...................................................................................................... 14
2.4 Micro segmentation ........................................................................................................ 15
2.5 Hybrid segmentation: the mix of micro and macro segmentations ................................ 15
2.6 Dynamic segmentation: the predictive implication of segmentation ............................. 16
2.7 State-of-the-art ............................................................................................................... 16
2.8 Model, how the constructs relate.................................................................................... 19
3. Methodology ........................................................................................................................ 21
3.1 Introduction .................................................................................................................... 21
3.2 Population and sample ................................................................................................... 21
3.2.1 Data collection method ............................................................................................ 22
3.2.2 Questionnaire Design .............................................................................................. 22
3.3 Operationalization .......................................................................................................... 23
3.4 Data analysis method ..................................................................................................... 28
3.5 Validity ........................................................................................................................... 28
3.6 Reliability and Replicability........................................................................................... 29

2
4. Empirical Data ..................................................................................................................... 31
4.1 Geographic data: ............................................................................................................ 31
4.2 Demographic data: ......................................................................................................... 31
4.3 Behavioural data:............................................................................................................ 32
4.3.1 Customer behaviour explained by Geographic data ................................................ 33
4.3.2 Customer behaviour explained by Demographics: .................................................. 34
4.4 Psychographic data:........................................................................................................ 35
4.4.2 Respondent’s opinion on global preferences ........................................................... 36
4.4.3 Car owners’ current preferences .............................................................................. 37
4.4.4 Car owners’ preferences for their next purchase ..................................................... 40
4.4.5 Non-car owners’ preferences for their first purchase .............................................. 43
4.5 Macro data for the dynamic aspect ................................................................................ 45
5. Analysis................................................................................................................................ 49
5.1 Control Variables ........................................................................................................... 49
5.2 Hybrid Behavioural segmentation .................................................................................. 49
5.3 Hybrid Psychographic segments .................................................................................... 50
5.4 Dynamic Hybrid Psychographic segments .................................................................... 52
6. Conclusion and discussion ................................................................................................... 53
7. Managerial implications, reflections, further research ........................................................ 55
7.1 Managerial implications ................................................................................................. 55
7.2 Reflections ...................................................................................................................... 57
7.3 Limitations ..................................................................................................................... 58
7.4 Future Research .............................................................................................................. 58
References ................................................................................................................................ 60
Appendix A .............................................................................................................................. 64
The Survey ........................................................................................................................... 64
Survey emails ................................................................................................................... 68
Descriptive statistics ............................................................................................................. 71
Appendix B
Linear regression analysis and linear curve estimates ............................................................. 77
B.1. Customer behaviour explained by Geographic and Demographic data ....................... 77

3
B.1.1. Region of residence ................................................................................................ 77
B.1.2. Degree of urbanisation. .......................................................................................... 80
B.1.3. Behaviour by age ................................................................................................... 82
B.1.4. Behaviour by Gender ............................................................................................. 84
B.1.5. Behaviour according to annual income.................................................................. 87
B.2. Psychographic data by Demographic and Geographic ................................................. 89
B.2.1. Psychographs by age .............................................................................................. 89
B.2.2. Psychographs by gender. ..................................................................................... 103
B.2.3. Psychographics with Annual income (Yuan) ...................................................... 115
B.2.4. Psychographics by region of residence. ............................................................... 127
B.2.5. psychographics by degree of urbanisation ........................................................... 143
B.3. Customer psychographics by behaviours ................................................................... 156
B.3.1. Psychographics by car replacement rate .............................................................. 156
B.3.2. Psychographics by experience ............................................................................. 169
B.3.3. Psychographics with frequency of use ................................................................. 187
B.3.4. Psychographics by non-car owners who plan to have a car in the future. ........... 201
B.3.5. psychographics by style of use; long trips ........................................................... 216
B.3.6. Psychographics by style of use; short trips .......................................................... 229
B.3.7. Car owners preferences for the next purchase by loyalty. ................................... 242

4
ACKNOWLEDGMENT
This thesis was written between March 20th 2013 and May 25th 2013, at the Linnaeus
University, Campus Växjö. The authors have received support from several people during
this period. In this acknowledgment page they want to thank all these wonderful people, for
their assistance during this thesis.
First of all we would like to thank their examiner Doctor Sarah Philipson who has been
giving the authors support, feedback and inspiration. The authors would also like to thank
their tutor Professor Anders Pehrsson who has supported them by giving much needed
feedbacks and inspiration; he has also given inputs in developing the model used throughout
the thesis. The authors also want to send out their gratitude to the respondents of their survey.
Their contribution to the thesis has been of great value and the authors are very much
thankful for their precious time.
Växjö, May 25th, 2013
Imran Syed Adrien Saint

5
Abstract
The Chinese car market has, through the last decade evolved into the major market in the
world. Its car market from has become the world’s largest market from 2009 until today.
With the emerging market that is China, the demand for cars is supposed to grow even more
in the next decade.
The thesis starts by studying the theories of consumer market segmentation with a hybrid and
dynamic aspect. A quantitative investigation was conducted with the help of a survey. The
survey was sent out to car consumers and potential car consumers who are residing in China.
From this study the authors were able to anticipate possible preferential profiles.
Keywords: China, market segmentation, cars, hybrid

6
1. Introduction
1.1 Background
The history of the automobile is complicated and rich. It dates back to the 15th century, when
Leonardo da Vinci was designing and modelling transport vehicles (library of congress,
2013-3-22). According to the library of congress (2013-3-22) Nicolas Joseph Cugnot built the
first self-propelled vehicle for the French army in 1769. 1832-1839, Robert Anderson in
Scotland built an electric carriage. George Baldwin Selden integrated an internal combustion
engine in the United States in 1876/95.
The first companies to produce automobiles for the public market emerged in 1896,
manufacturing electric gas-powered vehicles (Bentley historical library, 2013-3-22). The love
of cars and their ever-growing necessity in our lives has increased the number of automobiles
to an estimate of over 1 billion vehicles in 2010, from 500 million in 1986 (Autos Cars, 2013-
3-22).
1.1.1 The growing Chinese car market
During the last two decades social and economic events have brought immense opportunities
in soaring emerging markets. Many multinational corporations have made substantial
investments in these countries, as a part of their global expansion strategies, creating more
and more jobs thus increasing the purchasing power of customers. Such an emerging market
is China (Cui, & Liu, 2000).
Half a century ago bicycles were considered a mark of family fortune in China (The guardian,
2013-3-22). Since then, China has become the world’s largest automobile producer and the
largest market with annual sales of some 14 million vehicles in 2009, continuing to expand in
2010 according to APCO (2013-3-22).
The growing car industry does not only give direct economic benefits and a growing number
of car dealerships. It also has powerful multiplier effects for other sectors, like fuelling steel
production and other industries (The guardian, 2013-3-22).
7
1.1.2 Government intervenes to control the car market
The Chinese government has implemented a number of tax adjustments and subsidies for
hybrid electric vehicles, electric vehicles, and traditional vehicles with small engine
displacement, attempting to impact the national consumption (APCO, 2013-3-22).
1.1.3 Changes in Chinese market segments
Richard Cant of Dezan Shira & Associates at the HSBC International Exchange to China said
“For the first time ever there are more people living in China’s cities than in the countryside
and this trend will only continue,” (HSBC, 2013-3-22). There is an increasing middle class in
China (HSBC, 2013-3-22). The Chinese consumers are now spending their disposable
income rather than saving it, as they did before. They are also educated, skilled, price savvy
and internet savvy (HSBC, 2013-3-22). Foreign brands, principally for visible products, are
very popular and trendy among China’s young consumers, as they have status appeal (HSBC,
2013-3-22).
McKinsey (2013-3-22) points out that more of China’s middle class is shifting to premium
cars, notably foreign cars like VW, BMW, Volvo, Aston Martin, et cetera. McKinsey (2013-
3-22) also states in his report that on average Chinese families change car every six to eight
years on average. Premium car owners say that they would like to change their car two to
three years ahead of the average (McKinsey 2013-3-22).
1.2 Problematization
The Chinese customers have shown a strong interest in cars, making it a challenging
environment for marketers, and the industry now sees the market as the most important in the
world. The demand evolved radically and is prone to continue changing. As the Chinese car
market is emerging, the marketing processes are evolving with it as the market changes really
quickly. Segmentation, a key marketing process to reach customers, has to be very efficient
for car manufacturers that want to perform well in the Chinese car market.
The Chinese car market is the most important to consider nowadays for a constructor, and yet
remains really mysterious. Despite the quantities produced being easily sold, no qualitative
trend can be observed, and only absolutely attractive quantities trends are observable. But the
constructors cannot rely forever on the quantities and have to choose a strategy in order to

8
gain market shares on the promising market and be ahead of the competition in the heart of
Chinese people. This is where the importance of segmenting efficiently the market appears.
Segmentation can be made on basic macro dimensions: economic, geographic, culture & and
technology (Grundy, 2006). Specific segments can also be identified by carrying out
segmentation based on micro dimensions, such as life styles, behaviors etcetera (West, Ford
and Ibrahim, 2006). Those segmentation styles are chosen by car makers and have a static
dimension, and feature no flexibility or enough details to gain a clear understanding of the
demand.
The whole environment affecting the segments is bound to evolve (Grundy, 2006). This will
leave the company marketing their cars in an obsolete way, positioning themselves on
segments that they could not target as efficiently, as if they were adapting to them. The
surroundings of car manufacturers are influencing the way segmentation is carried out and in
its results. In this emerging market, with its quickly changing environment, “hybrid
segmentation”; mixing different styles of segmentations, is said to be necessary to have
detailed customer segments (Hassan, Craft and Kortam, 2003).
Micro and macro dimensions are connected and influencing each other continuously, causing
a challenge for companies as their segments evolves (Cannon and Yaprak, 2011). Marketers
and academics like Hasan, Craft and Kortam (2003); Amine and Smith (2009); Cannon and
Yaprak (2011); and Quinn, Hines, and Bennison (2007) have discussed the mix of macro and
macro to anticipate possible segmentation, these studies are rather recent. But there has been
little studies done on segmenting the Chinese car consumers. The study of consumer
preferences of the Chinese car consumers is there for a gap to be recognised. Finding the
different segments and build predictions of their evolution in the near future is a really
practical source of information to actually serve the challenges imposed to firms marketing
cars in China.
1.3 Research questions
What are the main profiles of customers on the Chinese car market?
Can any preferential profiles be anticipated for the near future?

9
1.4 Problem formulation
The purpose of this paper is to study customer segmentation in the Chinese new car market,
and the changes and movements of segmentation that could be predicted for the next
purchase.
1.5 Delimitations
The study is delimited in time and location. The research is made only on the Chinese market
of new cars. The focus is also time-based since the authors will study trends for the next
purchase.
1.6 Outline of the thesis
This thesis continues with a theory chapter containing an introduction about market segmentation
and continues explaining the four vital variables of market segmentation with the heading bases
for market segmentation and the four variables will be explained with the sub-headings
Geographic, Demographic, Psychographic and Behavioural. Then further in the theory chapter
the micro and macro segmentation are explained. Furthermore in the Hybrid segmentation the
mixing and links between macro and micro segmentation are explained. A state-of-the-art
subchapter also explains the acceptability and readability of the sources being used. Further are
the research questions presented and next chapter concerns the methodology part. This chapter
brings up for example the following subheadings; populations and sample, data collection
method, questionnaire design, operationalization, validity and reliability. After this follows the
empirical chapter which consists of summary presentation of the empirical data the authors have
gathered. Next is the analysis chapter which is created by interpreting the empirical data, with the
theory, connected to the background. The second-to-last chapter is the conclusion, which consists
of the findings and results that have been made in the thesis. Also theoretical and managerial
implications, limitations, proposed future research are brought up at the end of the thesis. The
authors’ own reflections are being presented at the last.

10
2. Theory
The four ‘Ps’ of strategic marketing is useful to analyse a marketplace according to Kotler
(1989).
He terms them as ‘probing’. The second step is ‘partitioning’ the market; this is the process
of segmenting clusters of the customers of a market. The third step is ‘prioritising’ the market
segments that a company has possibly greater advantage in pursuing. The fourth step is
‘positioning’; “pinpointing the competitive options in each segment that you're going to
target.” (Kotler, 1989). Partitioning is the term referring to customer segmentation, which is
the focus of the thesis.
2.1 Market segmentation
Market segmentation is an essential element of marketing for goods and services. The
recognition of heterogenic demand needs to be considered before a newly produced product
is being considered to be sold in a market (Wedel and Kamakura, 2000).
Markets as a whole are not entirely homogeneous (Beane and Ennis, 1987). Market segments
are homogeneous subsets of consumers in a particular market (West et al., 2006). Market
segmentation is a vital process to succeed, identifying suitable segments of consumers with
shared preferences for targeting purposes (West et al., 2006; Kotler and Keller, 2009).
Beane and Ennis (1987) gave the following major reasons for market segmentation:
(1) To look for new product opportunities or areas that may be accessible to current
product repositioning; and
(2) To create improved advertising messages by gaining a better understanding of
one’s customers.
In segmenting a market to sell a product it is not necessary to identify all segments, only the
groups that appear to be yearning for the product (Beane and Ennis, 1987).
There are many ways to assess market segmentation. To determine its effectiveness and
profitability some criteria have often been put forward: identifiability, measurability,
sustainability, accessibility, responsiveness and actionable (Frank, Massy, and Wind, 1972;
Wedel and Kamakura, 2000; Beane and Ennis, 1987).

11
Identifiability and measurability are the extent to which marketers are able to distinguish and
approximately measure the clusters of customers according to its size, location and market
from within a market (Wedel and Kamakura, 2000; Beane and Ennis, 1987).
Sustainability/ stability; the segment must be large enough to justify attention (Beane and
Ennis, 1987). Kotler, in Beane and Ennis (1987) says: "a segment should be the largest
possible homogeneous group of buyers that it pays to go after with a specially designed
marketing program". Wedel and Kamakura (2000) states market segments that are steady for
a long enough period can provide a foundation for the development of successful market
segmentation
Accessibility; Segments must be accessible to the managers to some degree. It can be
accessible for example through promotional efforts or through secondary data (Wedel and
Kamakura, 2000).
Actionable; “Market segments are actionable if their identification provides guidance for
decision on the effective specification of the marketing instruments”, (Wedel and Kamakura,
2000).
2.2 Bases for Market Segmentation
There are many ways to segment a market, amongst those, Beane and Ennis (1987)
acknowledge Kotler to divide market segmentation variables into four main parts;
Geographic;
Demographic;
Psychographic;
Behavioural;
2.2.1 Geographic segmentation
Consumer demand or ways to fill that demand differ geographically. When a market is
geographically segmented it simply means that consumer are sub-categorised according to
the consumer needs geographically, it can be by region of a country, population density or
climate (Beane and Ennis, 1987; Kotler and Armstrong, 2011).

12
“Consumers in the Southeast use more vegetable shortening than in any other part of the US.
Since Northeastern and Midwestern regions have more locally unique beer drinking
segments, they have more small beer breweries than any other region. The consumption of
menthol cigarettes is greater in the Southeast than in any other region of the country”. These
are few examples given by Beane and Ennis (1987).
2.2.2 Demographic segmentation
Beane and Ennis (1987) refer to demographic segmentation to be the most prevailing variable
of market segmentation. They think that’s probably because consumers are placed on certain
scales of measurement that can easily be understood; information is easily gathered,
interpreted, and convertible from one study to another. Satisfying the segmentation criteria of
identifiability, substantiality, accessibility, and actionability (Wedel and Kamakura, 2000),
three of the most common demographic variables employed in domestic and international
segmentation include: age, gender, income (Beane and Ennis, 1987; Cleveland et al, 2011).
Examples are Life Stage vitamins (four types depending on age and sex) and disposable
diapers according to the age of infant (Beane and Ennis, 1987). Younger techno-savvy
individuals are less committed to definite patterns and are more open to new perspectives and
products especially when it comes to high-technology products (Cleveland et al., 2011).
It is well recognised that the demand for categories of goods and services alters as they age
and pass through the various life cycle stages (Cleveland et al., 2011).
Income also has a strongly effect on individuals demand or choice of a product (Cleveland, et
al., 2011). Consumers with higher- income tend to buy better and expensive products, which
are also status- enhancing, examples are household appliances, consumer electronics, and
luxury products (Cleveland, et al., 2011).
The demographic variable of gender also has a vital differentiating effect. Males and females
have different characteristics of consumer behaviour; in their shopping patterns, information
processing, judgment, responses to advertising, and the products they tend to buy (Cleveland,
et al., 2011).

13
2.2.3 Psychographic segmentation
According to Beane and Ennis (1987) psychographic or life-style segmentation is tougher to
describe as it is no longer looking at clearly definable, quantitative measures. Psychographic
segmentation, unlike geographic and demographic segmentation, reflects consumers’ choices
depending on personality, values and lifestyles, though there has been no clear agreement
about the variables that should be included (Lancaster and Williams, 2002; Kim and Lee,
2011; Wells, 1975).
Wells (1975), while writing a review article about psychographics, stated: “Twenty-four
articles on psychographics contain no less than 32 definitions, all somewhat different”. While
reviewing a Product-Specific Psychographic Profile Wells (1975) argued that when a
psychographic study is devoted to a product category, it is not essential to rely on item
diversity to get useful relationships. The investigator can focus upon a limited set of relevant,
product-related dimensions that would make more sense regarding the psychographic
dispositions of the population investigated towards the product in question.
Product-specific psychographic profile is a useful tool used to get insights of the market
dispositions towards a product. Such a study is investigating profiles through series of
questions about product attributes (Wells, 1975; Chin-Feng, 2002).
According to Chin-Feng (2002), products attributes are reliable to study personalities and life
styles. He states that the psychographics regarding a product are driven by the brand equity of
the current actors. Due to the personality associated to brands, clusters can be found
investigating the preferences of the customers. The analysis of personality traits and life
styles through their linkage to product attributes is preparing ground to the response an
individual can have when confronted with a purchase decision on the market (Chin-Feng,
2002).
2.2.4 Behavioural segmentation
Originally, benefit segmentation was categorised as a psychographic method, then classified
as behavioural (Kim and Lee, 2011). Kim and Lee (2011) points out “benefits are a function
of consumers’ beliefs about product offerings and promises, which motivate their purchase
decisions, and are therefore the basis of behavioural rather than psychographic
14
segmentation”. Behavioural segmentation pays less attention to economic or age related
issues unlike psychographic segmentation, and concentrates more on consumer related
behaviour, concentrating on psychological attributes and product orientation (Lancaster and
Williams, 2002).
Behavioural segmentation, segments consumers based on knowledge of the product, attitude,
or response to the product. This includes such areas as purchase occasion, benefits sought,
user status, degree of usage, degree of loyalty, readiness stage, and marketing factor
sensitivity (Beane and Ennis, 1987).
Holbrook and Hirschman (1982) recognise that people buy products not only for its use, but
also for what they signify or mean. Consumer behaviour also relates to the multi-sensory,
fantasy and emotive aspects of one's experience with products. These facets of consumer
behaviour are defined as Hedonic consumption; Multi-sensory means several sensory
modalities including tastes, sounds, scents, tactile impressions and visual images. Emotions
represent motivational phenomena with characteristic neurophysiological, expressive and
experiential factors; they include feelings such as joy, jealousy, fear, rage and rapture.
Holbrook and Hirschman (1982) further proposed:
Differences in consumer emotional and imaginary response to products are closely tied to a
variety of subcultural differences, for example ethnicity or nationality.
Differences in consumer emotional and imaginary response to products appear closely tied to
a variety of subcultural differences.
Consumers of many hedonic ally-experienced products are characterized by very distinctive
social class profiles.
2.3 Macro Segmentation
Macro segmentation is a segmentation method relying on macro data. Economic, political,
geographic and demographic are the variables in macro segmentation. These variables are
widely available as secondary data. (Gaston-Breton and Martín, 2011). Studying this
information gives a good insight of the market size and potential (Douglas and Craig, 2011).

15
2.4 Micro segmentation
Gaston-Breton and Martin (2011) stress the need of micro segmentation at a consumer level.
They present three classes of micro-segmentation that have been used in most European
segmentation studies, from product-specific characteristics, such as attitudes toward
attributes, to domain-specific features such as lifestyles, and general characteristics such as
central values. It is important to note that a country's culture has also been recognized as a
significant environmental trait and essential to understand systematic variances in behaviour
(Steenkamp, 2001). For example, markets around the world are getting more and more
cosmopolitan, but the consumption of local foods and fashions are across most countries
dominated by products compliant with the specific country’s ethnic identity (Cleveland et al,
2011).
Holbrook and Hirschman (1982) pointed out in an article some years back, about the different
aspect of consumption. He states that all products, no matter how ordinary they are, may
carry a symbolic significance. This significance in some cases is rich and noticeable to the
users. Holbrook and Hirschman (1982) also mention that many products projects essential
nonverbal indications that must be seen, heard, tasted, felt, or smelled to be appreciated
properly.
2.5 Hybrid segmentation: the mix of micro and macro segmentations
The concept of hybrid segmentation is relying on the principle that segments can be made
more profoundly by combining different segmentation methods. Hybrid segmentation in
different areas of the world, standardising some marketing elements, and adapting others,
could be a good solution (Hassan, Craft, and Kortam, 2003).
Segmenting a market should start with the macro dimensions and refined by micro factors
(Amine and Smith, 2009) to adapt to local behaviours and thus getting better performance.
Successful marketing often depends on balancing product attributes with customer attitudes
and values; psycho-graphic segmentation is a compelling basis for categorizing consumers
internationally, complementing approaches primarily based on demographics, marketers need
to consider the culture variables and subsequent consumer behaviours (Cleveland et al.,
2011). Hybrid segmentation with the combination of all type of segmentation cited in the

16
previous sections is resulting in mass customization. If macro data is associated to micro data,
the segmentation allows the distinction of clear precise segments that can be targeted to
achieve greater customer satisfaction through coherent value delivery (Jiang, 2000).
2.6 Dynamic segmentation: the predictive implication of segmentation
Very few authors have emphasised the importance of dynamic segmentation. Among these
few is Weinberg (1972), who stressed its importance dynamic segmentation. He stressed, that
certain episodes can be predicted by the use of already available records. Weinberg (1972)
referred to Dr. Spock’s example of segmenting the baby product market: on the average,
three months after birth a baby begins to eat solid food, five months later the birth weaning
should begin, and a year later, a baby normally grows six teeth and can chew. Those different
periods are called time sequences. Episodes like these or the application of time sequence can
be beneficial to marketers and researchers in anticipating the future, while segmenting
international market and its trends. A similar approach can be applied to develop time
sequences for other areas such as automobiles (Weinberg, 1972).
According to Holbrook and Hirschman (1982), post purchase consumer behaviours are driven
by a learning effect, transforming the initial behaviour. This phenomenon results in a
feedback loop and depends on the interaction between the purchase experience and the
consumers’ inputs. The consumers’ inputs are defined by the macro and micro factors
influencing them. The customers’ behaviour is thus ever changing, due to the different
contexts the customers could be in. (Holbrook and Hirschman, 1982)
Quinn, Hines and Bension (2007) explained and made sense of the particular observed
phenomenon of marketing segmentation, ongoing. The aspect of ongoing, explained by
Weick (1995), is unending and continuous sense-making. In a milieu of dynamic
segmentation, in a world, which is becoming more and more cosmopolitan, cluster behaviour
is always ever hanging and ongoing.
2.7 State-of-the-art
The notion of market segmentation is explained with the help of Beane and Ennis (1987) and
Wedel and Kamakara (2000). Beane and Ennis (1987) review on market segmentation is well

17
accepted and it reviews Kotler (1980) theories. Wedel and Kamakara (2000) dominating
theory on market segmentation is also well accepted and validated.
Cleveland et al. (2011) Lancaster and Williams (2002), and Kim and Lee (2011) are the other
sources that have been used to explain bases and variables for market segmentation. The for
variables geographic segmentation, demographic segmentation, psychographic segmentation
and behavioural segmentation are the most common segmentation variables by Philip Kotler.
The sources are recent and do not have a low acceptance or validation and so are proposals to
fill a gap. These sources have been used to discuss the different segmentation variables.
Gaston-Breton and Martin (2011) and Douglas and Craig (2010) are again very recent articles
and has a low acceptance and validation. Douglas and Craig (2010) is a study that provides a
framework to understand contextual factors as a means to refine entry strategy and develop
effective segmentation strategies. Gaston-Breton and Martin (2011) proposes a two stage
model of international market segmentation. These sources have only been used in our thesis
to understand Macro segmentation.
Cleveland et al, 2011) and Steenkamp (2001) have been used for micro segmentation.
Steenkamp (2001) has moderate acceptance and is well validated. Steenkamp (2001) reviews
and discusses the role of national culture in international marketing research, the frameworks
presented by Hofstede and the Schwartz. Holbrook and Hirschman (1982) is another very
dominating article that has used to explain micro segmentation and to explain behavioural
segments. It has further been used to elaborate more on how knowledge that is gathered
through time effect segmentation. Holbrook and Hirschman (1982)’s article have been highly
accepted and is well validated.
Wells (1975) article review has also been very important in understanding psychographics.
Wells (1975) is well accepted and well validated.
Hasan, Craft and Kortam (2003) introduce hybrid approach to global market segmentation,
which is a vital theory in the thesis. Hasan, Craft and Kortam (2003) has low amount of
acceptance but it is well validated and so it is an emerging theory. Though Amine and Smith
(2009) has a very low acceptance the source has been used to rationalize the concept of
standardisation and adaptation in other words hybrid segmentation. Cannon and Yaprak
18
(2011) have also been used as source for the integration of macro and micro segmentation.
This source has very low amount of acceptance but is thoroughly validated.
Weinberg, C. B. (1972) brings up the issue of changing market segmentation through time
half a century ago but it does not have any acceptance or validation. Holbrook and Hirschman
(1982) have also been reused to explain the dynamic aspect of segmentation. Later Quinn,
Hines, and Bennison (2007) propose that past facts can be used to predict market
segmentation patterns. Quinn, Hines, and Bennison (2007) theories have very low acceptance
but the theories are validated so they are emerging theories. Chin-Feng, 2002 brings up how
products attributes are reliable to study personalities and life styles. Chin-Feng, 2002 is
validated but has low acceptability.
19
2.8 Model, how the constructs relate
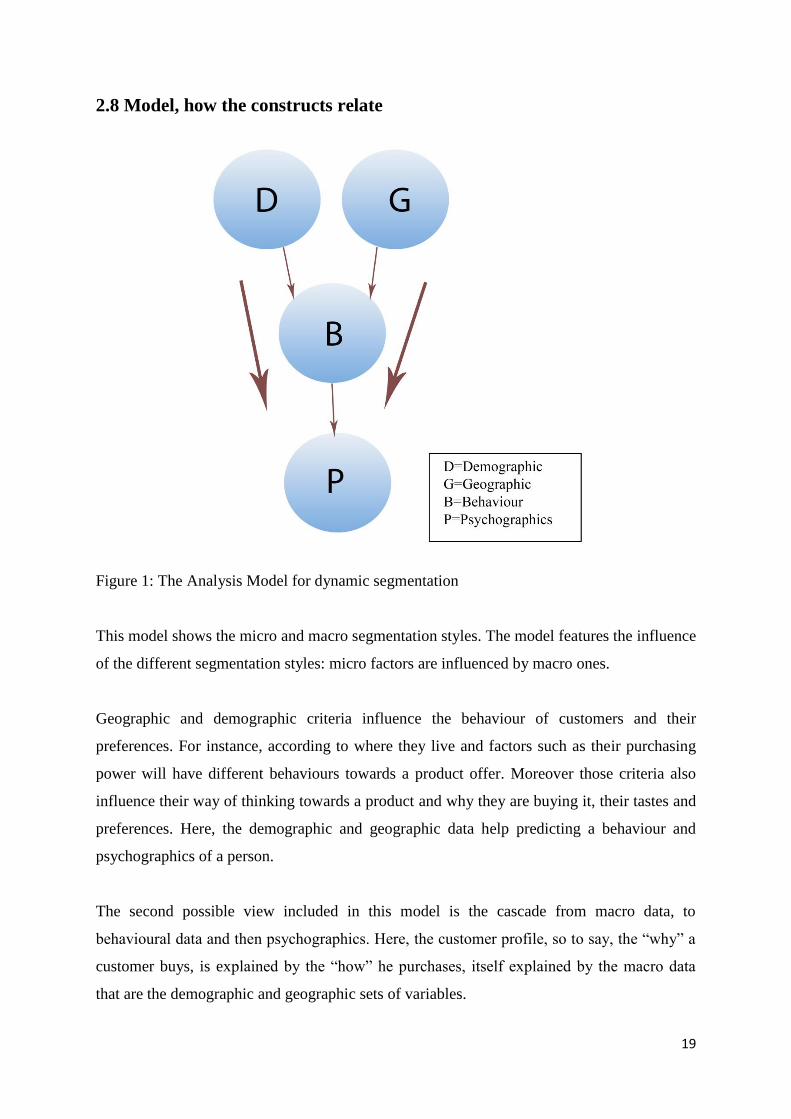
Figure 1: The Analysis Model for dynamic segmentation
This model shows the micro and macro segmentation styles. The model features the influence
of the different segmentation styles: micro factors are influenced by macro ones.
Geographic and demographic criteria influence the behaviour of customers and their
preferences. For instance, according to where they live and factors such as their purchasing
power will have different behaviours towards a product offer. Moreover those criteria also
influence their way of thinking towards a product and why they are buying it, their tastes and
preferences. Here, the demographic and geographic data help predicting a behaviour and
psychographics of a person.
The second possible view included in this model is the cascade from macro data, to
behavioural data and then psychographics. Here, the customer profile, so to say, the “why” a
customer buys, is explained by the “how” he purchases, itself explained by the macro data
that are the demographic and geographic sets of variables.
20
The model of analysis therefore includes a diverse set of criteria aimed at a complete
understanding of segmentation, and offers the possibility to predict eventual changes in
segmentation needs with the help of purchase-intention-oriented questions. This last aspect is
particularly important in an uncertain environment, such as the Chinese car market.
This kind of hybrid segmentation includes a dynamic aspect of the interaction between
several criteria influencing the individual and his surroundings. A good understanding of
one’s environment enables to see how one behaves in a specific situation (purchase decision
of a car) and how he can participate into an ever changing, revolving environment. The
authors will use this model in order to build the main profiles of customers on the Chinese
new car market, in the present and what they could be in the future.
21
3. Methodology
3.1 Introduction
This chapter presents the different stages of the research and how it has been used in the
thesis. The data collected derives from quantitative research, an online survey, which was
sent out to China. The authors presented a survey based cross tabulation to study
segmentation of the Chinese car market with a time aspect; they also included secondary data
from different time period to capture a dynamic view of the Chinese car market.
3.2 Population and sample
A population is all the people belonging to a group or a geographical area. A segment of the
population is chosen for research, when sampling is done. Bryman and Bell (2005) states, a
sampling frame is the total list of units who are a share of the population from which a
sample is derived. A convenience sample means that the people in it happens to be available
to the researcher, making it easier, cheaper and less time consuming than a probability sample
which demands more preparations (Bryman & Bell, 2005).
The population consists of students and people from all walks from China. Survey questions
were sent to various companies. The authors found list of China-based companies and
manufacturers; there were no specific choice criteria only they had to be from China. From
the list a lot of emails were invalid so they could not be reached. A major number of peoples
contacted emailed back that the thought the survey link was a spam, and they refused to
answer the survey. The authors have also contacted friends who are residing in China to
answer the survey. The authors have also contacted various universities asking if they could
help the authors circulating the survey within their universities. Unfortunately no
confirmation that the email had been dispatched further to the students has been received.
The authors have also tried approached Chinese individuals with the age group of 65 and
above, by trying to contact various nursing homes for elderly in China via email, but
unfortunately the authors were not able to contact them.
The authors believed that as the study was mainly based on car consumer preferences it was
best if respondents were chosen with a variation in income group, age group. In total 512
individuals have been contacted with the survey. They were also sent five reminders with a
four to five day interval.
22
Due to time restrain the authors had to close the survey with 89 respondents with a response
rate of 17.4%. As the survey was answered by individuals with a varied age and income
group and also from a scattered geographical location, the number of answers is judged
important enough to carry out an analysis.
3.2.1 Data collection method
Surveys can be conducted on paper or electronically. The respondents can answer
individually. The electronic survey is the most common research method today. (Bryman &
Bell, 2007).
The primary quantitative data collection was made via the online survey provider called
Keysurvey. This service provider is convenient to use and to collect data from, since it is easy
to export SPSS files. The SPSS file was ready to use directly in SPSS, the statistical program
used. The authors have used an email–marketing service called MailChimp to send out mass
emails, with this tool the distribution of the surveys was made more efficient than it would
have been, if it had been send out to each email, manually.
3.2.2 Questionnaire Design
Surveys are cheap and quick to administer, and the interviewer does not affect the answers
with their presence, no variation of the questions occur and they can be made when the
respondent has the time for it Bryman and Bell (2007). Bryman and Bell (2007) also pointed
out few disadvantages with surveys; Misunderstandings may occur, regarding what the
researchers are asking about, since the participants cannot ask the researcher directly.
Participants cannot ask follow-up questions, and it is difficult to ask many questions since
researchers risk losing the respondents’ will of participating.
Bryman and Bell (2007) suggested for getting a higher response rate it is important to have a
good introduction letter, where it signifies why the answers are important. Since participants
tend to skip questions it is also good not to have open questions. Closed questions may be
easier to analyse since the coding is easier. It can also be necessary to remind the participants
to answer. (Bryman & Bell, 2005) For their survey the authors had an introduction letter,
which explained shortly the structure of the survey and its purpose. The survey was both in
English and Chinese as the authors were looking for participants only from China. The
23
Chinese translation of the survey was done with the help of a Chinese friend, later the
language and simplicity of the language was reassured by two other Chinese individuals who
were profound in the language. The survey consisted of 16 questions with the simplest
language possible. The survey had mostly closed question. To study the psychographic and
behavioural segmentation the authors used likert scales.
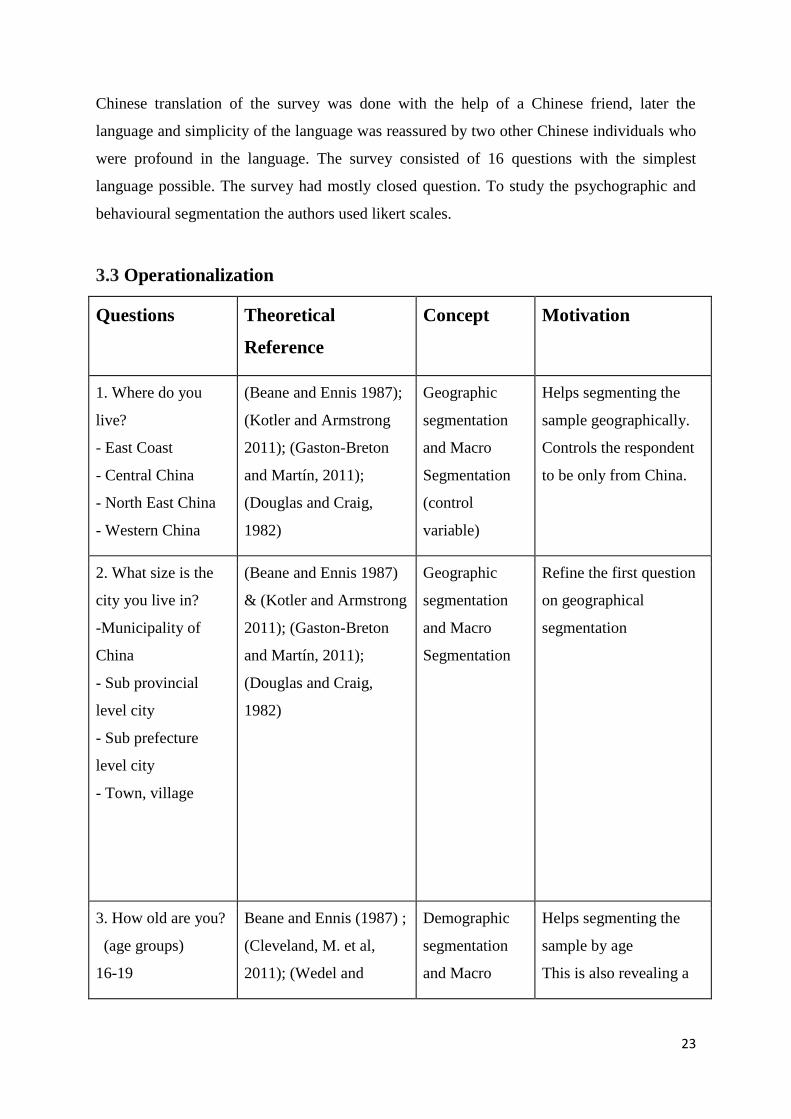
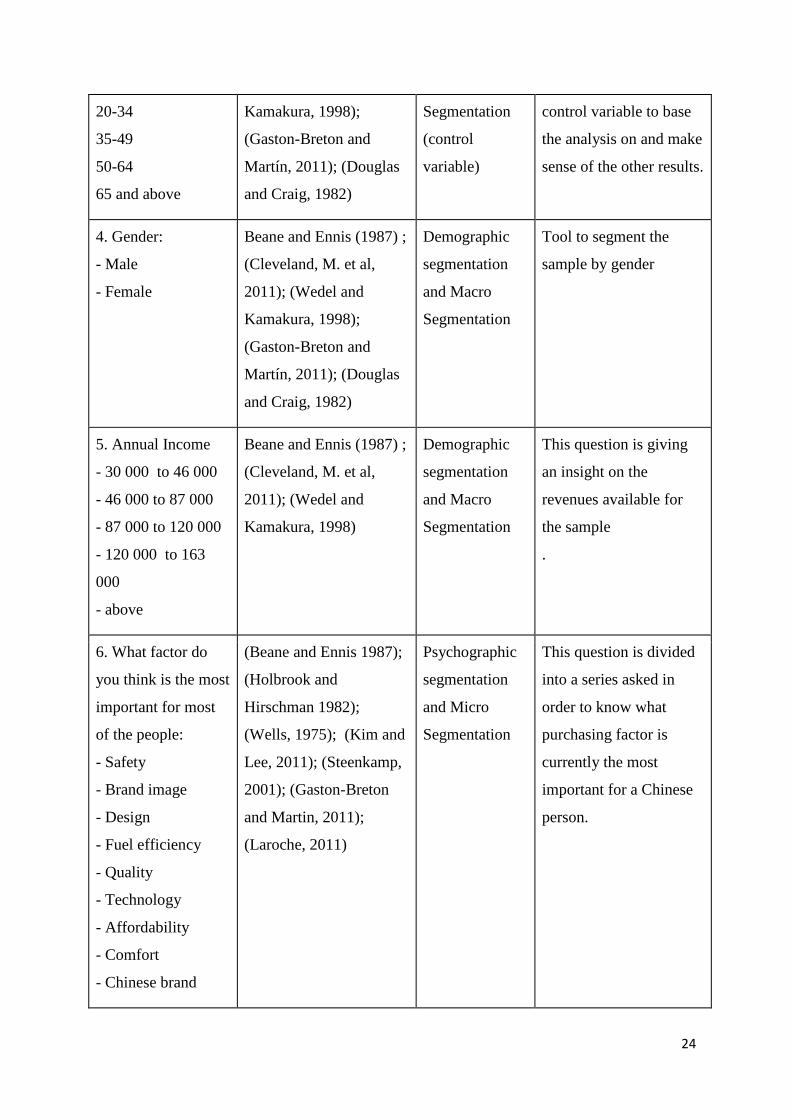
3.3 Operationalization
Questions Theoretical
Reference
Concept Motivation
1. Where do you
live?
- East Coast
- Central China
- North East China
- Western China
(Beane and Ennis 1987);
(Kotler and Armstrong
2011); (Gaston-Breton
and Martín, 2011);
(Douglas and Craig,
1982)
Geographic
segmentation
and Macro
Segmentation
(control
variable)
Helps segmenting the
sample geographically.
Controls the respondent
to be only from China.
2. What size is the
city you live in?
-Municipality of
China
- Sub provincial
level city
- Sub prefecture
level city
- Town, village
(Beane and Ennis 1987)
& (Kotler and Armstrong
2011); (Gaston-Breton
and Martín, 2011);
(Douglas and Craig,
1982)
Geographic
segmentation
and Macro
Segmentation
Refine the first question
on geographical
segmentation
3. How old are you?
(age groups)
16-19
Beane and Ennis (1987) ;
(Cleveland, M. et al,
2011); (Wedel and
Demographic
segmentation
and Macro
Helps segmenting the
sample by age
This is also revealing a
24
20-34
35-49
50-64
65 and above
Kamakura, 1998);
(Gaston-Breton and
Martín, 2011); (Douglas
and Craig, 1982)
Segmentation
(control
variable)
control variable to base
the analysis on and make
sense of the other results.
4. Gender:
- Male
- Female
Beane and Ennis (1987) ;
(Cleveland, M. et al,
2011); (Wedel and
Kamakura, 1998);
(Gaston-Breton and
Martín, 2011); (Douglas
and Craig, 1982)
Demographic
segmentation
and Macro
Segmentation
Tool to segment the
sample by gender
5. Annual Income
- 30 000 to 46 000
- 46 000 to 87 000
- 87 000 to 120 000
- 120 000 to 163
000
- above
Beane and Ennis (1987) ;
(Cleveland, M. et al,
2011); (Wedel and
Kamakura, 1998)
Demographic
segmentation
and Macro
Segmentation
This question is giving
an insight on the
revenues available for
the sample
.
6. What factor do
you think is the most
important for most
of the people:
- Safety
- Brand image
- Design
- Fuel efficiency
- Quality
- Technology
- Affordability
- Comfort
- Chinese brand
(Beane and Ennis 1987);
(Holbrook and
Hirschman 1982);
(Wells, 1975); (Kim and
Lee, 2011); (Steenkamp,
2001); (Gaston-Breton
and Martin, 2011);
(Laroche, 2011)
Psychographic
segmentation
and Micro
Segmentation
This question is divided
into a series asked in
order to know what
purchasing factor is
currently the most
important for a Chinese
person.

25
7. How many cars
have you bought?
(Beane and Ennis 1987);
(Holbrook and
Hirschman 1982);
(Wells, 1975); (Kim and
Lee, 2011); (Steenkamp,
2001); (Gaston-Breton
and Martin, 2011);
(Laroche, 2011)
Psychographic
segmentation
and Micro
Segmentation
For the experience?
8. Do you have a car
now?
Micro and
behavioural
segmentation)
This question is more of
a preparatory question to
introduce the other
psychographic and
behavioural questions
8.1.1 How often do
you use your car?
- every day
-only on weekends
- less than once a
week
(Beane and Ennis 1987);
(Lancaster and Williams,
2002); (Kim and Lee,
2011); (Steenkamp,
2001); (Gaston-Breton
and Martin, 2011);
(Laroche, 2011)
Behavioural
and Micro
segmentation
To determine the
frequency of use of the
car
8.1.2 You mainly
use your car for:
- long trips
- short trips
(Beane and Ennis 1987);
(Lancaster and Williams,
2002); (Kim and Lee,
2011); (Steenkamp,
2001); (Gaston-Breton
and Martin, 2011);
(Laroche, 2011)
Behavioural
and Micro
segmentation
To determine the sort,
type or nature of use of
the car
8.1.3 How often do
you change your
(Beane and Ennis 1987);
(Lancaster and Williams,
Behavioural
and Micro
To determine the
purchase frequency of

26
car?
- every year
- every 2 years
- in between 2 and 5
years
- less than once
every 5 years
2002); (Kim and Lee,
2011); (Steenkamp,
2001); (Gaston-Breton
and Martin, 2011);
(Laroche, 2011)
segmentation car consumers in China.
8.1.4 If you have
ever owned a car, to
what degree were
the following items
important when
purchasing it?
- Safety
- Brand image
- Design
- Fuel efficiency
- Quality
- Technology
- Affordability
- Comfort
- Chinese brand
(Beane and Ennis 1987);
(Holbrook and
Hirschman 1982);
(Wells, 1975); (Kim and
Lee, 2011); (Steenkamp,
2001); (Gaston-Breton
and Martin, 2011);
(Laroche, 2011)
Psychographic
segmentation
and Micro
Segmentation
Understanding the
motivation for the last
car purchase
8.1.4.1 Would you
buy your next car
for the same reason?
(Beane and Ennis 1987);
(Holbrook and
Hirschman 1982);
(Wells, 1975); (Kim and
Lee, 2011); (Steenkamp,
2001); (Gaston-Breton
and Martin, 2011);
(Laroche, 2011)
Behavioural
and Micro
segmentation
This questions the
loyalty of the respondent
and the possibility that a
purchasing factor lasts in
time. It gives an
indication for dynamic
segmentation.

27
8.1.4.1.1 If you
would buy a
different car, what
attribute would you
consider the most
important for the
next purchase?
- Safety
- Brand image
- Design
- Fuel efficiency
- Quality
- Technology
- Affordability
- Comfort
- Chinese brand
(Beane and Ennis 1987);
(Holbrook and
Hirschman 1982);
(Wells, 1975); (Kim and
Lee, 2011); (Steenkamp,
2001); (Gaston-Breton
and Martin, 2011);
(Laroche, 2011)
Psychographic
segmentation
and Micro
Segmentation
The question investigates
on the possible change in
the purchasing reasons
for car owners. It gives
an indication for
dynamic segmentation.
8.2 If you do not
own a car, do you
plan to buy one in
the future?
Behavioural
segmentation
and Micro
Segmentation
This question prepares to
the next one and helps
assessing the potential of
the demand.
8.2.1 If you plan to
buy a car, to what
degree would the
following items be
the most important
to you?
- Safety
- Brand image
- Design
- Fuel efficiency
- Quality
- Technology
(Beane and Ennis 1987);
(Holbrook and
Hirschman 1982);
(Wells, 1975); (Kim and
Lee, 2011); (Steenkamp,
2001); (Gaston-Breton
and Martin, 2011);
(Laroche, 2011)
Psychographic
segmentation
and Micro
Segmentation
With this question, the
current non owner of a
vehicle is taken in the
equation, and it
questions his/her future
purchase motivation.
It gives an indication for
dynamic segmentation.
28
- Affordability
- Comfort
- Chinese brand
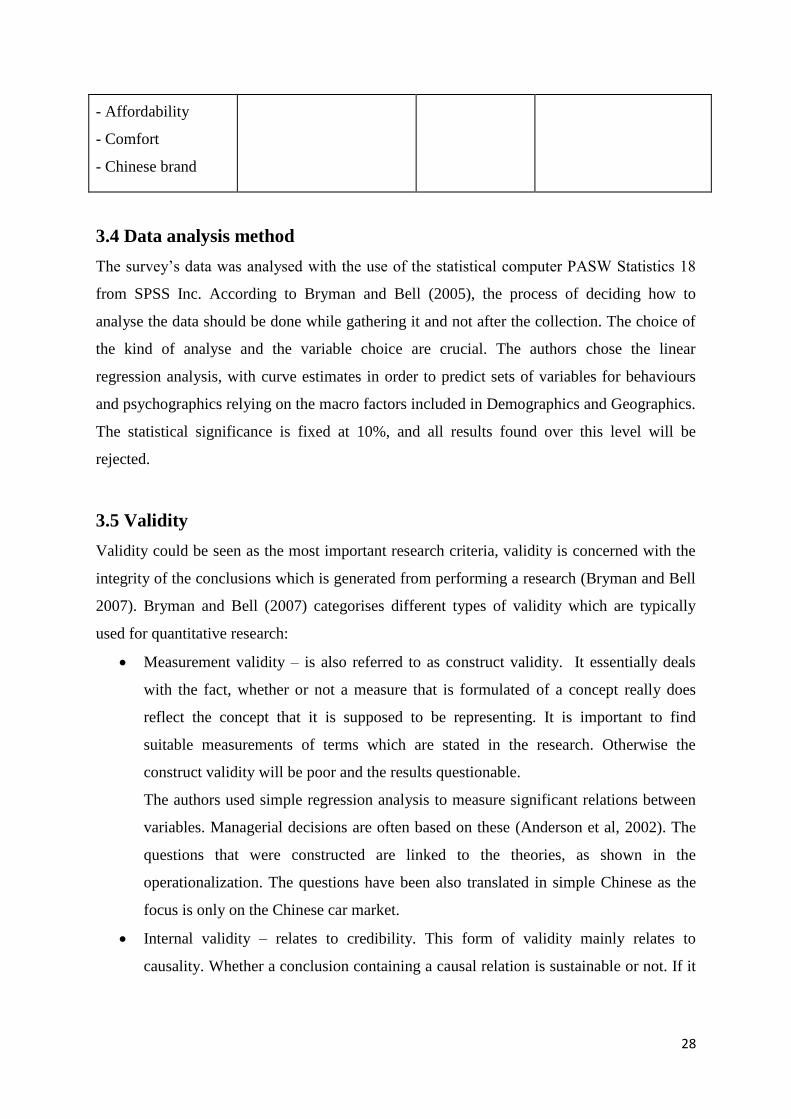
3.4 Data analysis method
The survey’s data was analysed with the use of the statistical computer PASW Statistics 18
from SPSS Inc. According to Bryman and Bell (2005), the process of deciding how to
analyse the data should be done while gathering it and not after the collection. The choice of
the kind of analyse and the variable choice are crucial. The authors chose the linear
regression analysis, with curve estimates in order to predict sets of variables for behaviours
and psychographics relying on the macro factors included in Demographics and Geographics.
The statistical significance is fixed at 10%, and all results found over this level will be
rejected.
3.5 Validity
Validity could be seen as the most important research criteria, validity is concerned with the
integrity of the conclusions which is generated from performing a research (Bryman and Bell
2007). Bryman and Bell (2007) categorises different types of validity which are typically
used for quantitative research:
Measurement validity – is also referred to as construct validity. It essentially deals
with the fact, whether or not a measure that is formulated of a concept really does
reflect the concept that it is supposed to be representing. It is important to find
suitable measurements of terms which are stated in the research. Otherwise the
construct validity will be poor and the results questionable.
The authors used simple regression analysis to measure significant relations between
variables. Managerial decisions are often based on these (Anderson et al, 2002). The
questions that were constructed are linked to the theories, as shown in the
operationalization. The questions have been also translated in simple Chinese as the
focus is only on the Chinese car market.
Internal validity – relates to credibility. This form of validity mainly relates to
causality. Whether a conclusion containing a causal relation is sustainable or not. If it

29
can be seen that it is one specific variable that affects another and makes it to vary,
and that it is not a third variable causing the effect.
This study is based on a single survey, and the relations of the variables are based on
that survey. With time the variations in the independent variable cannot be predicted.
So the internal validity is low.
External validity – relates to transferability. It stresses whether the results of a study
can be generalized beyond the context at hand for the researcher.
The study is focussed only on China car market which gives it external validity.
Ecological validity - stresses whether the results of a study can be applied in people’s
everyday life and their natural social context. The ecological validity might become
poor when using surveys, because they disturb the natural situation that the
participants are in.
As this study was based on an email survey, and the presence of the surveyor was
absent, the natural social context was not disturbed so the authors believe the study
consists of ecological validity.
3.6 Reliability and Replicability
Reliability is defined as whether a research would provide the same results if the research
would be done again, with other researchers but with the same circumstances as the original
researchers; that there were no random or temporary conditions in the original research. If the
measurement of the study is not reliable enough this may influence the results differently and
the results may be not reliable. Replicability can be described as, if the investigation of the
study is reproduced by another researcher to study the reliability of the original study.
Detailed explanation of the procedure of the original study must be provided. (Bryman &
Bell, 2007).
The motives and reasoning of the survey questions and the measuring instrument used in the
thesis have all been pointed out in the methodology section. All the steps have been
elaborated in the paper that leads the authors to the results. The authors believe that this
strengthens the study’s reliability and replicability. The authors also believe that if the study
is conducted by another researcher there would not be any major variations. The results have
not been affected by temporary or random circumstances.

30

31
4. Empirical Data
In this chapter the authors have used both descriptive statistics and simple linear regression to
estimate relationship between the variables.
Managerial decisions are often based on this relation. In regression terminology the variables
being predicted are called dependent variable. The variable or variables being used to predict
the dependent variable is called independent variable. Only the relations with significance has
been used in the study; the significant value has been set to sig<0.10. (Anderson et al, 2002)
All the regression tables have been presented in appendix B.
4.1 Geographic data:
When asked their residence region in China, the respondents mainly indicated to be living in
Eastern China. The other regions had far less represented but nevertheless equally mentioned
at around 10% each, whereas the people living in Eastern China amount 72.4% of the
responses. The region of residence is also a control variable in the study. (See Appendix
A.1.1)
The urbanisation rate is really high since it can be observed that 63.2% live in a Municipality
of China. Sub provincial level city, sub prefecture of China and village inhabitants
respectively amount for 11.49%, 17.24% and 8.05%. (See appendix A.1.2)
4.2 Demographic data:
In this part of the questionnaire, people are asked basic information about themselves: their
gender, age and annual incomes.
The results show that the survey reached both male and female respondents in a balanced
way. Women are slightly less represented with 45.98% of the responses whereas men
represent 54.02% of the sample. (See appendix A.2.1)
The 20-34 years old is the main age category reached by the survey with 68.7% of responses,
and is followed by the 35-49 years old age category. The youngest category, from 16 to 19
years old, is represented at 8.05% and the 60 to 64 years old at 4.6%. The oldest age category

32
that is above 65 years old shows no entry. Age is also the second control variable in the
study.
Concerning the question about incomes, the majority of respondents are earning very low
incomes for more than half of them: 34.48% have no incomes at all and 20.69% are in the
first category (10 000 to 30 000 Yuan a year). The other income categories are dispatched at
around 7% of the responses, except for the highest earners who responded for11.49% as well
as the 3rd
highest earners (87 000 to 120 000 Yuan a year). (See appendix A.2.3.)
4.3 Behavioural data:
For the questions regarding consumer behaviour, the sample had to respond according to their
consumption habits, and answered questions in order to know if they currently own a car or
not, their level of experience with the purchase of cars, the frequency and style of use, their
replacement rate and their loyalty. For non-car owners, the respondents had to indicate if they
were planning to buy a car.
In the sample, most of the answers show that people do not have a car yet (64.37%), but that
they are very likely to buy one in the future: 93.59% of the respondents are thinking of
buying one. (See appendixes A.3.1. and A.3.2.)
The persons who answered the survey have not purchased many cars in their lives yet, and
can be considered as non-experienced as car purchasers with all responses showing that they
have bought less than four. Half of the sample has never purchased any car and 32.18% only
one. 10.34% have purchased two cars and 3.45% of respondents have bought three cars. (See
appendix A.3.3.)
For the car owners, the consumption style is clearly in favour of short daily trips. (See
appendixes A.3.4. and A.3.5.)
The respondents appear to be loyal to their car attribute since they would mainly make their
next purchase for the same reason. Only 22.58% would change their main car attribute for a
new purchase. (See appendix A.3.6)

33
67.92% of respondents mention that they would use their car a long time and buy a new one
after more than six years, and 22.58% in between 2 and 6 years. People replacing their car
within a short period of less than 2 years represent only 6.46% of the sample. (See appendix
A.3.7)
4.3.1 Customer behaviour explained by Geographic data
This part is dedicated to the following relation of the model:
Figure 2: Customer behaviour explained by Geographic data
Customer behaviour explained by region of residence (See appendix part B.1.1):
Experience is not significant (0.181), neither is frequency of use (0.173), long trips (0.558),
car replacement rate (0.709), and loyalty to attribute (0. 586).
The link between region of residence and short trips has an acceptable significance (0.093).
Customer behaviour explained by the degree of urbanization (See appendix part B.1.2):
None of the behaviours can apparently be explained by the degree of urbanization:

34
Experience is not significant (0.784) and neither frequency of use (0.293), long trips (0.97),
short trips (0.756), replacement rate (0.836) nor loyalty to attribute (0.776) has acceptable
significances.
4.3.2 Customer behaviour explained by Demographics:
Figure 3: Customer behaviour explained by Demographics
Consumer behaviour explained by age (see appendix part B.1.3.):
The statistical significances for the frequency of use (0.55), long trips (0.92), short trips
(0.615), replacement rate (0.937), and loyalty (0.442) are showing no clear relations.
Nevertheless, the experience of a driver appears significant (0.008).
Customer behaviour explained by the gender of the respondent (see appendix part
B.1.4.):
Experience is not significant (0.721), and nor are the frequency of use (0.945), long trips
(0.218), short trips (0.685) and replacement rate (0.101).
Loyalty towards the current car attribute is though significant (0.004).

35
Customer behaviour explained by incomes level (see appendix part B.1.5.):
Again, many behavioural variables cannot be explained by the income level due to
insufficient significance level: experience (0.195), long trips (0.29), short trips (0.14),
replacement rate (0.364), loyalty (0.391), are all over our maximum of 10%.
On another hand, the frequency of use is significant (0.039).
4.4 Psychographic data:
Figure 4: Customer psychographics explained by both macro data and customer behaviour
In this part, the psychographic side of the customer is explained by both the macro
dimensions that are demographics and geographic variables, and by the other micro
dimension that is customer behaviour.
In this type of questions, that is recurrent in the survey and filtered by behavioural answers,
the sample is investigated in terms of preferences for car attributes such as safety, brand
image, design, fuel efficiency, quality, technology, affordability, comfort, Chinese brand.

36
4.4.2 Respondent’s opinion on global preferences
The first question is about what the respondent thinks about the global preferences in China,
and the results show that safety (4.7/5 average) and quality (4.6/5 average) are rated as really
important by most of them. Then come fuel efficiency (4.1/5 average), comfort (4/5 average)
and technology (4/5 average) which are still very important but less than the two first
attributes. The design (3.8/5 average), affordability (3.7/5 average) and brand image (3.4/5
average) are rated averagely and finally, the fact that the car is a Chinese brand (2.1/5
average) is rated as non-important. (See appendix A4)
Respondents’ opinion on others’ preferences by age of the respondents (see appendixes
B.2.1.1 to B.2.1.9):
Seven out of nine psychographic variables cannot be explained by the age of the respondent:
safety (0.373), brand image neither (0.568), fuel efficiency neither (0.742), quality neither
(0.288), technology neither (0.833), affordability neither (0.628), Chinese brand (0.707).
Design and comfort’s importance perception for the global market are the only
significant relations (respectively 0.006 and 0.014).
Respondents’ opinion on others’ preferences by gender of the respondent (see appendix
part B.2.2.1 to B.2.2.9):
The results fail to give an acceptable explanation of what the respondents think of others’
preferences according to their gender due to statistical significances higher than the limit
fixed by the authors: safety (0.297), brand image (0.135), design (0.346), fuel efficiency
(0.564), quality (0.839), technology (0.731), affordability (0.208), comfort (0.313), Chinese
brand (0.898).
Respondents’ opinion on others’ preferences by annual incomes (see appendixes B.2.3.1
to B.2.3.9):
The statistical significance for each variables being too high, the results could not be
considered valid and the respondents’ opinion on others’ preferences cannot be correctly
explained relying on the annual incomes of the respondents:
Safety (0.664), as well as brand image (0.605), design (0.9), fuel efficiency (1), quality
(0.731), technology (0.516), affordability (0.899), comfort (0.674), and even Chinese brand
(0.975) do not have valid statistical significance that would highlight a valid relation.

37
Respondents’ opinion on others’ preferences by region of residence (see appendixes
B.2.4.1 to B.2.4.9):
The same happens with people’s opinion on others’ preferences according to where they live
in China:
Safety shows no acceptable significance (0.352), nor brand image (0.502), design (0.194),
fuel efficiency (0.297), quality (0.268), technology (0.453), affordability (0.952), comfort
(0.551), and Chinese brand (0.555).
Respondents’ opinion on others’ preferences by degree of Urbanisation (see appendixes
B.2.5.1 to B.2.5.9):
All the psychographic variables cannot be related to the degree of urbanization due to non-
acceptable statistical significances:
Safety (0.237), brand image (0.786), design (0.114), fuel efficiency (0.433), quality (0.131),
technology (0.149), affordability (0.918), comfort (0.103).
Only one psychographic variable, Chinese brand (significance = 0.060), can be
explained by the degree of urbanisation of the respondent.
4.4.3 Car owners’ current preferences
4.4.3.1 Car owners’ current preferences explained by demographics
For car owners, safety (4.7/5 average) and quality (4.6/5 average) are also the most important
reasons of purchase. Fuel efficiency (4.1/5 average) and comfort (3.9/5 average) appear to
have been important attribute for their last purchase as well. Technology (3.8/5 average),
design (3.7/5 average) and affordability (3.7/5 average) represent an average attribute for
them, which are rated as slightly more important than brand image. Chinese brand (2.4/5
average), once again, cannot be considered as a valid purchase reasons when looking at the
importance granted by the respondents. (See appendix A4)
Car owners’ preferences for their current car according to the age (see appendixes
B.2.1.10 to B.2.1.18):
The other variables are not exploitable:
Safety not significant (0.928), brand image (0.125), fuel efficiency (0.228), quality (0.586),
technology (0.830), affordability (0.277), comfort (0.193), Chinese brand (0.254).

38
Design is an exploitable variable with a significance of 0.082.
Car owners’ preferences for their current car according to the gender (see appendixes
B.2.2.10 to B.2.2.18):
Safety is not significant (0.457) and cannot be treated, the same happens with the other
psychographic variables: brand image (0.862), design (0.772), fuel efficiency (0.165), quality
(0.712), technology (0.375), comfort (0.171), Chinese brand (0.610).
The gender though, explains the perception of affordability for car owners
(significance for affordability is 0.084).
Car owners’ preferences for their current car according to their annual incomes (see
appendixes B.2.3.10 to B.2.3.18):
None of the psychographic variables can be explained with annual incomes for car owners:
Safety is not significant (0.253), and neither are brand image (0.233), design (0.972), fuel
efficiency (0.784), quality (0.253), technology (0.652), affordability (0.495), comfort (0.393),
and Chinese brand (0.966).
4.4.3.2 Car owners’ current preferences explained by geographic variables
Car owners’ preferences for their current car according to region of residence (see
appendixes B.2.4.10 to B.2.4.18):
The relation regarding car owners’ perception of safety and their region of residence is not
significant (0.250) and neither it is with their perception of brand image (0.347), the design
(0.148), the fuel efficiency (0.519), the technology (0.254), the affordability (0.667), the
comfort (0.281), or the fact a car is from a Chinese brand (0.394).
The relation regarding car owners’ perception of quality and the region of residence is
significant (0.020).
Car owners’ preferences for their current car according to degree of urbanisation(see
appendixes B.2.5.10 to B.2.5.18):
Safety is not significant (0.924) and the significance of brand image (0.431), design (0.639),
fuel efficiency (0.319), quality (0.689), technology (0.408), affordability (0.696), comfort
(0.687) are also non-acceptable.

39
Chinese brand is significant (0.090) and is the only significant relation with the degree
of urbanisation of car owners
4.4.3.3 Car owners’ current preferences explained by behaviours
Car owners’ preferences for their current car according to the frequency of use (see
appendixes B.3.3.10 to B.3.3.18):
Most of the variables cannot be used since they do not reach the 10% limit for statistical
significance that the authors imposed:
Safety is not significant (0.413), brand image (.568), design (0.897), fuel efficiency (0.393),
technology (.32), comfort (0.641), Chinese brand (0.641).
But a relation in between affordability importance and the frequency of use by a car
owner can be observed (significance is 0.096), as well as a relation with the
importance of quality (significance is 0.021).
Car owners’ preferences for their current car according to the style of use: Long trips
(see appendixes B.3.5.10 to B.3.5.18):
Safety (0.869), brand image (0.27), design (0.208), fuel efficiency (0.795), quality (0.316),
comfort (0.152), and Chinese brand (0.648) cannot be explained by the behaviour variable
“Style of use: long trips” since their significance does not meet the standard of 10%.
Nevertheless, technology is significant (0.01) and can be related to long trip drivers.
Affordability is significant too (0.012).
Car owners’ preferences for their current car according to the style of use: Short trips
(see appendixes B.3.6.10 to B.3.6.18):
Only one variable is having a statistical significance meeting the 10% standard, all the others
are higher:
Safety (0.521), brand image (0.481), design (0.5), fuel efficiency (0.823), technology (0.347),
affordability (0.125), comfort (0.547), Chinese brand (0.415).
This significant relation shows a link in between quality perception for short trips
drivers (significance=0.022).
Car owners’ preferences for their current car according to the replacement rate (see
appendixes B.3.1.10 to B.3.1.18):

40
The majority of variables having higher statistical significance are therefore not highlighting
any acceptable relation:
Safety (0.323), design (0.439), fuel efficiency (0.898), quality (0.807), technology (0.236),
affordability (0.258), comfort (0.372), Chinese brand (0.396).
Brand image is the only significant variable (0.039) enabling the observation of a
relation between its importance and the replacement rate of car owners.
4.4.4 Car owners’ preferences for their next purchase
When asked what importance they would grant to the different attributes for the next
purchase, car owners answered that, again, quality (4.5/5 average) and safety (4.7/5 average)
would be the most determining criteria. Then come comfort (4.1/5 average), fuel efficiency
(4/5 average) and technology (4.1/5 average). Affordability (3.8/5 average), design (3.8/5
average) and brand image (3.6/5 average) still appear important but less than the first
attributes. Chinese brand is not judged as important (2.6/5 average). (See appendix A4)
4.4.4.1 Car owners’ preferences for their next purchase explained by
Demographics
Car owners’ preferences for their next car according to their age (see appendixes
B.2.1.19 to B.2.1.27):
Most of the variables cannot be related to the age of the respondent because of the
significance level:
Safety is not significant (0.40), brand image (0.147), design (0.148), quality (0.191),
technology (0.835), affordability (0.508), comfort (0.483), Chinese brand (0.766).
Age is a valid variable to explain the car owners’ preferences for the next purchase
(significance = 0.086).
Car owners’ preferences for their next car according to their gender (see appendixes
B.2.2.19 to B.2.2.27):
None of the psychographic variables could be effectively linked to gender for the next
purchase by a car owner, statistical significances not being satisfactory:
Safety (0.733), brand image (0.873), design (0.64), fuel efficiency (0.316), quality (0.452),
technology (0.671), affordability (0.286), comfort (0.684), Chinese brand (0.17).

41
Car owners’ preferences for their next car according to their annual incomes (see
appendixes B.2.3.19 to B.2.3.27):
Eight variables could not be studied more since the significance is over the 10% rate:
Brand image (0.446), design (0.715), fuel efficiency (0.598), quality (0.36), technology
(0.868), affordability (0.808), comfort (0.83), Chinese brand (0.705).
Only safety is meeting the 10% significance rate chosen by the authors (0.082). A
relation can thus be observed.
4.4.4.2 Car owners’ preferences for their next purchase explained by
Geographic variables
Car owners’ preferences for their next car according to their region of residence (see
appendixes B.2.4.19 to B.2.4.27):
There are still seven variables from which no relation can be drawn due to insufficient
statistical significance:
Safety (0.182), design (0.194), fuel efficiency (0.414), quality (0.502), technology (0.132),
affordability (0.929), comfort (0.464).
The results from the survey indicate that there is a relation in between the region of
residence of a Chinese person and what how he would rate Brand Image and Chinese
Brand attributes for his/her next purchase. Brand image significance is 0.06 and
Chinese brand significance is 0.01.
Car owners’ preferences for their next car according to their urbanization degree (see
appendixes B.2.5.19 to B.2.5.27):
Most of the variables do not meet the significance level of 10% and cannot be studied
meaningfully:
Safety (0.726), brand image (0.91), design (0.952), fuel efficiency (0.627), technology
(0.424), affordability (0.717), comfort (0.646), Chinese brand (0.632).
The urbanization degree of a respondent influences his/her preference level for quality
(significance = 0.052) when thinking about their next car.
4.4.4.3 Car owners’ preferences for their next purchase explained by
customer behaviour

42
Car owners’ preferences for their next car according to how often they replace their car
(see appendixes B.3.1.19 to B.3.1.27):
The frequency of replacement of a respondent’s car is not explaining any psychographic
variables:
Safety is not significant (0.363), and neither are brand image (0.158), design (0.35), fuel
efficiency (0.354), quality (0.535), technology (0.32), affordability (0.238), comfort (0.499),
and Chinese brand (0.114).
Car owners’ preferences for their next car according to their level of experience (see
appendixes B.3.2.19 to B.3.2.27):
Safety (0.63), fuel efficiency (0.285), quality (0.282), technology (0.764), affordability
(0.118), comfort (0.553), and Chinese brand (0.591) cannot be related due to their non-
acceptable level of statistical significance.
The level of experience of a driver who answered the survey is related to the
importance he grants to the brand image (significance = 0.008) and the design of their
next purchase (significance = 0.062).
Car owners’ preferences for their next car according to the frequency they use their car
at (see appendixes B.3.3.19 to B.3.3.27):
The majority of the variables have a level of significance too high to be studied:
Safety (0.647), brand image (0.667), design (0.53), fuel efficiency (0.929), quality (0.557),
technology (0.337), comfort (0.1), Chinese brand (0.828).
A relation in between the importance granted to affordability for the next purchase by
someone who has a car and the frequency to which the driver uses it can be built
(significance = 0.013).
Car owners’ preferences for their next car according to their style of use: long trips (see
appendixes B.3.5.19 to B.3.5.27):
All but one variable have a level of significance too high to be studied:
Safety (0.647), brand image (0.276), fuel efficiency (0.594), quality (1), technology (0.776),
affordability (0.104), comfort (1), Chinese brand (0.87) are not passing the 10% significance
rate.

43
One variable is surfacing as a preference that can be explained by the behaviour: long
trip style of use for the next purchase: design (significance = 0.098).
Car owners’ preferences for their next car according to their style of use: short trips
(see appendixes B.3.6.19 to B.3.6.27):
Here are the variables having a level of significance too high to be studied:
Safety (0.694), brand image (0.35), design (0.929), fuel efficiency (0.244), quality (0.447),
technology (0.807), comfort (0.407), Chinese brand (0.725).
A relation can be drawn in between a person using his/her car for short trips and
his/her preference for an affordable car (significance = 0.038).
Car owners’ preferences for their next car according to their loyalty towards car
attributes (see appendixes part B.3.7.):
Safety (significance = 0.83) having a statistical significance higher than the 10% fixed by the
others cannot be studied here. The other variables are in the same situation:
Brand image (0.385), design (0.414), fuel efficiency (0.975), quality (0.836), technology
(0.398), affordability (0.824), comfort (0.652), Chinese brand (0.536).
4.4.5 Non-car owners’ preferences for their first purchase
Concerning respondents not owning yet a car, they will consider safety (4.8/5 average) and
quality (4.6/5 average) as the most relevant criteria when making their purchase decision.
Fuel efficiency (4.3/5 average), comfort (4.1/5 average), technology (4/5 average) and design
(3.9/5 average) would still be important but not as much as the safety and quality of the
vehicle they would chose. Affordability (3.8/5 average) and brand image (3.3/5 average)
would be of average concern and Chinese brand (2.4/5 average) would not be considered at
the time of purchase. (See appendix A4)
4.4.5.1 Non-car owners’ preferences for their first purchase explained by
Demographics
Non-car owners’ preferences for their next purchase explained with age (see appendixes
B.2.1.28 to B.2.1.36)
Most of the variables are not significant enough to be treated:

44
Safety (0.919), brand image (0.233), fuel efficiency (0.52), quality (0.215), technology
(0.278), affordability (0.237), comfort (0.105), Chinese brand (0.195).
The importance of design (significance = 0.056) for the next purchase by a non-car
owner, can be explained by the age of the respondent.
Non-car owners’ preferences for their next purchase explained with gender (see
appendixes B.2.2.28 to B.2.2.36)
The importance granted to the different possible attributes of a car by non-car owners cannot
be related to their gender. Indeed, safety is not significant enough (1), as are not the brand
image (0.452), the design (0.309), the fuel efficiency (0.709), the quality (0.783), the
technology (0.691), the affordability (0.324), the comfort (0.144) and the fact that a car is
Chinese (0.122).
Non-car owners’ preferences for their next purchase explained with annual incomes
(see appendixes B.2.3.28 to B.2.3.36)
The importance granted to the different possible attributes of a car by non-car owners cannot
be related to their annual incomes. Indeed, safety is not significant enough (0.626), and
neither are the brand image (0.168), the design (0.615), the fuel efficiency (0.664), the quality
(0.23), the technology (0.724), the affordability (0.427), the comfort (0.603), or the Chinese
branded car (0.599).
4.4.5.2 Non-car owners’ preferences for their first purchase explained by
Geographic variables
Non-car owners’ preferences for their next purchase explained according to the
respondents’ region of residence (see appendixes B.2.4.28 to B.2.4.36)
For their next purchase, a relation can be found according to which region Chinese
people live in and their preferences for brand image (significance = 0.02) design
(significance = 0.034), technology (significance = 0.016), and Chinese brand
(significance = 0.009).
Despite many variables being related with the region of residence, some cannot be explained
because of their significance level:
Safety (0.335), fuel efficiency (0.171), quality (0.944), affordability (0.804), comfort (0.207).

45
Non-car owners’ preferences for their next purchase explained according to the
respondent’s degree of urbanization (see appendixes B.2.5.28 to B.2.5.36)
The relation with in between the degree of urbanization and the following preferences could
not be validated because of non-acceptable significance levels:
Safety (0.52), brand image (0.651), design (0.419), fuel efficiency (0.23), quality (0.218),
affordability (0.712), Chinese brand (0.469).
Results show that there is a relation in between comfort (significance = 0.014) and
technology (significance=0.01) importance perception regarding the degree of
urbanisation of the non-car owners.
4.4.5.2 Non-car owners’ preferences for their first purchase explained by
Customer behaviour
Non-car owners’ preferences for their next purchase explained according to the
respondent’s level of experience (see appendixes B.3.2.28 to B.3.2.36):
The relation with in between the level of experience and the following preferences could not
be validated because of non-acceptable significance levels:
Safety (0.836), design (0.126), quality (0.566), technology (0.987), affordability (0.369),
comfort (0.586), Chinese brand (0.179).
Nevertheless, the importance of brand image (significance = 0.013) and fuel
efficiency (significance = 0.07) for non-car owners is linked to their level of
experience.
4.5 Macro data for the dynamic aspect
The authors, in order to predict the dynamics of potential segments, chose to rely on macro
data used in previous researches and that theory suggests. The macro factors used are the
GDP per capita evolution in China, the age distribution, gender distribution, degree of
urbanization and region of residence trends. Those predictive elements will enable the
estimation of the size of the different segments found by the analysis of the empirical data
collected by the survey.

46
Figure 5: China GDP per capita from 1999 to 2020
The data from Index mundi (2013-05-18) have been gathered until 2011 and the authors drew
an exponential trend line from the data available to predict the Chinese GDP per capita until
2020. The purchasing power of Chinese people is predictably rising exponentially for the
coming years. The age of Chinese people, the authors’ second prediction tool, is available
below on the Figure 6.
The population in age of driving, composed of the working age population and the elderly
population, is increasing, but also getting older. According to Booz & co. (2013-05-20), the
shift in this driving able population is happening between the population 25-44y.o and 45 and
above. The first category is going to decrease while the other one is going to increase.
Figure 6: Evolution of Chinese population’s age (Nomura, 2013-05-18)
0
10,000
20,000
30,000
40,000
50,000
60,000
70,000
80,000
90,000
100,000
1 3 5 7 9 11 13 15 17 19 21
China GDP per capita from 1999 to 2020
China
Expon. (China)
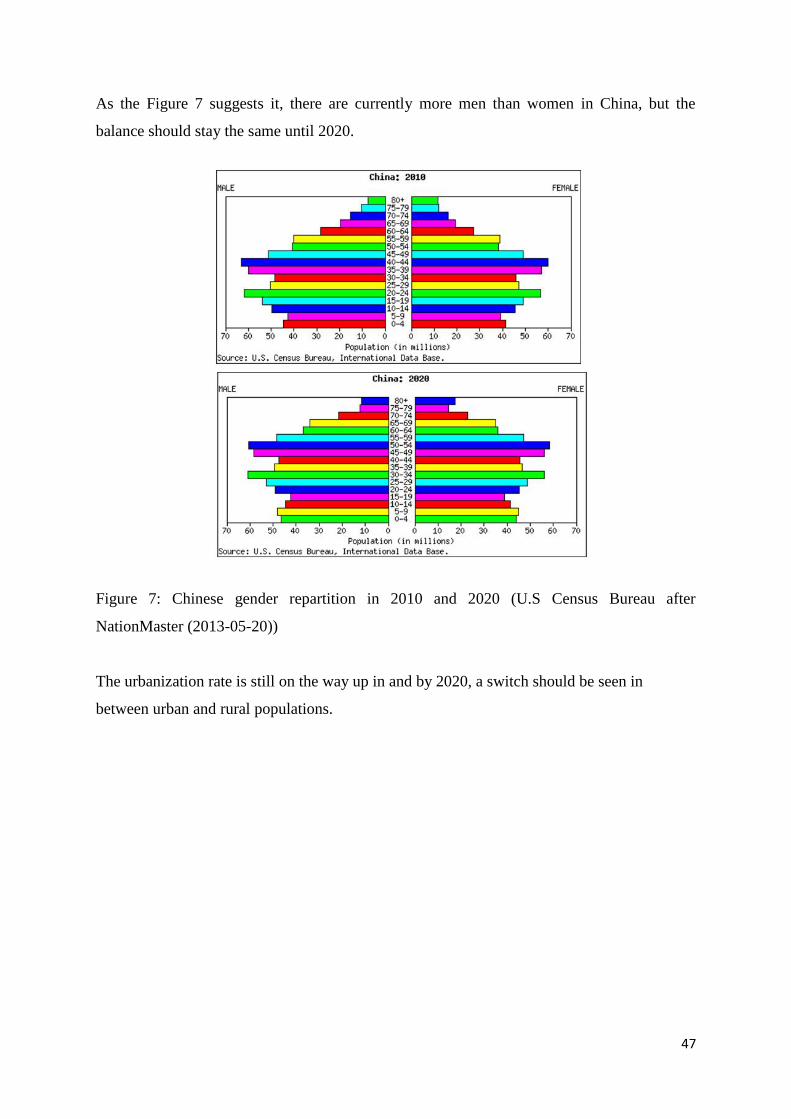
47
As the Figure 7 suggests it, there are currently more men than women in China, but the
balance should stay the same until 2020.
Figure 7: Chinese gender repartition in 2010 and 2020 (U.S Census Bureau after
NationMaster (2013-05-20))
The urbanization rate is still on the way up in and by 2020, a switch should be seen in
between urban and rural populations.

48
Figure 8: Evolution of the degree of urbanisation in China (Stanford university, 2013-5-22)
Concerning the dynamic view on intern Chinese migrations, Central China is a major
departure place and many people living there are going to Eastern China. To some extent,
Western China is a region of destination, and North East China sees as much arrivals as
departures.
Figure 9: Inter-regional migrations (China data centre, 2013-05-20)

49
5. Analysis
In this part, the authors will deal with the empirical data relating it to the model of analysis in
order to make sense out of all the data collected.
5.1 Control Variables
The authors chose their first control variable as region of residence as the study is only
focused on the Chinese car market and the respondents are currently residing in China. The
majority of the respondents are from the east coasts of China and the rest three regions have
fairly distributed respondents.
The second control variable in the study is the age of the respondents. According to the
library of congress (2013-05-20) and DSAL (2013-05-20) the minimum age of working in
China is 16 for private jobs and 18 for working in public services. The minimum age for
getting a driver’s license is 18 (Inter Nations 2013-05-20). The authors therefor set the
minimum age of respondents from 16, choosing the minimum working age. As shown in the
diagram in the empirical chapter the authors were able to reach major part of the age groups,
this gives the authors a wide variety of age group to study. Though the 65 and older group
could not be reached, the authors believe this will not affect the study as the authors therefor,
simply excluded this age group while finding relations through simple linear regression
analysis.
The control variable in the study controls the respondents by age and region of residence in
China, thus strengthening the findings.
5.2 Hybrid Behavioural segmentation
The first part of the model is how the behaviour is explained by demographics and
geographic data. It is shown by the black circles in the Figure 61 below:

50
Figure 10: Behaviour explained by Macro data
Looking at the results, the macro data indeed influences the behaviour of people and hybrid
segmentation can be made in between D, G and B. The following patterns can be observed:
Chinese people living west travel less for short distances than the Chinese living Eastern.
The older the car user is, the more experienced they are concerning car purchases
Women are more loyal than men and tend to change their mind less than men from one
purchase to the next.
The higher incomes Chinese people have the less the respondents use their car.
5.3 Hybrid Psychographic segments
In this other part, product-specific psychographics are explained by both macro data from
demographics and geographic profiles, and by behaviours, relying on the time aspect: current
opinion or predictive opinion.

51
Figure 11: Psychographics explained by Geographic data, Demographics and Behaviours
Global perceptions of importance are merely explained by macro data. The results show that
the older the respondents are, the more they think that others do not care about design and
comfort when purchasing their car. The respondents think that the less a Chinese person is
urbanised, the more importance this person would grant to the fact that a car is under a
Chinese brand. To summarize, the product specific psychographics here are not going in a
positive way and people are expressing a decreasing importance of attributes consideration by
the market.
Concerning the preferences expressed by car owners, many more relations can be deduced
from their behaviour, geographic and demographic situation. As the age of the respondents
grows, the less they care about the design of their car. Affordability seems to be a more
feminine than masculine concern. The western a respondent lives the less importance he
grants to quality. The less urbanized the more the importance for Chinese brand is granted.
The respondents currently owning a car and using it often grant more importance to the fact
that a car was affordable when they purchased their car; they are also more concerned by the

52
quality of it. The more the respondents are having long trips, the less technology is
considered as important as attribute for his current vehicle. The more the respondents drive
for long trips, the less they have granted importance to affordability at the time they
purchased their car and when would prefer quality for short trips. The more often a
respondent replaces his/her car, the more he/her judges the brand image as an important
purchase factor.
Concerning the dynamic aspect included in the next purchase questions asked to car owners
the hybrid segmentation is giving a lot of relations: the older the respondent is, the more
importance he/she will grant to fuel efficiency for the next purchase. The higher income
he/she earns the more important safety is bound to be considered. The results from the survey
indicates that the western a respondent lives, the more he/she is going to take brand image
and brand image into consideration and the more urbanized, the more he/she would consider
quality as important. As a Chinese person is more and more experienced with car purchases,
he/she will bother less for brand image and design. The more he/she uses his/her car the more
important the more he/she will consider affordability. Concerning the type of use, long trips
are associated to an increased importance for design and short trips to an increased
importance of affordability.
The predictive market is also composed by the preferences of people who do not currently
own a car but plan to buy one in the future. The older someone who has no car is, the less
important design will be. The more Chinese people live in the West, the more they will grant
importance to the brand image, design, technology and Chinese brand. The more urbanized,
the more the non-car owner is going to judge technology and comfort as important for his/her
next purchase. People who do not currently have a car will tend to consider the brand image
as less important as they are experienced but would consider fuel efficiency as important.
5.4 Dynamic Hybrid Psychographic segments
If it is possible to put those hybrid psychographic segments in relation with available macro
data predictions, the authors should be able to show a dynamic aspect of the hybrid segments.
Chinese population is getting older, more urbanized, richer, and more concentrated in the
Eastern and Western parts of China, this is impacting the future importance of the product-
specific profiles found with the psychographic measurement above.

53
The profiles found can therefore be strengthened by those dynamics, their importance
growing up for the coming years.
6. Conclusion and discussion
Market segmentation has been very interesting area to study; especially as the focus was on
segmenting the emerging Chinese car market. China with its fast growing economy, and huge
population, made this study more interesting and challenging than if the authors focused on a
very predictable and well-known market.
With the help of hybrid segmentation; combining the macro and micro aspects of
segmentation, the authors were able to create behavioral and preferential profiles of the
Chinese car consumers. Only the relations with significant values, between the bases of
segmentation, were taken into account while all the relations with insignificant values were
discarded. The authors have been able to present the profiles according to its desirability.
In many cases, profiles identified by the study also anticipated the preferential demand of
potential car customers, who either have never bought a car or are planning to buy a car in the
near future. This helps having an insight of what the demand would look like in the near
future. The secondary data has also been used to find the way towards which the speech is
formulated: for example, as the Chinese population is getting older, the results are expressed
in this way and not towards a younger and younger Chinese population.
In terms of behaviour, Chinese people tend to have owned more and more cars but the rate of
usage gets lower. Western Chinese and Eastern Chinese differ in the fact that in the East
people use the car more for short trips and in the West for long trips.
In terms of preferences, here are the profiles found for each car attribute:
Safety:
Globally, safety is the most important criteria people consider and should stay the most
important. For their next purchase, car owners would consider it more important as they are
richer.
54
Quality:
Quality is the second most considered car attribute and is specially associated with current car
owners. The western car owners are from in China, the less they grant importance to quality.
The more often the use their car for short daily trips the more important they judge quality.
For car owners next purchase the more urbanised they are the more importance they will be
giving to quality.
Fuel efficiency:
Fuel efficiency is the third most considered car attribute and is a rising attribute for everyone
in China. Old car owners, experienced persons and non-car owners will consider this attribute
more important for their next car purchase.
Comfort:
Comfort is the fourth most considered car attribute and is associated with young urban
Chinese people. With age Chinese people think comfort is not a major public concern when
buying a car. For non-car owners next purchase the more they are urbanised the more comfort
is going to be important.
Technology:
Technology is the fifth most considered car attribute and seems attractive for western
urbanised people. Car owners using their cars mainly for long trips consider technology as
less important when driving a long time. For non-car owners’ next purchase the western they
live the more importance they give to technology and the more urbanised non-car owners are
the more importance they give to technology.
Design:
Design is the sixth most considered car attribute and its importance is globally decreasing as
it is related to the age of the Chinese people. Old Chinese individuals think people do not
consider design to be very important. They do think the same for their own car, so they
basically think that their judgement of the non-importance of design is shared by the market.
The more they are experienced the stronger this belief is for the next purchase.
For older non-car owners design is not going to be important for the coming purchase, and
design is not associated with long trips usage.

55
The western the Chinese people are situated the more they give importance to design.
Affordability:
Affordability is the seventh most considered car attribute and is supposed to grow for people
not using their car often in an urban environment. Women grant more importance to
affordability than men do when they have a car. The more often people use their car for short
daily trips the more importance they give to affordability, and the less they are using it the
less they will consider it for their next purchase.
Brand image:
Brand image is the eighth most considered car attribute and could be effective in Western
China for someone’s first car who intends to keep it. Chinese people who don’t change their
car often will grant less important to brand image. For the next purchase both car owners and
non-car owners from the west think that it is more important than in the east. The more
experienced people are the less important Brand Image will be for the non-car owners’ next
car.
Chinese brand:
Chinese brand is the least considered car attribute and is not globally important enough, but
would be effective for rural people of Western China. The more urbanised people are in
China, the less they are keen on Chinese brand when buying a car. And this belief is actually
observable in car owners’ preferences for their car. For both car owners’ and non-car owners’
next purchase, the western they live the more importance they give to Chinese brands.
7. Managerial implications, reflections, further research
7.1 Managerial implications
As the car market in China is literally booming, the preferences of car buyers change quickly,
and the market is really challenging to understand and anticipate.
The demand becoming higher, the Chinese car market is representing a crucial target for
manufacturers to make business on.

56
The profiles built are really precise and, depending on the positioning of the cars, the
manufacturer will be able to know how his business might evolve and might consider
marketing different types of cars if the demand is not showing any acceptable potential.
Since manufacturers build and market various types of cars, such as urban cars, SUVs or
sedan, the study can help them putting the highlight on special attributes of the type of car
according to the market preferences found.
The current demand is mainly oriented towards safety and quality as main attribute, and those
attributes are bound to stay a major preoccupation for Chinese people’s next car, and
constructors should adopt an attitude towards those attributes in order to reach the largest
current and potential targets. The Chinese people are also to use their car less often but the
float is still strongly growing.
Safety should absolutely be considered for luxury models.
Quality, technology and affordability should be emphasized, particularly for urban cars used
for short trips.
Fuel efficiency is a rising attribute for the next purchase and should be really considered for
any kind of behaviour.
Even though design is still important, it is going to be less and less important for Chinese
people, and reach the same levels as Brand image and Chinese brand, which are not major
concerns when buying a car, except in Western China.
From the profiles found, a typical car meeting the tastes of the demand can be imagined. This
ideal car would be built for short daily trips in an urban environment and prioritizing safety
and quality as major attributes. This car should also include a highlight on its fuel efficiency
since the future demand is going to consider it as important. The other aspects shall not be
neglected, but Chinese brand and Brand image seem not important to particularly emphasize.
Companies marketing cars on the market should have a car like this in their range. According
to trends, this type of car would be sold more and more.

57
The choice of positioning resulting after the segmentation is the car manufacturers’, and this
segmentation is helping them in the sense that, according to their strategy, they can have an
overview of what is realisable in China.
The managerial implications cited above can also help creating a specific strategy for the
Chinese market in order to reach a maximum of the demand. The segmentation process, if
made by the company itself, should follow the authors’ model in order to have the most
precise and valid profile possible. The preferences can be switched by the company’s core
competencies in order to have an insight of what it could achieve on the market with what it
mastered within the company. The profiles should nevertheless include demographic,
geographic, behavioural and psychographic data, as the model is built:
Figure 12: The hybrid segmentation model
7.2 Reflections
Working on the topic of car segmentation in China taught the authors a lot on segmentation
practices and gave them more experience in market research, this task eventually being a part

58
of their eminent career, after the master thesis. The study is thus a real plus and gives a
professional qualification.
The topic chosen also made them learn a lot about the car market in China.
Although the authors feel they could have had more answers from Chinese people, this is a
point that can be picked up for further research in order to obtain more validity from the
survey.
The study revealed itself very challenging and created strong links in the team carrying it out.
The team spirit has been submitted to a lot of pressure and the authors find a great
satisfaction in its resistance.
7.3 Limitations
Due to time restraints and in order to keep a precise focus, the authors did not take external
factors such as the influence of the Chinese government policies in the equation.
Also, the study is limited by the number of responses gathered, that could have been greater.
7.4 Future Research
As future research, authors should investigate points such as the influence of the Chinese
Government policies on the demand for cars, as it is assumed to be playing a major role and
could alter preferences.

59

60
References
Amine, L. S. and Smith, J. A. (2009), "Challenges to Modern Consumer Segmentation in a
Changing World: The Need for a Second Step", Multinational Business Review, Vol. -17,
Issue 3, pp. 71–100.
Anderson, D. Sweeney, D. and Williams, T. (2002), Statistics for business and economics 8e,
(pp 539-612). Ohio, South Western.
APCO, (2013-03-22) “Market Analysis Report: China’s Automotive Industry”. APCO
Worldwide, [Online]. Available at:
http://www.export.gov.il/uploadfiles/03_2012/chinasautomotiveindustry.pdf, Accessed:
2013-03-22.
Armstrong, G. and Kotler, P. (2011), Marketing: An Introduction, London, Pearson.
Autos Cars, (2013-03-22) “Automobile”. Autos Cars, [Online]. Available at:
http://autoscars.sexyi.am/index/automobile/?wiki-maping=[6], Accessed: 2013-03-22.
Beane, T.P. and Ennis, D.M. (1987), "Market Segmentation: A Review", European Journal
of Marketing, Vol. -21, Issue 5, pp. 20-42.
Bentley historical library, (2013-03-22) “Automotive History”. Bentley historical library
University of Michigan, [Online]. Available at:
http://bentley.umich.edu/research/guides/automotive/, Accessed: 2013-03-22.
Bryman, A. and Bell, E. (2007), Business research methods, Oxford: Oxford university press.
Cannon, H. M. and Yaprak, A. (2011),"A dynamic framework for understanding cross-
national segmentation", International Marketing Review, Vol. -28, Issue 3, pp. 229-243.
China data center, (2013-05-20), “The Inter-Regional Migration in China”, China data center
University of Michigan, [Online]. Available at:
http://chinadatacenter.org/presentation/ChinaMigration.pdf Accessed: 2013-05-20.
Chin-Feng, L. (2002), “Segmenting customer brand preference: demographic or
psychographic”, Journal of Product & Brand Management, Vol. -11, Issue 5, pp. 249-268.
Cui, G. and Liu, Q. (2000), "Regional market segments of China: opportunities and barriers
in a big emerging market", Journal of International Business Studies, Vol. -39, Issue 4, pp.
652-669.
Douglas, S. P and Craig, C. S. (2010), "The role of context in assessing international
marketing opportunities", International Marketing Review, Vol. -28, Issue 2, pp. 150-162.

61
DSAL (2013-05-20), “Convention concerning Minimum Age for Admission to
Employment”, Driving license school of Louisiana, [Online]. Available at:
http://www.dsal.gov.mo/law/E138.htm Accessed: 2013-05-20.
Frank, R., Massy, W. and Wind, Y. (1972), Market Segmentation, Englewood Cliffs,
Prentice-Hall.
Gaston-Breton, C. and Martin, O. M., (2011), "International market selection and
segmentation: a two-stage model", International Marketing Review, Vol. -28, Issue. 3, pp.
267-290.
Grundy, T. (2006), “Rethinking and reinventing Michael Porter's five forces model”,
Strategic Change, Vol. -15, Issue 5, pp. 213-229.
Hassan, S.S., Craft, S. and Kortam, W. (2003),"Understanding the new bases for global
market segmentation", Journal of Consumer Marketing, Vol. -20, Issue 5, pp. 446–462.
Holbrook, M. and Hirschman, E. (1982), “The Experiential Aspects of Consumption:
Consumer Fantasies, Feelings, and Fun”, Journal of Consumer Research, Vol. -9, Issue 2, pp.
132-140.
HSBC, (2013-03-22) “China: an ever-changing market”. HSBC global connection [Online],
Available at: http://globalconnections.hsbc.com/global/en/articles/china-ever-changing-
market, Accessed: 2013-03-22.
Indexmundi.com, (2013-05-18), “GDP – per capita (PPP) (US$)”, indexmundi.com, [Online].
Available at: http://www.indexmundi.com/g/g.aspx?c=ch&v=67, Accessed: 2013-05-18.
Inter Nations, (2013-05-20), “Traffic laws in China”, Driving in China, [Online]. Available
at: http://www.internations.org/china-expats/guide/driving-in-china-15632/traffic-laws-in-
china-2 Accessed: 2013-05-20.
Jiang, P. (2000), “Segment-based mass customization: an exploration of a new conceptual
marketing framework”, Internet Research, Vol-10, Issue 3, pp. 215-226.
Kotler, P. (1989), "From mass marketing to mass customization", Strategy & Leadership,
Vol. -17, Issue 5, pp.10–47.
Kotler, P. and Keller, K. (2009), Marketing Management, Upper Saddle River, Pearson
Prentice Hall.
Lancaster, G and Williams, I. (2002), "Consumer segmentation in the grey market relative to
rehabilitation products", Management Decision, Vol. -40, Issue 4, pp. 393-410.
Library of congress (2013-05-20), “Children's Rights: China”, Library of congress, [Online].
Available at: http://www.loc.gov/law/help/child-rights/china.php Accessed: 2013-05-20.

62
Library of congress (2013-03-22), “Everyday Mysteries”. Science Reference Services,
[Online]. Available at: http://www.loc.gov/rr/scitech/mysteries/auto.html, Accessed: 2013-
03-22.
McKinsey (2013-03-22), “Upward Mobility: The Future of China’s Premium Car Market”.
McKinsey & Company, [Online]. Available at: http://www.mckinseychina.com/wp-
content/uploads/2013/03/mckinsey-upward-mobility-the-future-of-chinas-auto-market.pdf,
Accessed: 2013-03-22.
NationMaster (2013-05-20), “Age distribution”, NationMaster [Online]. Available at:
http://www.nationmaster.com/country/ch/Age_distribution, Accessed: 2013-05-22.
Nomura (2013-05-18), Comments on China’s economic transition: Supply side,
Nomura Institute of Capital Markets Research [online].Available at:
http://www.nomurafoundation.or.jp/data/20121113_C_H_Kwan_Comment-PPT.pdf,
Accessed: 2013-05-18.
Pehrsson, A. (2006), “Business relatedness and performance: a study of managerial
perceptions”, Strategic Management Journal, Vol-27, Issue 3, pp. 265-282.
Quinn, L., Hines, T. and Bennison, D. (2007),"Making sense of market segmentation: a
fashion retailing case", European Journal of Marketing, Vol. -41, Issue 5, pp. 439–465.
Booz & co. (2013-05-20), “The eight overarching China automotive trends that are
revolutionizing the auto industry”, Booz & Company. [Online], Available at:
http://www.booz.com/media/file/The_Eight_Overarching_China_Automotive_Trends_en_pa
rt2.pdf, Accessed: 2013-05-22.
Steenkamp, J. B. E. M. (2001),"The role of national culture in international marketing
research", International Marketing Review, Vol-18, Issue 1, pp. 30–44.
Taehyun Kim, T. and Lee, H.Y. (2011), "External validity of market segmentation methods;
A study of buyers of prestige cosmetic brands", European Journal of Marketing, Vol. 45,
Issue 1/2, pp. 153-169.
The guardian (2013-03-22), “China and cars: a love story”. World news [Online]. Available
at: http://www.guardian.co.uk/world/2012/dec/14/china-worlds-biggest-new-car-market,
Accessed: 2013-03-22.
Wedel, M. A. and Kamakara, W.A.A. (2000), Market segmentation: conceptual and
methodological foundations, Massachusetts, Kluer Academic Publisher.
Weick, K. E. (1995), Sensemaking In Organizations, Thousand Oaks, Calif, Sage.
Weinberg, C. B. (1972),"The time sequence of events B a basis for market segmentation",
European Journal of Marketing, Vol. -6, Issue 1, pp. 60-63.

63
Wells, W.D. (1975), “Psychographics: A Critical Review”, Journal of Marketing Research,
Vol. -12, Issue 2, pp. 196-213.
West, D., Ford, J. and Ibrahim, E. (2006), Strategic Marketing: Creating Competitive
Advantage, Oxford, Oxford University Press

64
Appendix A
The Survey
Chinese Car Market Survey
Hello, we are two students living in Sweden and writing our master thesis. The purpose of this questionnaire is
to study the Chinese car market, and to determine its future in terms of preferences. We are going to ask you
basic information about yourself, your past experience with cars, what you would like now and in the future.
(您好,我们是两个住在瑞典的学生,在进行我们的硕士论文。这份问卷的目的,是为了研究中国汽车
市场,并尝试探讨以后市场的喜好。我们会问及到你的一些基本信息,你过去有关汽车的经验,和你对
现在和未来汽车需要或者想法。)
The survey takes about 5 minutes and is free of charge. The answers are anonymous.
(此调查卷大约需要5分钟。这个调查卷是以自愿和匿名的形式进行。)
If you have any question regarding our research, feel free to contact our tutor Anders Pehrsson
on [email protected] or ourselves on [email protected] or [email protected].
(如果您对我们的研究有任何问题,请随时联系我们的导师安德斯Pehrsson anders.pehrsson@ lnu.se
或者我们 [email protected]或[email protected]。)
Thank you in advance.
(致敬
感谢)
1. Where do you live? (您目前在中国的居住地属于哪个地区?)
o East coast (中国东海岸)
o Central China (中国中部)
o North East China (中国东北)
o Western China (中国西部)
2. What size is the city you live in? (您所生活的城市有多大?)
o Municipality of China (省级城市)
o Sub provincial level city (副省级城市)
o Sub prefecture level city (地级市)
o Town, village (镇,村)
3. How old are you? (您的年龄为?)
o 16-19
o 20-34
o 35-49
o 50—64
o Above 65(65岁及以上)
4. Gender: (您的性别为:)

65
o Male (男)
o Female (女)
5. Annual income (in Yuan)? (全年总收入(元)?)
o no incomes (没有收入)
o 10 000 to 30 000 (10 000至30000)
o 30 000 to 46 000 (30000至46 000)
o 46 000 to 87 000 (46 000至87000)
o 87 000 to 120 000 (87 000至120 000)
o 120 000 to 163 000 (120000 至 163000)
o above (163000以上)
YOUR OPINION (您个人的看法)
6. What factor do you think is the most important for most of the people? Please grade the following car
attributes from 1 (not important at all) to 5 (very important).
(对于大多数的人而言,你认为哪个因素是汽车最重要的?
请对汽车各个不同属性评分,从1-5分,(评分从低到高,1分为最不重要,5分为最重要))
1 2 3 4 5
1 Safety (安全)
2 Brand image
(品牌形象/社会地位)
3 Design (设计)
4 Fuel
efficiency (燃油效率)
5 Quality (质量)
6 Technology (技术)
7
Affordability (负担能力)
8 Comfort (舒服性)
9 Chinese
Brand (中国品牌)
YOUR EXPERIENCE WITH CARS (您个人与汽车的经验)
7. How many cars have you bought? (你买过多少辆汽车?)
0, 1, 2, 3, 4, 5, 6 or more.
8. Do you have a car now? (你现在有汽车吗?)
Yes No
8.1.1. How often do you use your car?
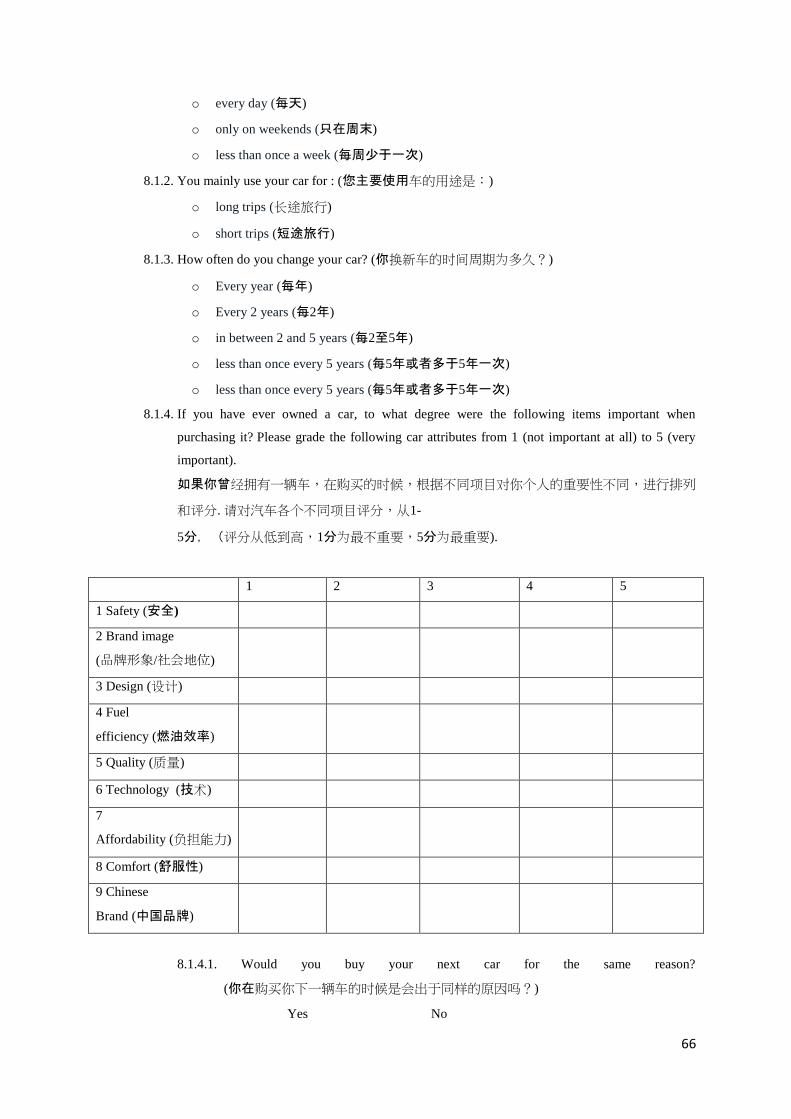
66
o every day (每天)
o only on weekends (只在周末)
o less than once a week (每周少于一次)
8.1.2. You mainly use your car for : (您主要使用车的用途是:)
o long trips (长途旅行)
o short trips (短途旅行)
8.1.3. How often do you change your car? (你换新车的时间周期为多久?)
o Every year (每年)
o Every 2 years (每2年)
o in between 2 and 5 years (每2至5年)
o less than once every 5 years (每5年或者多于5年一次)
o less than once every 5 years (每5年或者多于5年一次)
8.1.4. If you have ever owned a car, to what degree were the following items important when
purchasing it? Please grade the following car attributes from 1 (not important at all) to 5 (very
important).
如果你曾经拥有一辆车,在购买的时候,根据不同项目对你个人的重要性不同,进行排列
和评分. 请对汽车各个不同项目评分,从1-
5分,(评分从低到高,1分为最不重要,5分为最重要).
1 2 3 4 5
1 Safety (安全)
2 Brand image
(品牌形象/社会地位)
3 Design (设计)
4 Fuel
efficiency (燃油效率)
5 Quality (质量)
6 Technology (技术)
7
Affordability (负担能力)
8 Comfort (舒服性)
9 Chinese
Brand (中国品牌)
8.1.4.1. Would you buy your next car for the same reason?
(你在购买你下一辆车的时候是会出于同样的原因吗?)
Yes No

67
8.1.4.1.1. If you would buy a different car, what attribute would you consider the most
important for the next purchase? Please grade the following car attributes from 1
(not important at all) to 5 (very important).
如果你曾经拥有一辆车,在购买的时候,根据不同项目对你个人的重要性不
同,进行排列和评分. 请对汽车各个不同项目评分,从1-
5分,(评分从低到高,1分为最不重要,5分为最重要)
1 2 3 4 5
1 Safety (安全)
2 Brand image
(品牌形象/社会地位)
3 Design (设计)
4 Fuel
efficiency (燃油效率)
5 Quality (质量)
6 Technology (技术)
7
Affordability (负担能力)
8 Comfort (舒服性)
9 Chinese
Brand (中国品牌)
8.2. If you do not own a car, do you plan to buy one in the future?
(如果你不拥有自己的汽车,你打算购买一台在未来?)
Yes NO
8.2.1. If you plan to buy a car, to what degree would the following items be the most important to you?
Please grade the following car attributes from 1 (not important at all) to 5 (very important).
如果你打算买一辆车,以下项目,请给予评分,评出他们在你购买的重要性占多少 . 请对汽车各个
不同项目评分,从1-5分,(评分从低到高,1分为最不重要,5分为最重要)
1 2 3 4 5
1 Safety (安全)
2 Brand image
(品牌形象/社会地位)
3 Design (设计)
4 Fuel
efficiency (燃油效率)
5 Quality (质量)

68
6 Technology (技术)
7
Affordability (负担能力)
8 Comfort (舒服性)
9 Chinese
Brand (中国品牌)
Survey emails
First email of the survey.
Dear Sir/Madam
亲爱的先生,女士
Hello, we are two students from Linnaeus university, Sweden,we are writing our master thesis. The purpose of
this questionnaire is to study the Chinese car market, and to determine its future in terms of preferences. We are
going to ask you basic information about yourself, your past experience with cars, what you would like now and
in the future.
(您好,我们是两个住在瑞典的学生,在进行我们的硕士论文。这份问卷的目的,是为了研究中国汽车
市场,并尝试探讨以后市场的喜好。我们会问及到你的一些基本信息,你过去有关汽车的经验,和你对
现在和未来汽车需要或者想法。)
The survey takes about 5 minutes and is free of charge.The answers are anonymous.
(此调查卷大约需要5分钟。这个调查卷是以自愿和匿名的形式进行。)
You can find our survey at this website: 您可以在这个网站上找到我们的调查问卷:
http://www.keysurvey.co.uk/votingmodule/s180/f/509482/9236/
If you have any question regarding our research, feel free to contact our tutor Anders Pehrsson
on [email protected] or ourselves on [email protected] or [email protected].
(如果您对我们的研究有任何问题,请随时联系我们的导师安德斯Pehrsson anders.pehrsson@ lnu.se
或者我们 [email protected]或[email protected]。)
Thank you in advance.
(致敬
感谢)
Adrien SAINT, Imran SYED
(阿德里安·SAINT,赛义德伊姆兰)
The second survey email after an interval of 4 to 5 days
亲爱的先生,女士

69
您好,我们是两个住在瑞典的学生,在进行我们的硕士论文。这份问卷的目的,是为了研究中国汽车市
场,并尝试探讨以后市场的喜好。我们会问及到你的一些基本信息,你过去有关汽车的经验,和你对现
在和未来汽车需要或者想法。
此调查卷大约需要5分钟。这个调查卷是以自愿和匿名的形式进行。
您可以在这个网站上找到我们的调查问卷:
http://www.keysurvey.co.uk/votingmodule/s180/f/509482/9236/
(如果您对我们的研究有任何问题,请随时联系我们的导师安德斯Pehrsson [email protected]
或者我们 [email protected]或[email protected]。)
致敬
感谢
阿德里安•SAINT,赛义德伊姆兰
Dear Sir/Madam,
We are two marketing students from Linnaeus University, Sweden. We are at present writing our master thesis
about the car market segmentation in China. Therefore we would like to ask you few questions. The purpose of
this questionnaire is to study the Chinese car market, and to determine its future in terms of preferences. We are
going to ask you basic information about yourself, your past experience with cars, what you would like now and
in the future.
The survey takes about 5 minutes and is free of charge. The answers are anonymous. We would very much like
if you could kindly help us with our survey by answering the survey yourself and if could also please forward
this message to your respectable colleagues.
You can find our survey at this website:
http://www.keysurvey.co.uk/votingmodule/s180/f/509482/9236/
If you have any question regarding our research, feel free to contact us at [email protected]. or
[email protected]. You can also verify us with our tutor, professor Anders Pehrsson at
Thanking you in advance.
With Best Regards
Imran SYED &
Adrien SAINT
70
The third survey email (This email was later sent out four more times with an interval of 4 to 5 days)
Respectable sir/madam,
We are two marketing students from Linnaeus University, Sweden. We are at present writing our master thesis
about the car market segmentation in China. Therefore with your permission we would like to ask you few
questions. The purpose of this questionnaire is to study the Chinese car market, and to determine its future in
terms of preferences. We are going to ask some basic information about your experience with cars; what you
would like now and in the future.
The survey takes about 5 minutes and is free of charge. The answers are anonymous. We would very grateful if
you could kindly help us with our survey by answering the survey. Also if you could forward this survey to your
respectable colleagues.
You can find our survey at this website:
http://www.keysurvey.co.uk/votingmodule/s180/f/509482/9236/
If you have any question regarding our research, feel free to contact us [email protected].
or [email protected]. You can also verify us with our tutor, professor Anders Pehrsson
Thanking you in advance.
With Best Regards.
Imran SYED &
Adrien Saint
--------------------------
可敬的 先生/女士*,
我们是两个营销学生从瑞典林奈大学。目前,我们写我们的硕士论文关于汽车在中国市场分割。因此如
果你允许我们想问你几个问题。此问卷的目的是研究中国汽车市场,并确定其未来方面的偏好。我们要
问自己一些基本信息,你过去的经历与汽车;你想在现在和未来。
调查大约需要5分钟,是免费的。答案是匿名的。我们会很感激如果你可以请帮助我们与我们的调查回答
调查。而且如果你能把这个调查你的可敬的同事。
你可以找到我们的调查在这个网站用蓝色标示:
http://www.keysurvey.co.uk/votingmodule/s180/f/509482/9236/
如果你有任何问题关于我们的研究,随时联系我们 [email protected] 或 [email protected].

71
你也可以验证我们导师,教授安德斯Pehrsson在 [email protected].
提前感谢你。
此致敬礼。
Imran SYED &
Adrien Saint
Descriptive statistics
A.1 Geographic data
A.1.1 Region of residence repartition of the sample
A.2.2 Urbanization of the sample
A.2 Demographic data
A.2.1 Gender repartition of the sample
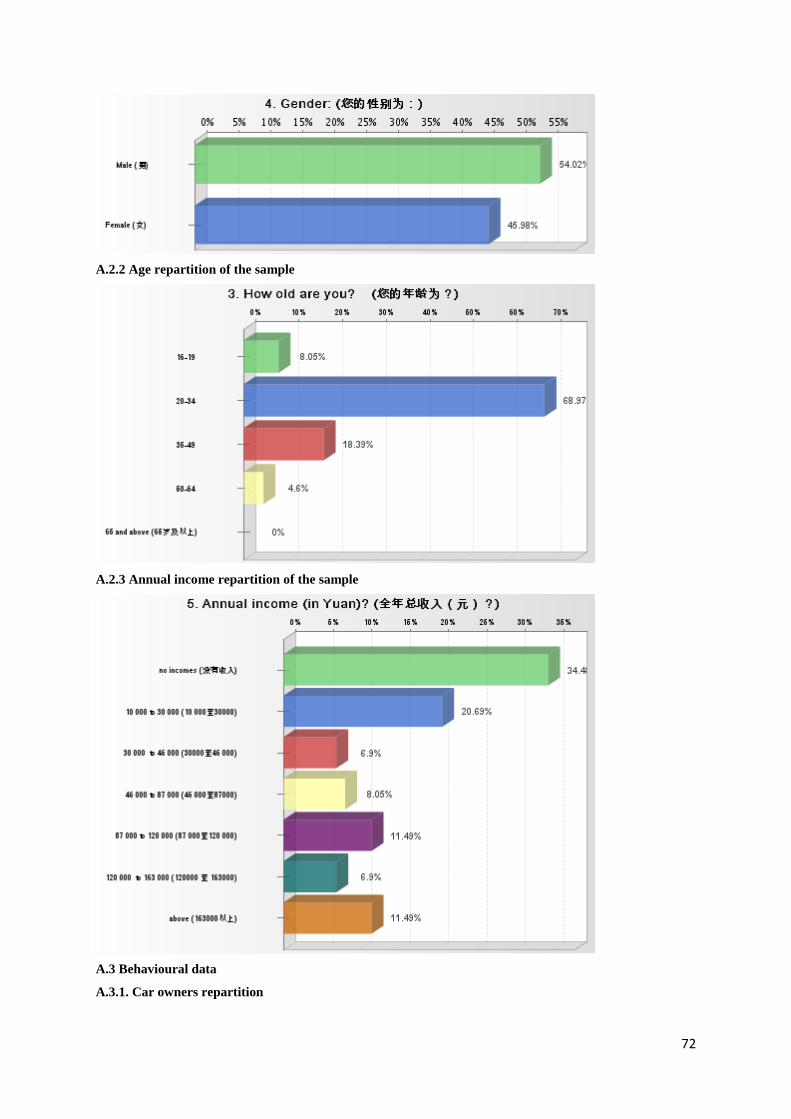
72
A.2.2 Age repartition of the sample
A.2.3 Annual income repartition of the sample
A.3 Behavioural data
A.3.1. Car owners repartition

73
A.3.2. Potential from non-car owners
A.3.3. Experience of respondents
A.3.4 Frequency of use
A.3.5. Style of use

74
A.3.6. Loyalty to attribute
A.3.7 Replacement rate
A.4 Psychographic data : table of average attributes importances
Statistiques descriptives
N Minimum Maximum Moyenne Ecart type
6. Perception of Global
Importance of Safety 89 1.00 5.00 4.6854 .76270
6. Perception of Global
Importance of Brand image 89 1.00 5.00 3.3820 1.07138
6. Perception of Global
Importance of Design 89 1.00 5.00 3.7865 .89788

75
6. Perception of Global
Importance of Fuel
efficiency
89 1.00 5.00 4.1236 .92712
6. Perception of Global
Importance of Quality 89 1.00 5.00 4.6067 .71697
6. Perception of Global
Importance of Technology 89 1.00 5.00 4.0449 .82448
6. Perception of Global
Importance of Affordability 89 1.00 5.00 3.6517 .97818
6. Perception of Global
Importance of Comfort 89 1.00 5.00 4.0225 .90425
6. Perception of Global
Importance of Chinese
Brand
89 1.00 5.00 2.1461 1.05044
8.1.4 Importance of Safety
for car owners 32 2.00 5.00 4.6875 .64446
8.1.4 Importance of Brand
image for car owners 32 1.00 5.00 3.3438 .90195
8.1.4 Importance of Design
for car owners 32 1.00 5.00 3.6563 .93703
8.1.4 Importance of Fuel
Efficiency for car owners 32 2.00 5.00 4.0937 .85607
8.1.4 Importance of Quality
for car owners 32 1.00 5.00 4.5938 .83702
8.1.4 Importance of
Technology for car owners 32 1.00 5.00 3.8125 1.06066
8.1.4 Importance of
Affordability for car owners 32 1.00 5.00 3.5000 1.27000
8.1.4 Importance of
Comfort for car owners 32 1.00 5.00 3.9063 1.05828
8.1.4 Importance of
Chinese Brand for car
owners
30 1.00 5.00 2.4333 1.19434
8.1.4.1.1 Importance of
Safety for the next purchase
by car owners
32 2.00 5.00 4.6875 .64446
8.1.4.1.1 Importance of
Brand Image for the next
purchase by car owners
32 1.00 5.00 3.5625 .91361

76
8.1.4.1.1 Importance of
Design for the next
purchase by car owners
31 1.00 5.00 3.8387 .86011
8.1.4.1.1 Importance of
Fuel Efficiency for the next
purchase by car owners
32 1.00 5.00 4.0313 .93272
8.1.4.1.1 Importance of
Quality for the next
purchase by car owners
32 2.00 5.00 4.5312 .84183
8.1.4.1.1 Importance of
Technology for the next
purchase by car owners
32 1.00 5.00 4.1250 .87067
8.1.4.1.1 Importance of
Affordability for the next
purchase by car owners
32 1.00 5.00 3.7500 1.19137
8.1.4.1.1 Importance of
Comfort for the next
purchase by car owners
31 1.00 5.00 4.1290 .95715
8.1.4.1.1 Importance of
Chinese Brand for the next
purchase by car owners
32 1.00 5.00 2.5938 1.24069
8.2.1 Importance of Safety
for non car owners for their
next purchase
83 1.00 5.00 4.7831 .64483
8.2.1 Importance of Brand
Image for non car owners
for their next purchase
83 1.00 5.00 3.3253 1.11649
8.2.1 Importance of Design
for non car owners for their
next purchase
83 1.00 5.00 3.9277 .82319
8.2.1 Importance of Fuel
Efficiency for non car
owners for their next
purchase
83 2.00 5.00 4.3133 .76394
8.2.1 Importance of Quality
for non car owners for their
next purchase
83 2.00 5.00 4.6265 .63842

77
8.2.1 Importance of
Technology for non car
owners for their next
purchase
83 1.00 5.00 4.0000 .91064
8.2.1 Importance of
Affordability for non car
owners for their next
purchase
82 1.00 5.00 3.8049 1.02366
8.2.1 Importance of
Comfort for non car owners
for their next purchase
80 1.00 5.00 4.1375 .97752
8.2.1 Importance of
Chinese Car for non car
owners for their next
purchase
82 1.00 5.00 2.4146 1.11057
N valide (listwise) 21
Appendix B
Linear regression analysis and linear curve estimates
B.1. Customer behaviour explained by Geographic and Demographic data
B.1.1. Region of residence
B.1.1.1. Number of cars owned (Experience)
Model Summary
R R Square Adjusted R Square Std. Error of the
Estimate
.243 .059 .028 .751
The independent variable is 1. Region of Residence.
ANOVA
Sum of Squares df Mean Square F Sig.
Regression 1.061 1 1.061 1.880 .181
Residual 16.939 30 .565
Total 18.000 31
The independent variable is 1. Region of Residence.
B.1.1.2. Frequency of Use

78
Model Summary
R R Square Adjusted R Square Std. Error of the
Estimate
.247 .061 .030 .650
The independent variable is 1. Region of Residence.
ANOVA
Sum of Squares df Mean Square F Sig.
Regression .824 1 .824 1.949 .173
Residual 12.676 30 .423
Total 13.500 31
The independent variable is 1. Region of Residence.
B.1.1.3. Style of use: Long trips
Model Summary
R R Square Adjusted R Square Std. Error of the
Estimate
.108 .012 -.021 .424
The independent variable is 1. Region of Residence.
ANOVA
Sum of Squares df Mean Square F Sig.
Regression .063 1 .063 .351 .558
Residual 5.406 30 .180
Total 5.469 31
The independent variable is 1. Region of Residence.
B.1.1.4. Style of Use: Short trips
Model Summary
R R Square Adjusted R Square Std. Error of the
Estimate
.302 .091 .061 .326
The independent variable is 1. Region of Residence.
ANOVA
Sum of Squares df Mean Square F Sig.
Regression .318 1 .318 3.001 .093
Residual 3.182 30 .106
Total 3.500 31
The independent variable is 1. Region of Residence.

79
B.1.1.5. Car replacement rate
Model Summary
R R Square Adjusted R Square Std. Error of the
Estimate
.069 .005 -.028 .717
The independent variable is 1. Region of Residence.
ANOVA
Sum of Squares df Mean Square F Sig.
Regression .073 1 .073 .142 .709
Residual 15.427 30 .514
Total 15.500 31
The independent variable is 1. Region of Residence.
B.1.1.6. Buying the next car for the same reason (Loyalty attributes)
Model Summary
R R Square Adjusted R Square Std. Error of the
Estimate
.100 .010 -.023 .445
The independent variable is 1. Region of Residence.
ANOVA
Sum of Squares df Mean Square F Sig.
Regression .060 1 .060 .304 .586
Residual 5.940 30 .198
Total 6.000 31
The independent variable is 1. Region of Residence.
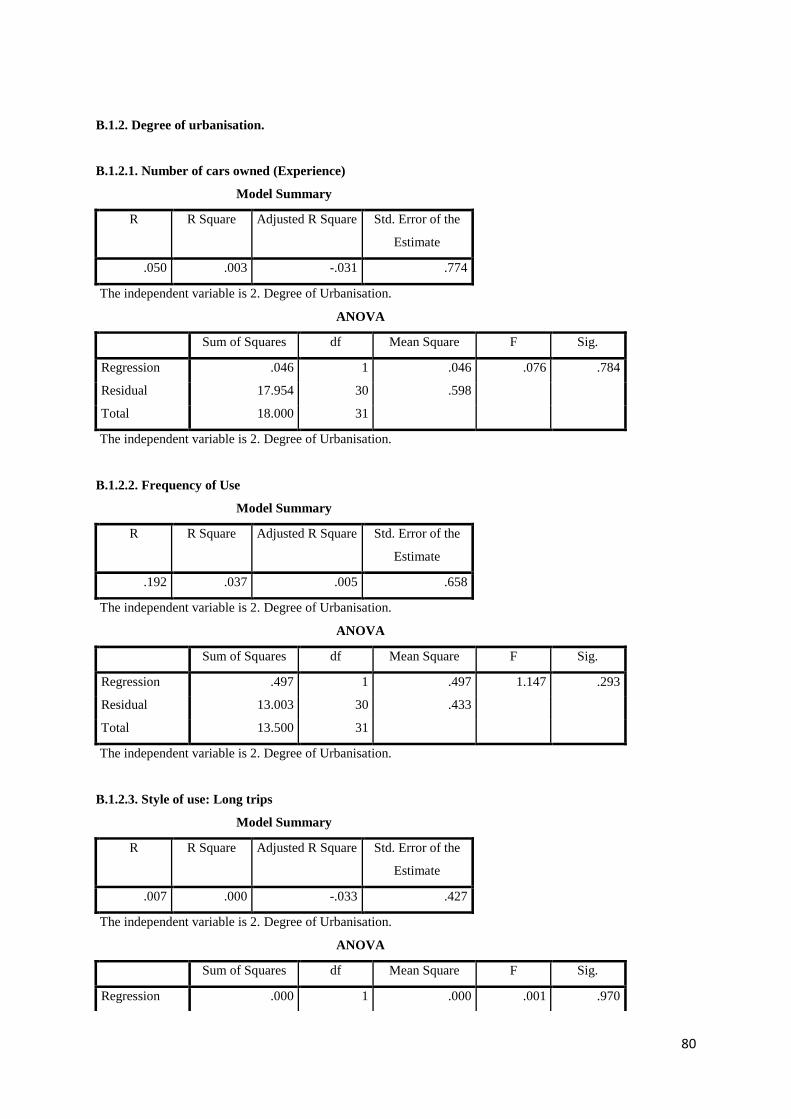
80
B.1.2. Degree of urbanisation.
B.1.2.1. Number of cars owned (Experience)
Model Summary
R R Square Adjusted R Square Std. Error of the
Estimate
.050 .003 -.031 .774
The independent variable is 2. Degree of Urbanisation.
ANOVA
Sum of Squares df Mean Square F Sig.
Regression .046 1 .046 .076 .784
Residual 17.954 30 .598
Total 18.000 31
The independent variable is 2. Degree of Urbanisation.
B.1.2.2. Frequency of Use
Model Summary
R R Square Adjusted R Square Std. Error of the
Estimate
.192 .037 .005 .658
The independent variable is 2. Degree of Urbanisation.
ANOVA
Sum of Squares df Mean Square F Sig.
Regression .497 1 .497 1.147 .293
Residual 13.003 30 .433
Total 13.500 31
The independent variable is 2. Degree of Urbanisation.
B.1.2.3. Style of use: Long trips
Model Summary
R R Square Adjusted R Square Std. Error of the
Estimate
.007 .000 -.033 .427
The independent variable is 2. Degree of Urbanisation.
ANOVA
Sum of Squares df Mean Square F Sig.
Regression .000 1 .000 .001 .970

81
Residual 5.468 30 .182
Total 5.469 31
The independent variable is 2. Degree of Urbanisation.
B.1.2.4. Style of Use: Short trips
Model Summary
R R Square Adjusted R Square Std. Error of the
Estimate
.057 .003 -.030 .341
The independent variable is 2. Degree of Urbanisation.
ANOVA
Sum of Squares df Mean Square F Sig.
Regression .011 1 .011 .098 .756
Residual 3.489 30 .116
Total 3.500 31
The independent variable is 2. Degree of Urbanisation.
B.1.2.5. Car replacement rate
Model Summary
R R Square Adjusted R Square Std. Error of the
Estimate
.038 .001 -.032 .718
The independent variable is 2. Degree of Urbanisation.
ANOVA
Sum of Squares df Mean Square F Sig.
Regression .022 1 .022 .043 .836
Residual 15.478 30 .516
Total 15.500 31
The independent variable is 2. Degree of Urbanisation.
B.1.2.6. Buying the next car for the same reason (Loyalty attributes)
Model Summary
R R Square Adjusted R Square Std. Error of the
Estimate
.052 .003 -.031 .447
The independent variable is 2. Degree of Urbanisation.
ANOVA

82
Sum of Squares df Mean Square F Sig.
Regression .016 1 .016 .082 .776
Residual 5.984 30 .199
Total 6.000 31
The independent variable is 2. Degree of Urbanisation.
B.1.3. Behaviour by age
B.1.3.1. Number of cars owned (Experience)
Model Summary
R R Square Adjusted R Square Std. Error of the
Estimate
.461 .213 .186 .687
The independent variable is 3. Age.
ANOVA
Sum of Squares df Mean Square F Sig.
Regression 3.828 1 3.828 8.103 .008
Residual 14.172 30 .472
Total 18.000 31
The independent variable is 3. Age.
B.1.3.2. Frequency of Use
Model Summary
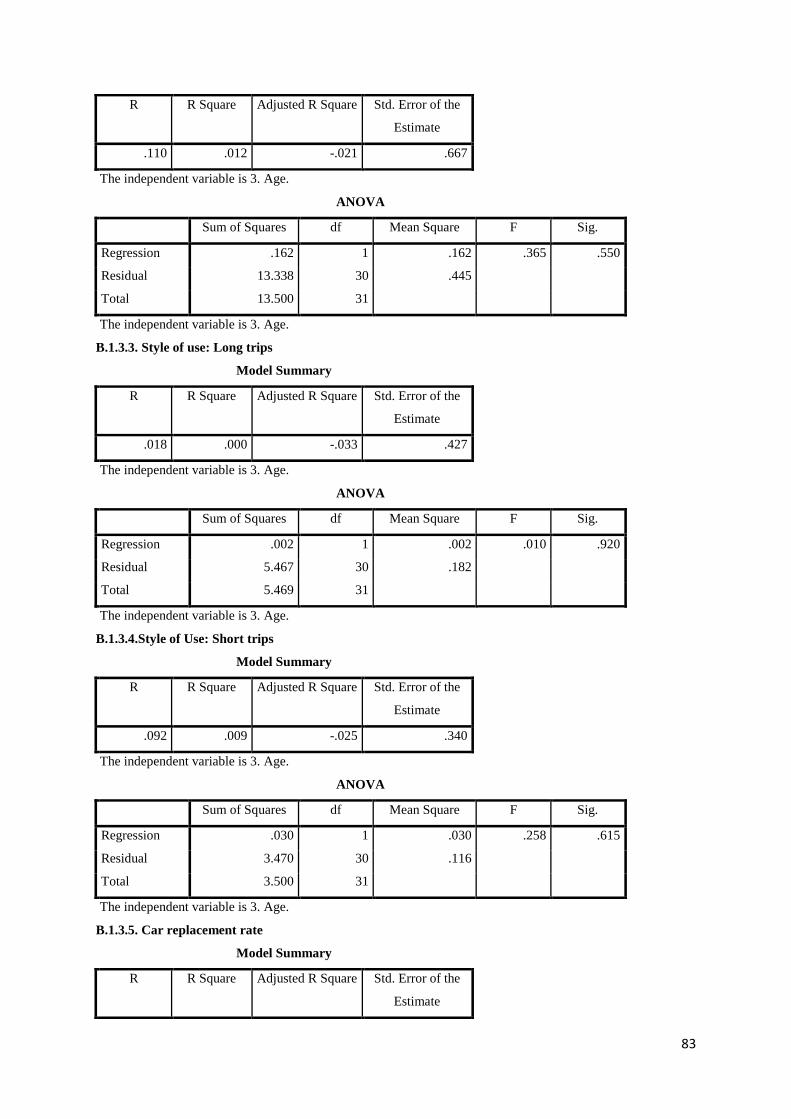
83
R R Square Adjusted R Square Std. Error of the
Estimate
.110 .012 -.021 .667
The independent variable is 3. Age.
ANOVA
Sum of Squares df Mean Square F Sig.
Regression .162 1 .162 .365 .550
Residual 13.338 30 .445
Total 13.500 31
The independent variable is 3. Age.
B.1.3.3. Style of use: Long trips
Model Summary
R R Square Adjusted R Square Std. Error of the
Estimate
.018 .000 -.033 .427
The independent variable is 3. Age.
ANOVA
Sum of Squares df Mean Square F Sig.
Regression .002 1 .002 .010 .920
Residual 5.467 30 .182
Total 5.469 31
The independent variable is 3. Age.
B.1.3.4.Style of Use: Short trips
Model Summary
R R Square Adjusted R Square Std. Error of the
Estimate
.092 .009 -.025 .340
The independent variable is 3. Age.
ANOVA
Sum of Squares df Mean Square F Sig.
Regression .030 1 .030 .258 .615
Residual 3.470 30 .116
Total 3.500 31
The independent variable is 3. Age.
B.1.3.5. Car replacement rate
Model Summary
R R Square Adjusted R Square Std. Error of the
Estimate

84
.015 .000 -.033 .719
The independent variable is 3. Age.
ANOVA
Sum of Squares df Mean Square F Sig.
Regression .003 1 .003 .006 .937
Residual 15.497 30 .517
Total 15.500 31
The independent variable is 3. Age.
B.1.3.6. Buying the next car for the same reason (loyalty attributes)
Model Summary
R R Square Adjusted R Square Std. Error of the
Estimate
.141 .020 -.013 .443
The independent variable is 3. Age.
ANOVA
Sum of Squares df Mean Square F Sig.
Regression .119 1 .119 .608 .442
Residual 5.881 30 .196
Total 6.000 31
The independent variable is 3. Age.
B.1.4. Behaviour by Gender
B.1.4.1. Number of cars owned (Experience)
Model Summary
R R Square Adjusted R Square Std. Error of the
Estimate
.066 .004 -.029 .773
The independent variable is 4. Gender.
ANOVA
Sum of Squares df Mean Square F Sig.
Regression .078 1 .078 .130 .721
Residual 17.922 30 .597
Total 18.000 31
The independent variable is 4. Gender.
B.1.4.2. Frequency of Use
Model Summary

85
R R Square Adjusted R Square Std. Error of the
Estimate
.013 .000 -.033 .671
The independent variable is 4. Gender.
ANOVA
Sum of Squares df Mean Square F Sig.
Regression .002 1 .002 .005 .945
Residual 13.498 30 .450
Total 13.500 31
The independent variable is 4. Gender.
B.1.4.3. Style of use: Long trips
Model Summary
R R Square Adjusted R Square Std. Error of the
Estimate
.224 .050 .018 .416
The independent variable is 4. Gender.
ANOVA
Sum of Squares df Mean Square F Sig.
Regression .274 1 .274 1.582 .218
Residual 5.195 30 .173
Total 5.469 31
The independent variable is 4. Gender.
B.1.4.5. Style of Use: Short trips
Model Summary
R R Square Adjusted R Square Std. Error of the
Estimate
.075 .006 -.028 .341
The independent variable is 4. Gender.
ANOVA
Sum of Squares df Mean Square F Sig.
Regression .019 1 .019 .168 .685
Residual 3.481 30 .116
Total 3.500 31
The independent variable is 4. Gender.
B.1.4.6. Car replacement rate
Model Summary
R R Square Adjusted R Square Std. Error of the
Estimate

86
.295 .087 .057 .687
The independent variable is 4. Gender.
ANOVA
Sum of Squares df Mean Square F Sig.
Regression 1.353 1 1.353 2.869 .101
Residual 14.147 30 .472
Total 15.500 31
The independent variable is 4. Gender.
B.1.4.7. Buying the next car for the same reason (loyalty attributes)
Model Summary
R R Square Adjusted R Square Std. Error of the
Estimate
.494 .244 .219 .389
The independent variable is 4. Gender.
ANOVA
Sum of Squares df Mean Square F Sig.
Regression 1.463 1 1.463 9.676 .004
Residual 4.537 30 .151
Total 6.000 31
The independent variable is 4. Gender.
Coefficients
Unstandardized Coefficients Standardized
Coefficients
t Sig.
B Std. Error Beta
4. Gender .450 .145 .494 3.111 .004
(Constant) .645 .206 3.127 .004

87
B.1.5. Behaviour according to annual income
B.1.5.1. Number of cars owned (Experience)
Model Summary
R R Square Adjusted R Square Std. Error of the
Estimate
.235 .055 .024 .753
The independent variable is 5. Annual income (in Yuan).
ANOVA
Sum of Squares df Mean Square F Sig.
Regression .997 1 .997 1.759 .195
Residual 17.003 30 .567
Total 18.000 31
The independent variable is 5. Annual income (in Yuan).
B.1.5.2. Frequency of Use
Model Summary
R R Square Adjusted R Square Std. Error of the
Estimate
.366 .134 .105 .624
The independent variable is 5. Annual income (in Yuan).
ANOVA
Sum of Squares df Mean Square F Sig.
Regression 1.807 1 1.807 4.635 .039

88
Residual 11.693 30 .390
Total 13.500 31
The independent variable is 5. Annual income (in Yuan).
B.1.5.3. Style of use: Long trips
Model Summary
R R Square Adjusted R Square Std. Error of the
Estimate
.193 .037 .005 .419
The independent variable is 5. Annual income (in Yuan).
ANOVA
Sum of Squares df Mean Square F Sig.
Regression .204 1 .204 1.160 .290
Residual 5.265 30 .176
Total 5.469 31
The independent variable is 5. Annual income (in Yuan).
B.1.5.4. Style of Use: Short trips
Model Summary
R R Square Adjusted R Square Std. Error of the
Estimate
.267 .071 .040 .329
The independent variable is 5. Annual income (in Yuan).
ANOVA
Sum of Squares df Mean Square F Sig.

89
Regression .249 1 .249 2.300 .140
Residual 3.251 30 .108
Total 3.500 31
The independent variable is 5. Annual income (in Yuan).
B.1.5.6. Car replacement rate
Model Summary
R R Square Adjusted R Square Std. Error of the
Estimate
.166 .028 -.005 .709
The independent variable is 5. Annual income (in Yuan).
ANOVA
Sum of Squares df Mean Square F Sig.
Regression .426 1 .426 .848 .364
Residual 15.074 30 .502
Total 15.500 31
The independent variable is 5. Annual income (in Yuan).
B.1.5.6. Buying the next car for the same reason (Loyalty attributes)
Model Summary
R R Square Adjusted R Square Std. Error of the
Estimate
.157 .025 -.008 .442
The independent variable is 5. Annual income (in Yuan).
ANOVA
Sum of Squares df Mean Square F Sig.
Regression .147 1 .147 .756 .391
Residual 5.853 30 .195
Total 6.000 31
The independent variable is 5. Annual income (in Yuan).
B.2. Psychographic data by Demographic and Geographic
B.2.1. Psychographs by age
B.2.1.1. Perception of Global Importance of Safety
Model Summary
R R Square Adjusted R Square Std. Error of the
Estimate
.205 .042 -.008 .580
The independent variable is 3. Age.

90
ANOVA
Sum of Squares df Mean Square F Sig.
Regression .280 1 .280 .833 .373
Residual 6.387 19 .336
Total 6.667 20
The independent variable is 3. Age.
B.2.1.2. Perception of Global Importance of Brand image
Model Summary
R R Square Adjusted R Square Std. Error of the
Estimate
.132 .017 -.034 1.041
The independent variable is 3. Age.
ANOVA
Sum of Squares df Mean Square F Sig.
Regression .366 1 .366 .338 .568
Residual 20.587 19 1.084
Total 20.952 20
The independent variable is 3. Age.
B.2.1.3. Perception of Global Importance of Design
Model Summary
R R Square Adjusted R Square Std. Error of the
Estimate
.575 .330 .295 .803
The independent variable is 3. Age.
ANOVA
Sum of Squares df Mean Square F Sig.
Regression 6.036 1 6.036 9.362 .006
Residual 12.250 19 .645
Total 18.286 20
The independent variable is 3. Age.

91
B.2.1.4. Perception of Global Importance of Fuel efficiency
Model Summary
R R Square Adjusted R Square Std. Error of the
Estimate
.076 .006 -.046 .792
The independent variable is 3. Age.
ANOVA
Sum of Squares df Mean Square F Sig.
Regression .070 1 .070 .111 .742
Residual 11.930 19 .628
Total 12.000 20
The independent variable is 3. Age.
B.2.1.5. Perception of Global Importance of Quality
Model Summary
R R Square Adjusted R Square Std. Error of the
Estimate
.243 .059 .010 .727
The independent variable is 3. Age.
ANOVA
Sum of Squares df Mean Square F Sig.
Regression .630 1 .630 1.193 .288
Residual 10.037 19 .528
Total 10.667 20
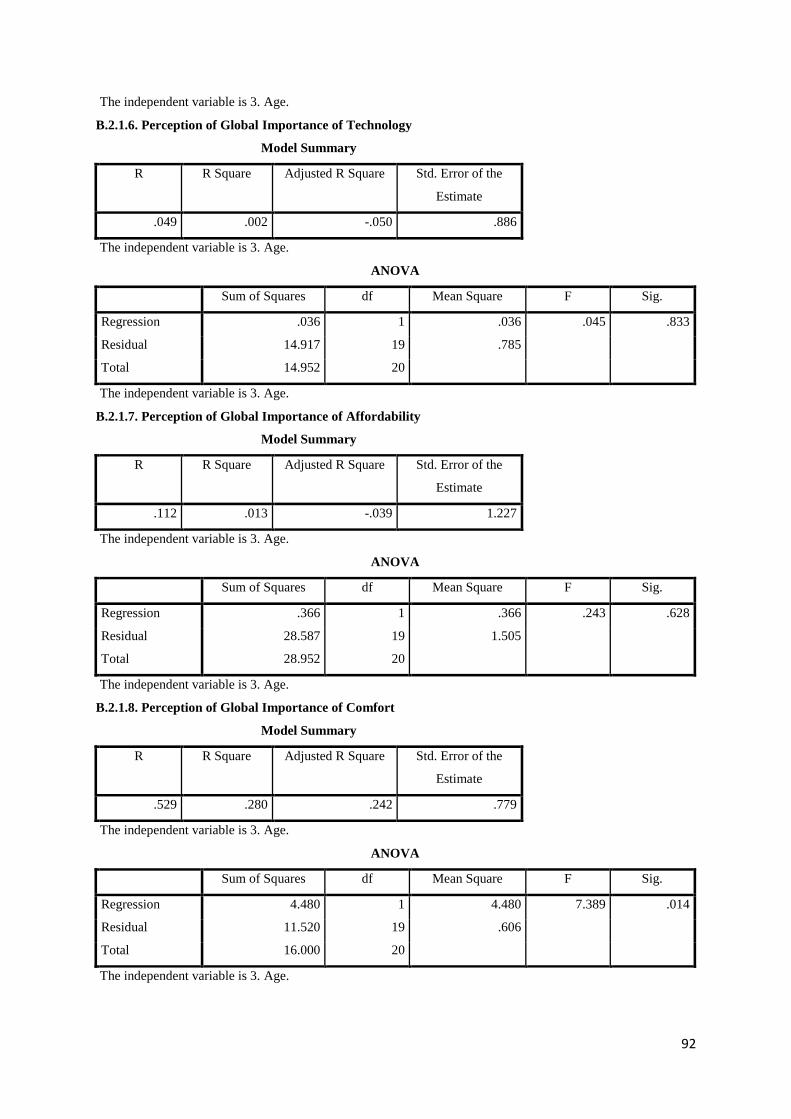
92
The independent variable is 3. Age.
B.2.1.6. Perception of Global Importance of Technology
Model Summary
R R Square Adjusted R Square Std. Error of the
Estimate
.049 .002 -.050 .886
The independent variable is 3. Age.
ANOVA
Sum of Squares df Mean Square F Sig.
Regression .036 1 .036 .045 .833
Residual 14.917 19 .785
Total 14.952 20
The independent variable is 3. Age.
B.2.1.7. Perception of Global Importance of Affordability
Model Summary
R R Square Adjusted R Square Std. Error of the
Estimate
.112 .013 -.039 1.227
The independent variable is 3. Age.
ANOVA
Sum of Squares df Mean Square F Sig.
Regression .366 1 .366 .243 .628
Residual 28.587 19 1.505
Total 28.952 20
The independent variable is 3. Age.
B.2.1.8. Perception of Global Importance of Comfort
Model Summary
R R Square Adjusted R Square Std. Error of the
Estimate
.529 .280 .242 .779
The independent variable is 3. Age.
ANOVA
Sum of Squares df Mean Square F Sig.
Regression 4.480 1 4.480 7.389 .014
Residual 11.520 19 .606
Total 16.000 20
The independent variable is 3. Age.

93
B.2.1.9. Perception of Global Importance of Chinese Brand
Model Summary
R R Square Adjusted R Square Std. Error of the
Estimate
.087 .008 -.045 1.186
The independent variable is 3. Age.
ANOVA
Sum of Squares df Mean Square F Sig.
Regression .206 1 .206 .146 .707
Residual 26.747 19 1.408
Total 26.952 20
The independent variable is 3. Age.
B.2.1.10. Importance of Safety for car owners
Model Summary
R R Square Adjusted R Square Std. Error of the
Estimate
.021 .000 -.052 .413
The independent variable is 3. Age.
ANOVA
Sum of Squares df Mean Square F Sig.
Regression .001 1 .001 .008 .928
Residual 3.237 19 .170
Total 3.238 20

94
The independent variable is 3. Age.
B.2.1.11. Importance of Brand image for car owners
Model Summary
R R Square Adjusted R Square Std. Error of the
Estimate
.345 .119 .073 .825
The independent variable is 3. Age.
ANOVA
Sum of Squares df Mean Square F Sig.
Regression 1.750 1 1.750 2.574 .125
Residual 12.917 19 .680
Total 14.667 20
The independent variable is 3. Age.
B.2.1.12. Importance of Design for car owners
Model Summary
R R Square Adjusted R Square Std. Error of the
Estimate
.388 .151 .106 .968
The independent variable is 3. Age.
ANOVA
Sum of Squares df Mean Square F Sig.
Regression 3.156 1 3.156 3.369 .082
Residual 17.797 19 .937
Total 20.952 20
The independent variable is 3. Age.

95
B.2.1.13. Importance of Fuel Efficiency for car owners
Model Summary
R R Square Adjusted R Square Std. Error of the
Estimate
.275 .076 .027 .758
The independent variable is 3. Age.
ANOVA
Sum of Squares df Mean Square F Sig.
Regression .893 1 .893 1.554 .228
Residual 10.917 19 .575
Total 11.810 20
The independent variable is 3. Age.
B.2.1.14. Importance of Quality for car owners
Model Summary
R R Square Adjusted R Square Std. Error of the
Estimate
.126 .016 -.036 .410
The independent variable is 3. Age.
ANOVA
Sum of Squares df Mean Square F Sig.
Regression .051 1 .051 .307 .586
Residual 3.187 19 .168
Total 3.238 20

96
The independent variable is 3. Age.
B.2.1.15. Importance of Technology for car owners
Model Summary
R R Square Adjusted R Square Std. Error of the
Estimate
.050 .002 -.050 1.039
The independent variable is 3. Age.
ANOVA
Sum of Squares df Mean Square F Sig.
Regression .051 1 .051 .048 .830
Residual 20.520 19 1.080
Total 20.571 20
The independent variable is 3. Age.
B.2.1.16. Importance of Affordability for car owners
Model Summary
R R Square Adjusted R Square Std. Error of the
Estimate
.249 .062 .012 1.317
The independent variable is 3. Age.
ANOVA
Sum of Squares df Mean Square F Sig.
Regression 2.173 1 2.173 1.252 .277
Residual 32.970 19 1.735
Total 35.143 20
The independent variable is 3. Age.
B.2.1.17. Importance of Comfort for car owners
Model Summary
R R Square Adjusted R Square Std. Error of the
Estimate
.296 .088 .039 .980
The independent variable is 3. Age.
ANOVA
Sum of Squares df Mean Square F Sig.
Regression 1.750 1 1.750 1.822 .193
Residual 18.250 19 .961
Total 20.000 20
The independent variable is 3. Age.
B.2.1.18. Importance of Chinese Brand for car owners

97
Model Summary
R R Square Adjusted R Square Std. Error of the
Estimate
.261 .068 .019 1.156
The independent variable is 3. Age.
ANOVA
Sum of Squares df Mean Square F Sig.
Regression 1.851 1 1.851 1.386 .254
Residual 25.387 19 1.336
Total 27.238 20
The independent variable is 3. Age.
B.2.1.19. Importance of Safety for the next purchase by car owners
Model Summary
R R Square Adjusted R Square Std. Error of the
Estimate
.194 .037 -.013 .439
The independent variable is 3. Age.
ANOVA
Sum of Squares df Mean Square F Sig.
Regression .143 1 .143 .740 .400
Residual 3.667 19 .193
Total 3.810 20
The independent variable is 3. Age.
B.2.1.20. Importance of Brand Image for the next purchase by car owners
Model Summary
R R Square Adjusted R Square Std. Error of the
Estimate
.328 .107 .060 .900
The independent variable is 3. Age.
ANOVA
Sum of Squares df Mean Square F Sig.
Regression 1.851 1 1.851 2.286 .147
Residual 15.387 19 .810
Total 17.238 20
The independent variable is 3. Age.
B.2.1.21. Importance of Design for the next purchase by car owners
Model Summary

98
R R Square Adjusted R Square Std. Error of the
Estimate
.327 .107 .060 .927
The independent variable is 3. Age.
ANOVA
Sum of Squares df Mean Square F Sig.
Regression 1.956 1 1.956 2.275 .148
Residual 16.330 19 .859
Total 18.286 20
The independent variable is 3. Age.
B.2.1.22. Importance of Fuel Efficiency for the next purchase by car owners
Model Summary
R R Square Adjusted R Square Std. Error of the
Estimate
.383 .147 .102 .710
The independent variable is 3. Age.
ANOVA
Sum of Squares df Mean Square F Sig.
Regression 1.651 1 1.651 3.273 .086
Residual 9.587 19 .505
Total 11.238 20
The independent variable is 3. Age.

99
B.2.1.23. Importance of Quality for the next purchase by car owners
Model Summary
R R Square Adjusted R Square Std. Error of the
Estimate
.297 .088 .040 .780
The independent variable is 3. Age.
ANOVA
Sum of Squares df Mean Square F Sig.
Regression 1.120 1 1.120 1.843 .191
Residual 11.547 19 .608
Total 12.667 20
The independent variable is 3. Age.
B.2.1.24. Importance of Technology for the next purchase by car owners
Model Summary
R R Square Adjusted R Square Std. Error of the
Estimate
.048 .002 -.050 .718
The independent variable is 3. Age.
ANOVA
Sum of Squares df Mean Square F Sig.
Regression .023 1 .023 .044 .835
Residual 9.787 19 .515
Total 9.810 20
The independent variable is 3. Age.
B.2.1.25. Importance of Affordability for the next purchase by car owners
Model Summary
R R Square Adjusted R Square Std. Error of the
Estimate
.153 .023 -.028 1.288
The independent variable is 3. Age.
ANOVA
Sum of Squares df Mean Square F Sig.
Regression .756 1 .756 .455 .508
Residual 31.530 19 1.659
Total 32.286 20
The independent variable is 3. Age.
B.2.1.26. Importance of Comfort for the next purchase by car owners

100
Model Summary
R R Square Adjusted R Square Std. Error of the
Estimate
.162 .026 -.025 .739
The independent variable is 3. Age.
ANOVA
Sum of Squares df Mean Square F Sig.
Regression .280 1 .280 .512 .483
Residual 10.387 19 .547
Total 10.667 20
The independent variable is 3. Age.
B.2.1.27. Importance of Chinese Brand for the next purchase by car owners
Model Summary
R R Square Adjusted R Square Std. Error of the
Estimate
.069 .005 -.048 1.250
The independent variable is 3. Age.
ANOVA
Sum of Squares df Mean Square F Sig.
Regression .143 1 .143 .091 .766
Residual 29.667 19 1.561
Total 29.810 20
The independent variable is 3. Age.
B.2.1.28. Importance of Safety for non-car owners for their next purchase
Model Summary
R R Square Adjusted R Square Std. Error of the
Estimate
.024 .001 -.052 .368
The independent variable is 3. Age.
ANOVA
Sum of Squares df Mean Square F Sig.
Regression .001 1 .001 .011 .919
Residual 2.570 19 .135
Total 2.571 20
The independent variable is 3. Age.
B.2.1.29. Importance of Brand Image for non-car owners for their next purchase
Model Summary

101
R R Square Adjusted R Square Std. Error of the
Estimate
.272 .074 .025 .983
The independent variable is 3. Age.
ANOVA
Sum of Squares df Mean Square F Sig.
Regression 1.463 1 1.463 1.515 .233
Residual 18.347 19 .966
Total 19.810 20
The independent variable is 3. Age.
B.2.1.29. Importance of Design for non-car owners for their next purchase
Model Summary
R R Square Adjusted R Square Std. Error of the
Estimate
.423 .179 .135 .688
The independent variable is 3. Age.
ANOVA
Sum of Squares df Mean Square F Sig.
Regression 1.956 1 1.956 4.130 .056
Residual 8.997 19 .474
Total 10.952 20
The independent variable is 3. Age.
B.2.1.30. Importance of Fuel Efficiency for non-car owners for their next purchase

102
Model Summary
R R Square Adjusted R Square Std. Error of the
Estimate
.149 .022 -.029 .807
The independent variable is 3. Age.
ANOVA
Sum of Squares df Mean Square F Sig.
Regression .280 1 .280 .429 .520
Residual 12.387 19 .652
Total 12.667 20
The independent variable is 3. Age.
B.2.1.32. Importance of Quality for non-car owners for their next purchase
Model Summary
R R Square Adjusted R Square Std. Error of the
Estimate
.282 .080 .031 .530
The independent variable is 3. Age.
ANOVA
Sum of Squares df Mean Square F Sig.
Regression .463 1 .463 1.645 .215
Residual 5.347 19 .281
Total 5.810 20
The independent variable is 3. Age.
B.2.1.33. Importance of Technology for non-car owners for their next purchase
Model Summary
R R Square Adjusted R Square Std. Error of the
Estimate
.248 .062 .012 .745
The independent variable is 3. Age.
ANOVA
Sum of Squares df Mean Square F Sig.
Regression .691 1 .691 1.246 .278
Residual 10.547 19 .555
Total 11.238 20
The independent variable is 3. Age.
B.2.1.34. Importance of Affordability for non-car owners for their next purchase
Model Summary
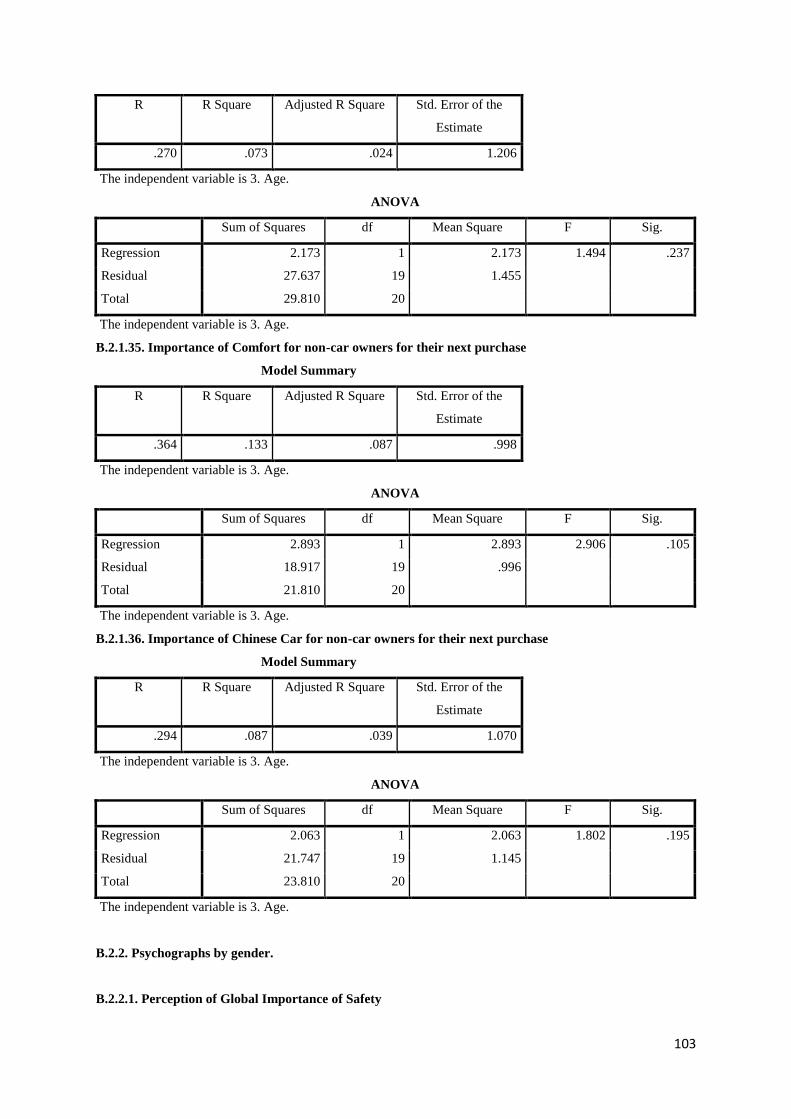
103
R R Square Adjusted R Square Std. Error of the
Estimate
.270 .073 .024 1.206
The independent variable is 3. Age.
ANOVA
Sum of Squares df Mean Square F Sig.
Regression 2.173 1 2.173 1.494 .237
Residual 27.637 19 1.455
Total 29.810 20
The independent variable is 3. Age.
B.2.1.35. Importance of Comfort for non-car owners for their next purchase
Model Summary
R R Square Adjusted R Square Std. Error of the
Estimate
.364 .133 .087 .998
The independent variable is 3. Age.
ANOVA
Sum of Squares df Mean Square F Sig.
Regression 2.893 1 2.893 2.906 .105
Residual 18.917 19 .996
Total 21.810 20
The independent variable is 3. Age.
B.2.1.36. Importance of Chinese Car for non-car owners for their next purchase
Model Summary
R R Square Adjusted R Square Std. Error of the
Estimate
.294 .087 .039 1.070
The independent variable is 3. Age.
ANOVA
Sum of Squares df Mean Square F Sig.
Regression 2.063 1 2.063 1.802 .195
Residual 21.747 19 1.145
Total 23.810 20
The independent variable is 3. Age.
B.2.2. Psychographs by gender.
B.2.2.1. Perception of Global Importance of Safety

104
Model Summary
R R Square Adjusted R
Square
Std. Error of the
Estimate
.239 .057 .008 .575
The independent variable is 4. Gender.
ANOVA
Sum of Squares df Mean Square F Sig.
Regression .381 1 .381 1.152 .297
Residual 6.286 19 .331
Total 6.667 20
The independent variable is 4. Gender.
B.2.2.2. Perception of Global Importance of Brand image
Model Summary
R R Square Adjusted R
Square
Std. Error of the
Estimate
.337 .114 .067 .989
The independent variable is 4. Gender.
ANOVA
Sum of Squares df Mean Square F Sig.
Regression 2.381 1 2.381 2.436 .135
Residual 18.571 19 .977
Total 20.952 20
The independent variable is 4. Gender.
B.2.2.3. Perception of Global Importance of Design
Model Summary
R R Square Adjusted R
Square
Std. Error of the
Estimate
.217 .047 -.003 .958
The independent variable is 4. Gender.
ANOVA
Sum of Squares df Mean Square F Sig.
Regression .857 1 .857 .934 .346
Residual 17.429 19 .917
Total 18.286 20
The independent variable is 4. Gender.
B.2.2.4. Perception of Global Importance of Fuel efficiency
Model Summary

105
R R Square Adjusted R
Square
Std. Error of the
Estimate
.134 .018 -.034 .788
The independent variable is 4. Gender.
ANOVA
Sum of Squares df Mean Square F Sig.
Regression .214 1 .214 .345 .564
Residual 11.786 19 .620
Total 12.000 20
The independent variable is 4. Gender.
B.2.2.5. Perception of Global Importance of Quality
Model Summary
R R Square Adjusted R
Square
Std. Error of the
Estimate
.047 .002 -.050 .748
The independent variable is 4. Gender.
ANOVA
Sum of Squares df Mean Square F Sig.
Regression .024 1 .024 .043 .839
Residual 10.643 19 .560
Total 10.667 20
The independent variable is 4. Gender.
B.2.2.6. Perception of Global Importance of Technology
Model Summary
R R Square Adjusted R
Square
Std. Error of the
Estimate
.080 .006 -.046 .884
The independent variable is 4. Gender.
ANOVA
Sum of Squares df Mean Square F Sig.
Regression .095 1 .095 .122 .731
Residual 14.857 19 .782
Total 14.952 20
The independent variable is 4. Gender.
B.2.2.7. Perception of Global Importance of Affordability
Model Summary
R R Square Adjusted R
Square
Std. Error of the
Estimate
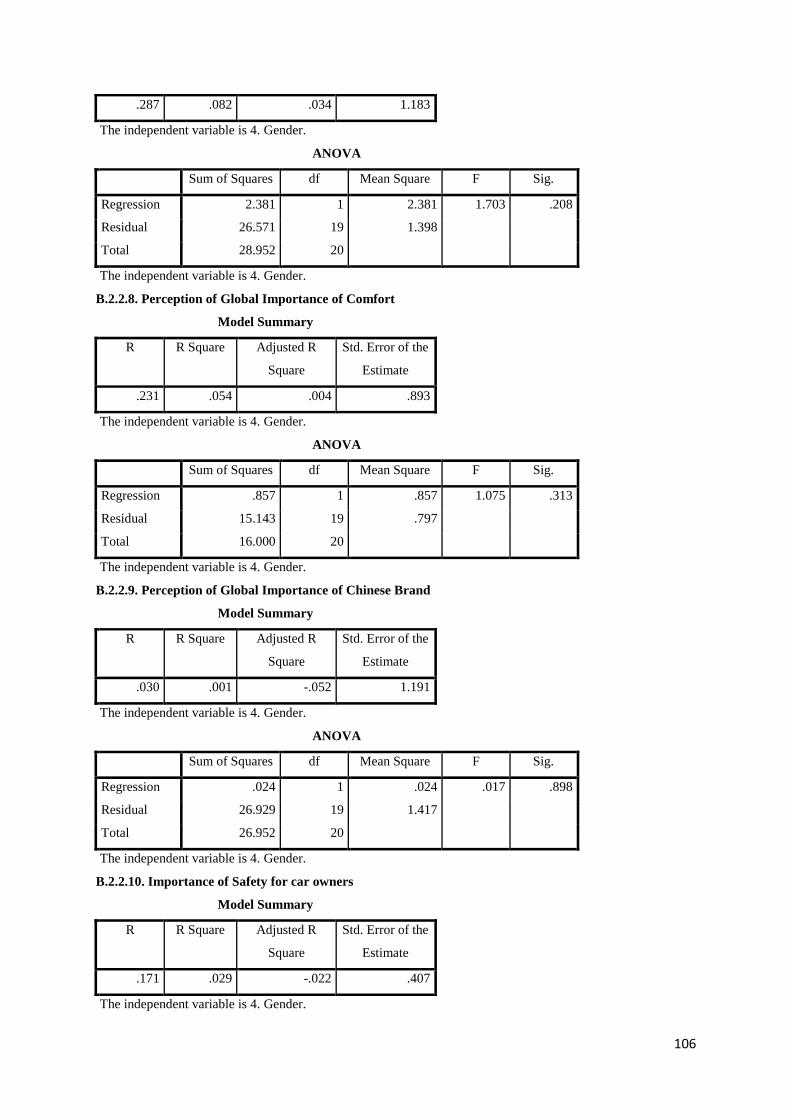
106
.287 .082 .034 1.183
The independent variable is 4. Gender.
ANOVA
Sum of Squares df Mean Square F Sig.
Regression 2.381 1 2.381 1.703 .208
Residual 26.571 19 1.398
Total 28.952 20
The independent variable is 4. Gender.
B.2.2.8. Perception of Global Importance of Comfort
Model Summary
R R Square Adjusted R
Square
Std. Error of the
Estimate
.231 .054 .004 .893
The independent variable is 4. Gender.
ANOVA
Sum of Squares df Mean Square F Sig.
Regression .857 1 .857 1.075 .313
Residual 15.143 19 .797
Total 16.000 20
The independent variable is 4. Gender.
B.2.2.9. Perception of Global Importance of Chinese Brand
Model Summary
R R Square Adjusted R
Square
Std. Error of the
Estimate
.030 .001 -.052 1.191
The independent variable is 4. Gender.
ANOVA
Sum of Squares df Mean Square F Sig.
Regression .024 1 .024 .017 .898
Residual 26.929 19 1.417
Total 26.952 20
The independent variable is 4. Gender.
B.2.2.10. Importance of Safety for car owners
Model Summary
R R Square Adjusted R
Square
Std. Error of the
Estimate
.171 .029 -.022 .407
The independent variable is 4. Gender.

107
ANOVA
Sum of Squares df Mean Square F Sig.
Regression .095 1 .095 .576 .457
Residual 3.143 19 .165
Total 3.238 20
The independent variable is 4. Gender.
B.2.2.11. Importance of Brand image for car owners
Model Summary
R R Square Adjusted R
Square
Std. Error of the
Estimate
.040 .002 -.051 .878
The independent variable is 4. Gender.
ANOVA
Sum of Squares df Mean Square F Sig.
Regression .024 1 .024 .031 .862
Residual 14.643 19 .771
Total 14.667 20
The independent variable is 4. Gender.
B.2.2.12. Importance of Design for car owners
Model Summary
R R Square Adjusted R
Square
Std. Error of the
Estimate
.067 .005 -.048 1.048
The independent variable is 4. Gender.
ANOVA
Sum of Squares df Mean Square F Sig.
Regression .095 1 .095 .087 .772
Residual 20.857 19 1.098
Total 20.952 20
The independent variable is 4. Gender.
B.2.2.13. Importance of Fuel Efficiency for car owners
Model Summary
R R Square Adjusted R
Square
Std. Error of the
Estimate
.314 .099 .051 .748
The independent variable is 4. Gender.
ANOVA
Sum of Squares df Mean Square F Sig.

108
Regression 1.167 1 1.167 2.083 .165
Residual 10.643 19 .560
Total 11.810 20
The independent variable is 4. Gender.
B.2.2.14. Importance of Quality for car owners
Model Summary
R R Square Adjusted R
Square
Std. Error of the
Estimate
.086 .007 -.045 .411
The independent variable is 4. Gender.
ANOVA
Sum of Squares df Mean Square F Sig.
Regression .024 1 .024 .141 .712
Residual 3.214 19 .169
Total 3.238 20
The independent variable is 4. Gender.
B.2.2.15. Importance of Technology for car owners
Model Summary
R R Square Adjusted R
Square
Std. Error of the
Estimate
.204 .042 -.009 1.019
The independent variable is 4. Gender.
ANOVA
Sum of Squares df Mean Square F Sig.
Regression .857 1 .857 .826 .375
Residual 19.714 19 1.038
Total 20.571 20
The independent variable is 4. Gender.
B.2.2.16. Importance of Affordability for car owners
Model Summary
R R Square Adjusted R
Square
Std. Error of the
Estimate
.390 .152 .108 1.252
The independent variable is 4. Gender.
ANOVA
Sum of Squares df Mean Square F Sig.
Regression 5.357 1 5.357 3.417 .080
Residual 29.786 19 1.568

109
Total 35.143 20
The independent variable is 4. Gender.
B.2.2.17. Importance of Comfort for car owners
Model Summary
R R Square Adjusted R
Square
Std. Error of the
Estimate
.311 .096 .049 .975
The independent variable is 4. Gender.
ANOVA
Sum of Squares df Mean Square F Sig.
Regression 1.929 1 1.929 2.028 .171
Residual 18.071 19 .951
Total 20.000 20
The independent variable is 4. Gender.
B.2.2.18. Importance of Chinese Brand for car owners
Model Summary
R R Square Adjusted R
Square
Std. Error of the
Estimate
.118 .014 -.038 1.189
The independent variable is 4. Gender.
ANOVA
Sum of Squares df Mean Square F Sig.
Regression .381 1 .381 .270 .610

110
Residual 26.857 19 1.414
Total 27.238 20
The independent variable is 4. Gender.
B.2.2.19. Importance of Safety for the next purchase by car owners
Model Summary
R R Square Adjusted R
Square
Std. Error of the
Estimate
.079 .006 -.046 .446
The independent variable is 4. Gender.
ANOVA
Sum of Squares df Mean Square F Sig.
Regression .024 1 .024 .119 .733
Residual 3.786 19 .199
Total 3.810 20
The independent variable is 4. Gender.
B.2.2.20. Importance of Brand Image for the next purchase by car owners
Model Summary
R R Square Adjusted R
Square
Std. Error of the
Estimate
.037 .001 -.051 .952
The independent variable is 4. Gender.
ANOVA
Sum of Squares df Mean Square F Sig.
Regression .024 1 .024 .026 .873
Residual 17.214 19 .906
Total 17.238 20
The independent variable is 4. Gender.
B.2.2.21. Importance of Design for the next purchase by car owners
Model Summary
R R Square Adjusted R
Square
Std. Error of the
Estimate
.108 .012 -.040 .975
The independent variable is 4. Gender.
ANOVA
Sum of Squares df Mean Square F Sig.
Regression .214 1 .214 .225 .640
Residual 18.071 19 .951
Total 18.286 20

111
The independent variable is 4. Gender.
B.2.2.22. Importance of Fuel Efficiency for the next purchase by car owners
Model Summary
R R Square Adjusted R
Square
Std. Error of the
Estimate
.230 .053 .003 .748
The independent variable is 4. Gender.
ANOVA
Sum of Squares df Mean Square F Sig.
Regression .595 1 .595 1.063 .316
Residual 10.643 19 .560
Total 11.238 20
The independent variable is 4. Gender.
B.2.2.23. Importance of Quality for the next purchase by car owners
Model Summary
R R Square Adjusted R
Square
Std. Error of the
Estimate
.173 .030 -.021 .804
The independent variable is 4. Gender.
ANOVA
Sum of Squares df Mean Square F Sig.
Regression .381 1 .381 .589 .452
Residual 12.286 19 .647
Total 12.667 20
The independent variable is 4. Gender.
B.2.2.24. Importance of Technology for the next purchase by car owners
Model Summary
R R Square Adjusted R
Square
Std. Error of the
Estimate
.099 .010 -.042 .715
The independent variable is 4. Gender.
ANOVA
Sum of Squares df Mean Square F Sig.
Regression .095 1 .095 .186 .671
Residual 9.714 19 .511
Total 9.810 20
The independent variable is 4. Gender.
B.2.2.25. Importance of Affordability for the next purchase by car owners

112
Model Summary
R R Square Adjusted R
Square
Std. Error of the
Estimate
.244 .060 .010 1.264
The independent variable is 4. Gender.
ANOVA
Sum of Squares df Mean Square F Sig.
Regression 1.929 1 1.929 1.207 .286
Residual 30.357 19 1.598
Total 32.286 20
The independent variable is 4. Gender.
B.2.2.26. Importance of Comfort for the next purchase by car owners
Model Summary
R R Square Adjusted R
Square
Std. Error of the
Estimate
.094 .009 -.043 .746
The independent variable is 4. Gender.
ANOVA
Sum of Squares df Mean Square F Sig.
Regression .095 1 .095 .171 .684
Residual 10.571 19 .556
Total 10.667 20
The independent variable is 4. Gender.
B.2.2.27. Importance of Chinese Brand for the next purchase by car owners
Model Summary
R R Square Adjusted R
Square
Std. Error of the
Estimate
.311 .097 .049 1.191
The independent variable is 4. Gender.
ANOVA
Sum of Squares df Mean Square F Sig.
Regression 2.881 1 2.881 2.033 .170
Residual 26.929 19 1.417
Total 29.810 20
The independent variable is 4. Gender.
B.2.2.28. Importance of Safety for non-car owners for their next purchase
Model Summary

113
R R Square Adjusted R
Square
Std. Error of the
Estimate
.000 .000 -.053 .368
The independent variable is 4. Gender.
ANOVA
Sum of Squares df Mean Square F Sig.
Regression .000 1 .000 .000 1.000
Residual 2.571 19 .135
Total 2.571 20
The independent variable is 4. Gender.
B.2.2.29. Importance of Brand Image for non-car owners for their next purchase
Model Summary
R R Square Adjusted R
Square
Std. Error of the
Estimate
.173 .030 -.021 1.006
The independent variable is 4. Gender.
ANOVA
Sum of Squares df Mean Square F Sig.
Regression .595 1 .595 .589 .452
Residual 19.214 19 1.011
Total 19.810 20
The independent variable is 4. Gender.
B.2.2.30. Importance of Design for non-car owners for their next purchase
Model Summary
R R Square Adjusted R
Square
Std. Error of the
Estimate
.233 .054 .005 .738
The independent variable is 4. Gender.
ANOVA
Sum of Squares df Mean Square F Sig.
Regression .595 1 .595 1.092 .309
Residual 10.357 19 .545
Total 10.952 20
The independent variable is 4. Gender.
B.2.2.31. Importance of Fuel Efficiency for non-car owners for their next purchase
Model Summary
R R Square Adjusted R
Square
Std. Error of the
Estimate

114
.087 .008 -.045 .813
The independent variable is 4. Gender.
ANOVA
Sum of Squares df Mean Square F Sig.
Regression .095 1 .095 .144 .709
Residual 12.571 19 .662
Total 12.667 20
The independent variable is 4. Gender.
B.2.2.32. Importance of Quality for non-car owners for their next purchase
Model Summary
R R Square Adjusted R
Square
Std. Error of the
Estimate
.064 .004 -.048 .552
The independent variable is 4. Gender.
ANOVA
Sum of Squares df Mean Square F Sig.
Regression .024 1 .024 .078 .783
Residual 5.786 19 .305
Total 5.810 20
The independent variable is 4. Gender.
B.2.2.33. Importance of Technology for non-car owners for their next purchase
Model Summary
R R Square Adjusted R
Square
Std. Error of the
Estimate
.092 .008 -.044 .766
The independent variable is 4. Gender.
ANOVA
Sum of Squares df Mean Square F Sig.
Regression .095 1 .095 .162 .691
Residual 11.143 19 .586
Total 11.238 20
The independent variable is 4. Gender.
B.2.2.34. Importance of Affordability for non-car owners for their next purchase
Model Summary
R R Square Adjusted R
Square
Std. Error of the
Estimate
.226 .051 .001 1.220
The independent variable is 4. Gender.
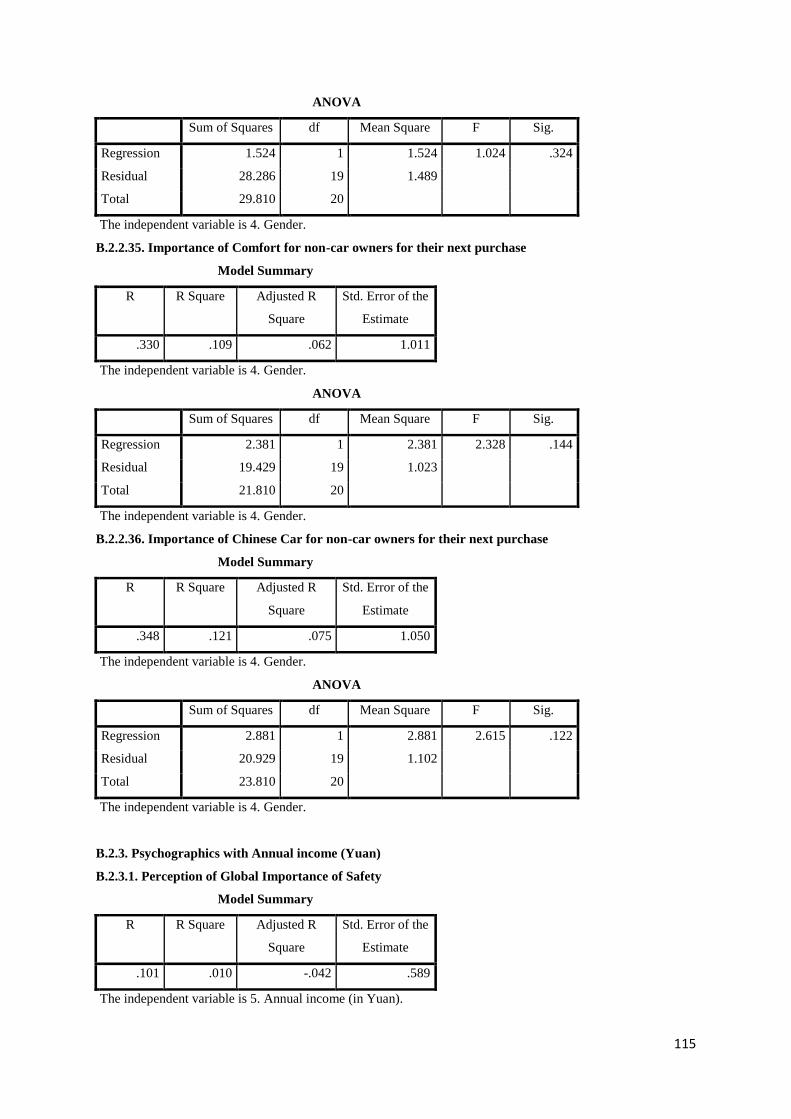
115
ANOVA
Sum of Squares df Mean Square F Sig.
Regression 1.524 1 1.524 1.024 .324
Residual 28.286 19 1.489
Total 29.810 20
The independent variable is 4. Gender.
B.2.2.35. Importance of Comfort for non-car owners for their next purchase
Model Summary
R R Square Adjusted R
Square
Std. Error of the
Estimate
.330 .109 .062 1.011
The independent variable is 4. Gender.
ANOVA
Sum of Squares df Mean Square F Sig.
Regression 2.381 1 2.381 2.328 .144
Residual 19.429 19 1.023
Total 21.810 20
The independent variable is 4. Gender.
B.2.2.36. Importance of Chinese Car for non-car owners for their next purchase
Model Summary
R R Square Adjusted R
Square
Std. Error of the
Estimate
.348 .121 .075 1.050
The independent variable is 4. Gender.
ANOVA
Sum of Squares df Mean Square F Sig.
Regression 2.881 1 2.881 2.615 .122
Residual 20.929 19 1.102
Total 23.810 20
The independent variable is 4. Gender.
B.2.3. Psychographics with Annual income (Yuan)
B.2.3.1. Perception of Global Importance of Safety
Model Summary
R R Square Adjusted R
Square
Std. Error of the
Estimate
.101 .010 -.042 .589
The independent variable is 5. Annual income (in Yuan).

116
ANOVA
Sum of Squares df Mean Square F Sig.
Regression .068 1 .068 .195 .664
Residual 6.599 19 .347
Total 6.667 20
The independent variable is 5. Annual income (in Yuan).
B.2.3.2. Perception of Global Importance of Brand image
Model Summary
R R Square Adjusted R
Square
Std. Error of the
Estimate
.120 .014 -.038 1.043
The independent variable is 5. Annual income (in Yuan).
ANOVA
Sum of Squares df Mean Square F Sig.
Regression .301 1 .301 .277 .605
Residual 20.652 19 1.087
Total 20.952 20
The independent variable is 5. Annual income (in Yuan).
B.2.3.3. Perception of Global Importance of Design
Model Summary
R R Square Adjusted R
Square
Std. Error of the
Estimate
.029 .001 -.052 .981
The independent variable is 5. Annual income (in Yuan).
ANOVA
Sum of Squares df Mean Square F Sig.
Regression .016 1 .016 .016 .900
Residual 18.270 19 .962
Total 18.286 20
The independent variable is 5. Annual income (in Yuan).
B.2.3.4. Perception of Global Importance of Fuel efficiency
Model Summary
R R Square Adjusted R
Square
Std. Error of the
Estimate
.000 .000 -.053 .795
The independent variable is 5. Annual income (in Yuan).
ANOVA
Sum of Squares df Mean Square F Sig.

117
Regression .000 1 .000 .000 1.000
Residual 12.000 19 .632
Total 12.000 20
The independent variable is 5. Annual income (in Yuan).
B.2.3.5. Perception of Global Importance of Quality
Model Summary
R R Square Adjusted R
Square
Std. Error of the
Estimate
.080 .006 -.046 .747
The independent variable is 5. Annual income (in Yuan).
ANOVA
Sum of Squares df Mean Square F Sig.
Regression .068 1 .068 .121 .731
Residual 10.599 19 .558
Total 10.667 20
The independent variable is 5. Annual income (in Yuan).
B.2.3.6. Perception of Global Importance of Technology
Model Summary
R R Square Adjusted R
Square
Std. Error of the
Estimate
.150 .023 -.029 .877
The independent variable is 5. Annual income (in Yuan).
ANOVA
Sum of Squares df Mean Square F Sig.
Regression .338 1 .338 .439 .516
Residual 14.615 19 .769
Total 14.952 20
The independent variable is 5. Annual income (in Yuan).
B.2.3.7. Perception of Global Importance of Affordability
Model Summary
R R Square Adjusted R
Square
Std. Error of the
Estimate
.029 .001 -.052 1.234
The independent variable is 5. Annual income (in Yuan).
ANOVA
Sum of Squares df Mean Square F Sig.
Regression .025 1 .025 .016 .899
Residual 28.927 19 1.522

118
Total 28.952 20
The independent variable is 5. Annual income (in Yuan).
B.2.3.8. Perception of Global Importance of Comfort
Model Summary
R R Square Adjusted R
Square
Std. Error of the
Estimate
.098 .010 -.043 .913
The independent variable is 5. Annual income (in Yuan).
ANOVA
Sum of Squares df Mean Square F Sig.
Regression .152 1 .152 .183 .674
Residual 15.848 19 .834
Total 16.000 20
The independent variable is 5. Annual income (in Yuan).
B.2.3.9. Perception of Global Importance of Chinese Brand
Model Summary
R R Square Adjusted R
Square
Std. Error of the
Estimate
.007 .000 -.053 1.191
The independent variable is 5. Annual income (in Yuan).
ANOVA
Sum of Squares df Mean Square F Sig.
Regression .001 1 .001 .001 .975
Residual 26.951 19 1.418
Total 26.952 20
The independent variable is 5. Annual income (in Yuan).
B.2.3.910. Importance of Safety for car owners
Model Summary
R R Square Adjusted R
Square
Std. Error of the
Estimate
.261 .068 .019 .399
The independent variable is 5. Annual income (in Yuan).
ANOVA
Sum of Squares df Mean Square F Sig.
Regression .220 1 .220 1.388 .253
Residual 3.018 19 .159
Total 3.238 20
The independent variable is 5. Annual income (in Yuan).

119
B.2.3.11. Importance of Brand image for car owners
Model Summary
R R Square Adjusted R
Square
Std. Error of the
Estimate
.272 .074 .025 .846
The independent variable is 5. Annual income (in Yuan).
ANOVA
Sum of Squares df Mean Square F Sig.
Regression 1.084 1 1.084 1.516 .233
Residual 13.583 19 .715
Total 14.667 20
The independent variable is 5. Annual income (in Yuan).
B.2.3.12. Importance of Design for car owners
Model Summary
R R Square Adjusted R
Square
Std. Error of the
Estimate
.008 .000 -.053 1.050
The independent variable is 5. Annual income (in Yuan).
ANOVA
Sum of Squares df Mean Square F Sig.
Regression .001 1 .001 .001 .972
Residual 20.951 19 1.103
Total 20.952 20
The independent variable is 5. Annual income (in Yuan).
B.2.3.13. Importance of Fuel Efficiency for car owners
Model Summary
R R Square Adjusted R
Square
Std. Error of the
Estimate
.064 .004 -.048 .787
The independent variable is 5. Annual income (in Yuan).
ANOVA
Sum of Squares df Mean Square F Sig.
Regression .048 1 .048 .077 .784
Residual 11.762 19 .619
Total 11.810 20
The independent variable is 5. Annual income (in Yuan).
B.2.3.14. Importance of Quality for car owners
Model Summary

120
R R Square Adjusted R
Square
Std. Error of the
Estimate
.261 .068 .019 .399
The independent variable is 5. Annual income (in Yuan).
ANOVA
Sum of Squares df Mean Square F Sig.
Regression .220 1 .220 1.388 .253
Residual 3.018 19 .159
Total 3.238 20
The independent variable is 5. Annual income (in Yuan).
B.2.3.15. Importance of Technology for car owners
Model Summary
R R Square Adjusted R
Square
Std. Error of the
Estimate
.105 .011 -.041 1.035
The independent variable is 5. Annual income (in Yuan).
ANOVA
Sum of Squares df Mean Square F Sig.
Regression .225 1 .225 .210 .652
Residual 20.347 19 1.071
Total 20.571 20
The independent variable is 5. Annual income (in Yuan).
B.2.3.16. Importance of Affordability for car owners
Model Summary
R R Square Adjusted R
Square
Std. Error of the
Estimate
.158 .025 -.026 1.343
The independent variable is 5. Annual income (in Yuan).
ANOVA
Sum of Squares df Mean Square F Sig.
Regression .873 1 .873 .484 .495
Residual 34.270 19 1.804
Total 35.143 20
The independent variable is 5. Annual income (in Yuan).
B.2.3.17. Importance of Comfort for car owners
Model Summary
R R Square Adjusted R
Square
Std. Error of the
Estimate

121
.196 .039 -.012 1.006
The independent variable is 5. Annual income (in Yuan).
ANOVA
Sum of Squares df Mean Square F Sig.
Regression .772 1 .772 .763 .393
Residual 19.228 19 1.012
Total 20.000 20
The independent variable is 5. Annual income (in Yuan).
B.2.3.18. Importance of Chinese Brand for car owners
Model Summary
R R Square Adjusted R
Square
Std. Error of the
Estimate
.010 .000 -.053 1.197
The independent variable is 5. Annual income (in Yuan).
ANOVA
Sum of Squares df Mean Square F Sig.
Regression .003 1 .003 .002 .966
Residual 27.235 19 1.433
Total 27.238 20
The independent variable is 5. Annual income (in Yuan).
B.2.3.19. Importance of Safety for the next purchase by car owners
Model Summary
R R Square Adjusted R
Square
Std. Error of the
Estimate
.388 .151 .106 .413
The independent variable is 5. Annual income (in Yuan).
ANOVA
Sum of Squares df Mean Square F Sig.
Regression .574 1 .574 3.371 .082
Residual 3.235 19 .170
Total 3.810 20
The independent variable is 5. Annual income (in Yuan).

122
B.2.3.20. Importance of Brand Image for the next purchase by car owners
Model Summary
R R Square Adjusted R
Square
Std. Error of the
Estimate
.176 .031 -.020 .938
The independent variable is 5. Annual income (in Yuan).
ANOVA
Sum of Squares df Mean Square F Sig.
Regression .533 1 .533 .606 .446
Residual 16.706 19 .879
Total 17.238 20
The independent variable is 5. Annual income (in Yuan).
B.2.3.21. Importance of Design for the next purchase by car owners
Model Summary
R R Square Adjusted R
Square
Std. Error of the
Estimate
.085 .007 -.045 .977
The independent variable is 5. Annual income (in Yuan).
ANOVA
Sum of Squares df Mean Square F Sig.
Regression .131 1 .131 .138 .715
Residual 18.154 19 .955
Total 18.286 20

123
The independent variable is 5. Annual income (in Yuan).
B.2.3.22. Importance of Fuel Efficiency for the next purchase by car owners
Model Summary
R R Square Adjusted R
Square
Std. Error of the
Estimate
.122 .015 -.037 .763
The independent variable is 5. Annual income (in Yuan).
ANOVA
Sum of Squares df Mean Square F Sig.
Regression .167 1 .167 .287 .598
Residual 11.071 19 .583
Total 11.238 20
The independent variable is 5. Annual income (in Yuan).
B.2.3.23. Importance of Quality for the next purchase by car owners
Model Summary
R R Square Adjusted R
Square
Std. Error of the
Estimate
.210 .044 -.006 .798
The independent variable is 5. Annual income (in Yuan).
ANOVA
Sum of Squares df Mean Square F Sig.
Regression .560 1 .560 .879 .360
Residual 12.107 19 .637
Total 12.667 20
The independent variable is 5. Annual income (in Yuan).
B.2.3.24. Importance of Technology for the next purchase by car owners
Model Summary
R R Square Adjusted R
Square
Std. Error of the
Estimate
.039 .001 -.051 .718
The independent variable is 5. Annual income (in Yuan).
ANOVA
Sum of Squares df Mean Square F Sig.
Regression .015 1 .015 .028 .868
Residual 9.795 19 .516
Total 9.810 20
The independent variable is 5. Annual income (in Yuan).
B.2.3.25. Importance of Affordability for the next purchase by car owners

124
Model Summary
R R Square Adjusted R
Square
Std. Error of the
Estimate
.056 .003 -.049 1.301
The independent variable is 5. Annual income (in Yuan).
ANOVA
Sum of Squares df Mean Square F Sig.
Regression .103 1 .103 .061 .808
Residual 32.183 19 1.694
Total 32.286 20
The independent variable is 5. Annual income (in Yuan).
B.2.3.26. Importance of Comfort for the next purchase by car owners
Model Summary
R R Square Adjusted R
Square
Std. Error of the
Estimate
.050 .002 -.050 .748
The independent variable is 5. Annual income (in Yuan).
ANOVA
Sum of Squares df Mean Square F Sig.
Regression .026 1 .026 .047 .830
Residual 10.640 19 .560
Total 10.667 20
The independent variable is 5. Annual income (in Yuan).
B.2.3.27. Importance of Chinese Brand for the next purchase by car owners
Model Summary
R R Square Adjusted R
Square
Std. Error of the
Estimate
.088 .008 -.045 1.248
The independent variable is 5. Annual income (in Yuan).
ANOVA
Sum of Squares df Mean Square F Sig.
Regression .229 1 .229 .147 .705
Residual 29.580 19 1.557
Total 29.810 20
The independent variable is 5. Annual income (in Yuan).
B.2.3.28. Importance of Safety for non-car owners for their next purchase
Model Summary

125
R R Square Adjusted R
Square
Std. Error of the
Estimate
.113 .013 -.039 .366
The independent variable is 5. Annual income (in Yuan).
ANOVA
Sum of Squares df Mean Square F Sig.
Regression .033 1 .033 .246 .626
Residual 2.539 19 .134
Total 2.571 20
The independent variable is 5. Annual income (in Yuan).
B.2.3.29. Importance of Brand Image for non-car owners for their next purchase
Model Summary
R R Square Adjusted R
Square
Std. Error of the
Estimate
.312 .098 .050 .970
The independent variable is 5. Annual income (in Yuan).
ANOVA
Sum of Squares df Mean Square F Sig.
Regression 1.932 1 1.932 2.053 .168
Residual 17.878 19 .941
Total 19.810 20
The independent variable is 5. Annual income (in Yuan).
B.2.3.30. Importance of Design for non-car owners for their next purchase
Model Summary
R R Square Adjusted R
Square
Std. Error of the
Estimate
.117 .014 -.038 .754
The independent variable is 5. Annual income (in Yuan).
ANOVA
Sum of Squares df Mean Square F Sig.
Regression .149 1 .149 .262 .615
Residual 10.804 19 .569
Total 10.952 20
The independent variable is 5. Annual income (in Yuan).
B.2.3.31. Importance of Fuel Efficiency for non-car owners for their next purchase
Model Summary
R R Square Adjusted R
Square
Std. Error of the
Estimate

126
.101 .010 -.042 .812
The independent variable is 5. Annual income (in Yuan).
ANOVA
Sum of Squares df Mean Square F Sig.
Regression .128 1 .128 .194 .664
Residual 12.539 19 .660
Total 12.667 20
The independent variable is 5. Annual income (in Yuan).
B.2.3.32. Importance of Quality for non-car owners for their next purchase
Model Summary
R R Square Adjusted R
Square
Std. Error of the
Estimate
.274 .075 .026 .532
The independent variable is 5. Annual income (in Yuan).
ANOVA
Sum of Squares df Mean Square F Sig.
Regression .436 1 .436 1.540 .230
Residual 5.374 19 .283
Total 5.810 20
The independent variable is 5. Annual income (in Yuan).
B.2.3.33. Importance of Technology for non-car owners for their next purchase
Model Summary
R R Square Adjusted R
Square
Std. Error of the
Estimate
.082 .007 -.046 .766
The independent variable is 5. Annual income (in Yuan).
ANOVA
Sum of Squares df Mean Square F Sig.
Regression .075 1 .075 .128 .724
Residual 11.163 19 .588
Total 11.238 20
The independent variable is 5. Annual income (in Yuan).
B.2.3.34. Importance of Affordability for non-car owners for their next purchase
Model Summary
R R Square Adjusted R
Square
Std. Error of the
Estimate
.183 .034 -.017 1.231

127
The independent variable is 5. Annual income (in Yuan).
ANOVA
Sum of Squares df Mean Square F Sig.
Regression .999 1 .999 .659 .427
Residual 28.811 19 1.516
Total 29.810 20
The independent variable is 5. Annual income (in Yuan).
B.2.3.35. Importance of Comfort for non-car owners for their next purchase
Model Summary
R R Square Adjusted R
Square
Std. Error of the
Estimate
.120 .015 -.037 1.064
The independent variable is 5. Annual income (in Yuan).
ANOVA
Sum of Squares df Mean Square F Sig.
Regression .316 1 .316 .280 .603
Residual 21.493 19 1.131
Total 21.810 20
The independent variable is 5. Annual income (in Yuan).
B.2.3.36. Importance of Chinese Car for non-car owners for their next purchase
Model Summary
R R Square Adjusted R
Square
Std. Error of the
Estimate
.122 .015 -.037 1.111
The independent variable is 5. Annual income (in Yuan).
ANOVA
Sum of Squares df Mean Square F Sig.
Regression .354 1 .354 .287 .599
Residual 23.456 19 1.235
Total 23.810 20
The independent variable is 5. Annual income (in Yuan).
B.2.4. Psychographics by region of residence.
B.2.4.1. Perception of Global Importance of Safety
Model Summary
R R Square Adjusted R
Square
Std. Error of the
Estimate

128
.214 .046 -.005 .579
The independent variable is 1. Region of Residence.
ANOVA
Sum of Squares df Mean Square F Sig.
Regression .304 1 .304 .909 .352
Residual 6.362 19 .335
Total 6.667 20
The independent variable is 1. Region of Residence.
B.2.4.2. Perception of Global Importance of Brand image
Model Summary
R R Square Adjusted R
Square
Std. Error of the
Estimate
.155 .024 -.027 1.037
The independent variable is 1. Region of Residence.
ANOVA
Sum of Squares df Mean Square F Sig.
Regression .503 1 .503 .467 .502
Residual 20.449 19 1.076
Total 20.952 20
The independent variable is 1. Region of Residence.
B.2.4.3. Perception of Global Importance of Design
Model Summary
R R Square Adjusted R
Square
Std. Error of the
Estimate
.295 .087 .039 .937
The independent variable is 1. Region of Residence.
ANOVA
Sum of Squares df Mean Square F Sig.
Regression 1.590 1 1.590 1.810 .194
Residual 16.696 19 .879
Total 18.286 20
The independent variable is 1. Region of Residence.
B.2.4.4. Perception of Global Importance of Fuel efficiency
Model Summary
R R Square Adjusted R
Square
Std. Error of the
Estimate
.239 .057 .007 .772
The independent variable is 1. Region of Residence.

129
ANOVA
Sum of Squares df Mean Square F Sig.
Regression .685 1 .685 1.150 .297
Residual 11.315 19 .596
Total 12.000 20
The independent variable is 1. Region of Residence.
B.2.4.5. Perception of Global Importance of Quality
Model Summary
R R Square Adjusted R
Square
Std. Error of the
Estimate
.253 .064 .015 .725
The independent variable is 1. Region of Residence.
ANOVA
Sum of Squares df Mean Square F Sig.
Regression .685 1 .685 1.303 .268
Residual 9.982 19 .525
Total 10.667 20
The independent variable is 1. Region of Residence.
B.2.4.6. Perception of Global Importance of Technology
Model Summary
R R Square Adjusted R
Square
Std. Error of the
Estimate
.173 .030 -.021 .874
The independent variable is 1. Region of Residence.
ANOVA
Sum of Squares df Mean Square F Sig.
Regression .449 1 .449 .588 .453
Residual 14.504 19 .763
Total 14.952 20
The independent variable is 1. Region of Residence.
B.2.4.7. Perception of Global Importance of Affordability
Model Summary
R R Square Adjusted R
Square
Std. Error of the
Estimate
.022 .000 -.052 1.234
The independent variable is 1. Region of Residence.
ANOVA
Sum of Squares df Mean Square F Sig.

130
Regression .014 1 .014 .009 .925
Residual 28.938 19 1.523
Total 28.952 20
The independent variable is 1. Region of Residence.
B.2.4.8. Perception of Global Importance of Comfort
Model Summary
R R Square Adjusted R
Square
Std. Error of the
Estimate
.138 .019 -.033 .909
The independent variable is 1. Region of Residence.
ANOVA
Sum of Squares df Mean Square F Sig.
Regression .304 1 .304 .368 .551
Residual 15.696 19 .826
Total 16.000 20
The independent variable is 1. Region of Residence.
B.2.4.9. Perception of Global Importance of Chinese Brand
Model Summary
R R Square Adjusted R
Square
Std. Error of the
Estimate
.137 .019 -.033 1.180
The independent variable is 1. Region of Residence.
ANOVA
Sum of Squares df Mean Square F Sig.
Regression .503 1 .503 .361 .555
Residual 26.449 19 1.392
Total 26.952 20
The independent variable is 1. Region of Residence.
B.2.4.10. Importance of Safety for car owners
Model Summary
R R Square Adjusted R
Square
Std. Error of the
Estimate
.263 .069 .020 .398
The independent variable is 1. Region of Residence.
ANOVA
Sum of Squares df Mean Square F Sig.
Regression .224 1 .224 1.409 .250
Residual 3.014 19 .159

131
Total 3.238 20
The independent variable is 1. Region of Residence.
B.2.4.11. Importance of Brand image for car owners
Model Summary
R R Square Adjusted R
Square
Std. Error of the
Estimate
.216 .047 -.003 .858
The independent variable is 1. Region of Residence.
ANOVA
Sum of Squares df Mean Square F Sig.
Regression .685 1 .685 .931 .347
Residual 13.982 19 .736
Total 14.667 20
The independent variable is 1. Region of Residence.
B.2.4.12. Importance of Design for car owners
Model Summary
R R Square Adjusted R
Square
Std. Error of the
Estimate
.327 .107 .060 .992
The independent variable is 1. Region of Residence.
ANOVA
Sum of Squares df Mean Square F Sig.
Regression 2.242 1 2.242 2.277 .148
Residual 18.710 19 .985
Total 20.952 20
The independent variable is 1. Region of Residence.
B.2.4.13. Importance of Fuel Efficiency for car owners
Model Summary
R R Square Adjusted R
Square
Std. Error of the
Estimate
.149 .022 -.029 .780
The independent variable is 1. Region of Residence.
ANOVA
Sum of Squares df Mean Square F Sig.
Regression .262 1 .262 .432 .519
Residual 11.547 19 .608
Total 11.810 20
The independent variable is 1. Region of Residence.

132
B.2.4.14. Importance of Quality for car owners
Model Summary
R R Square Adjusted R
Square
Std. Error of the
Estimate
.504 .254 .214 .357
The independent variable is 1. Region of Residence.
ANOVA
Sum of Squares df Mean Square F Sig.
Regression .821 1 .821 6.458 .020
Residual 2.417 19 .127
Total 3.238 20
The independent variable is 1. Region of Residence.
B.2.4.15. Importance of Technology for car owners
Model Summary
R R Square Adjusted R
Square
Std. Error of the
Estimate
.261 .068 .019 1.005
The independent variable is 1. Region of Residence.
ANOVA
Sum of Squares df Mean Square F Sig.
Regression 1.398 1 1.398 1.385 .254
Residual 19.174 19 1.009
Total 20.571 20

133
The independent variable is 1. Region of Residence.
B.2.4.16. Importance of Affordability for car owners
Model Summary
R R Square Adjusted R
Square
Std. Error of the
Estimate
.100 .010 -.042 1.353
The independent variable is 1. Region of Residence.
ANOVA
Sum of Squares df Mean Square F Sig.
Regression .349 1 .349 .191 .667
Residual 34.793 19 1.831
Total 35.143 20
The independent variable is 1. Region of Residence.
B.2.4.17. Importance of Comfort for car owners
Model Summary
R R Square Adjusted R
Square
Std. Error of the
Estimate
.247 .061 .011 .994
The independent variable is 1. Region of Residence.
ANOVA
Sum of Squares df Mean Square F Sig.
Regression 1.217 1 1.217 1.231 .281
Residual 18.783 19 .989
Total 20.000 20
The independent variable is 1. Region of Residence.
B.2.4.18. Importance of Chinese Brand for car owners
Model Summary
R R Square Adjusted R
Square
Std. Error of the
Estimate
.196 .039 -.012 1.174
The independent variable is 1. Region of Residence.
ANOVA
Sum of Squares df Mean Square F Sig.
Regression 1.050 1 1.050 .762 .394
Residual 26.188 19 1.378
Total 27.238 20

134
The independent variable is 1. Region of Residence.
B.2.4.19. Importance of Safety for the next purchase by car owners
Model Summary
R R Square Adjusted R
Square
Std. Error of the
Estimate
.303 .092 .044 .427
The independent variable is 1. Region of Residence.
ANOVA
Sum of Squares df Mean Square F Sig.
Regression .349 1 .349 1.918 .182
Residual 3.460 19 .182
Total 3.810 20
The independent variable is 1. Region of Residence.
B.2.4.20. Importance of Brand Image for the next purchase by car owners
Model Summary
R R Square Adjusted R
Square
Std. Error of the
Estimate
.418 .174 .131 .865
The independent variable is 1. Region of Residence.
ANOVA
Sum of Squares df Mean Square F Sig.
Regression 3.006 1 3.006 4.013 .060
Residual 14.232 19 .749
Total 17.238 20
The independent variable is 1. Region of Residence.

135
B.2.4.21. Importance of Design for the next purchase by car owners
Model Summary
R R Square Adjusted R
Square
Std. Error of the
Estimate
.295 .087 .039 .937
The independent variable is 1. Region of Residence.
ANOVA
Sum of Squares df Mean Square F Sig.
Regression 1.590 1 1.590 1.810 .194
Residual 16.696 19 .879
Total 18.286 20
The independent variable is 1. Region of Residence.
B.2.4.22. Importance of Fuel Efficiency for the next purchase by car owners
Model Summary
R R Square Adjusted R
Square
Std. Error of the
Estimate
.188 .035 -.015 .755
The independent variable is 1. Region of Residence.
ANOVA
Sum of Squares df Mean Square F Sig.
Regression .398 1 .398 .697 .414
Residual 10.841 19 .571
Total 11.238 20
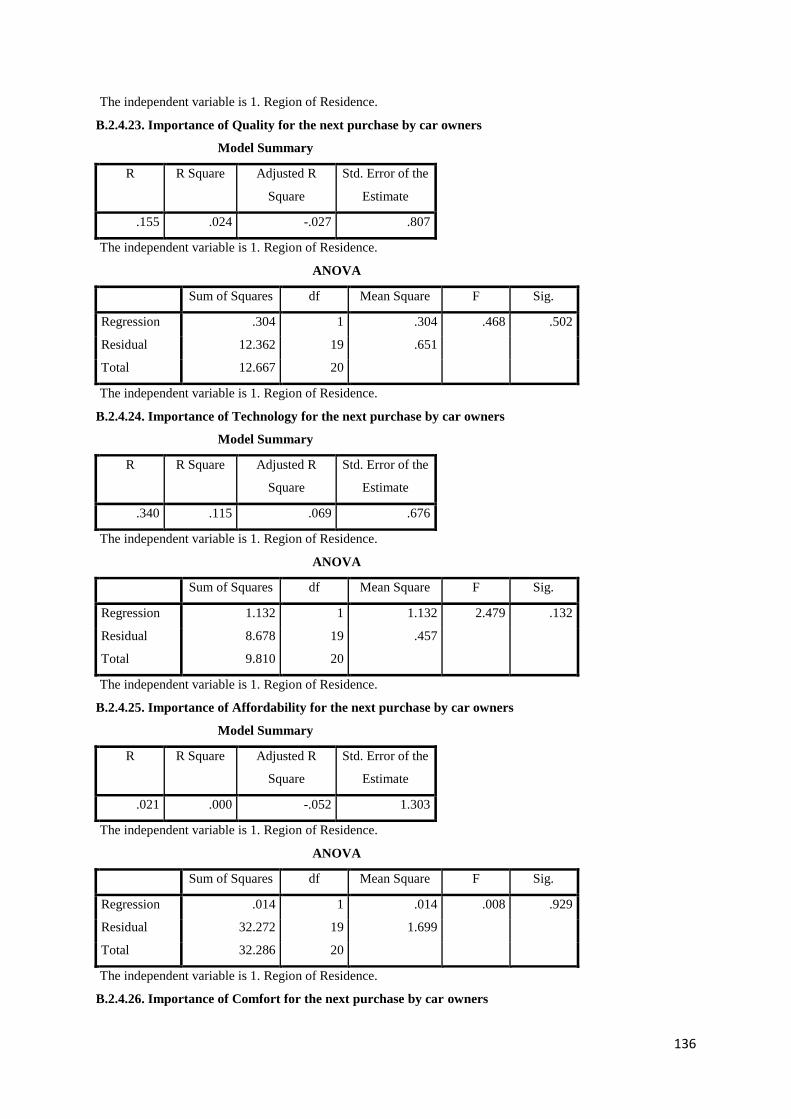
136
The independent variable is 1. Region of Residence.
B.2.4.23. Importance of Quality for the next purchase by car owners
Model Summary
R R Square Adjusted R
Square
Std. Error of the
Estimate
.155 .024 -.027 .807
The independent variable is 1. Region of Residence.
ANOVA
Sum of Squares df Mean Square F Sig.
Regression .304 1 .304 .468 .502
Residual 12.362 19 .651
Total 12.667 20
The independent variable is 1. Region of Residence.
B.2.4.24. Importance of Technology for the next purchase by car owners
Model Summary
R R Square Adjusted R
Square
Std. Error of the
Estimate
.340 .115 .069 .676
The independent variable is 1. Region of Residence.
ANOVA
Sum of Squares df Mean Square F Sig.
Regression 1.132 1 1.132 2.479 .132
Residual 8.678 19 .457
Total 9.810 20
The independent variable is 1. Region of Residence.
B.2.4.25. Importance of Affordability for the next purchase by car owners
Model Summary
R R Square Adjusted R
Square
Std. Error of the
Estimate
.021 .000 -.052 1.303
The independent variable is 1. Region of Residence.
ANOVA
Sum of Squares df Mean Square F Sig.
Regression .014 1 .014 .008 .929
Residual 32.272 19 1.699
Total 32.286 20
The independent variable is 1. Region of Residence.
B.2.4.26. Importance of Comfort for the next purchase by car owners

137
Model Summary
R R Square Adjusted R
Square
Std. Error of the
Estimate
.169 .029 -.023 .739
The independent variable is 1. Region of Residence.
ANOVA
Sum of Squares df Mean Square F Sig.
Regression .304 1 .304 .558 .464
Residual 10.362 19 .545
Total 10.667 20
The independent variable is 1. Region of Residence.
B.2.4.27. Importance of Chinese Brand for the next purchase by car owners
Model Summary
R R Square Adjusted R
Square
Std. Error of the
Estimate
.549 .301 .264 1.047
The independent variable is 1. Region of Residence.
ANOVA
Sum of Squares df Mean Square F Sig.
Regression 8.969 1 8.969 8.177 .010
Residual 20.841 19 1.097
Total 29.810 20
The independent variable is 1. Region of Residence.

138
B.2.4.28. Importance of Safety for non-car owners for their next purchase
Model Summary
R R Square Adjusted R
Square
Std. Error of the
Estimate
.221 .049 -.001 .359
The independent variable is 1. Region of Residence.
ANOVA
Sum of Squares df Mean Square F Sig.
Regression .126 1 .126 .977 .335
Residual 2.446 19 .129
Total 2.571 20
The independent variable is 1. Region of Residence.
B.2.4.29. Importance of Brand Image for non-car owners for their next purchase
Model Summary
R R Square Adjusted R
Square
Std. Error of the
Estimate
.505 .255 .215 .882
The independent variable is 1. Region of Residence.
ANOVA
Sum of Squares df Mean Square F Sig.
Regression 5.045 1 5.045 6.492 .020
Residual 14.764 19 .777
Total 19.810 20
The independent variable is 1. Region of Residence.

139
B.2.4.30. Importance of Design for non-car owners for their next purchase
Model Summary
R R Square Adjusted R
Square
Std. Error of the
Estimate
.464 .216 .174 .672
The independent variable is 1. Region of Residence.
ANOVA
Sum of Squares df Mean Square F Sig.
Regression 2.362 1 2.362 5.224 .034
Residual 8.591 19 .452
Total 10.952 20
The independent variable is 1. Region of Residence.

140
B.2.4.31. Importance of Fuel Efficiency for non-car owners for their next purchase
Model Summary
R R Square Adjusted R
Square
Std. Error of the
Estimate
.310 .096 .049 .776
The independent variable is 1. Region of Residence.
ANOVA
Sum of Squares df Mean Square F Sig.
Regression 1.217 1 1.217 2.020 .171
Residual 11.449 19 .603
Total 12.667 20
The independent variable is 1. Region of Residence.
B.2.4.32. Importance of Quality for non-car owners for their next purchase
Model Summary
R R Square Adjusted R
Square
Std. Error of the
Estimate
.016 .000 -.052 .553
The independent variable is 1. Region of Residence.
ANOVA
Sum of Squares df Mean Square F Sig.
Regression .002 1 .002 .005 .944
Residual 5.808 19 .306
Total 5.810 20

141
The independent variable is 1. Region of Residence.
B.2.4.33. Importance of Technology for non-car owners for their next purchase
Model Summary
R R Square Adjusted R
Square
Std. Error of the
Estimate
.517 .268 .229 .658
The independent variable is 1. Region of Residence.
ANOVA
Sum of Squares df Mean Square F Sig.
Regression 3.006 1 3.006 6.939 .016
Residual 8.232 19 .433
Total 11.238 20
The independent variable is 1. Region of Residence.
B.2.4.34. Importance of Affordability for non-car owners for their next purchase
Model Summary
R R Square Adjusted R
Square
Std. Error of the
Estimate
.058 .003 -.049 1.250
The independent variable is 1. Region of Residence.
ANOVA
Sum of Squares df Mean Square F Sig.
Regression .099 1 .099 .064 .804
Residual 29.710 19 1.564
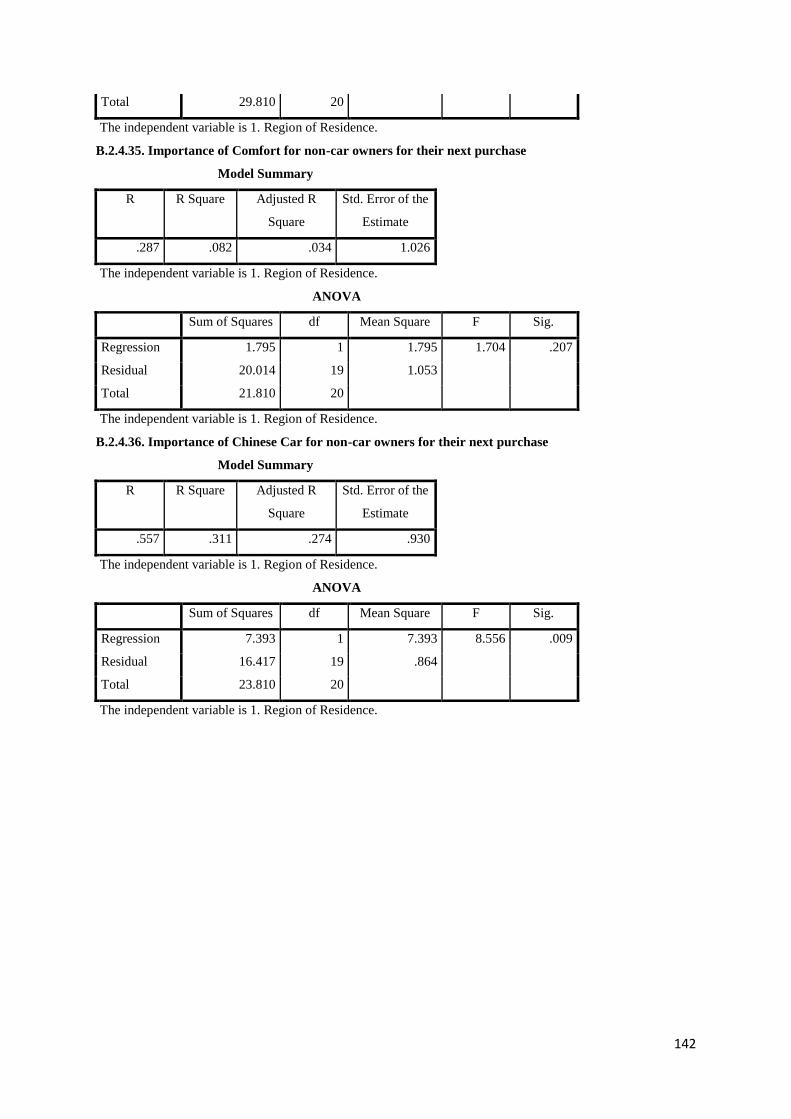
142
Total 29.810 20
The independent variable is 1. Region of Residence.
B.2.4.35. Importance of Comfort for non-car owners for their next purchase
Model Summary
R R Square Adjusted R
Square
Std. Error of the
Estimate
.287 .082 .034 1.026
The independent variable is 1. Region of Residence.
ANOVA
Sum of Squares df Mean Square F Sig.
Regression 1.795 1 1.795 1.704 .207
Residual 20.014 19 1.053
Total 21.810 20
The independent variable is 1. Region of Residence.
B.2.4.36. Importance of Chinese Car for non-car owners for their next purchase
Model Summary
R R Square Adjusted R
Square
Std. Error of the
Estimate
.557 .311 .274 .930
The independent variable is 1. Region of Residence.
ANOVA
Sum of Squares df Mean Square F Sig.
Regression 7.393 1 7.393 8.556 .009
Residual 16.417 19 .864
Total 23.810 20
The independent variable is 1. Region of Residence.

143
B.2.5. psychographics by degree of urbanisation
B.2.5.1. Perception of Global Importance of Safety
Model Summary
R R Square Adjusted R
Square
Std. Error of the
Estimate
.269 .073 .024 .570
The independent variable is 2. Degree of Urbanisation.
ANOVA
Sum of Squares df Mean Square F Sig.
Regression .484 1 .484 1.488 .237
Residual 6.183 19 .325
Total 6.667 20
The independent variable is 2. Degree of Urbanisation.
B.2.5.2. Perception of Global Importance of Brand image
Model Summary
R R Square Adjusted R
Square
Std. Error of the
Estimate
.063 .004 -.048 1.048
The independent variable is 2. Degree of Urbanisation.
ANOVA
Sum of Squares df Mean Square F Sig.
Regression .083 1 .083 .076 .786

144
Residual 20.869 19 1.098
Total 20.952 20
The independent variable is 2. Degree of Urbanisation.
B.2.5.3. Perception of Global Importance of Design
Model Summary
R R Square Adjusted R
Square
Std. Error of the
Estimate
.356 .126 .080 .917
The independent variable is 2. Degree of Urbanisation.
ANOVA
Sum of Squares df Mean Square F Sig.
Regression 2.313 1 2.313 2.751 .114
Residual 15.973 19 .841
Total 18.286 20
The independent variable is 2. Degree of Urbanisation.
B.2.5.4. Perception of Global Importance of Fuel efficiency
Model Summary
R R Square Adjusted R
Square
Std. Error of the
Estimate
.181 .033 -.018 .782
The independent variable is 2. Degree of Urbanisation.
ANOVA
Sum of Squares df Mean Square F Sig.
Regression .392 1 .392 .642 .433
Residual 11.608 19 .611
Total 12.000 20
The independent variable is 2. Degree of Urbanisation.
B.2.5.5. Perception of Global Importance of Quality
Model Summary
R R Square Adjusted R
Square
Std. Error of the
Estimate
.341 .116 .070 .704
The independent variable is 2. Degree of Urbanisation.
ANOVA
Sum of Squares df Mean Square F Sig.
Regression 1.239 1 1.239 2.498 .131
Residual 9.427 19 .496
Total 10.667 20

145
The independent variable is 2. Degree of Urbanisation.
B.2.5.6. Perception of Global Importance of Technology
Model Summary
R R Square Adjusted R
Square
Std. Error of the
Estimate
.326 .107 .060 .839
The independent variable is 2. Degree of Urbanisation.
ANOVA
Sum of Squares df Mean Square F Sig.
Regression 1.593 1 1.593 2.266 .149
Residual 13.359 19 .703
Total 14.952 20
The independent variable is 2. Degree of Urbanisation.
B.2.5.7. Perception of Global Importance of Affordability
Model Summary
R R Square Adjusted R
Square
Std. Error of the
Estimate
.024 .001 -.052 1.234
The independent variable is 2. Degree of Urbanisation.
ANOVA
Sum of Squares df Mean Square F Sig.
Regression .017 1 .017 .011 .918
Residual 28.936 19 1.523
Total 28.952 20
The independent variable is 2. Degree of Urbanisation.
B.2.5.8. Perception of Global Importance of Comfort
Model Summary
R R Square Adjusted R
Square
Std. Error of the
Estimate
.365 .133 .088 .854
The independent variable is 2. Degree of Urbanisation.
ANOVA
Sum of Squares df Mean Square F Sig.
Regression 2.135 1 2.135 2.925 .103
Residual 13.865 19 .730
Total 16.000 20
The independent variable is 2. Degree of Urbanisation.
B.2.5.9. Perception of Global Importance of Chinese Brand

146
Model Summary
R R Square Adjusted R
Square
Std. Error of the
Estimate
.417 .174 .131 1.082
The independent variable is 2. Degree of Urbanisation.
ANOVA
Sum of Squares df Mean Square F Sig.
Regression 4.695 1 4.695 4.008 .060
Residual 22.257 19 1.171
Total 26.952 20
The independent variable is 2. Degree of Urbanisation.
B.2.5.10. Importance of Safety for car owners
Model Summary
R R Square Adjusted R
Square
Std. Error of the
Estimate
.022 .000 -.052 .413
The independent variable is 2. Degree of Urbanisation.
ANOVA
Sum of Squares df Mean Square F Sig.
Regression .002 1 .002 .009 .924
Residual 3.237 19 .170
Total 3.238 20
The independent variable is 2. Degree of Urbanisation.

147
B.2.5.11. Importance of Brand image for car owners
Model Summary
R R Square Adjusted R
Square
Std. Error of the
Estimate
.182 .033 -.018 .864
The independent variable is 2. Degree of Urbanisation.
ANOVA
Sum of Squares df Mean Square F Sig.
Regression .484 1 .484 .649 .431
Residual 14.183 19 .746
Total 14.667 20
The independent variable is 2. Degree of Urbanisation.
B.2.5.12. Importance of Design for car owners
Model Summary
R R Square Adjusted R
Square
Std. Error of the
Estimate
.109 .012 -.040 1.044
The independent variable is 2. Degree of Urbanisation.
ANOVA
Sum of Squares df Mean Square F Sig.
Regression .247 1 .247 .227 .639
Residual 20.705 19 1.090
Total 20.952 20
The independent variable is 2. Degree of Urbanisation.
B.2.5.13. Importance of Fuel Efficiency for car owners
Model Summary
R R Square Adjusted R
Square
Std. Error of the
Estimate
.228 .052 .002 .768
The independent variable is 2. Degree of Urbanisation.
ANOVA
Sum of Squares df Mean Square F Sig.
Regression .617 1 .617 1.047 .319
Residual 11.193 19 .589
Total 11.810 20
The independent variable is 2. Degree of Urbanisation.
B.2.5.14. Importance of Quality for car owners
Model Summary

148
R R Square Adjusted R
Square
Std. Error of the
Estimate
.094 .009 -.043 .411
The independent variable is 2. Degree of Urbanisation.
ANOVA
Sum of Squares df Mean Square F Sig.
Regression .029 1 .029 .169 .686
Residual 3.210 19 .169
Total 3.238 20
The independent variable is 2. Degree of Urbanisation.
B.2.5.15. Importance of Technology for car owners
Model Summary
R R Square Adjusted R
Square
Std. Error of the
Estimate
.191 .036 -.014 1.021
The independent variable is 2. Degree of Urbanisation.
ANOVA
Sum of Squares df Mean Square F Sig.
Regression .748 1 .748 .717 .408
Residual 19.824 19 1.043
Total 20.571 20
The independent variable is 2. Degree of Urbanisation.
B.2.5.16. Importance of Affordability for car owners
Model Summary
R R Square Adjusted R
Square
Std. Error of the
Estimate
.091 .008 -.044 1.354
The independent variable is 2. Degree of Urbanisation.
ANOVA
Sum of Squares df Mean Square F Sig.
Regression .288 1 .288 .157 .696
Residual 34.855 19 1.834
Total 35.143 20
The independent variable is 2. Degree of Urbanisation.
B.2.5.17. Importance of Comfort for car owners
Model Summary
R R Square Adjusted R
Square
Std. Error of the
Estimate

149
.093 .009 -.043 1.021
The independent variable is 2. Degree of Urbanisation.
ANOVA
Sum of Squares df Mean Square F Sig.
Regression .174 1 .174 .167 .687
Residual 19.826 19 1.043
Total 20.000 20
The independent variable is 2. Degree of Urbanisation.
B.2.5.18. Importance of Chinese Brand for car owners
Model Summary
R R Square Adjusted R
Square
Std. Error of the
Estimate
.379 .144 .099 1.108
The independent variable is 2. Degree of Urbanisation.
ANOVA
Sum of Squares df Mean Square F Sig.
Regression 3.912 1 3.912 3.187 .090
Residual 23.326 19 1.228
Total 27.238 20
The independent variable is 2. Degree of Urbanisation.
B.2.5.19. Importance of Safety for the next purchase by car owners
Model Summary

150
R R Square Adjusted R
Square
Std. Error of the
Estimate
.081 .007 -.046 .446
The independent variable is 2. Degree of Urbanisation.
ANOVA
Sum of Squares df Mean Square F Sig.
Regression .025 1 .025 .127 .726
Residual 3.784 19 .199
Total 3.810 20
The independent variable is 2. Degree of Urbanisation.
B.2.5.20. Importance of Brand Image for the next purchase by car owners
Model Summary
R R Square Adjusted R
Square
Std. Error of the
Estimate
.026 .001 -.052 .952
The independent variable is 2. Degree of Urbanisation.
ANOVA
Sum of Squares df Mean Square F Sig.
Regression .012 1 .012 .013 .910
Residual 17.226 19 .907
Total 17.238 20
The independent variable is 2. Degree of Urbanisation.
B.2.5.21. Importance of Design for the next purchase by car owners
Model Summary
R R Square Adjusted R
Square
Std. Error of the
Estimate
.014 .000 -.052 .981
The independent variable is 2. Degree of Urbanisation.
ANOVA
Sum of Squares df Mean Square F Sig.
Regression .004 1 .004 .004 .952
Residual 18.282 19 .962
Total 18.286 20
The independent variable is 2. Degree of Urbanisation.
B.2.5.22. Importance of Fuel Efficiency for the next purchase by car owners
Model Summary
R R Square Adjusted R
Square
Std. Error of the
Estimate

151
.113 .013 -.039 .764
The independent variable is 2. Degree of Urbanisation.
ANOVA
Sum of Squares df Mean Square F Sig.
Regression .143 1 .143 .244 .627
Residual 11.095 19 .584
Total 11.238 20
The independent variable is 2. Degree of Urbanisation.
B.2.5.23. Importance of Quality for the next purchase by car owners
Model Summary
R R Square Adjusted R
Square
Std. Error of the
Estimate
.430 .185 .142 .737
The independent variable is 2. Degree of Urbanisation.
ANOVA
Sum of Squares df Mean Square F Sig.
Regression 2.343 1 2.343 4.312 .052
Residual 10.324 19 .543
Total 12.667 20
The independent variable is 2. Degree of Urbanisation.
B.2.5.24. Importance of Technology for the next purchase by car owners
Model Summary
R R Square Adjusted R
Square
Std. Error of the
Estimate
.184 .034 -.017 .706
The independent variable is 2. Degree of Urbanisation.
ANOVA
Sum of Squares df Mean Square F Sig.
Regression .332 1 .332 .666 .424
Residual 9.477 19 .499
Total 9.810 20
The independent variable is 2. Degree of Urbanisation.
B.2.5.25. Importance of Affordability for the next purchase by car owners
Model Summary
R R Square Adjusted R
Square
Std. Error of the
Estimate
.084 .007 -.045 1.299
The independent variable is 2. Degree of Urbanisation.

152
ANOVA
Sum of Squares df Mean Square F Sig.
Regression .228 1 .228 .135 .717
Residual 32.058 19 1.687
Total 32.286 20
The independent variable is 2. Degree of Urbanisation.
B.2.5.26. Importance of Comfort for the next purchase by car owners
Model Summary
R R Square Adjusted R
Square
Std. Error of the
Estimate
.107 .011 -.041 .745
The independent variable is 2. Degree of Urbanisation.
ANOVA
Sum of Squares df Mean Square F Sig.
Regression .121 1 .121 .218 .646
Residual 10.546 19 .555
Total 10.667 20
The independent variable is 2. Degree of Urbanisation.
B.2.5.27. Importance of Chinese Brand for the next purchase by car owners
Model Summary
R R Square Adjusted R
Square
Std. Error of the
Estimate
.111 .012 -.040 1.245
The independent variable is 2. Degree of Urbanisation.
ANOVA
Sum of Squares df Mean Square F Sig.
Regression .368 1 .368 .237 .632
Residual 29.442 19 1.550
Total 29.810 20
The independent variable is 2. Degree of Urbanisation.
B.2.5.28. Importance of Safety for non-car owners for their next purchase
Model Summary
R R Square Adjusted R
Square
Std. Error of the
Estimate
.149 .022 -.029 .364
The independent variable is 2. Degree of Urbanisation.
ANOVA
Sum of Squares df Mean Square F Sig.

153
Regression .057 1 .057 .430 .520
Residual 2.515 19 .132
Total 2.571 20
The independent variable is 2. Degree of Urbanisation.
B.2.5.29. Importance of Brand Image for non-car owners for their next purchase
Model Summary
R R Square Adjusted R
Square
Std. Error of the
Estimate
.105 .011 -.041 1.015
The independent variable is 2. Degree of Urbanisation.
ANOVA
Sum of Squares df Mean Square F Sig.
Regression .218 1 .218 .212 .651
Residual 19.591 19 1.031
Total 19.810 20
The independent variable is 2. Degree of Urbanisation.
B.2.5.30. Importance of Design for non-car owners for their next purchase
Model Summary
R R Square Adjusted R
Square
Std. Error of the
Estimate
.186 .035 -.016 .746
The independent variable is 2. Degree of Urbanisation.
ANOVA
Sum of Squares df Mean Square F Sig.
Regression .380 1 .380 .682 .419
Residual 10.573 19 .556
Total 10.952 20
The independent variable is 2. Degree of Urbanisation.
B.2.5.31. Importance of Fuel Efficiency for non-car owners for their next purchase
Model Summary
R R Square Adjusted R
Square
Std. Error of the
Estimate
.274 .075 .026 .785
The independent variable is 2. Degree of Urbanisation.
ANOVA
Sum of Squares df Mean Square F Sig.
Regression .949 1 .949 1.538 .230
Residual 11.718 19 .617

154
Total 12.667 20
The independent variable is 2. Degree of Urbanisation.
B.2.5.32. Importance of Quality for non-car owners for their next purchase
Model Summary
R R Square Adjusted R
Square
Std. Error of the
Estimate
.280 .079 .030 .531
The independent variable is 2. Degree of Urbanisation.
ANOVA
Sum of Squares df Mean Square F Sig.
Regression .457 1 .457 1.622 .218
Residual 5.353 19 .282
Total 5.810 20
The independent variable is 2. Degree of Urbanisation.
B.2.5.33. Importance of Technology for non-car owners for their next purchase
Model Summary
R R Square Adjusted R
Square
Std. Error of the
Estimate
.549 .301 .264 .643
The independent variable is 2. Degree of Urbanisation.
ANOVA
Sum of Squares df Mean Square F Sig.
Regression 3.381 1 3.381 8.177 .010
Residual 7.857 19 .414
Total 11.238 20
The independent variable is 2. Degree of Urbanisation.

155
B.2.5.34. Importance of Affordability for non-car owners for their next purchase
Model Summary
R R Square Adjusted R
Square
Std. Error of the
Estimate
.086 .007 -.045 1.248
The independent variable is 2. Degree of Urbanisation.
ANOVA
Sum of Squares df Mean Square F Sig.
Regression .218 1 .218 .140 .712
Residual 29.591 19 1.557
Total 29.810 20
The independent variable is 2. Degree of Urbanisation.
B.2.5.35. Importance of Comfort for non-car owners for their next purchase
Model Summary
R R Square Adjusted R
Square
Std. Error of the
Estimate
.526 .276 .238 .911
The independent variable is 2. Degree of Urbanisation.
ANOVA
Sum of Squares df Mean Square F Sig.
Regression 6.027 1 6.027 7.256 .014
Residual 15.782 19 .831

156
Total 21.810 20
The independent variable is 2. Degree of Urbanisation.
B.2.5.36. Importance of Chinese Car for non-car owners for their next purchase
Model Summary
R R Square Adjusted R
Square
Std. Error of the
Estimate
.167 .028 -.023 1.104
The independent variable is 2. Degree of Urbanisation.
ANOVA
Sum of Squares df Mean Square F Sig.
Regression .664 1 .664 .545 .469
Residual 23.145 19 1.218
Total 23.810 20
The independent variable is 2. Degree of Urbanisation.
B.3. Customer psychographics by behaviours
B.3.1. Psychographics by car replacement rate
B.3.1.1. Perception of Global Importance of Safety
Model Summary
R R Square Adjusted R
Square
Std. Error of the
Estimate
.316 .100 .053 .562

157
The independent variable is 8.1.3 Car replacement rate.
ANOVA
Sum of Squares df Mean Square F Sig.
Regression .667 1 .667 2.111 .163
Residual 6.000 19 .316
Total 6.667 20
The independent variable is 8.1.3 Car replacement rate.
B.3.1.2. Perception of Global Importance of Brand image
Model Summary
R R Square Adjusted R
Square
Std. Error of the
Estimate
.491 .241 .201 .915
The independent variable is 8.1.3 Car replacement rate.
ANOVA
Sum of Squares df Mean Square F Sig.
Regression 5.042 1 5.042 6.021 .024
Residual 15.911 19 .837
Total 20.952 20
The independent variable is 8.1.3 Car replacement rate.
B.3.1.3. Perception of Global Importance of Design
Model Summary
R R Square Adjusted R
Square
Std. Error of the
Estimate

158
.072 .005 -.047 .979
The independent variable is 8.1.3 Car replacement rate.
ANOVA
Sum of Squares df Mean Square F Sig.
Regression .094 1 .094 .098 .758
Residual 18.192 19 .957
Total 18.286 20
The independent variable is 8.1.3 Car replacement rate.
B.3.1.4. Perception of Global Importance of Fuel efficiency
Model Summary
R R Square Adjusted R
Square
Std. Error of the
Estimate
.354 .125 .079 .743
The independent variable is 8.1.3 Car replacement rate.
ANOVA
Sum of Squares df Mean Square F Sig.
Regression 1.500 1 1.500 2.714 .116
Residual 10.500 19 .553
Total 12.000 20
The independent variable is 8.1.3 Car replacement rate.
B.3.1.5. Perception of Global Importance of Quality
Model Summary
R R Square Adjusted R
Square
Std. Error of the
Estimate
.156 .024 -.027 .740
The independent variable is 8.1.3 Car replacement rate.
ANOVA
Sum of Squares df Mean Square F Sig.
Regression .260 1 .260 .475 .499
Residual 10.406 19 .548
Total 10.667 20
The independent variable is 8.1.3 Car replacement rate.
B.3.1.6. Perception of Global Importance of Technology
Model Summary
R R Square Adjusted R
Square
Std. Error of the
Estimate
.185 .034 -.017 .872
The independent variable is 8.1.3 Car replacement rate.

159
ANOVA
Sum of Squares df Mean Square F Sig.
Regression .510 1 .510 .672 .423
Residual 14.442 19 .760
Total 14.952 20
The independent variable is 8.1.3 Car replacement rate.
B.3.1.7. Perception of Global Importance of Affordability
Model Summary
R R Square Adjusted R
Square
Std. Error of the
Estimate
.095 .009 -.043 1.229
The independent variable is 8.1.3 Car replacement rate.
ANOVA
Sum of Squares df Mean Square F Sig.
Regression .260 1 .260 .172 .683
Residual 28.692 19 1.510
Total 28.952 20
The independent variable is 8.1.3 Car replacement rate.
B.3.1.8. Perception of Global Importance of Comfort
Model Summary
R R Square Adjusted R
Square
Std. Error of the
Estimate
.153 .023 -.028 .907
The independent variable is 8.1.3 Car replacement rate.
ANOVA
Sum of Squares df Mean Square F Sig.
Regression .375 1 .375 .456 .508
Residual 15.625 19 .822
Total 16.000 20
The independent variable is 8.1.3 Car replacement rate.
B.3.1.9. Perception of Global Importance of Chinese Brand
Model Summary
R R Square Adjusted R
Square
Std. Error of the
Estimate
.157 .025 -.027 1.176
The independent variable is 8.1.3 Car replacement rate.
ANOVA
Sum of Squares df Mean Square F Sig.

160
Regression .667 1 .667 .482 .496
Residual 26.286 19 1.383
Total 26.952 20
The independent variable is 8.1.3 Car replacement rate.
B.3.1.10. Importance of Safety for car owners
Model Summary
R R Square Adjusted R
Square
Std. Error of the
Estimate
.227 .051 .002 .402
The independent variable is 8.1.3 Car replacement rate.
ANOVA
Sum of Squares df Mean Square F Sig.
Regression .167 1 .167 1.031 .323
Residual 3.071 19 .162
Total 3.238 20
The independent variable is 8.1.3 Car replacement rate.
B.3.1.11. Importance of Brand image for car owners
Model Summary
R R Square Adjusted R
Square
Std. Error of the
Estimate
.453 .205 .163 .783
The independent variable is 8.1.3 Car replacement rate.
ANOVA
Sum of Squares df Mean Square F Sig.
Regression 3.010 1 3.010 4.907 .039
Residual 11.656 19 .613
Total 14.667 20
The independent variable is 8.1.3 Car replacement rate.
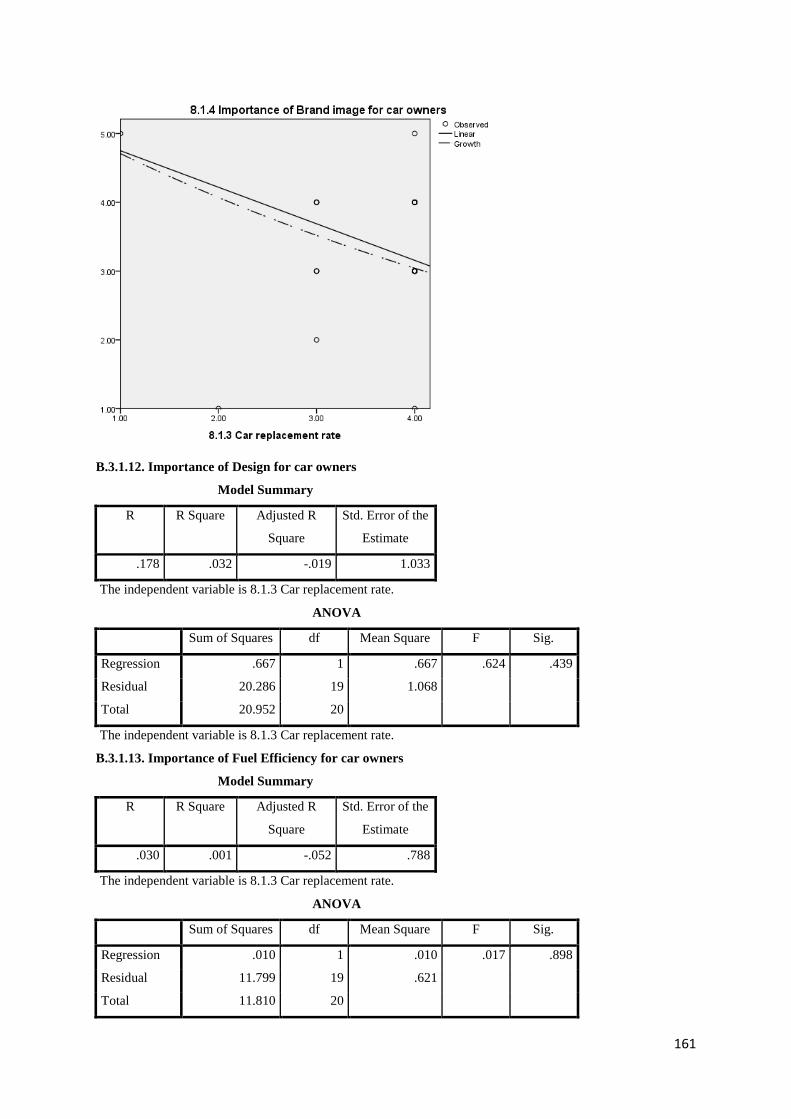
161
B.3.1.12. Importance of Design for car owners
Model Summary
R R Square Adjusted R
Square
Std. Error of the
Estimate
.178 .032 -.019 1.033
The independent variable is 8.1.3 Car replacement rate.
ANOVA
Sum of Squares df Mean Square F Sig.
Regression .667 1 .667 .624 .439
Residual 20.286 19 1.068
Total 20.952 20
The independent variable is 8.1.3 Car replacement rate.
B.3.1.13. Importance of Fuel Efficiency for car owners
Model Summary
R R Square Adjusted R
Square
Std. Error of the
Estimate
.030 .001 -.052 .788
The independent variable is 8.1.3 Car replacement rate.
ANOVA
Sum of Squares df Mean Square F Sig.
Regression .010 1 .010 .017 .898
Residual 11.799 19 .621
Total 11.810 20
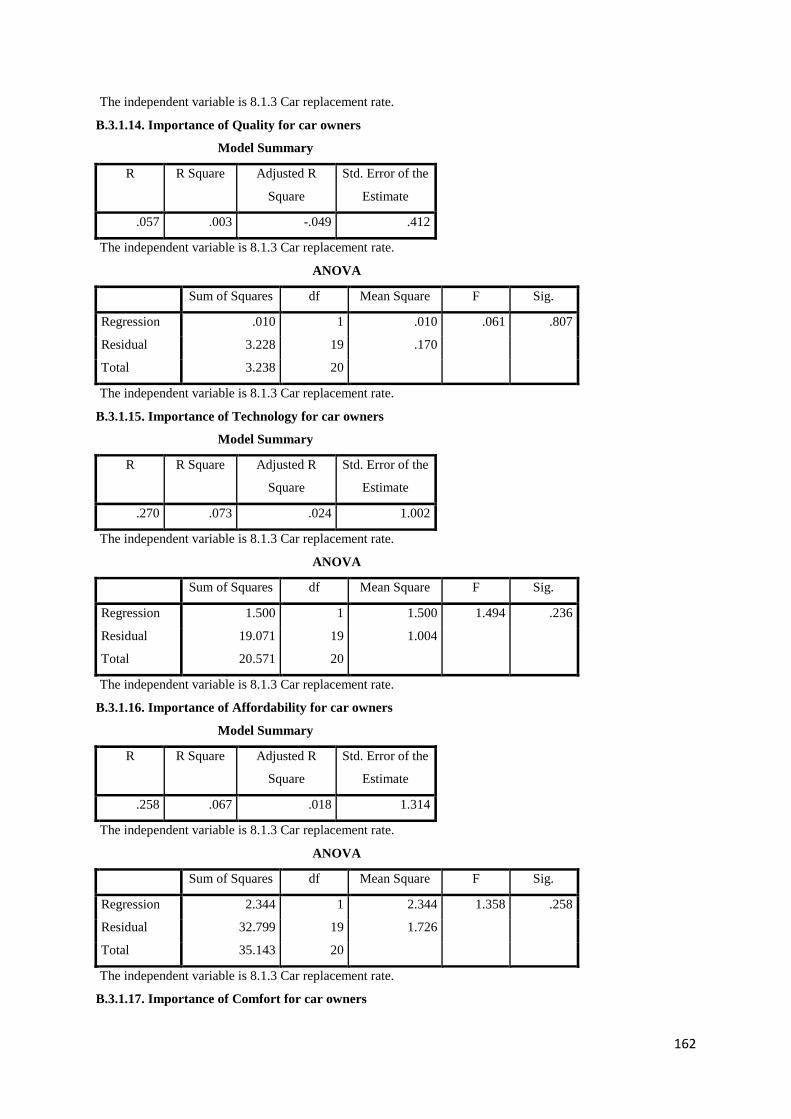
162
The independent variable is 8.1.3 Car replacement rate.
B.3.1.14. Importance of Quality for car owners
Model Summary
R R Square Adjusted R
Square
Std. Error of the
Estimate
.057 .003 -.049 .412
The independent variable is 8.1.3 Car replacement rate.
ANOVA
Sum of Squares df Mean Square F Sig.
Regression .010 1 .010 .061 .807
Residual 3.228 19 .170
Total 3.238 20
The independent variable is 8.1.3 Car replacement rate.
B.3.1.15. Importance of Technology for car owners
Model Summary
R R Square Adjusted R
Square
Std. Error of the
Estimate
.270 .073 .024 1.002
The independent variable is 8.1.3 Car replacement rate.
ANOVA
Sum of Squares df Mean Square F Sig.
Regression 1.500 1 1.500 1.494 .236
Residual 19.071 19 1.004
Total 20.571 20
The independent variable is 8.1.3 Car replacement rate.
B.3.1.16. Importance of Affordability for car owners
Model Summary
R R Square Adjusted R
Square
Std. Error of the
Estimate
.258 .067 .018 1.314
The independent variable is 8.1.3 Car replacement rate.
ANOVA
Sum of Squares df Mean Square F Sig.
Regression 2.344 1 2.344 1.358 .258
Residual 32.799 19 1.726
Total 35.143 20
The independent variable is 8.1.3 Car replacement rate.
B.3.1.17. Importance of Comfort for car owners

163
Model Summary
R R Square Adjusted R
Square
Std. Error of the
Estimate
.205 .042 -.008 1.004
The independent variable is 8.1.3 Car replacement rate.
ANOVA
Sum of Squares df Mean Square F Sig.
Regression .844 1 .844 .837 .372
Residual 19.156 19 1.008
Total 20.000 20
The independent variable is 8.1.3 Car replacement rate.
B.3.1.18. Importance of Chinese Brand for car owners
Model Summary
R R Square Adjusted R
Square
Std. Error of the
Estimate
.196 .038 -.012 1.174
The independent variable is 8.1.3 Car replacement rate.
ANOVA
Sum of Squares df Mean Square F Sig.
Regression 1.042 1 1.042 .756 .396
Residual 26.196 19 1.379
Total 27.238 20
The independent variable is 8.1.3 Car replacement rate.
B.3.1.19. Importance of Safety for the next purchase by car owners
Model Summary
R R Square Adjusted R
Square
Std. Error of the
Estimate
.209 .044 -.007 .438
The independent variable is 8.1.3 Car replacement rate.
ANOVA
Sum of Squares Df Mean Square F Sig.
Regression .167 1 .167 .869 .363
Residual 3.643 19 .192
Total 3.810 20
The independent variable is 8.1.3 Car replacement rate.
B.3.1.20. Importance of Brand Image for the next purchase by car owners
Model Summary

164
R R Square Adjusted R
Square
Std. Error of the
Estimate
.320 .102 .055 .903
The independent variable is 8.1.3 Car replacement rate.
ANOVA
Sum of Squares Df Mean Square F Sig.
Regression 1.760 1 1.760 2.161 .158
Residual 15.478 19 .815
Total 17.238 20
The independent variable is 8.1.3 Car replacement rate.
B.3.1.21. Importance of Design for the next purchase by car owners
Model Summary
R R Square Adjusted R
Square
Std. Error of the
Estimate
.215 .046 -.004 .958
The independent variable is 8.1.3 Car replacement rate.
ANOVA
Sum of Squares Df Mean Square F Sig.
Regression .844 1 .844 .919 .350
Residual 17.442 19 .918
Total 18.286 20
The independent variable is 8.1.3 Car replacement rate.
B.3.1.22. Importance of Fuel Efficiency for the next purchase by car owners
Model Summary
R R Square Adjusted R
Square
Std. Error of the
Estimate
.213 .045 -.005 .751
The independent variable is 8.1.3 Car replacement rate.
ANOVA
Sum of Squares df Mean Square F Sig.
Regression .510 1 .510 .904 .354
Residual 10.728 19 .565
Total 11.238 20
The independent variable is 8.1.3 Car replacement rate.
B.3.1.23. Importance of Quality for the next purchase by car owners
Model Summary
R R Square Adjusted R
Square
Std. Error of the
Estimate

165
.143 .021 -.031 .808
The independent variable is 8.1.3 Car replacement rate.
ANOVA
Sum of Squares df Mean Square F Sig.
Regression .260 1 .260 .399 .535
Residual 12.406 19 .653
Total 12.667 20
The independent variable is 8.1.3 Car replacement rate.
B.3.1.24. Importance of Technology for the next purchase by car owners
Model Summary
R R Square Adjusted R
Square
Std. Error of the
Estimate
.228 .052 .002 .700
The independent variable is 8.1.3 Car replacement rate.
ANOVA
Sum of Squares Df Mean Square F Sig.
Regression .510 1 .510 1.043 .320
Residual 9.299 19 .489
Total 9.810 20
The independent variable is 8.1.3 Car replacement rate.
B.3.1.25. Importance of Affordability for the next purchase by car owners
Model Summary
R R Square Adjusted R
Square
Std. Error of the
Estimate
.269 .073 .024 1.255
The independent variable is 8.1.3 Car replacement rate.
ANOVA
Sum of Squares Df Mean Square F Sig.
Regression 2.344 1 2.344 1.487 .238
Residual 29.942 19 1.576
Total 32.286 20
The independent variable is 8.1.3 Car replacement rate.
B.3.1.26. Importance of Comfort for the next purchase by car owners
Model Summary
R R Square Adjusted R
Square
Std. Error of the
Estimate
.156 .024 -.027 .740
The independent variable is 8.1.3 Car replacement rate.

166
ANOVA
Sum of Squares df Mean Square F Sig.
Regression .260 1 .260 .475 .499
Residual 10.406 19 .548
Total 10.667 20
The independent variable is 8.1.3 Car replacement rate.
B.3.1.27. Importance of Chinese Brand for the next purchase by car owners
Model Summary
R R Square Adjusted R
Square
Std. Error of the
Estimate
.355 .126 .080 1.171
The independent variable is 8.1.3 Car replacement rate.
ANOVA
Sum of Squares df Mean Square F Sig.
Regression 3.760 1 3.760 2.743 .114
Residual 26.049 19 1.371
Total 29.810 20
The independent variable is 8.1.3 Car replacement rate.
B.3.1.28. Importance of Safety for non-car owners for their next purchase
Model Summary
R R Square Adjusted R
Square
Std. Error of the
Estimate
.191 .036 -.014 .361
The independent variable is 8.1.3 Car replacement rate.
ANOVA
Sum of Squares df Mean Square F Sig.
Regression .094 1 .094 .719 .407
Residual 2.478 19 .130
Total 2.571 20
The independent variable is 8.1.3 Car replacement rate.
B.3.1.29. Importance of Brand Image for non car owners for their next purchase
Model Summary
R R Square Adjusted R
Square
Std. Error of the
Estimate
.321 .103 .056 .967
The independent variable is 8.1.3 Car replacement rate.
ANOVA
Sum of Squares df Mean Square F Sig.
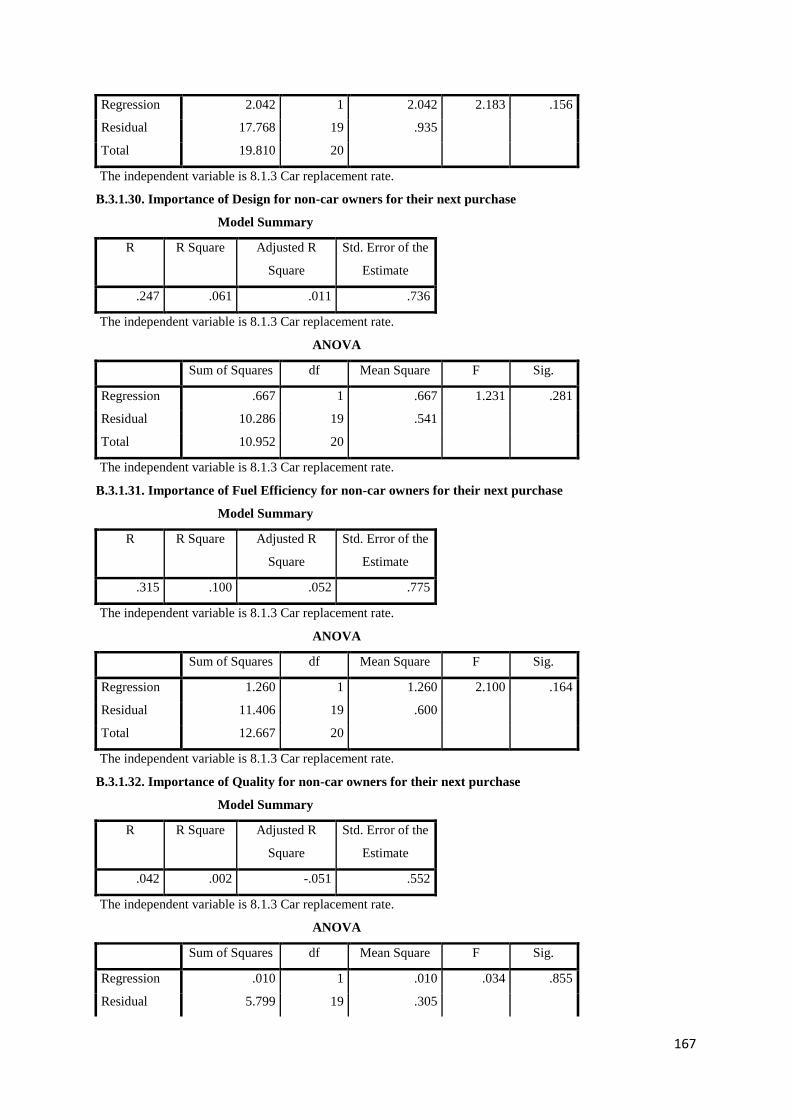
167
Regression 2.042 1 2.042 2.183 .156
Residual 17.768 19 .935
Total 19.810 20
The independent variable is 8.1.3 Car replacement rate.
B.3.1.30. Importance of Design for non-car owners for their next purchase
Model Summary
R R Square Adjusted R
Square
Std. Error of the
Estimate
.247 .061 .011 .736
The independent variable is 8.1.3 Car replacement rate.
ANOVA
Sum of Squares df Mean Square F Sig.
Regression .667 1 .667 1.231 .281
Residual 10.286 19 .541
Total 10.952 20
The independent variable is 8.1.3 Car replacement rate.
B.3.1.31. Importance of Fuel Efficiency for non-car owners for their next purchase
Model Summary
R R Square Adjusted R
Square
Std. Error of the
Estimate
.315 .100 .052 .775
The independent variable is 8.1.3 Car replacement rate.
ANOVA
Sum of Squares df Mean Square F Sig.
Regression 1.260 1 1.260 2.100 .164
Residual 11.406 19 .600
Total 12.667 20
The independent variable is 8.1.3 Car replacement rate.
B.3.1.32. Importance of Quality for non-car owners for their next purchase
Model Summary
R R Square Adjusted R
Square
Std. Error of the
Estimate
.042 .002 -.051 .552
The independent variable is 8.1.3 Car replacement rate.
ANOVA
Sum of Squares df Mean Square F Sig.
Regression .010 1 .010 .034 .855
Residual 5.799 19 .305

168
Total 5.810 20
The independent variable is 8.1.3 Car replacement rate.
B.3.1.33. Importance of Technology for non-car owners for their next purchase
Model Summary
R R Square Adjusted R
Square
Std. Error of the
Estimate
.152 .023 -.028 .760
The independent variable is 8.1.3 Car replacement rate.
ANOVA
Sum of Squares df Mean Square F Sig.
Regression .260 1 .260 .451 .510
Residual 10.978 19 .578
Total 11.238 20
The independent variable is 8.1.3 Car replacement rate.
B.3.1.34. Importance of Affordability for non-car owners for their next purchase
Model Summary
R R Square Adjusted R
Square
Std. Error of the
Estimate
.262 .068 .019 1.209
The independent variable is 8.1.3 Car replacement rate.
ANOVA
Sum of Squares df Mean Square F Sig.
Regression 2.042 1 2.042 1.397 .252
Residual 27.768 19 1.461
Total 29.810 20
The independent variable is 8.1.3 Car replacement rate.
B.3.1.35. Importance of Comfort for non-car owners for their next purchase
Model Summary
R R Square Adjusted R
Square
Std. Error of the
Estimate
.087 .008 -.045 1.067
The independent variable is 8.1.3 Car replacement rate.
ANOVA
Sum of Squares df Mean Square F Sig.
Regression .167 1 .167 .146 .706
Residual 21.643 19 1.139
Total 21.810 20
The independent variable is 8.1.3 Car replacement rate.

169
B.3.1.36. Importance of Chinese Car for non-car owners for their next purchase
Model Summary
R R Square Adjusted R
Square
Std. Error of the
Estimate
.460 .212 .170 .994
The independent variable is 8.1.3 Car replacement rate.
ANOVA
Sum of Squares df Mean Square F Sig.
Regression 5.042 1 5.042 5.104 .036
Residual 18.768 19 .988
Total 23.810 20
The independent variable is 8.1.3 Car replacement rate.
B.3.2. Psychographics by experience
B.3.2.1. Perception of Global Importance of Safety
Model Summary
R R Square Adjusted R
Square
Std. Error of the
Estimate
.243 .059 .010 .575
The independent variable is 7. Number of cars owned
(Experience).
ANOVA
Sum of Squares df Mean Square F Sig.
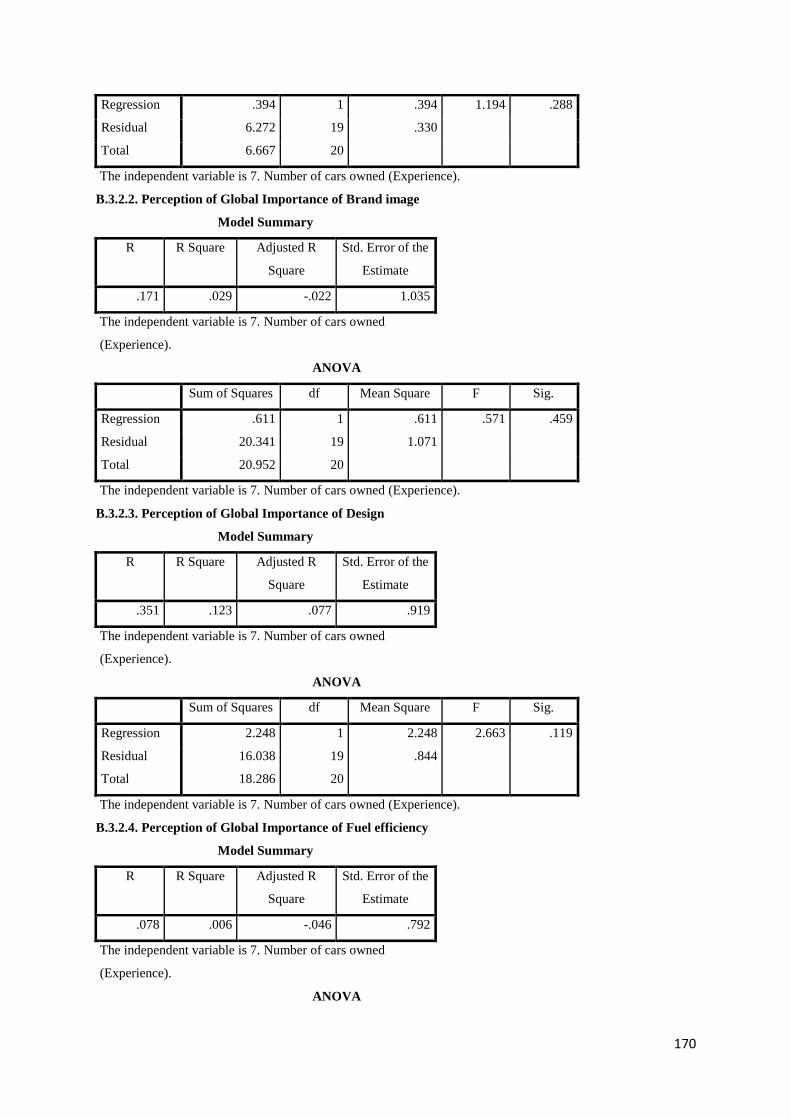
170
Regression .394 1 .394 1.194 .288
Residual 6.272 19 .330
Total 6.667 20
The independent variable is 7. Number of cars owned (Experience).
B.3.2.2. Perception of Global Importance of Brand image
Model Summary
R R Square Adjusted R
Square
Std. Error of the
Estimate
.171 .029 -.022 1.035
The independent variable is 7. Number of cars owned
(Experience).
ANOVA
Sum of Squares df Mean Square F Sig.
Regression .611 1 .611 .571 .459
Residual 20.341 19 1.071
Total 20.952 20
The independent variable is 7. Number of cars owned (Experience).
B.3.2.3. Perception of Global Importance of Design
Model Summary
R R Square Adjusted R
Square
Std. Error of the
Estimate
.351 .123 .077 .919
The independent variable is 7. Number of cars owned
(Experience).
ANOVA
Sum of Squares df Mean Square F Sig.
Regression 2.248 1 2.248 2.663 .119
Residual 16.038 19 .844
Total 18.286 20
The independent variable is 7. Number of cars owned (Experience).
B.3.2.4. Perception of Global Importance of Fuel efficiency
Model Summary
R R Square Adjusted R
Square
Std. Error of the
Estimate
.078 .006 -.046 .792
The independent variable is 7. Number of cars owned
(Experience).
ANOVA

171
Sum of Squares df Mean Square F Sig.
Regression .072 1 .072 .115 .738
Residual 11.928 19 .628
Total 12.000 20
The independent variable is 7. Number of cars owned (Experience).
B.3.2.5. Perception of Global Importance of Quality
Model Summary
R R Square Adjusted R
Square
Std. Error of the
Estimate
.055 .003 -.049 .748
The independent variable is 7. Number of cars owned
(Experience).
ANOVA
Sum of Squares df Mean Square F Sig.
Regression .032 1 .032 .058 .813
Residual 10.634 19 .560
Total 10.667 20
The independent variable is 7. Number of cars owned (Experience).
B.3.2.6. Perception of Global Importance of Technology
Model Summary
R R Square Adjusted R
Square
Std. Error of the
Estimate
.156 .024 -.027 .876
The independent variable is 7. Number of cars owned
(Experience).
ANOVA
Sum of Squares df Mean Square F Sig.
Regression .363 1 .363 .472 .500
Residual 14.590 19 .768
Total 14.952 20
The independent variable is 7. Number of cars owned (Experience).
B.3.2.7. Perception of Global Importance of Affordability
Model Summary
R R Square Adjusted R
Square
Std. Error of the
Estimate
.305 .093 .045 1.176
The independent variable is 7. Number of cars owned
(Experience).

172
ANOVA
Sum of Squares df Mean Square F Sig.
Regression 2.690 1 2.690 1.946 .179
Residual 26.262 19 1.382
Total 28.952 20
The independent variable is 7. Number of cars owned (Experience).
B.3.2.8. Perception of Global Importance of Comfort
Model Summary
R R Square Adjusted R
Square
Std. Error of the
Estimate
.135 .018 -.034 .909
The independent variable is 7. Number of cars owned
(Experience).
ANOVA
Sum of Squares df Mean Square F Sig.
Regression .290 1 .290 .350 .561
Residual 15.710 19 .827
Total 16.000 20
The independent variable is 7. Number of cars owned (Experience).
Coefficients
Unstandardized Coefficients Standardized
Coefficients
t Sig.
B Std. Error Beta
7. Number of cars owned
(Experience) -.145 .245 -.135 -.592 .561
(Constant) 4.324 .582 7.424 .000
B.3.2.9. Perception of Global Importance of Chinese Brand
Model Summary
R R Square Adjusted R
Square
Std. Error of the
Estimate
.212 .045 -.005 1.164
The independent variable is 7. Number of cars owned
(Experience).
ANOVA
Sum of Squares df Mean Square F Sig.
Regression 1.214 1 1.214 .897 .356
Residual 25.738 19 1.355

173
Total 26.952 20
The independent variable is 7. Number of cars owned (Experience).
B.3.2.10. Importance of Safety for car owners
Model Summary
R R Square Adjusted R
Square
Std. Error of the
Estimate
.007 .000 -.053 .413
The independent variable is 7. Number of cars owned
(Experience).
ANOVA
Sum of Squares df Mean Square F Sig.
Regression .000 1 .000 .001 .976
Residual 3.238 19 .170
Total 3.238 20
The independent variable is 7. Number of cars owned (Experience).
B.3.2.11. Importance of Brand image for car owners
Model Summary
R R Square Adjusted R
Square
Std. Error of the
Estimate
.468 .219 .178 .776
The independent variable is 7. Number of cars owned
(Experience).
ANOVA
Sum of Squares Df Mean Square F Sig.
Regression 3.218 1 3.218 5.341 .032
Residual 11.448 19 .603
Total 14.667 20
The independent variable is 7. Number of cars owned (Experience).

174
B.3.2.12. Importance of Design for car owners
Model Summary
R R Square Adjusted R
Square
Std. Error of the
Estimate
.476 .226 .186 .924
The independent variable is 7. Number of cars owned
(Experience).
ANOVA
Sum of Squares df Mean Square F Sig.
Regression 4.745 1 4.745 5.563 .029
Residual 16.207 19 .853
Total 20.952 20
The independent variable is 7. Number of cars owned (Experience).

175
B.3.2.13. Importance of Fuel Efficiency for car owners
Model Summary
R R Square Adjusted R
Square
Std. Error of the
Estimate
.377 .142 .097 .730
The independent variable is 7. Number of cars owned
(Experience).
ANOVA
Sum of Squares df Mean Square F Sig.
Regression 1.675 1 1.675 3.140 .092
Residual 10.134 19 .533
Total 11.810 20
The independent variable is 7. Number of cars owned (Experience).

176
B.3.2.14. Importance of Quality for car owners
Model Summary
R R Square Adjusted R
Square
Std. Error of the
Estimate
.292 .085 .037 .395
The independent variable is 7. Number of cars owned
(Experience).
ANOVA
Sum of Squares df Mean Square F Sig.
Regression .276 1 .276 1.771 .199
Residual 2.962 19 .156
Total 3.238 20
The independent variable is 7. Number of cars owned (Experience).
B.3.2.15. Importance of Technology for car owners
Model Summary
R R Square Adjusted R
Square
Std. Error of the
Estimate
.195 .038 -.013 1.021
The independent variable is 7. Number of cars owned
(Experience).
ANOVA
Sum of Squares df Mean Square F Sig.
Regression .782 1 .782 .751 .397

177
Residual 19.790 19 1.042
Total 20.571 20
The independent variable is 7. Number of cars owned (Experience).
B.3.2.16. Importance of Affordability for car owners
Model Summary
R R Square Adjusted R
Square
Std. Error of the
Estimate
.052 .003 -.050 1.358
The independent variable is 7. Number of cars owned
(Experience).
ANOVA
Sum of Squares df Mean Square F Sig.
Regression .095 1 .095 .051 .823
Residual 35.048 19 1.845
Total 35.143 20
The independent variable is 7. Number of cars owned (Experience).
B.3.2.17. Importance of Comfort for car owners
Model Summary
R R Square Adjusted R
Square
Std. Error of the
Estimate
.602 .362 .328 .819
The independent variable is 7. Number of cars owned
(Experience).
ANOVA
Sum of Squares df Mean Square F Sig.
Regression 7.241 1 7.241 10.784 .004
Residual 12.759 19 .672
Total 20.000 20
The independent variable is 7. Number of cars owned (Experience).

178
B.3.2.18. Importance of Chinese Brand for car owners
Model Summary
R R Square Adjusted R
Square
Std. Error of the
Estimate
.071 .005 -.047 1.194
The independent variable is 7. Number of cars owned
(Experience).
ANOVA
Sum of Squares df Mean Square F Sig.
Regression .138 1 .138 .097 .759
Residual 27.100 19 1.426
Total 27.238 20
The independent variable is 7. Number of cars owned (Experience).
Coefficients
Unstandardized Coefficients Standardized
Coefficients
t Sig.
B Std. Error Beta
7. Number of cars owned
(Experience) -.100 .321 -.071 -.311 .759
(Constant) 2.700 .765 3.529 .002
B.3.2.19. Importance of Safety for the next purchase by car owners
Model Summary

179
R R Square Adjusted R
Square
Std. Error of the
Estimate
.112 .012 -.040 .445
The independent variable is 7. Number of cars owned
(Experience).
ANOVA
Sum of Squares df Mean Square F Sig.
Regression .047 1 .047 .240 .630
Residual 3.762 19 .198
Total 3.810 20
The independent variable is 7. Number of cars owned (Experience).
B.3.2.20. Importance of Brand Image for the next purchase by car owners
Model Summary
R R Square Adjusted R
Square
Std. Error of the
Estimate
.559 .312 .276 .790
The independent variable is 7. Number of cars owned
(Experience).
ANOVA
Sum of Squares df Mean Square F Sig.
Regression 5.379 1 5.379 8.619 .008
Residual 11.859 19 .624
Total 17.238 20
The independent variable is 7. Number of cars owned (Experience).

180
B.3.2.21. Importance of Design for the next purchase by car owners
Model Summary
R R Square Adjusted R
Square
Std. Error of the
Estimate
.414 .171 .127 .893
The independent variable is 7. Number of cars owned
(Experience).
ANOVA
Sum of Squares df Mean Square F Sig.
Regression 3.127 1 3.127 3.920 .062
Residual 15.159 19 .798
Total 18.286 20
The independent variable is 7. Number of cars owned (Experience).

181
B.3.2.22. Importance of Fuel Efficiency for the next purchase by car owners
Model Summary
R R Square Adjusted R
Square
Std. Error of the
Estimate
.245 .060 .010 .746
The independent variable is 7. Number of cars owned
(Experience).
ANOVA
Sum of Squares df Mean Square F Sig.
Regression .673 1 .673 1.209 .285
Residual 10.566 19 .556
Total 11.238 20
The independent variable is 7. Number of cars owned (Experience).
B.3.2.23. Importance of Quality for the next purchase by car owners
Model Summary
R R Square Adjusted R
Square
Std. Error of the
Estimate
.050 .003 -.050 .815
The independent variable is 7. Number of cars owned
(Experience).
ANOVA
Sum of Squares df Mean Square F Sig.

182
Regression .032 1 .032 .048 .828
Residual 12.634 19 .665
Total 12.667 20
The independent variable is 7. Number of cars owned (Experience).
B.3.2.24. Importance of Technology for the next purchase by car owners
Model Summary
R R Square Adjusted R
Square
Std. Error of the
Estimate
.070 .005 -.048 .717
The independent variable is 7. Number of cars owned
(Experience).
ANOVA
Sum of Squares df Mean Square F Sig.
Regression .047 1 .047 .092 .764
Residual 9.762 19 .514
Total 9.810 20
The independent variable is 7. Number of cars owned (Experience).
B.3.2.25. Importance of Affordability for the next purchase by car owners
Model Summary
R R Square Adjusted R
Square
Std. Error of the
Estimate
.352 .124 .078 1.220
The independent variable is 7. Number of cars owned
(Experience).
ANOVA
Sum of Squares df Mean Square F Sig.
Regression 3.996 1 3.996 2.684 .118
Residual 28.290 19 1.489
Total 32.286 20
The independent variable is 7. Number of cars owned (Experience).
B.3.2.26. Importance of Comfort for the next purchase by car owners
Model Summary
R R Square Adjusted R
Square
Std. Error of the
Estimate
.137 .019 -.033 .742
The independent variable is 7. Number of cars owned
(Experience).
ANOVA

183
Sum of Squares df Mean Square F Sig.
Regression .201 1 .201 .365 .553
Residual 10.466 19 .551
Total 10.667 20
The independent variable is 7. Number of cars owned (Experience).
B.3.2.27. Importance of Chinese Brand for the next purchase by car owners
Model Summary
R R Square Adjusted R
Square
Std. Error of the
Estimate
.124 .015 -.036 1.243
The independent variable is 7. Number of cars owned
(Experience).
ANOVA
Sum of Squares df Mean Square F Sig.
Regression .461 1 .461 .299 .591
Residual 29.348 19 1.545
Total 29.810 20
The independent variable is 7. Number of cars owned (Experience).
B.3.2.28. Importance of Safety for non-car owners for their next purchase
Model Summary
R R Square Adjusted R
Square
Std. Error of the
Estimate
.048 .002 -.050 .367
The independent variable is 7. Number of cars owned
(Experience).
ANOVA
Sum of Squares df Mean Square F Sig.
Regression .006 1 .006 .044 .836
Residual 2.566 19 .135
Total 2.571 20
The independent variable is 7. Number of cars owned (Experience).
B.3.2.29. Importance of Brand Image for non-car owners for their next purchase
Model Summary
R R Square Adjusted R
Square
Std. Error of the
Estimate
.533 .284 .246 .864
The independent variable is 7. Number of cars owned
(Experience).

184
ANOVA
Sum of Squares df Mean Square F Sig.
Regression 5.620 1 5.620 7.525 .013
Residual 14.190 19 .747
Total 19.810 20
The independent variable is 7. Number of cars owned (Experience).
B.3.2.30. Importance of Design for non-car owners for their next purchase
Model Summary
R R Square Adjusted R
Square
Std. Error of the
Estimate
.345 .119 .072 .713
The independent variable is 7. Number of cars owned
(Experience).
ANOVA
Sum of Squares df Mean Square F Sig.
Regression 1.301 1 1.301 2.560 .126
Residual 9.652 19 .508
Total 10.952 20
The independent variable is 7. Number of cars owned (Experience).
B.3.2.31. Importance of Fuel Efficiency for non-car owners for their next purchase
Model Summary
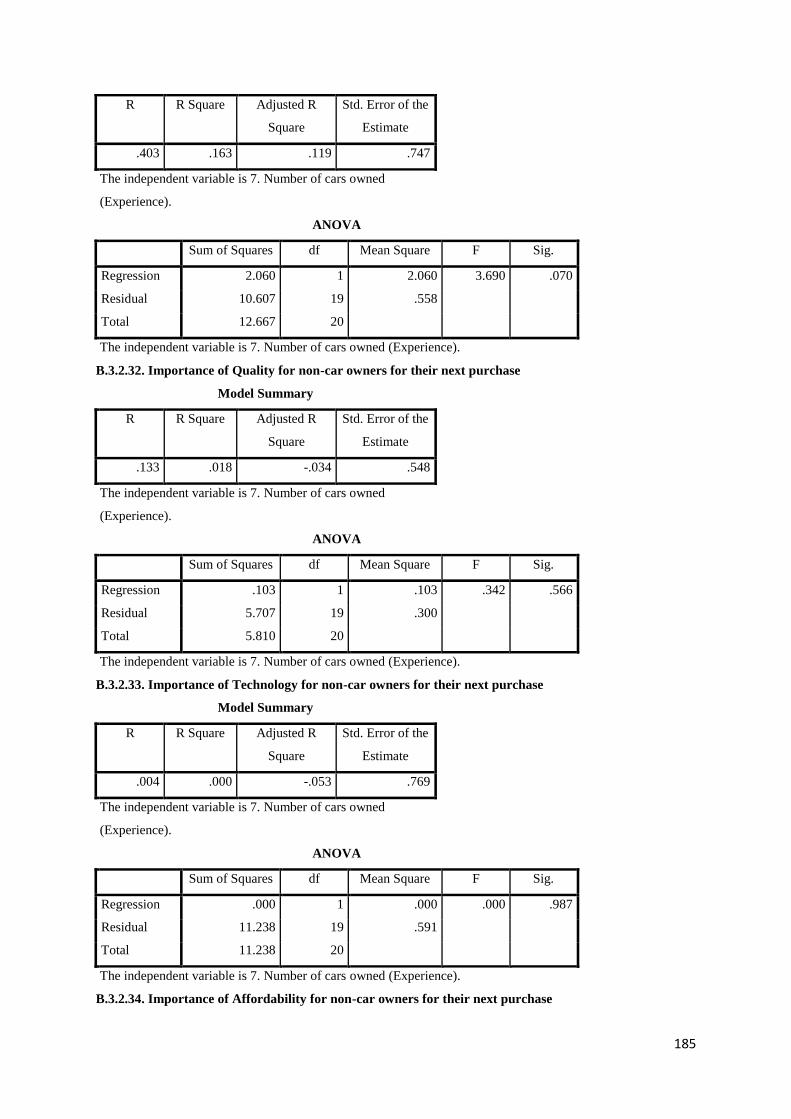
185
R R Square Adjusted R
Square
Std. Error of the
Estimate
.403 .163 .119 .747
The independent variable is 7. Number of cars owned
(Experience).
ANOVA
Sum of Squares df Mean Square F Sig.
Regression 2.060 1 2.060 3.690 .070
Residual 10.607 19 .558
Total 12.667 20
The independent variable is 7. Number of cars owned (Experience).
B.3.2.32. Importance of Quality for non-car owners for their next purchase
Model Summary
R R Square Adjusted R
Square
Std. Error of the
Estimate
.133 .018 -.034 .548
The independent variable is 7. Number of cars owned
(Experience).
ANOVA
Sum of Squares df Mean Square F Sig.
Regression .103 1 .103 .342 .566
Residual 5.707 19 .300
Total 5.810 20
The independent variable is 7. Number of cars owned (Experience).
B.3.2.33. Importance of Technology for non-car owners for their next purchase
Model Summary
R R Square Adjusted R
Square
Std. Error of the
Estimate
.004 .000 -.053 .769
The independent variable is 7. Number of cars owned
(Experience).
ANOVA
Sum of Squares df Mean Square F Sig.
Regression .000 1 .000 .000 .987
Residual 11.238 19 .591
Total 11.238 20
The independent variable is 7. Number of cars owned (Experience).
B.3.2.34. Importance of Affordability for non-car owners for their next purchase

186
Model Summary
R R Square Adjusted R
Square
Std. Error of the
Estimate
.207 .043 -.008 1.226
The independent variable is 7. Number of cars owned
(Experience).
ANOVA
Sum of Squares df Mean Square F Sig.
Regression 1.272 1 1.272 .847 .369
Residual 28.538 19 1.502
Total 29.810 20
The independent variable is 7. Number of cars owned (Experience).
B.3.2.35. Importance of Comfort for non-car owners for their next purchase
Model Summary
R R Square Adjusted R
Square
Std. Error of the
Estimate
.126 .016 -.036 1.063
The independent variable is 7. Number of cars owned
(Experience).
ANOVA
Sum of Squares df Mean Square F Sig.
Regression .347 1 .347 .308 .586
Residual 21.462 19 1.130
Total 21.810 20
The independent variable is 7. Number of cars owned (Experience).
B.3.2.36. Importance of Chinese Car for non-car owners for their next purchase
Model Summary
R R Square Adjusted R
Square
Std. Error of the
Estimate
.305 .093 .045 1.066
The independent variable is 7. Number of cars owned
(Experience).
ANOVA
Sum of Squares df Mean Square F Sig.
Regression 2.210 1 2.210 1.944 .179
Residual 21.600 19 1.137
Total 23.810 20
The independent variable is 7. Number of cars owned (Experience).

187
B.3.3. Psychographics with frequency of use
B.3.3.1. Perception of Global Importance of Safety
Model Summary
R R Square Adjusted R
Square
Std. Error of the
Estimate
.187 .035 -.016 .582
The independent variable is 8.1.1 Frequency of Use.
ANOVA
Sum of Squares df Mean Square F Sig.
Regression .233 1 .233 .689 .417
Residual 6.433 19 .339
Total 6.667 20
The independent variable is 8.1.1 Frequency of Use.
B.3.3.2. Perception of Global Importance of Brand image
Model Summary
R R Square Adjusted R
Square
Std. Error of the
Estimate
.030 .001 -.052 1.050
The independent variable is 8.1.1 Frequency of Use.
ANOVA
Sum of Squares df Mean Square F Sig.
Regression .019 1 .019 .017 .897
Residual 20.933 19 1.102
Total 20.952 20
The independent variable is 8.1.1 Frequency of Use.
B.3.3.3. Perception of Global Importance of Design
Model Summary
R R Square Adjusted R
Square
Std. Error of the
Estimate
.032 .001 -.052 .981
The independent variable is 8.1.1 Frequency of Use.
ANOVA
Sum of Squares df Mean Square F Sig.
Regression .019 1 .019 .020 .890
Residual 18.267 19 .961
Total 18.286 20
The independent variable is 8.1.1 Frequency of Use.

188
B.3.3.4. Perception of Global Importance of Fuel efficiency
Model Summary
R R Square Adjusted R
Square
Std. Error of the
Estimate
.139 .019 -.032 .787
The independent variable is 8.1.1 Frequency of Use.
ANOVA
Sum of Squares df Mean Square F Sig.
Regression .233 1 .233 .377 .547
Residual 11.767 19 .619
Total 12.000 20
The independent variable is 8.1.1 Frequency of Use.
B.3.3.5. Perception of Global Importance of Quality
Model Summary
R R Square Adjusted R
Square
Std. Error of the
Estimate
.000 .000 -.053 .749
The independent variable is 8.1.1 Frequency of Use.
ANOVA
Sum of Squares df Mean Square F Sig.
Regression .000 1 .000 .000 1.000
Residual 10.667 19 .561
Total 10.667 20
The independent variable is 8.1.1 Frequency of Use.
B.3.3.6. Perception of Global Importance of Technology
Model Summary
R R Square Adjusted R
Square
Std. Error of the
Estimate
.089 .008 -.044 .884
The independent variable is 8.1.1 Frequency of Use.
ANOVA
Sum of Squares df Mean Square F Sig.
Regression .119 1 .119 .152 .701
Residual 14.833 19 .781
Total 14.952 20
The independent variable is 8.1.1 Frequency of Use.
B.3.3.7. Perception of Global Importance of Affordability
Model Summary

189
R R Square Adjusted R
Square
Std. Error of the
Estimate
.475 .225 .184 1.087
The independent variable is 8.1.1 Frequency of Use.
ANOVA
Sum of Squares df Mean Square F Sig.
Regression 6.519 1 6.519 5.521 .030
Residual 22.433 19 1.181
Total 28.952 20
The independent variable is 8.1.1 Frequency of Use.
B.3.3.8. Perception of Global Importance of Comfort
Model Summary
R R Square Adjusted R
Square
Std. Error of the
Estimate
.121 .015 -.037 .911
The independent variable is 8.1.1 Frequency of Use.
ANOVA
Sum of Squares df Mean Square F Sig.
Regression .233 1 .233 .281 .602
Residual 15.767 19 .830
Total 16.000 20
The independent variable is 8.1.1 Frequency of Use.
B.3.3.9. Perception of Global Importance of Chinese Brand

190
Model Summary
R R Square Adjusted R
Square
Std. Error of the
Estimate
.027 .001 -.052 1.191
The independent variable is 8.1.1 Frequency of Use.
ANOVA
Sum of Squares df Mean Square F Sig.
Regression .019 1 .019 .013 .909
Residual 26.933 19 1.418
Total 26.952 20
The independent variable is 8.1.1 Frequency of Use.
B.3.3.10. Importance of Safety for car owners
Model Summary
R R Square Adjusted R
Square
Std. Error of the
Estimate
.038 .001 -.051 .413
The independent variable is 8.1.1 Frequency of Use.
ANOVA
Sum of Squares df Mean Square F Sig.
Regression .005 1 .005 .028 .869
Residual 3.233 19 .170
Total 3.238 20
The independent variable is 8.1.1 Frequency of Use.
B.3.3.11. Importance of Brand image for car owners
Model Summary
R R Square Adjusted R
Square
Std. Error of the
Estimate
.126 .016 -.036 .872
The independent variable is 8.1.1 Frequency of Use.
ANOVA
Sum of Squares df Mean Square F Sig.
Regression .233 1 .233 .307 .586
Residual 14.433 19 .760
Total 14.667 20
The independent variable is 8.1.1 Frequency of Use.
B.3.3.12. Importance of Design for car owners
Model Summary

191
R R Square Adjusted R
Square
Std. Error of the
Estimate
.030 .001 -.052 1.050
The independent variable is 8.1.1 Frequency of Use.
ANOVA
Sum of Squares df Mean Square F Sig.
Regression .019 1 .019 .017 .897
Residual 20.933 19 1.102
Total 20.952 20
The independent variable is 8.1.1 Frequency of Use.
B.3.3.13. Importance of Fuel Efficiency for car owners
Model Summary
R R Square Adjusted R
Square
Std. Error of the
Estimate
.201 .040 -.010 .772
The independent variable is 8.1.1 Frequency of Use.
ANOVA
Sum of Squares df Mean Square F Sig.
Regression .476 1 .476 .798 .383
Residual 11.333 19 .596
Total 11.810 20
The independent variable is 8.1.1 Frequency of Use.
B.3.3.14. Importance of Quality for car owners
Model Summary
R R Square Adjusted R
Square
Std. Error of the
Estimate
.499 .249 .209 .358
The independent variable is 8.1.1 Frequency of Use.
ANOVA
Sum of Squares df Mean Square F Sig.
Regression .805 1 .805 6.284 .021
Residual 2.433 19 .128
Total 3.238 20
The independent variable is 8.1.1 Frequency of Use.

192
B.3.3.15. Importance of Technology for car owners
Model Summary
R R Square Adjusted R
Square
Std. Error of the
Estimate
.228 .052 .002 1.013
The independent variable is 8.1.1 Frequency of Use.
ANOVA
Sum of Squares df Mean Square F Sig.
Regression 1.071 1 1.071 1.044 .320
Residual 19.500 19 1.026
Total 20.571 20
The independent variable is 8.1.1 Frequency of Use.
B.3.3.16. Importance of Affordability for car owners
Model Summary
R R Square Adjusted R
Square
Std. Error of the
Estimate
.372 .139 .093 1.262
The independent variable is 8.1.1 Frequency of Use.
ANOVA
Sum of Squares df Mean Square F Sig.
Regression 4.876 1 4.876 3.061 .096
Residual 30.267 19 1.593

193
Total 35.143 20
The independent variable is 8.1.1 Frequency of Use.
B.3.3.17. Importance of Comfort for car owners
Model Summary
R R Square Adjusted R
Square
Std. Error of the
Estimate
.108 .012 -.040 1.020
The independent variable is 8.1.1 Frequency of Use.
ANOVA
Sum of Squares df Mean Square F Sig.
Regression .233 1 .233 .224 .641
Residual 19.767 19 1.040
Total 20.000 20
The independent variable is 8.1.1 Frequency of Use.
B.3.3.18. Importance of Chinese Brand for car owners
Model Summary
R R Square Adjusted R
Square
Std. Error of the
Estimate
.383 .147 .102 1.106
The independent variable is 8.1.1 Frequency of Use.
ANOVA
Sum of Squares df Mean Square F Sig.
Regression 4.005 1 4.005 3.275 .086

194
Residual 23.233 19 1.223
Total 27.238 20
The independent variable is 8.1.1 Frequency of Use.
B.3.3.19. Importance of Safety for the next purchase by car owners
Model Summary
R R Square Adjusted R
Square
Std. Error of the
Estimate
.106 .011 -.041 .445
The independent variable is 8.1.1 Frequency of Use.
ANOVA
Sum of Squares df Mean Square F Sig.
Regression .043 1 .043 .216 .647
Residual 3.767 19 .198
Total 3.810 20
The independent variable is 8.1.1 Frequency of Use.
B.3.3.20. Importance of Brand Image for the next purchase by car owners
Model Summary
R R Square Adjusted R
Square
Std. Error of the
Estimate
.100 .010 -.042 .948
The independent variable is 8.1.1 Frequency of Use.
ANOVA

195
Sum of Squares df Mean Square F Sig.
Regression .171 1 .171 .191 .667
Residual 17.067 19 .898
Total 17.238 20
The independent variable is 8.1.1 Frequency of Use.
B.3.3.21. Importance of Design for the next purchase by car owners
Model Summary
R R Square Adjusted R
Square
Std. Error of the
Estimate
.145 .021 -.030 .971
The independent variable is 8.1.1 Frequency of Use.
ANOVA
Sum of Squares df Mean Square F Sig.
Regression .386 1 .386 .409 .530
Residual 17.900 19 .942
Total 18.286 20
The independent variable is 8.1.1 Frequency of Use.
B.3.3.22. Importance of Fuel Efficiency for the next purchase by car owners
Model Summary
R R Square Adjusted R
Square
Std. Error of the
Estimate
.021 .000 -.052 .769
The independent variable is 8.1.1 Frequency of Use.
ANOVA
Sum of Squares df Mean Square F Sig.
Regression .005 1 .005 .008 .929
Residual 11.233 19 .591
Total 11.238 20
The independent variable is 8.1.1 Frequency of Use.
B.3.3.23. Importance of Quality for the next purchase by car owners
Model Summary
R R Square Adjusted R
Square
Std. Error of the
Estimate
.136 .018 -.033 .809
The independent variable is 8.1.1 Frequency of Use.
ANOVA
Sum of Squares df Mean Square F Sig.
Regression .233 1 .233 .357 .557

196
Residual 12.433 19 .654
Total 12.667 20
The independent variable is 8.1.1 Frequency of Use.
B.3.3.24. Importance of Technology for the next purchase by car owners
Model Summary
R R Square Adjusted R
Square
Std. Error of the
Estimate
.220 .049 -.002 .701
The independent variable is 8.1.1 Frequency of Use.
ANOVA
Sum of Squares df Mean Square F Sig.
Regression .476 1 .476 .969 .337
Residual 9.333 19 .491
Total 9.810 20
The independent variable is 8.1.1 Frequency of Use.
B.3.3.25. Importance of Affordability for the next purchase by car owners
Model Summary
R R Square Adjusted R
Square
Std. Error of the
Estimate
.534 .286 .248 1.102
The independent variable is 8.1.1 Frequency of Use.
ANOVA
Sum of Squares df Mean Square F Sig.
Regression 9.219 1 9.219 7.594 .013
Residual 23.067 19 1.214
Total 32.286 20
The independent variable is 8.1.1 Frequency of Use.

197
B.3.3.26. Importance of Comfort for the next purchase by car owners
Model Summary
R R Square Adjusted R
Square
Std. Error of the
Estimate
.000 .000 -.053 .749
The independent variable is 8.1.1 Frequency of Use.
ANOVA
Sum of Squares df Mean Square F Sig.
Regression .000 1 .000 .000 1.000
Residual 10.667 19 .561
Total 10.667 20
The independent variable is 8.1.1 Frequency of Use.
B.3.3.27. Importance of Chinese Brand for the next purchase by car owners
Model Summary
R R Square Adjusted R
Square
Std. Error of the
Estimate
.051 .003 -.050 1.251
The independent variable is 8.1.1 Frequency of Use.
ANOVA
Sum of Squares df Mean Square F Sig.
Regression .076 1 .076 .049 .828
Residual 29.733 19 1.565

198
Total 29.810 20
The independent variable is 8.1.1 Frequency of Use.
B.3.3.28. Importance of Safety for non car owners for their next purchase
Model Summary
R R Square Adjusted R
Square
Std. Error of the
Estimate
.043 .002 -.051 .368
The independent variable is 8.1.1 Frequency of Use.
ANOVA
Sum of Squares df Mean Square F Sig.
Regression .005 1 .005 .035 .853
Residual 2.567 19 .135
Total 2.571 20
The independent variable is 8.1.1 Frequency of Use.
B.3.3.29. Importance of Brand Image for non car owners for their next purchase
Model Summary
R R Square Adjusted R
Square
Std. Error of the
Estimate
.155 .024 -.027 1.009
The independent variable is 8.1.1 Frequency of Use.
ANOVA
Sum of Squares df Mean Square F Sig.
Regression .476 1 .476 .468 .502
Residual 19.333 19 1.018
Total 19.810 20
The independent variable is 8.1.1 Frequency of Use.
B.3.3.30. Importance of Design for non car owners for their next purchase
Model Summary
R R Square Adjusted R
Square
Std. Error of the
Estimate
.042 .002 -.051 .759
The independent variable is 8.1.1 Frequency of Use.
ANOVA
Sum of Squares df Mean Square F Sig.
Regression .019 1 .019 .033 .858
Residual 10.933 19 .575
Total 10.952 20
The independent variable is 8.1.1 Frequency of Use.

199
B.3.3.31. Importance of Fuel Efficiency for non car owners for their next purchase
Model Summary
R R Square Adjusted R
Square
Std. Error of the
Estimate
.136 .018 -.033 .809
The independent variable is 8.1.1 Frequency of Use.
ANOVA
Sum of Squares df Mean Square F Sig.
Regression .233 1 .233 .357 .557
Residual 12.433 19 .654
Total 12.667 20
The independent variable is 8.1.1 Frequency of Use.
B.3.3.32 Importance of Quality for non car owners for their next purchase
Model Summary
R R Square Adjusted R
Square
Std. Error of the
Estimate
.315 .099 .052 .525
The independent variable is 8.1.1 Frequency of Use.
ANOVA
Sum of Squares df Mean Square F Sig.
Regression .576 1 .576 2.092 .164
Residual 5.233 19 .275
Total 5.810 20
The independent variable is 8.1.1 Frequency of Use.
B.3.3.33. Importance of Technology for non car owners for their next purchase
Model Summary
R R Square Adjusted R
Square
Std. Error of the
Estimate
.165 .027 -.024 .759
The independent variable is 8.1.1 Frequency of Use.
ANOVA
Sum of Squares df Mean Square F Sig.
Regression .305 1 .305 .530 .476
Residual 10.933 19 .575
Total 11.238 20
The independent variable is 8.1.1 Frequency of Use.
B.3.3.34. Importance of Affordability for non car owners for their next purchase
Model Summary

200
R R Square Adjusted R
Square
Std. Error of the
Estimate
.404 .164 .120 1.146
The independent variable is 8.1.1 Frequency of Use.
ANOVA
Sum of Squares df Mean Square F Sig.
Regression 4.876 1 4.876 3.716 .069
Residual 24.933 19 1.312
Total 29.810 20
The independent variable is 8.1.1 Frequency of Use.
B.3.3.35. Importance of Comfort for non car owners for their next purchase
Model Summary
R R Square Adjusted R
Square
Std. Error of the
Estimate
.163 .026 -.025 1.057
The independent variable is 8.1.1 Frequency of Use.
ANOVA
Sum of Squares df Mean Square F Sig.
Regression .576 1 .576 .516 .481
Residual 21.233 19 1.118
Total 21.810 20
The independent variable is 8.1.1 Frequency of Use.

201
B.3.3.36. Importance of Chinese Car for non-car owners for their next purchase
Model Summary
R R Square Adjusted R
Square
Std. Error of the
Estimate
.057 .003 -.049 1.118
The independent variable is 8.1.1 Frequency of Use.
ANOVA
Sum of Squares df Mean Square F Sig.
Regression .076 1 .076 .061 .808
Residual 23.733 19 1.249
Total 23.810 20
The independent variable is 8.1.1 Frequency of Use.
B.3.4. Psychographics by non-car owners who plan to have a car in the future.
B.3.4.1. Perception of Global Importance of Safety
Model Summary
R R Square Adjusted R
Square
Std. Error of the
Estimate
.131 .017 -.041 .594
The independent variable is 8.2 Potential of demand for
people currently not owning a car.
ANOVA
Sum of Squares df Mean Square F Sig.
Regression .105 1 .105 .298 .592
Residual 6.000 17 .353
Total 6.105 18
The independent variable is 8.2 Potential of demand for people currently not owning a
car.
B.3.4.2. Perception of Global Importance of Brand image
Model Summary
R R Square Adjusted R
Square
Std. Error of the
Estimate
.084 .007 -.051 1.092
The independent variable is 8.2 Potential of demand for
people currently not owning a car.
ANOVA
Sum of Squares df Mean Square F Sig.
Regression .143 1 .143 .120 .733

202
Residual 20.278 17 1.193
Total 20.421 18
The independent variable is 8.2 Potential of demand for people currently not owning a
car.
B.3.4.3. Perception of Global Importance of Design
Model Summary
R R Square Adjusted R
Square
Std. Error of the
Estimate
.165 .027 -.030 1.018
The independent variable is 8.2 Potential of demand for
people currently not owning a car.
ANOVA
Sum of Squares df Mean Square F Sig.
Regression .494 1 .494 .477 .499
Residual 17.611 17 1.036
Total 18.105 18
The independent variable is 8.2 Potential of demand for people currently not owning a
car.
B.3.4.4. Perception of Global Importance of Fuel efficiency
Model Summary
R R Square Adjusted R
Square
Std. Error of the
Estimate
.294 .087 .033 .767
The independent variable is 8.2 Potential of demand for
people currently not owning a car.
ANOVA
Sum of Squares df Mean Square F Sig.
Regression .947 1 .947 1.611 .222
Residual 10.000 17 .588
Total 10.947 18
The independent variable is 8.2 Potential of demand for people currently not owning a
car.
B.3.4.5. Perception of Global Importance of Quality
Model Summary
R R Square Adjusted R
Square
Std. Error of the
Estimate
.117 .014 -.044 .778
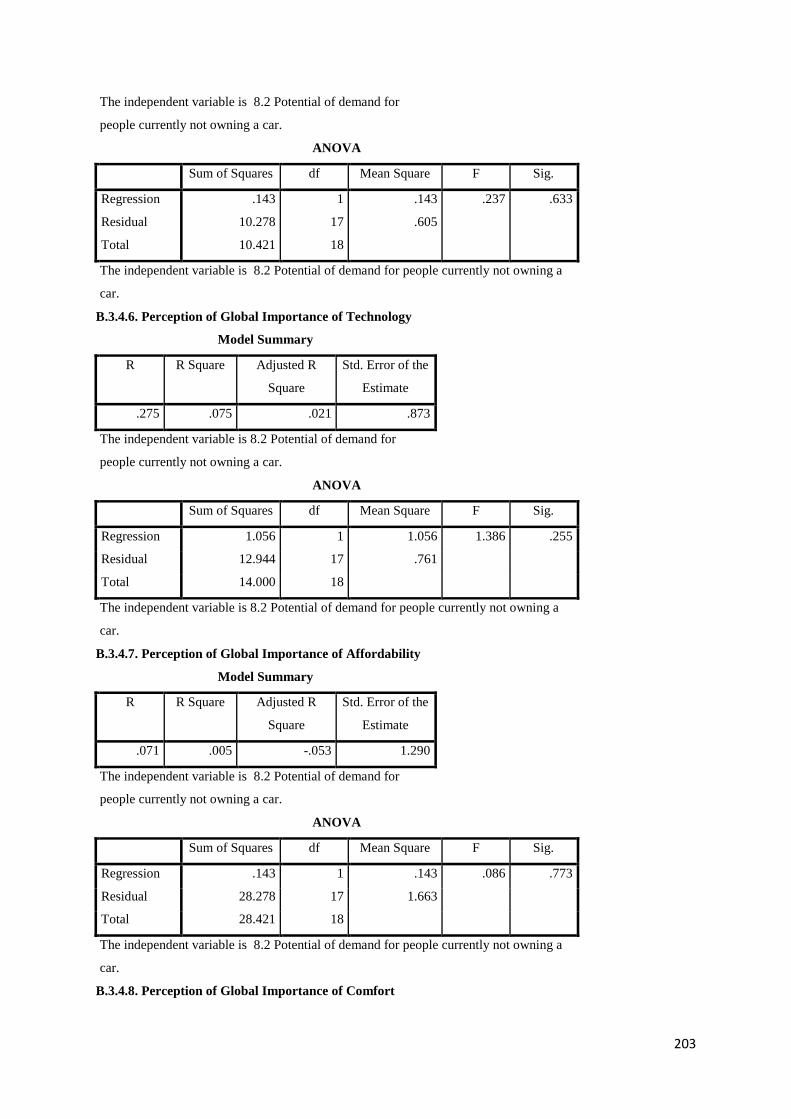
203
The independent variable is 8.2 Potential of demand for
people currently not owning a car.
ANOVA
Sum of Squares df Mean Square F Sig.
Regression .143 1 .143 .237 .633
Residual 10.278 17 .605
Total 10.421 18
The independent variable is 8.2 Potential of demand for people currently not owning a
car.
B.3.4.6. Perception of Global Importance of Technology
Model Summary
R R Square Adjusted R
Square
Std. Error of the
Estimate
.275 .075 .021 .873
The independent variable is 8.2 Potential of demand for
people currently not owning a car.
ANOVA
Sum of Squares df Mean Square F Sig.
Regression 1.056 1 1.056 1.386 .255
Residual 12.944 17 .761
Total 14.000 18
The independent variable is 8.2 Potential of demand for people currently not owning a
car.
B.3.4.7. Perception of Global Importance of Affordability
Model Summary
R R Square Adjusted R
Square
Std. Error of the
Estimate
.071 .005 -.053 1.290
The independent variable is 8.2 Potential of demand for
people currently not owning a car.
ANOVA
Sum of Squares df Mean Square F Sig.
Regression .143 1 .143 .086 .773
Residual 28.278 17 1.663
Total 28.421 18
The independent variable is 8.2 Potential of demand for people currently not owning a
car.
B.3.4.8. Perception of Global Importance of Comfort

204
Model Summary
R R Square Adjusted R
Square
Std. Error of the
Estimate
.252 .063 .008 .907
The independent variable is 8.2 Potential of demand for
people currently not owning a car.
ANOVA
Sum of Squares df Mean Square F Sig.
Regression .947 1 .947 1.150 .298
Residual 14.000 17 .824
Total 14.947 18
The independent variable is 8.2 Potential of demand for people currently not owning a
car.
B.3.4.9. Perception of Global Importance of Chinese Brand
Model Summary
R R Square Adjusted R
Square
Std. Error of the
Estimate
.267 .071 .016 1.138
The independent variable is 8.2 Potential of demand for
people currently not owning a car.
ANOVA
Sum of Squares df Mean Square F Sig.
Regression 1.684 1 1.684 1.301 .270
Residual 22.000 17 1.294
Total 23.684 18
The independent variable is 8.2 Potential of demand for people currently not owning a
car.
B.3.4.10. Importance of Safety for car owners
Model Summary
R R Square Adjusted R
Square
Std. Error of the
Estimate
.102 .010 -.048 .383
The independent variable is 8.2 Potential of demand for
people currently not owning a car.
ANOVA
Sum of Squares df Mean Square F Sig.
Regression .026 1 .026 .179 .678
Residual 2.500 17 .147

205
Total 2.526 18
The independent variable is 8.2 Potential of demand for people currently not owning a
car.
B.3.4.11. Importance of Brand image for car owners
Model Summary
R R Square Adjusted R
Square
Std. Error of the
Estimate
.086 .007 -.051 .907
The independent variable is 8.2 Potential of demand for
people currently not owning a car.
ANOVA
Sum of Squares df Mean Square F Sig.
Regression .105 1 .105 .128 .725
Residual 14.000 17 .824
Total 14.105 18
The independent variable is 8.2 Potential of demand for people currently not owning a
car.
B.3.4.12. Importance of Design for car owners
Model Summary
R R Square Adjusted R
Square
Std. Error of the
Estimate
.131 .017 -.041 1.092
The independent variable is 8.2 Potential of demand for
people currently not owning a car.
ANOVA
Sum of Squares df Mean Square F Sig.
Regression .354 1 .354 .297 .593
Residual 20.278 17 1.193
Total 20.632 18
The independent variable is 8.2 Potential of demand for people currently not owning a
car.
B.3.4.13. Importance of Fuel Efficiency for car owners
Model Summary
R R Square Adjusted R
Square
Std. Error of the
Estimate
.372 .139 .088 .752
The independent variable is 8.2 Potential of demand for
people currently not owning a car.

206
ANOVA
Sum of Squares df Mean Square F Sig.
Regression 1.547 1 1.547 2.736 .116
Residual 9.611 17 .565
Total 11.158 18
The independent variable is 8.2 Potential of demand for people currently not owning a
car.
B.3.4.14. Importance of Quality for car owners
Model Summary
R R Square Adjusted R
Square
Std. Error of the
Estimate
.122 .015 -.043 .428
The independent variable is 8.2 Potential of demand for
people currently not owning a car.
ANOVA
Sum of Squares df Mean Square F Sig.
Regression .047 1 .047 .256 .620
Residual 3.111 17 .183
Total 3.158 18
The independent variable is 8.2 Potential of demand for people currently not owning a
car.
B.3.4.15. Importance of Technology for car owners
Model Summary
R R Square Adjusted R
Square
Std. Error of the
Estimate
.207 .043 -.014 1.056
The independent variable is 8.2 Potential of demand for
people currently not owning a car.
ANOVA
Sum of Squares df Mean Square F Sig.
Regression .845 1 .845 .758 .396
Residual 18.944 17 1.114
Total 19.789 18
The independent variable is 8.2 Potential of demand for people currently not owning a
car.
B.3.4.16. Importance of Affordability for car owners
Model Summary

207
R R Square Adjusted R
Square
Std. Error of the
Estimate
.074 .005 -.053 1.423
The independent variable is 8.2 Potential of demand for
people currently not owning a car.
ANOVA
Sum of Squares df Mean Square F Sig.
Regression .187 1 .187 .092 .765
Residual 34.444 17 2.026
Total 34.632 18
The independent variable is 8.2 Potential of demand for people currently not owning a
car.
B.3.4.17. Importance of Comfort for car owners
Model Summary
R R Square Adjusted R
Square
Std. Error of the
Estimate
.224 .050 -.006 1.029
The independent variable is 8.2 Potential of demand for
people currently not owning a car.
ANOVA
Sum of Squares df Mean Square F Sig.
Regression .947 1 .947 .895 .357
Residual 18.000 17 1.059
Total 18.947 18
The independent variable is 8.2 Potential of demand for people currently not owning a
car.
B.3.4.18. Importance of Chinese Brand for car owners
Model Summary
R R Square Adjusted R
Square
Std. Error of the
Estimate
.131 .017 -.041 1.188
The independent variable is 8.2 Potential of demand for
people currently not owning a car.
ANOVA
Sum of Squares df Mean Square F Sig.
Regression .421 1 .421 .298 .592
Residual 24.000 17 1.412
Total 24.421 18

208
The independent variable is 8.2 Potential of demand for people currently not owning a
car.
B.3.4.19. Importance of Safety for the next purchase by car owners
Model Summary
R R Square Adjusted R
Square
Std. Error of the
Estimate
.122 .015 -.043 .428
The independent variable is 8.2 Potential of demand for
people currently not owning a car.
ANOVA
Sum of Squares df Mean Square F Sig.
Regression .047 1 .047 .256 .620
Residual 3.111 17 .183
Total 3.158 18
The independent variable is 8.2 Potential of demand for people currently not owning a
car.
B.3.4.20. Importance of Brand Image for the next purchase by car owners
Model Summary
R R Square Adjusted R
Square
Std. Error of the
Estimate
.132 .017 -.040 .984
The independent variable is 8.2 Potential of demand for
people currently not owning a car.
ANOVA
Sum of Squares df Mean Square F Sig.
Regression .292 1 .292 .302 .590
Residual 16.444 17 .967
Total 16.737 18
The independent variable is 8.2 Potential of demand for people currently not owning a
car.
B.3.4.21. Importance of Design for the next purchase by car owners
Model Summary
R R Square Adjusted R
Square
Std. Error of the
Estimate
.165 .027 -.030 1.018
The independent variable is 8.2 Potential of demand for
people currently not owning a car.
ANOVA
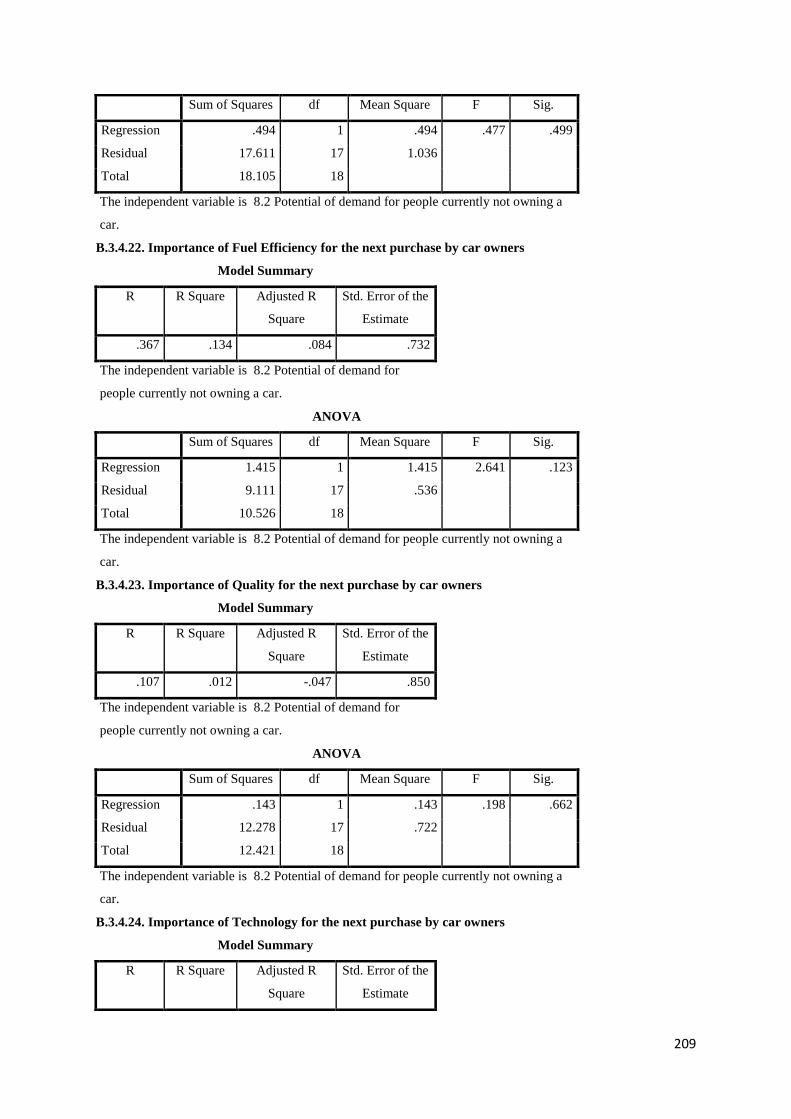
209
Sum of Squares df Mean Square F Sig.
Regression .494 1 .494 .477 .499
Residual 17.611 17 1.036
Total 18.105 18
The independent variable is 8.2 Potential of demand for people currently not owning a
car.
B.3.4.22. Importance of Fuel Efficiency for the next purchase by car owners
Model Summary
R R Square Adjusted R
Square
Std. Error of the
Estimate
.367 .134 .084 .732
The independent variable is 8.2 Potential of demand for
people currently not owning a car.
ANOVA
Sum of Squares df Mean Square F Sig.
Regression 1.415 1 1.415 2.641 .123
Residual 9.111 17 .536
Total 10.526 18
The independent variable is 8.2 Potential of demand for people currently not owning a
car.
B.3.4.23. Importance of Quality for the next purchase by car owners
Model Summary
R R Square Adjusted R
Square
Std. Error of the
Estimate
.107 .012 -.047 .850
The independent variable is 8.2 Potential of demand for
people currently not owning a car.
ANOVA
Sum of Squares df Mean Square F Sig.
Regression .143 1 .143 .198 .662
Residual 12.278 17 .722
Total 12.421 18
The independent variable is 8.2 Potential of demand for people currently not owning a
car.
B.3.4.24. Importance of Technology for the next purchase by car owners
Model Summary
R R Square Adjusted R
Square
Std. Error of the
Estimate

210
.475 .225 .180 .608
The independent variable is 8.2 Potential of demand for
people currently not owning a car.
ANOVA
Sum of Squares df Mean Square F Sig.
Regression 1.827 1 1.827 4.949 .040
Residual 6.278 17 .369
Total 8.105 18
The independent variable is 8.2 Potential of demand for people currently not owning a
car.
B.3.4.25. Importance of Affordability for the next purchase by car owners
Model Summary
R R Square Adjusted R
Square
Std. Error of the
Estimate
.134 .018 -.040 1.353
The independent variable is 8.2 Potential of demand for
people currently not owning a car.
ANOVA
Sum of Squares df Mean Square F Sig.
Regression .573 1 .573 .313 .583
Residual 31.111 17 1.830
Total 31.684 18

211
The independent variable is 8.2 Potential of demand for people currently not owning a
car.
B.3.4.26. Importance of Comfort for the next purchase by car owners
Model Summary
R R Square Adjusted R
Square
Std. Error of the
Estimate
.425 .181 .133 .698
The independent variable is 8.2 Potential of demand for
people currently not owning a car.
ANOVA
Sum of Squares df Mean Square F Sig.
Regression 1.827 1 1.827 3.753 .070
Residual 8.278 17 .487
Total 10.105 18
The independent variable is 8.2 Potential of demand for people currently not owning a
car.
B.3.4.27. Importance of Chinese Brand for the next purchase by car owners
Model Summary
R R Square Adjusted R
Square
Std. Error of the
Estimate
.030 .001 -.058 1.295

212
The independent variable is 8.2 Potential of demand for
people currently not owning a car.
ANOVA
Sum of Squares df Mean Square F Sig.
Regression .026 1 .026 .016 .902
Residual 28.500 17 1.676
Total 28.526 18
The independent variable is 8.2 Potential of demand for people currently not owning a
car.
B.3.4.28. Importance of Safety for non car owners for their next purchase
Model Summary
R R Square Adjusted R
Square
Std. Error of the
Estimate
.081 .007 -.052 .323
The independent variable is 8.2 Potential of demand for
people currently not owning a car.
ANOVA
Sum of Squares df Mean Square F Sig.
Regression .012 1 .012 .112 .742
Residual 1.778 17 .105
Total 1.789 18
The independent variable is 8.2 Potential of demand for people currently not owning a
car.
B.3.4.29 Importance of Brand Image for non-car owners for their next purchase
Model Summary
R R Square Adjusted R
Square
Std. Error of the
Estimate
.185 .034 -.022 1.043
The independent variable is 8.2 Potential of demand for
people currently not owning a car.
ANOVA
Sum of Squares df Mean Square F Sig.
Regression .658 1 .658 .605 .448
Residual 18.500 17 1.088
Total 19.158 18
The independent variable is 8.2 Potential of demand for people currently not owning a
car.
B.3.4.30. Importance of Design for non-car owners for their next purchase

213
Model Summary
R R Square Adjusted R
Square
Std. Error of the
Estimate
.327 .107 .054 .758
The independent variable is 8.2 Potential of demand for
people currently not owning a car.
ANOVA
Sum of Squares df Mean Square F Sig.
Regression 1.170 1 1.170 2.033 .172
Residual 9.778 17 .575
Total 10.947 18
The independent variable is 8.2 Potential of demand for people currently not owning a
car.
B.3.4.31. Importance of Fuel Efficiency for non-car owners for their next purchase
Model Summary
R R Square Adjusted R
Square
Std. Error of the
Estimate
.389 .151 .101 .778
The independent variable is 8.2 Potential of demand for
people currently not owning a car.
ANOVA
Sum of Squares df Mean Square F Sig.
Regression 1.827 1 1.827 3.023 .100
Residual 10.278 17 .605
Total 12.105 18
The independent variable is 8.2 Potential of demand for people currently not owning a
car.

214
B.3.4.32. Importance of Quality for non-car owners for their next purchase
Model Summary
R R Square Adjusted R
Square
Std. Error of the
Estimate
.113 .013 -.045 .575
The independent variable is 8.2 Potential of demand for
people currently not owning a car.
ANOVA
Sum of Squares df Mean Square F Sig.
Regression .073 1 .073 .221 .644
Residual 5.611 17 .330
Total 5.684 18
The independent variable is 8.2 Potential of demand for people currently not owning a
car.
B.3.4.33. Importance of Technology for non-car owners for their next purchase
Model Summary
R R Square Adjusted R
Square
Std. Error of the
Estimate
.417 .174 .125 .686
The independent variable is 8.2 Potential of demand for
people currently not owning a car.
ANOVA

215
Sum of Squares df Mean Square F Sig.
Regression 1.684 1 1.684 3.579 .076
Residual 8.000 17 .471
Total 9.684 18
The independent variable is 8.2 Potential of demand for people currently not owning a
car.
B.3.4.34. Importance of Affordability for non-car owners for their next purchase
Model Summary
R R Square Adjusted R
Square
Std. Error of the
Estimate
.150 .023 -.035 1.295
The independent variable is 8.2 Potential of demand for
people currently not owning a car.
ANOVA
Sum of Squares df Mean Square F Sig.
Regression .658 1 .658 .392 .539
Residual 28.500 17 1.676
Total 29.158 18
The independent variable is 8.2 Potential of demand for people currently not owning a
car.
B.3.4.35. Importance of Comfort for non-car owners for their next purchase
Model Summary
R R Square Adjusted R
Square
Std. Error of the
Estimate
.270 .073 .019 1.074
The independent variable is 8.2 Potential of demand for
people currently not owning a car.
ANOVA
Sum of Squares df Mean Square F Sig.
Regression 1.547 1 1.547 1.341 .263
Residual 19.611 17 1.154
Total 21.158 18
The independent variable is 8.2 Potential of demand for people currently not owning a
car.
B.3.4.36. Importance of Chinese Car for non-car owners for their next purchase
Model Summary
R R Square Adjusted R
Square
Std. Error of the
Estimate

216
.034 .001 -.058 1.150
The independent variable is 8.2 Potential of demand for
people currently not owning a car.
ANOVA
Sum of Squares df Mean Square F Sig.
Regression .026 1 .026 .020 .890
Residual 22.500 17 1.324
Total 22.526 18
The independent variable is 8.2 Potential of demand for people currently not owning a
car.
B.3.5. psychographics by style of use; long trips
B.3.5.1. Perception of Global Importance of Safety
Model Summary
R R Square Adjusted R
Square
Std. Error of the
Estimate
.187 .035 -.016 .582
The independent variable is 8.1.2 Style of use: Long trips.
ANOVA
Sum of Squares df Mean Square F Sig.
Regression .233 1 .233 .689 .417
Residual 6.433 19 .339
Total 6.667 20
The independent variable is 8.1.2 Style of use: Long trips.
B.3.5.2. Perception of Global Importance of Brand image
Model Summary
R R Square Adjusted R
Square
Std. Error of the
Estimate
.347 .120 .074 .985
The independent variable is 8.1.2 Style of use: Long trips.
ANOVA
Sum of Squares df Mean Square F Sig.
Regression 2.519 1 2.519 2.596 .124
Residual 18.433 19 .970
Total 20.952 20
The independent variable is 8.1.2 Style of use: Long trips.
B.3.5.3. Perception of Global Importance of Design
Model Summary
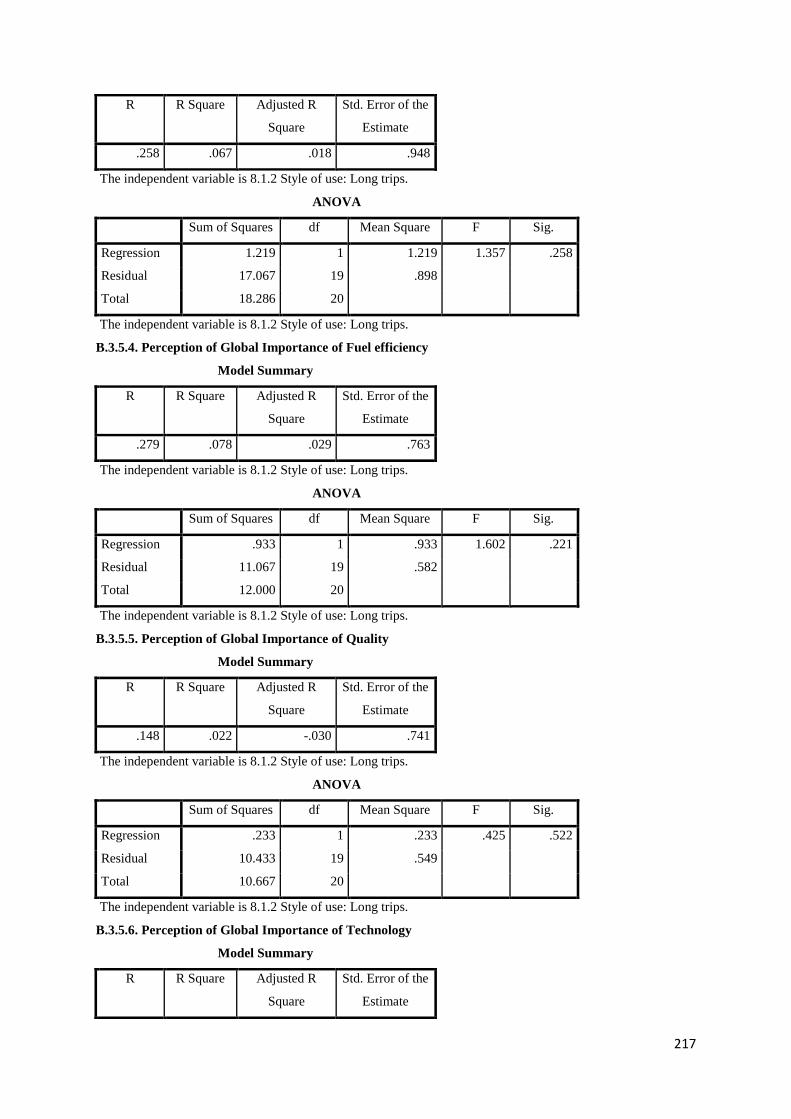
217
R R Square Adjusted R
Square
Std. Error of the
Estimate
.258 .067 .018 .948
The independent variable is 8.1.2 Style of use: Long trips.
ANOVA
Sum of Squares df Mean Square F Sig.
Regression 1.219 1 1.219 1.357 .258
Residual 17.067 19 .898
Total 18.286 20
The independent variable is 8.1.2 Style of use: Long trips.
B.3.5.4. Perception of Global Importance of Fuel efficiency
Model Summary
R R Square Adjusted R
Square
Std. Error of the
Estimate
.279 .078 .029 .763
The independent variable is 8.1.2 Style of use: Long trips.
ANOVA
Sum of Squares df Mean Square F Sig.
Regression .933 1 .933 1.602 .221
Residual 11.067 19 .582
Total 12.000 20
The independent variable is 8.1.2 Style of use: Long trips.
B.3.5.5. Perception of Global Importance of Quality
Model Summary
R R Square Adjusted R
Square
Std. Error of the
Estimate
.148 .022 -.030 .741
The independent variable is 8.1.2 Style of use: Long trips.
ANOVA
Sum of Squares df Mean Square F Sig.
Regression .233 1 .233 .425 .522
Residual 10.433 19 .549
Total 10.667 20
The independent variable is 8.1.2 Style of use: Long trips.
B.3.5.6. Perception of Global Importance of Technology
Model Summary
R R Square Adjusted R
Square
Std. Error of the
Estimate

218
.089 .008 -.044 .884
The independent variable is 8.1.2 Style of use: Long trips.
ANOVA
Sum of Squares df Mean Square F Sig.
Regression .119 1 .119 .152 .701
Residual 14.833 19 .781
Total 14.952 20
The independent variable is 8.1.2 Style of use: Long trips.
B.3.5.7. Perception of Global Importance of Affordability
Model Summary
R R Square Adjusted R
Square
Std. Error of the
Estimate
.295 .087 .039 1.180
The independent variable is 8.1.2 Style of use: Long trips.
ANOVA
Sum of Squares df Mean Square F Sig.
Regression 2.519 1 2.519 1.811 .194
Residual 26.433 19 1.391
Total 28.952 20
The independent variable is 8.1.2 Style of use: Long trips.
B.3.5.8. Perception of Global Importance of Comfort
Model Summary
R R Square Adjusted R
Square
Std. Error of the
Estimate
.121 .015 -.037 .911
The independent variable is 8.1.2 Style of use: Long trips.
ANOVA
Sum of Squares df Mean Square F Sig.
Regression .233 1 .233 .281 .602
Residual 15.767 19 .830
Total 16.000 20
The independent variable is 8.1.2 Style of use: Long trips.
B.3.5.9. Perception of Global Importance of Chinese Brand
Model Summary
R R Square Adjusted R
Square
Std. Error of the
Estimate
.120 .014 -.038 1.182
The independent variable is 8.1.2 Style of use: Long trips.

219
ANOVA
Sum of Squares df Mean Square F Sig.
Regression .386 1 .386 .276 .606
Residual 26.567 19 1.398
Total 26.952 20
The independent variable is 8.1.2 Style of use: Long trips.
B.3.5.10. Importance of Safety for car owners
Model Summary
R R Square Adjusted R
Square
Std. Error of the
Estimate
.038 .001 -.051 .413
The independent variable is 8.1.2 Style of use: Long trips.
ANOVA
Sum of Squares df Mean Square F Sig.
Regression .005 1 .005 .028 .869
Residual 3.233 19 .170
Total 3.238 20
The independent variable is 8.1.2 Style of use: Long trips.
B.3.5.11. Importance of Brand image for car owners
Model Summary
R R Square Adjusted R
Square
Std. Error of the
Estimate
.252 .064 .014 .850
The independent variable is 8.1.2 Style of use: Long trips.
ANOVA
Sum of Squares df Mean Square F Sig.
Regression .933 1 .933 1.291 .270
Residual 13.733 19 .723
Total 14.667 20
The independent variable is 8.1.2 Style of use: Long trips.
B.3.5.12. Importance of Design for car owners
Model Summary
R R Square Adjusted R
Square
Std. Error of the
Estimate
.286 .082 .034 1.006
The independent variable is 8.1.2 Style of use: Long trips.
ANOVA
Sum of Squares df Mean Square F Sig.

220
Regression 1.719 1 1.719 1.698 .208
Residual 19.233 19 1.012
Total 20.952 20
The independent variable is 8.1.2 Style of use: Long trips.
B.3.5.13. Importance of Fuel Efficiency for car owners
Model Summary
R R Square Adjusted R
Square
Std. Error of the
Estimate
.060 .004 -.049 .787
The independent variable is 8.1.2 Style of use: Long trips.
ANOVA
Sum of Squares df Mean Square F Sig.
Regression .043 1 .043 .069 .795
Residual 11.767 19 .619
Total 11.810 20
The independent variable is 8.1.2 Style of use: Long trips.
B.3.5.14. Importance of Quality for car owners
Model Summary
R R Square Adjusted R
Square
Std. Error of the
Estimate
.230 .053 .003 .402
The independent variable is 8.1.2 Style of use: Long trips.
ANOVA
Sum of Squares df Mean Square F Sig.
Regression .171 1 .171 1.062 .316
Residual 3.067 19 .161
Total 3.238 20
The independent variable is 8.1.2 Style of use: Long trips.
B.3.5.15. Importance of Technology for car owners
Model Summary
R R Square Adjusted R
Square
Std. Error of the
Estimate
.548 .300 .263 .871
The independent variable is 8.1.2 Style of use: Long trips.
ANOVA
Sum of Squares df Mean Square F Sig.
Regression 6.171 1 6.171 8.143 .010
Residual 14.400 19 .758

221
Total 20.571 20
The independent variable is 8.1.2 Style of use: Long trips.
B.3.5.16. Importance of Affordability for car owners
Model Summary
R R Square Adjusted R
Square
Std. Error of the
Estimate
.535 .287 .249 1.149
The independent variable is 8.1.2 Style of use: Long trips.
ANOVA
Sum of Squares df Mean Square F Sig.
Regression 10.076 1 10.076 7.638 .012
Residual 25.067 19 1.319
Total 35.143 20
The independent variable is 8.1.2 Style of use: Long trips.
B.3.5.17. Importance of Comfort for car owners
Model Summary
R R Square Adjusted R
Square
Std. Error of the
Estimate
.324 .105 .058 .971
The independent variable is 8.1.2 Style of use: Long trips.
ANOVA
Sum of Squares df Mean Square F Sig.

222
Regression 2.100 1 2.100 2.229 .152
Residual 17.900 19 .942
Total 20.000 20
The independent variable is 8.1.2 Style of use: Long trips.
B.3.5.18. Importance of Chinese Brand for car owners
Model Summary
R R Square Adjusted R
Square
Std. Error of the
Estimate
.106 .011 -.041 1.191
The independent variable is 8.1.2 Style of use: Long trips.
ANOVA
Sum of Squares df Mean Square F Sig.
Regression .305 1 .305 .215 .648
Residual 26.933 19 1.418
Total 27.238 20
The independent variable is 8.1.2 Style of use: Long trips.
B.3.5.19. Importance of Safety for the next purchase by car owners
Model Summary
R R Square Adjusted R
Square
Std. Error of the
Estimate
.106 .011 -.041 .445
The independent variable is 8.1.2 Style of use: Long trips.
ANOVA
Sum of Squares df Mean Square F Sig.
Regression .043 1 .043 .216 .647
Residual 3.767 19 .198
Total 3.810 20
The independent variable is 8.1.2 Style of use: Long trips.
B.3.5.20. Importance of Brand Image for the next purchase by car owners
Model Summary
R R Square Adjusted R
Square
Std. Error of the
Estimate
.249 .062 .013 .922
The independent variable is 8.1.2 Style of use: Long trips.
ANOVA
Sum of Squares df Mean Square F Sig.
Regression 1.071 1 1.071 1.259 .276
Residual 16.167 19 .851

223
Total 17.238 20
The independent variable is 8.1.2 Style of use: Long trips.
B.3.5.21. Importance of Design for the next purchase by car owners
Model Summary
R R Square Adjusted R
Square
Std. Error of the
Estimate
.371 .138 .092 .911
The independent variable is 8.1.2 Style of use: Long trips.
ANOVA
Sum of Squares df Mean Square F Sig.
Regression 2.519 1 2.519 3.036 .098
Residual 15.767 19 .830
Total 18.286 20
The independent variable is 8.1.2 Style of use: Long trips.
B.3.5.22. Importance of Fuel Efficiency for the next purchase by car owners
Model Summary
R R Square Adjusted R
Square
Std. Error of the
Estimate
.124 .015 -.037 .763
The independent variable is 8.1.2 Style of use: Long trips.
ANOVA
Sum of Squares df Mean Square F Sig.
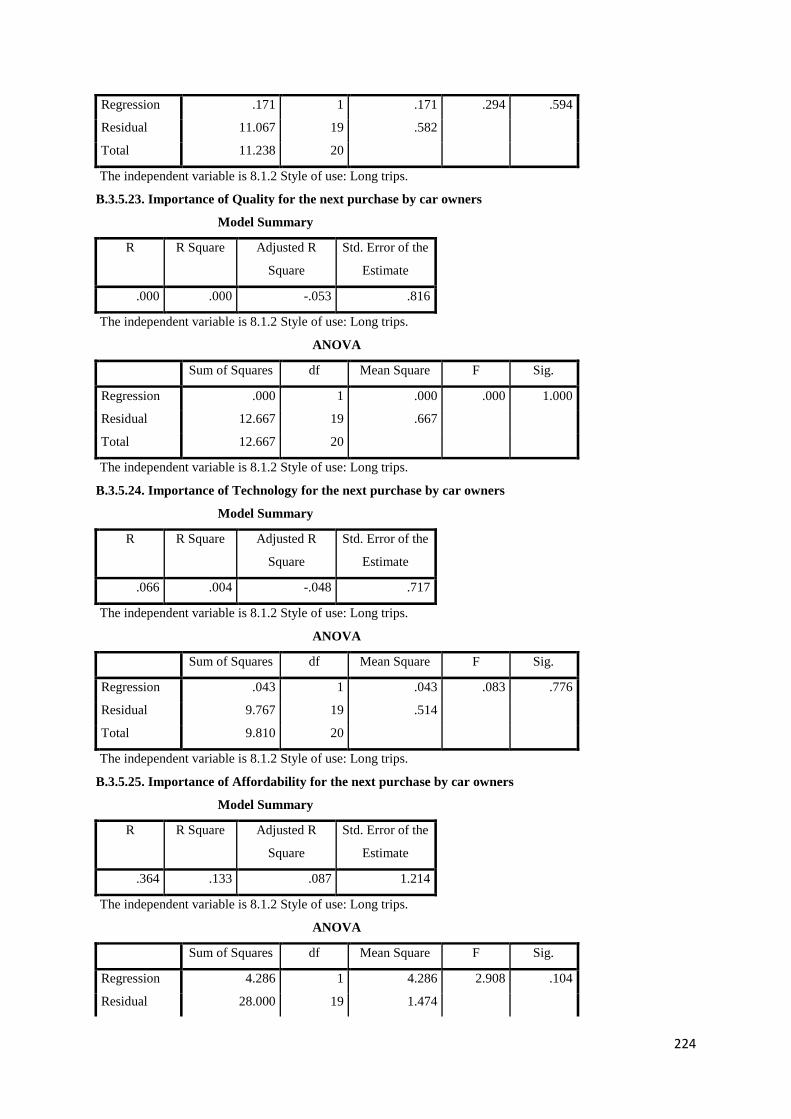
224
Regression .171 1 .171 .294 .594
Residual 11.067 19 .582
Total 11.238 20
The independent variable is 8.1.2 Style of use: Long trips.
B.3.5.23. Importance of Quality for the next purchase by car owners
Model Summary
R R Square Adjusted R
Square
Std. Error of the
Estimate
.000 .000 -.053 .816
The independent variable is 8.1.2 Style of use: Long trips.
ANOVA
Sum of Squares df Mean Square F Sig.
Regression .000 1 .000 .000 1.000
Residual 12.667 19 .667
Total 12.667 20
The independent variable is 8.1.2 Style of use: Long trips.
B.3.5.24. Importance of Technology for the next purchase by car owners
Model Summary
R R Square Adjusted R
Square
Std. Error of the
Estimate
.066 .004 -.048 .717
The independent variable is 8.1.2 Style of use: Long trips.
ANOVA
Sum of Squares df Mean Square F Sig.
Regression .043 1 .043 .083 .776
Residual 9.767 19 .514
Total 9.810 20
The independent variable is 8.1.2 Style of use: Long trips.
B.3.5.25. Importance of Affordability for the next purchase by car owners
Model Summary
R R Square Adjusted R
Square
Std. Error of the
Estimate
.364 .133 .087 1.214
The independent variable is 8.1.2 Style of use: Long trips.
ANOVA
Sum of Squares df Mean Square F Sig.
Regression 4.286 1 4.286 2.908 .104
Residual 28.000 19 1.474

225
Total 32.286 20
The independent variable is 8.1.2 Style of use: Long trips.
B.3.5.26. Importance of Comfort for the next purchase by car owners
Model Summary
R R Square Adjusted R
Square
Std. Error of the
Estimate
.000 .000 -.053 .749
The independent variable is 8.1.2 Style of use: Long trips.
ANOVA
Sum of Squares df Mean Square F Sig.
Regression .000 1 .000 .000 1.000
Residual 10.667 19 .561
Total 10.667 20
The independent variable is 8.1.2 Style of use: Long trips.
B.3.5.27. Importance of Chinese Brand for the next purchase by car owners
Model Summary
R R Square Adjusted R
Square
Std. Error of the
Estimate
.038 .001 -.051 1.252
The independent variable is 8.1.2 Style of use: Long trips.
ANOVA
Sum of Squares df Mean Square F Sig.
Regression .043 1 .043 .027 .870
Residual 29.767 19 1.567
Total 29.810 20
The independent variable is 8.1.2 Style of use: Long trips.
B.3.5.28. Importance of Safety for non car owners for their next purchase
Model Summary
R R Square Adjusted R
Square
Std. Error of the
Estimate
.043 .002 -.051 .368
The independent variable is 8.1.2 Style of use: Long trips.
ANOVA
Sum of Squares df Mean Square F Sig.
Regression .005 1 .005 .035 .853
Residual 2.567 19 .135
Total 2.571 20
The independent variable is 8.1.2 Style of use: Long trips.

226
B.3.5.29. Importance of Brand Image for non car owners for their next purchase
Model Summary
R R Square Adjusted R
Square
Std. Error of the
Estimate
.388 .150 .106 .941
The independent variable is 8.1.2 Style of use: Long trips.
ANOVA
Sum of Squares df Mean Square F Sig.
Regression 2.976 1 2.976 3.359 .083
Residual 16.833 19 .886
Total 19.810 20
The independent variable is 8.1.2 Style of use: Long trips.
B.3.5.30. Importance of Design for non-car owners for their next purchase
Model Summary
R R Square Adjusted R
Square
Std. Error of the
Estimate
.334 .111 .065 .716
The independent variable is 8.1.2 Style of use: Long trips.
ANOVA
Sum of Squares df Mean Square F Sig.
Regression 1.219 1 1.219 2.380 .139
Residual 9.733 19 .512

227
Total 10.952 20
The independent variable is 8.1.2 Style of use: Long trips.
B.3.5.31. Importance of Fuel Efficiency for non car owners for their next purchase
Model Summary
R R Square Adjusted R
Square
Std. Error of the
Estimate
.000 .000 -.053 .816
The independent variable is 8.1.2 Style of use: Long trips.
ANOVA
Sum of Squares df Mean Square F Sig.
Regression .000 1 .000 .000 1.000
Residual 12.667 19 .667
Total 12.667 20
The independent variable is 8.1.2 Style of use: Long trips.
B.3.5.32. Importance of Quality for non car owners for their next purchase
Model Summary
R R Square Adjusted R
Square
Std. Error of the
Estimate
.115 .013 -.039 .549
The independent variable is 8.1.2 Style of use: Long trips.
ANOVA
Sum of Squares df Mean Square F Sig.
Regression .076 1 .076 .252 .621
Residual 5.733 19 .302
Total 5.810 20
The independent variable is 8.1.2 Style of use: Long trips.
B.3.5.33. Importance of Technology for non-car owners for their next purchase
Model Summary
R R Square Adjusted R
Square
Std. Error of the
Estimate
.165 .027 -.024 .759
The independent variable is 8.1.2 Style of use: Long trips.
ANOVA
Sum of Squares df Mean Square F Sig.
Regression .305 1 .305 .530 .476
Residual 10.933 19 .575
Total 11.238 20
The independent variable is 8.1.2 Style of use: Long trips.

228
B.3.5.34. Importance of Affordability for non-car owners for their next purchase
Model Summary
R R Square Adjusted R
Square
Std. Error of the
Estimate
.404 .164 .120 1.146
The independent variable is 8.1.2 Style of use: Long trips.
ANOVA
Sum of Squares df Mean Square F Sig.
Regression 4.876 1 4.876 3.716 .069
Residual 24.933 19 1.312
Total 29.810 20
The independent variable is 8.1.2 Style of use: Long trips.
B.3.5.35. Importance of Comfort for non-car owners for their next purchase
Model Summary
R R Square Adjusted R
Square
Std. Error of the
Estimate
.059 .003 -.049 1.070
The independent variable is 8.1.2 Style of use: Long trips.
ANOVA
Sum of Squares df Mean Square F Sig.
Regression .076 1 .076 .067 .799
Residual 21.733 19 1.144

229
Total 21.810 20
The independent variable is 8.1.2 Style of use: Long trips.
B.3.5.36. Importance of Chinese Car for non car owners for their next purchase
Model Summary
R R Square Adjusted R
Square
Std. Error of the
Estimate
.042 .002 -.051 1.118
The independent variable is 8.1.2 Style of use: Long trips.
ANOVA
Sum of Squares df Mean Square F Sig.
Regression .043 1 .043 .034 .855
Residual 23.767 19 1.251
Total 23.810 20
The independent variable is 8.1.2 Style of use: Long trips.
B.3.6. Psychographics by style of use; short trips
B.3.6.1. Perception of Global Importance of Safety
Model Summary
R R Square Adjusted R
Square
Std. Error of the
Estimate
.000 .000 -.053 .592
The independent variable is 8.1.2 Style of Use: Short trips.
ANOVA
Sum of Squares df Mean Square F Sig.
Regression .000 1 .000 .000 1.000
Residual 6.667 19 .351
Total 6.667 20
The independent variable is 8.1.2 Style of Use: Short trips.
B.3.6.2. Perception of Global Importance of Brand image
Model Summary
R R Square Adjusted R
Square
Std. Error of the
Estimate
.019 .000 -.052 1.050
The independent variable is 8.1.2 Style of Use: Short trips.
ANOVA
Sum of Squares df Mean Square F Sig.
Regression .008 1 .008 .007 .933
Residual 20.944 19 1.102

230
Total 20.952 20
The independent variable is 8.1.2 Style of Use: Short trips.
B.3.6.3. Perception of Global Importance of Design
Model Summary
R R Square Adjusted R
Square
Std. Error of the
Estimate
.021 .000 -.052 .981
The independent variable is 8.1.2 Style of Use: Short trips.
ANOVA
Sum of Squares df Mean Square F Sig.
Regression .008 1 .008 .008 .929
Residual 18.278 19 .962
Total 18.286 20
The independent variable is 8.1.2 Style of Use: Short trips.
B.3.6.4. Perception of Global Importance of Fuel efficiency
Model Summary
R R Square Adjusted R
Square
Std. Error of the
Estimate
.360 .130 .084 .741
The independent variable is 8.1.2 Style of Use: Short trips.
ANOVA
Sum of Squares df Mean Square F Sig.
Regression 1.556 1 1.556 2.830 .109
Residual 10.444 19 .550
Total 12.000 20
The independent variable is 8.1.2 Style of Use: Short trips.
B.3.6.5. Perception of Global Importance of Quality
Model Summary
R R Square Adjusted R
Square
Std. Error of the
Estimate
.000 .000 -.053 .749
The independent variable is 8.1.2 Style of Use: Short trips.
ANOVA
Sum of Squares df Mean Square F Sig.
Regression .000 1 .000 .000 1.000
Residual 10.667 19 .561
Total 10.667 20
The independent variable is 8.1.2 Style of Use: Short trips.

231
B.3.6.6. Perception of Global Importance of Technology
Model Summary
R R Square Adjusted R
Square
Std. Error of the
Estimate
.138 .019 -.033 .879
The independent variable is 8.1.2 Style of Use: Short trips.
ANOVA
Sum of Squares df Mean Square F Sig.
Regression .286 1 .286 .370 .550
Residual 14.667 19 .772
Total 14.952 20
The independent variable is 8.1.2 Style of Use: Short trips.
B.3.6.7. Perception of Global Importance of Affordability
Model Summary
R R Square Adjusted R
Square
Std. Error of the
Estimate
.480 .231 .190 1.083
The independent variable is 8.1.2 Style of Use: Short trips.
ANOVA
Sum of Squares df Mean Square F Sig.
Regression 6.675 1 6.675 5.693 .028
Residual 22.278 19 1.173
Total 28.952 20
The independent variable is 8.1.2 Style of Use: Short trips.

232
B.3.6.8. Perception of Global Importance of Comfort
Model Summary
R R Square Adjusted R
Square
Std. Error of the
Estimate
.156 .024 -.027 .906
The independent variable is 8.1.2 Style of Use: Short trips.
ANOVA
Sum of Squares df Mean Square F Sig.
Regression .389 1 .389 .473 .500
Residual 15.611 19 .822
Total 16.000 20
The independent variable is 8.1.2 Style of Use: Short trips.
B.3.6.9. Perception of Global Importance of Chinese Brand
Model Summary
R R Square Adjusted R
Square
Std. Error of the
Estimate
.137 .019 -.033 1.180
The independent variable is 8.1.2 Style of Use: Short trips.
ANOVA
Sum of Squares df Mean Square F Sig.
Regression .508 1 .508 .365 .553
Residual 26.444 19 1.392

233
Total 26.952 20
The independent variable is 8.1.2 Style of Use: Short trips.
B.3.6.10. Importance of Safety for car owners
Model Summary
R R Square Adjusted R
Square
Std. Error of the
Estimate
.149 .022 -.029 .408
The independent variable is 8.1.2 Style of Use: Short trips.
ANOVA
Sum of Squares df Mean Square F Sig.
Regression .071 1 .071 .429 .521
Residual 3.167 19 .167
Total 3.238 20
The independent variable is 8.1.2 Style of Use: Short trips.
B.3.6.11. Importance of Brand image for car owners
Model Summary
R R Square Adjusted R
Square
Std. Error of the
Estimate
.163 .027 -.025 .867
The independent variable is 8.1.2 Style of Use: Short trips.
ANOVA
Sum of Squares df Mean Square F Sig.
Regression .389 1 .389 .518 .481
Residual 14.278 19 .751
Total 14.667 20
The independent variable is 8.1.2 Style of Use: Short trips.
B.3.6.12. Importance of Design for car owners
Model Summary
R R Square Adjusted R
Square
Std. Error of the
Estimate
.156 .024 -.027 1.037
The independent variable is 8.1.2 Style of Use: Short trips.
ANOVA
Sum of Squares Df Mean Square F Sig.
Regression .508 1 .508 .472 .500
Residual 20.444 19 1.076
Total 20.952 20
The independent variable is 8.1.2 Style of Use: Short trips.

234
B.3.6.13. Importance of Fuel Efficiency for car owners
Model Summary
R R Square Adjusted R
Square
Std. Error of the
Estimate
.052 .003 -.050 .787
The independent variable is 8.1.2 Style of Use: Short trips.
ANOVA
Sum of Squares df Mean Square F Sig.
Regression .032 1 .032 .051 .823
Residual 11.778 19 .620
Total 11.810 20
The independent variable is 8.1.2 Style of Use: Short trips.
B.3.6.14. Importance of Quality for car owners
Model Summary
R R Square Adjusted R
Square
Std. Error of the
Estimate
.495 .245 .205 .359
The independent variable is 8.1.2 Style of Use: Short trips.
ANOVA
Sum of Squares df Mean Square F Sig.
Regression .794 1 .794 6.169 .022
Residual 2.444 19 .129
Total 3.238 20
The independent variable is 8.1.2 Style of Use: Short trips.
B.3.6.15. Importance of Technology for car owners
Model Summary
R R Square Adjusted R
Square
Std. Error of the
Estimate
.216 .047 -.003 1.016
The independent variable is 8.1.2 Style of Use: Short trips.
ANOVA
Sum of Squares df Mean Square F Sig.
Regression .960 1 .960 .930 .347
Residual 19.611 19 1.032
Total 20.571 20
The independent variable is 8.1.2 Style of Use: Short trips.
B.3.6.16. Importance of Affordability for car owners
Model Summary
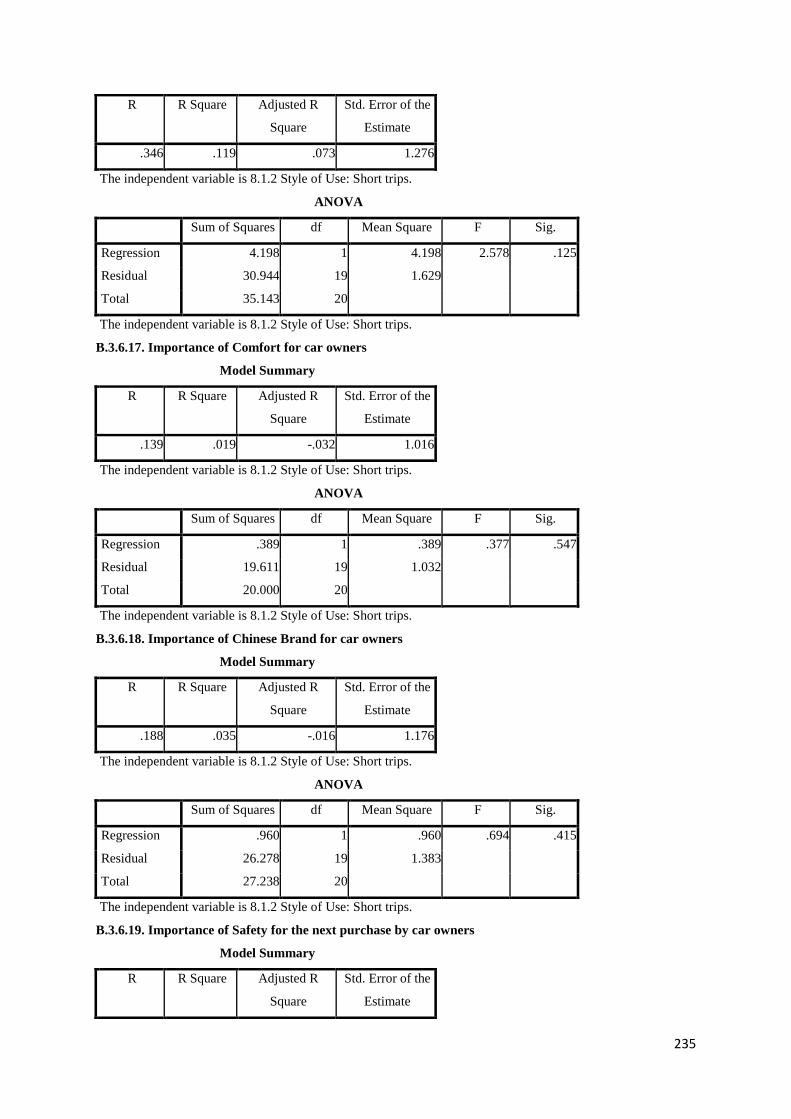
235
R R Square Adjusted R
Square
Std. Error of the
Estimate
.346 .119 .073 1.276
The independent variable is 8.1.2 Style of Use: Short trips.
ANOVA
Sum of Squares df Mean Square F Sig.
Regression 4.198 1 4.198 2.578 .125
Residual 30.944 19 1.629
Total 35.143 20
The independent variable is 8.1.2 Style of Use: Short trips.
B.3.6.17. Importance of Comfort for car owners
Model Summary
R R Square Adjusted R
Square
Std. Error of the
Estimate
.139 .019 -.032 1.016
The independent variable is 8.1.2 Style of Use: Short trips.
ANOVA
Sum of Squares df Mean Square F Sig.
Regression .389 1 .389 .377 .547
Residual 19.611 19 1.032
Total 20.000 20
The independent variable is 8.1.2 Style of Use: Short trips.
B.3.6.18. Importance of Chinese Brand for car owners
Model Summary
R R Square Adjusted R
Square
Std. Error of the
Estimate
.188 .035 -.016 1.176
The independent variable is 8.1.2 Style of Use: Short trips.
ANOVA
Sum of Squares df Mean Square F Sig.
Regression .960 1 .960 .694 .415
Residual 26.278 19 1.383
Total 27.238 20
The independent variable is 8.1.2 Style of Use: Short trips.
B.3.6.19. Importance of Safety for the next purchase by car owners
Model Summary
R R Square Adjusted R
Square
Std. Error of the
Estimate
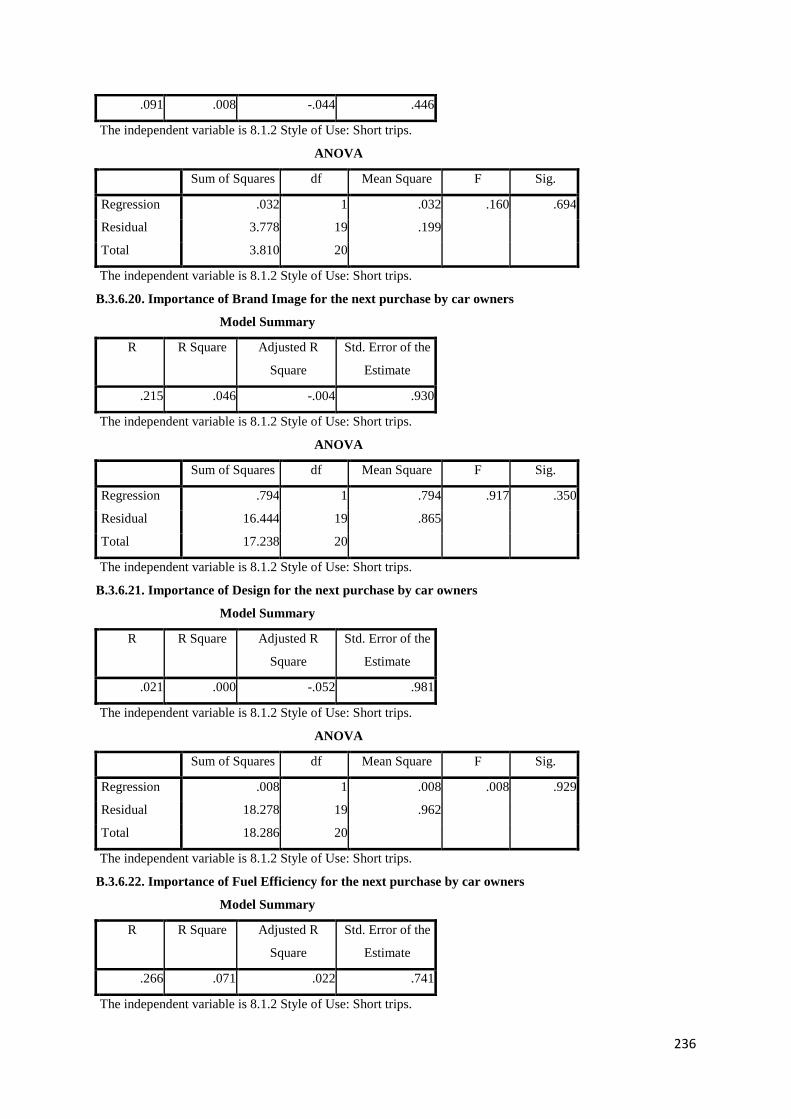
236
.091 .008 -.044 .446
The independent variable is 8.1.2 Style of Use: Short trips.
ANOVA
Sum of Squares df Mean Square F Sig.
Regression .032 1 .032 .160 .694
Residual 3.778 19 .199
Total 3.810 20
The independent variable is 8.1.2 Style of Use: Short trips.
B.3.6.20. Importance of Brand Image for the next purchase by car owners
Model Summary
R R Square Adjusted R
Square
Std. Error of the
Estimate
.215 .046 -.004 .930
The independent variable is 8.1.2 Style of Use: Short trips.
ANOVA
Sum of Squares df Mean Square F Sig.
Regression .794 1 .794 .917 .350
Residual 16.444 19 .865
Total 17.238 20
The independent variable is 8.1.2 Style of Use: Short trips.
B.3.6.21. Importance of Design for the next purchase by car owners
Model Summary
R R Square Adjusted R
Square
Std. Error of the
Estimate
.021 .000 -.052 .981
The independent variable is 8.1.2 Style of Use: Short trips.
ANOVA
Sum of Squares df Mean Square F Sig.
Regression .008 1 .008 .008 .929
Residual 18.278 19 .962
Total 18.286 20
The independent variable is 8.1.2 Style of Use: Short trips.
B.3.6.22. Importance of Fuel Efficiency for the next purchase by car owners
Model Summary
R R Square Adjusted R
Square
Std. Error of the
Estimate
.266 .071 .022 .741
The independent variable is 8.1.2 Style of Use: Short trips.

237
ANOVA
Sum of Squares df Mean Square F Sig.
Regression .794 1 .794 1.444 .244
Residual 10.444 19 .550
Total 11.238 20
The independent variable is 8.1.2 Style of Use: Short trips.
B.3.6.23. Importance of Quality for the next purchase by car owners
Model Summary
R R Square Adjusted R
Square
Std. Error of the
Estimate
.175 .031 -.020 .804
The independent variable is 8.1.2 Style of Use: Short trips.
ANOVA
Sum of Squares df Mean Square F Sig.
Regression .389 1 .389 .602 .447
Residual 12.278 19 .646
Total 12.667 20
The independent variable is 8.1.2 Style of Use: Short trips.
B.3.6.24. Importance of Technology for the next purchase by car owners
Model Summary
R R Square Adjusted R
Square
Std. Error of the
Estimate
.057 .003 -.049 .717
The independent variable is 8.1.2 Style of Use: Short trips.
ANOVA
Sum of Squares df Mean Square F Sig.
Regression .032 1 .032 .062 .807
Residual 9.778 19 .515
Total 9.810 20
The independent variable is 8.1.2 Style of Use: Short trips.
B.3.6.25. Importance of Affordability for the next purchase by car owners
Model Summary
R R Square Adjusted R
Square
Std. Error of the
Estimate
.455 .207 .165 1.161
The independent variable is 8.1.2 Style of Use: Short trips.
ANOVA
Sum of Squares df Mean Square F Sig.

238
Regression 6.675 1 6.675 4.952 .038
Residual 25.611 19 1.348
Total 32.286 20
The independent variable is 8.1.2 Style of Use: Short trips.
B.3.6.26. Importance of Comfort for the next purchase by car owners
Model Summary
R R Square Adjusted R
Square
Std. Error of the
Estimate
.191 .036 -.014 .735
The independent variable is 8.1.2 Style of Use: Short trips.
ANOVA
Sum of Squares df Mean Square F Sig.
Regression .389 1 .389 .719 .407
Residual 10.278 19 .541
Total 10.667 20
The independent variable is 8.1.2 Style of Use: Short trips.
B.3.6.27. Importance of Chinese Brand for the next purchase by car owners
Model Summary
R R Square Adjusted R
Square
Std. Error of the
Estimate
.082 .007 -.046 1.248
The independent variable is 8.1.2 Style of Use: Short trips.

239
ANOVA
Sum of Squares df Mean Square F Sig.
Regression .198 1 .198 .127 .725
Residual 29.611 19 1.558
Total 29.810 20
The independent variable is 8.1.2 Style of Use: Short trips.
B.3.6.28. Importance of Safety for non car owners for their next purchase
Model Summary
R R Square Adjusted R
Square
Std. Error of the
Estimate
.222 .049 -.001 .359
The independent variable is 8.1.2 Style of Use: Short trips.
ANOVA
Sum of Squares df Mean Square F Sig.
Regression .127 1 .127 .987 .333
Residual 2.444 19 .129
Total 2.571 20
The independent variable is 8.1.2 Style of Use: Short trips.
B.3.6.29. Importance of Brand Image for non car owners for their next purchase
Model Summary
R R Square Adjusted R
Square
Std. Error of the Estimate
.100 .010 -.042 1.016
The independent variable is 8.1.2 Style of Use: Short trips.
ANOVA
Sum of Squares df Mean Square F Sig.
Regression .198 1 .198 .192 .666
Residual 19.611 19 1.032
Total 19.810 20
The independent variable is 8.1.2 Style of Use: Short trips.
B.3.6.30. Importance of Design for non car owners for their next purchase
Model Summary
R R Square Adjusted R
Square
Std. Error of the
Estimate
.027 .001 -.052 .759
The independent variable is 8.1.2 Style of Use: Short trips.
ANOVA
Sum of Squares df Mean Square F Sig.

240
Regression .008 1 .008 .014 .908
Residual 10.944 19 .576
Total 10.952 20
The independent variable is 8.1.2 Style of Use: Short trips.
B.3.6.31. Importance of Fuel Efficiency for non car owners for their next purchase
Model Summary
R R Square Adjusted R
Square
Std. Error of the
Estimate
.175 .031 -.020 .804
The independent variable is 8.1.2 Style of Use: Short trips.
ANOVA
Sum of Squares df Mean Square F Sig.
Regression .389 1 .389 .602 .447
Residual 12.278 19 .646
Total 12.667 20
The independent variable is 8.1.2 Style of Use: Short trips.
B.3.6.32. Importance of Quality for non car owners for their next purchase
Model Summary
R R Square Adjusted R
Square
Std. Error of the
Estimate
.333 .111 .064 .521
The independent variable is 8.1.2 Style of Use: Short trips.
ANOVA
Sum of Squares df Mean Square F Sig.
Regression .643 1 .643 2.364 .141
Residual 5.167 19 .272
Total 5.810 20
The independent variable is 8.1.2 Style of Use: Short trips.
B.3.6.33. Importance of Technology for non car owners for their next purchase
Model Summary
R R Square Adjusted R
Square
Std. Error of the
Estimate
.106 .011 -.041 .765
The independent variable is 8.1.2 Style of Use: Short trips.
ANOVA
Sum of Squares df Mean Square F Sig.
Regression .127 1 .127 .217 .647
Residual 11.111 19 .585

241
Total 11.238 20
The independent variable is 8.1.2 Style of Use: Short trips.
B.3.6.34. Importance of Affordability for non car owners for their next purchase
Model Summary
R R Square Adjusted R
Square
Std. Error of the Estimate
.490 .240 .200 1.092
The independent variable is 8.1.2 Style of Use: Short trips.
ANOVA
Sum of Squares df Mean Square F Sig.
Regression 7.143 1 7.143 5.987 .024
Residual 22.667 19 1.193
Total 29.810 20
The independent variable is 8.1.2 Style of Use: Short trips.
B.3.6.35. Importance of Comfort for non car owners for their next purchase
Model Summary
R R Square Adjusted R
Square
Std. Error of the
Estimate
.172 .029 -.022 1.055
The independent variable is 8.1.2 Style of Use: Short trips.
ANOVA
Sum of Squares Df Mean Square F Sig.
Regression .643 1 .643 .577 .457
Residual 21.167 19 1.114
Total 21.810 20
The independent variable is 8.1.2 Style of Use: Short trips.
B.3.6.36. Importance of Chinese Car for non car owners for their next purchase
Model Summary
R R Square Adjusted R
Square
Std. Error of the
Estimate
.091 .008 -.044 1.115
The independent variable is 8.1.2 Style of Use: Short trips.
ANOVA
Sum of Squares df Mean Square F Sig.
Regression .198 1 .198 .160 .694
Residual 23.611 19 1.243
Total 23.810 20
The independent variable is 8.1.2 Style of Use: Short trips.

242
B.3.7. Car owners preferences for the next purchase by loyalty.
B.3.7.1. Perception of Global Importance of Safety
Model Summary
R R Square Adjusted R
Square
Std. Error of the
Estimate
.132 .017 -.034 .587
The independent variable is 8.1.4.1 Would you buy your next
car for the same reason? .
ANOVA
Sum of Squares df Mean Square F Sig.
Regression .117 1 .117 .338 .568
Residual 6.550 19 .345
Total 6.667 20
The independent variable is 8.1.4.1 Would you buy your next car for the same reason?
.
B.3.7.2. Perception of Global Importance of Brand image
Model Summary
R R Square Adjusted R
Square
Std. Error of the
Estimate
.011 .000 -.053 1.050
The independent variable is 8.1.4.1 Would you buy your next
car for the same reason? .
ANOVA
Sum of Squares df Mean Square F Sig.
Regression .002 1 .002 .002 .963
Residual 20.950 19 1.103
Total 20.952 20
The independent variable is 8.1.4.1 Would you buy your next car for the same reason?
.
B.3.7.3. Perception of Global Importance of Design
Model Summary
R R Square Adjusted R
Square
Std. Error of the
Estimate
.068 .005 -.048 .979
The independent variable is 8.1.4.1 Would you buy your next
car for the same reason? .
ANOVA

243
Sum of Squares df Mean Square F Sig.
Regression .086 1 .086 .089 .768
Residual 18.200 19 .958
Total 18.286 20
The independent variable is 8.1.4.1 Would you buy your next car for the same reason?
.
B.3.7.4. Perception of Global Importance of Fuel efficiency
Model Summary
R R Square Adjusted R
Square
Std. Error of the
Estimate
.000 .000 -.053 .795
The independent variable is 8.1.4.1 Would you buy your next
car for the same reason? .
ANOVA
Sum of Squares df Mean Square F Sig.
Regression .000 1 .000 .000 1.000
Residual 12.000 19 .632
Total 12.000 20
The independent variable is 8.1.4.1 Would you buy your next car for the same reason?
.
B.3.7.5. Perception of Global Importance of Quality
R R Square Adjusted R
Square
Std. Error of the
Estimate
.105 .011 -.041 .745
The independent variable is 8.1.4.1 Would you buy your next
car for the same reason? .
ANOVA
Sum of Squares df Mean Square F Sig.
Regression .117 1 .117 .210 .652
Residual 10.550 19 .555
Total 10.667 20
The independent variable is 8.1.4.1 Would you buy your next car for the same reason?
.
B.3.7.6. Perception of Global Importance of Technology
Model Summary
R R Square Adjusted R
Square
Std. Error of the
Estimate
.101 .010 -.042 .883

244
The independent variable is 8.1.4.1 Would you buy your next
car for the same reason? .
ANOVA
Sum of Squares df Mean Square F Sig.
Regression .152 1 .152 .196 .663
Residual 14.800 19 .779
Total 14.952 20
The independent variable is 8.1.4.1 Would you buy your next car for the same reason?
B.3.7.7. Perception of Global Importance of Affordability
Model Summary
R R Square Adjusted R
Square
Std. Error of the
Estimate
.086 .007 -.045 1.230
The independent variable is 8.1.4.1 Would you buy your next
car for the same reason? .
ANOVA
Sum of Squares df Mean Square F Sig.
Regression .215 1 .215 .142 .710
Residual 28.738 19 1.513
Total 28.952 20
The independent variable is 8.1.4.1 Would you buy your next car for the same reason?
.
B.3.7.8. Perception of Global Importance of Comfort
Model Summary
R R Square Adjusted R
Square
Std. Error of the
Estimate
.128 .016 -.035 .910
The independent variable is 8.1.4.1 Would you buy your next
car for the same reason? .
ANOVA
Sum of Squares df Mean Square F Sig.
Regression .262 1 .262 .317 .580
Residual 15.738 19 .828
Total 16.000 20
The independent variable is 8.1.4.1 Would you buy your next car for the same reason?
.
B.3.7.9. Perception of Global Importance of Chinese Brand
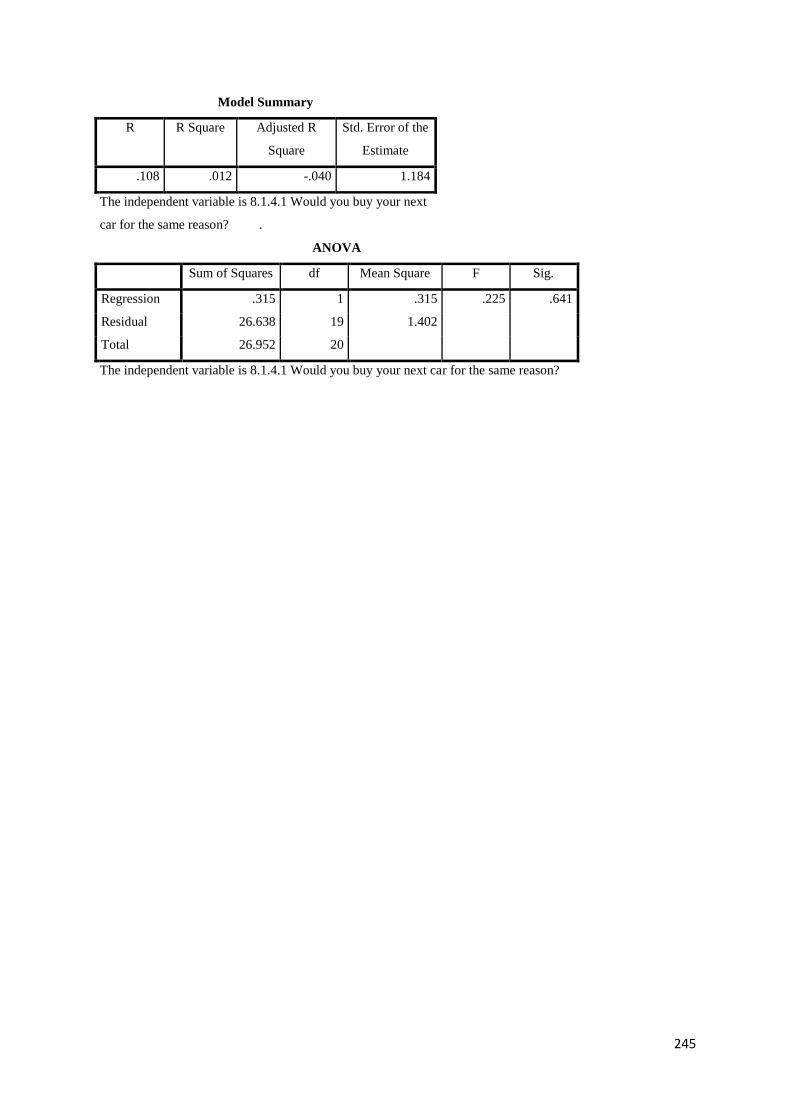
245
Model Summary
R R Square Adjusted R
Square
Std. Error of the
Estimate
.108 .012 -.040 1.184
The independent variable is 8.1.4.1 Would you buy your next
car for the same reason? .
ANOVA
Sum of Squares df Mean Square F Sig.
Regression .315 1 .315 .225 .641
Residual 26.638 19 1.402
Total 26.952 20
The independent variable is 8.1.4.1 Would you buy your next car for the same reason?

246
Linnaeus University – a firm focus on quality and competence On 1 January 2010 Växjö University and the University of Kalmar merged to form Linnaeus University. This
new university is the product of a will to improve the quality, enhance the appeal and boost the development potential of
teaching and research, at the same time as it plays a prominent role in working closely together with local society.
Linnaeus University offers an attractive knowledge environment characterised by high quality and
a competitive portfolio of skills.
Linnaeus University is a modern, international university with the emphasis on the desire for knowledge, creative
thinking and practical innovations. For us, the focus is on proximity to our students, but also on the world around us and
the future ahead.
Linnæus University
SE-391 82 Kalmar/SE-351 95 Växjö
Telephone +46 772-28 80 00