seismic analysis of concrete-faced rock … issue | jafari et al. 2016 | iioabj | vol. 7 | suppl 4 |...
TRANSCRIPT
SUPPLEMENT ISSUE
www.iioab.org | Jafari et al. 2016 | IIOABJ | Vol. 7 | Suppl 4 | 566–574 | 566
ARTICLE SEISMIC ANALYSIS OF CONCRETE-FACED ROCK-FILL DAMS
(CFRDS) WITH REGARD TO THE NONLINEAR BEHAVIOR OF THE DAM BODY AND CONCRETE COATING
Mahdi. Najafi1*, Amir Javad. Moradloo2, Farhang. Farrokhi3 1Department of Civil Engineering, Kish International Branch, Islamic Azad University, Kish, IRAN
2Department of Civil Engineering, University of Zanjan, Zanjan, IRAN 3Department of Civil Engineering, University of Zanjan, Zanjan, IRAN
ABSTRACT Due to its nature and its effect on the structural response, and also experiences of past events, earthquake is of a particular importance among
the factors influencing the behavior of the dam and its damages. Concrete-faced rock-fill dams are the types of dams with concrete slabs in
the upstream slope as the sealing component. Like earth dams, these dams also have a conventional design. However, their dynamic analysis
is different from earth dams or even rock-fill dams with impermeable core and it has been less studied. In this study, a two-dimensional
numerical modeling of concrete rock-fill dams was carried out using ABAQUS finite element program and also, modal analysis of numerical
modelling and calculation of attenuation coefficients was done using Rayleigh method. Then, two appropriate earthquake records were
selected as the input stimuli for the dynamic study and then nonlinear time history analysis was performed on the model of the dam for two
situations of the empty tank and a tank full of water using PLAXIS software. The results indicate that in the empty tank situation, under the
Northridge earthquake records with respect to the maximum axial tensile stress developed in the concrete face, occurrence of tensile cracking
is possible at elevations from 13/35 to 104/91 meters from down the dam. In addition, tension did not exceed the tensile strength of concrete
at any points of the concrete face during Sakaria earthquake.
INTRODUCTION Given the importance of dams due to social, economic and political issues, the safety of these large
structures has been highly of interest. Dam safety should be checked periodically. Due to its nature and its
effect on the structural reaction, and also experiences of past events, earthquake is of a particular
importance among the factors influencing the behavior of the dam and its damages. Concrete-faced rock-
fill dams are a variety of dams that have been considered as an amenable option in recent years when
compared to earth dams, rock-fill dams with clay core, and concrete arch dams in certain circumstances,
and they are also considered to be a superior option in many cases. However, less attention has been paid
to the dynamic response of this type of dam considering its various aspects such as concrete face, and
interaction of the dam body and its concrete face. The occurrence of such cracks is possible even under
normal loads due to the low tensile strength of the concrete. In this study, two appropriate earthquake
records were selected as the input stimuli for the dynamic study and then nonlinear time history analysis
was performed on the two-dimensional model of the dam. And, the axial stress generated in the concrete
face of the dam, as well as, displacement, velocity and acceleration responses at a point near the dam crest
are investigated.
LITERATURE REVIEW Concrete-faced rock-fill dams have been offered as an appropriate and economic option in 1970 and since
then, they have been designed and performed in many parts of the world. Concrete-faced rock-fill dams are
one of the types of rock-fill dams in which a concrete face on the upper slopes prevents the passage of
water.
Concrete-faced rock-fill dams are composed of three parts of rock-fill, concrete face slab, and concrete toe
slab. The main body of concrete-faced rock-fill dams is formed by various layers of rock-fill materials with
different grain size in which each layer has its own function and feature. However, in regard to the
mechanical properties (modulus of elasticity), they are more or less similar and regarded as uniform in the
stress-strain analysis. Thickness of concrete face slab is determined based on past experiences, i.e. a
thickness of 25 to 30 cm is proposed for dams with a height of less than 100 m; and for high or major dams,
the face thickness is calculated by the formula of 000/0 +0/0 H where H is the dam height. However, in the
case of better quality of construction, lower thicknesses can also be used [1].
Dam sealing is the task of the concrete face slab which is implemented on the upstream level. Thickness of
concrete face slab is usually between 30 to 40 cm and it increases as the height of the slab thickness is
increased in more dams. The used concrete is the conventional concrete with a compressive strength of 20
MPa. Usually, concrete slab is reinforced in two directions. Concrete face reinforcement is done for
controlling the crack due to temperature changes or concrete shrinkage. Percentage of steel has been
suggested to be about 0/35 to 0/4 percent. Armature system is usually placed in a row slightly above the
central line of the face [2]. Horizontal reinforcements pass through vertical seams continuously so that no
defect is created in the concrete as a result of the sealing installation [3].
The main purpose of constructing concrete toe slab is connecting the concrete face to the foundation. This
slab is usually built on the solid and grouting foundations. The width of the slab is about 0/04 to 0/05 of
reservoir water level and its minimum width is about 3 meters. The minimum slab thickness is from 0/3 to
0/4 meters [4]. The stability of this slab is very important. For the purpose of enhancing this sustainability,
KEY WORDS
Rock-fill dam, concrete
face, seismic analysis,
modal analysis.
*Corresponding Author
Email:
Tel.: +98-9111933316
Fax: +98-2189773316
Published: 15 October 2016

SUPPLEMENT ISSUE
www.iioab.org | Jafari et al. 2016 | IIOABJ | Vol. 7 | Suppl 4 | 566–574 | 567
sometimes anchors of 25 to 35 mm in diameter and 3 meters in length are used to connect the slab to the
stone floor. On the other hand, these anchors prevent the slab from rising when they are grouted [2]. The
toe slab should be reinforced in order to control the cracking due to heat changes and applied bending loads
during the grouting. According to Cook and Sherard (1987), it is appropriate to place 0/3 percentage of the
steel in 10 to 15 cm below the central line of the slab [4].
The first CFR dam was built in California in 1895. This dam was built following the construction of wooden
face rock-fill dams in the 1850s [Fell et al, 1992]. In the 1950s, the development of this type of dam was
slowed down due to the water seepage and lack of subsidence control. But in the 1960s, development of
this type of dam accelerated with the construction of large vibratory rollers and growth of rock-fill compaction
technique, and consequently, tall dams were constructed [5]. Before that time, tall dams which were built
with no rock-fill compaction faced with problems in relation to the concrete surface.
Research and studies on the design, development and behavior of CFR dams do not have a very long history.
However, the analysis of the dynamic behavior of CFR dams has been less concerned compared to
construction and operational issues.
Uddin (1999) has suggested a simple calculation method with which stresses created in the slab can be
calculated manually. The basic premise of this approach is that the deformation of the slab is a function of
the bending deformation of the dam body [6].
Haeri and Esfahani (2000) also analyzed a CFR dam with a height of 100 meters through a two-dimensional
modelling using ANSYS software. In their analysis, they defined the behavior of rock-fill materials based on
a combination of Cam clay and Drucker- Prager model and used the contact elements of ANSYS software to
model the possible slip between the slab and the body. They also stimulated the dam by the two earthquake
records, namely, El Centro earthquake (1954) with the PGA of 0/35g, and Manjil earthquake (1990), the
PGA of 0/53 g and thus came to the following conclusions [7]:
1. The induced acceleration in the upper one-third of the dam is significantly greater than the base bedrock
acceleration.
2. A part of the concrete face slab including 20% of the upper slab length developed the resonance
phenomenon up to 2.7 times the base stone floor acceleration due to earthquake. As a result, uplift
phenomenon (detachment) of concrete face slab has been observed at some dewatering levels.
3. There is the possibility of tensile cracking in the concrete slab due to the axial force generated in it.
Haeri et al (2007) performed the two- and three-dimensional analysis of a sample rock-fill dam with a height
of 100 meters using ANSYS software. Non-linear behavior for rock-fill materials was considered multiline
using kinematic hardening model and the boundary between the slab and the body was modelled to level 1
using the contact point element. At the end, the results of two- and three-dimensional analysis were reported
as follows [8]:
1. The first free vibration frequency of the three-dimensional model of is less than that of the two-
dimensional model.
2. Location shifts and the maximum major stresses in the concrete face in the three-dimensional induced
acceleration are more than the two-dimensional model.
3. Slab uplift phenomenon can be seen in both the two-dimensional and three-dimensional models. But
the amount of uplift is more in the three-dimensional model.
4. In the three-dimensional model, the maximum induced acceleration does not necessarily happens in
the middle section of the dam.
Wieland (2007) conducted a study on the seismic performance of CRF dams and reported that the dams
experience a maximum subsidence of 0/5 to 1 meter during the Strong Motion. Typically, the general
assumption in the dynamic analysis of dam is that uniform excitation is applied throughout the site. This
assumption can only be true in special cases such low frequencies in which the verified wavelength is quite
large compared to the dimensions of the dam. But, in practice, in addition to components with high-
frequency and low wavelength which make uniformity of excitation throughout the site anyway, other factors
such as the wave approach angle and the valley shape of dam cause that the excitation experienced in
different parts of the valley be different in terms of amplitude, phase and even frequency content [9].
RESEARCH METHODOLOGY Introduction to ABAQUS finite element analysis (FEA) software For the purpose of modal analysis of the dam structure, the numerical model was built in ABAQUS software
and it was evaluated. ABAQUS is a powerful suite of engineering simulation programs based on the finite
element method than can simulate problems ranging from relatively simple linear analyses to the most
challenging nonlinear simulations. ABAQUS contains elements that can model any geometry. It also consists
of an extensive list of material models that can simulate the behavior of most typical engineering materials
including metals, rubber, polymers, composites, reinforced concrete, crushable and resilient foams, and
geotechnical materials such as soils and rock. An ABAQUS model is composed of several different
components in which the analysis model consists of the following information: discretized geometry, element
section properties, material data, loads and boundary conditions, analysis type, and output requests.
In dynamic analysis, the waves generated by the material damping lose their energy. Thus, Rayleigh damping
in ABAQUS software can be used to define a general damping for the system. For this definition, two main
factors of Rayleigh damping are required to be specified: αR for the mass-proportional damping, and βR for
the stiffness-proportional damping. For a given mode i, critical damping based on the two mentioned
parameters is as follows:
ξ𝑖 =α
2wi+
βwi
2 (1)
SUPPLEMENT ISSUE
www.iioab.org | Jafari et al. 2016 | IIOABJ | Vol. 7 | Suppl 4 | 566–574 | 568
This equation implies that the mass-proportional Rayleigh damping (αR) damps low frequencies, and the
stiffness-proportional Rayleigh damping (βR) damps higher frequencies.
The αR factor introduces damping forces caused by the velocities of the model and indeed, it offers a
damping contribution proportional to the mass matrix for an element. The βR factor introduces damping
proportional to the strain rate, which can be considered as damping related to the material itself. This
parameter is defined as the damping proportional to the elastic material stiffness. But it cannot be regarded
as a non-linear response to the stiffness. Since the stiffness matrix may have negative eigenvalues in some
cases (which implies negative damping). This factor produces a damping tension, proportional to the total
strain rate which is added to the stress caused by the system response in the dynamic equilibrium equations
(but it is not included in the stress output). Given the constant critical damping at different frequencies,
these two parameters can be obtained from equations (2) and (3) in the frequency range of ω_1 and ω_2.
αR =2ω1ω2ξ
ω1 + ω2 (2)
βR =2ξ
ω1 + ω2 (3)
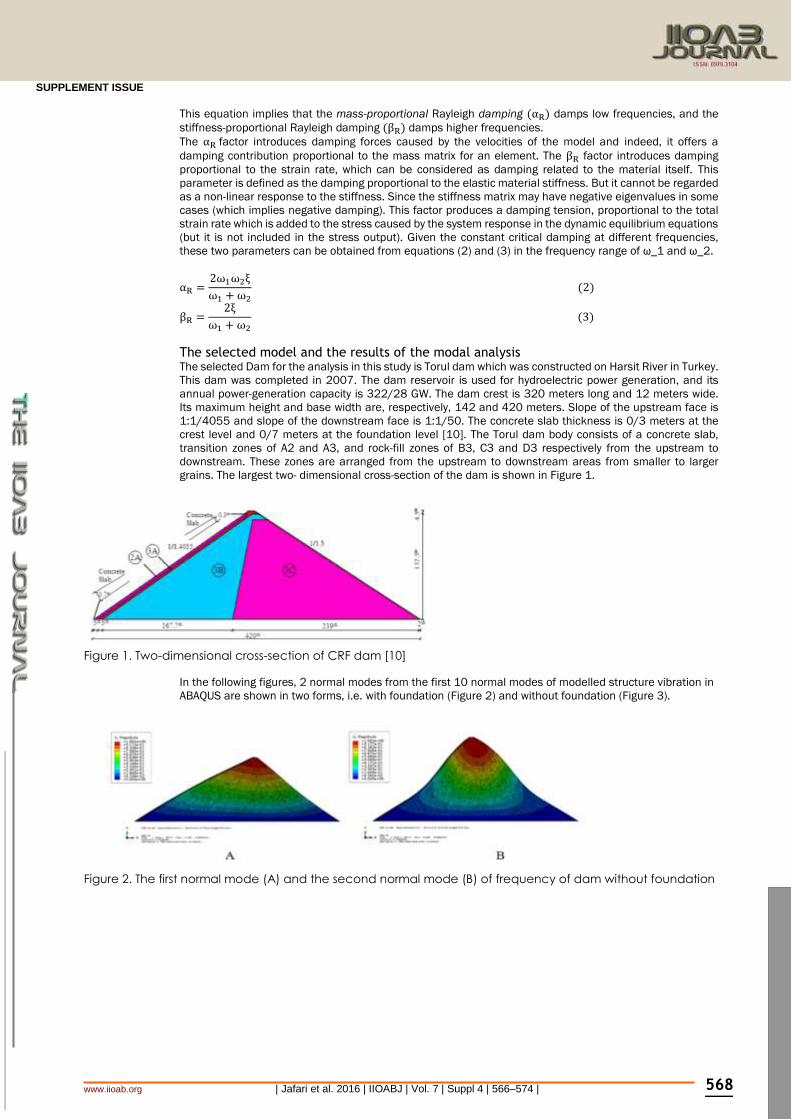
The selected model and the results of the modal analysis The selected Dam for the analysis in this study is Torul dam which was constructed on Harsit River in Turkey.
This dam was completed in 2007. The dam reservoir is used for hydroelectric power generation, and its
annual power-generation capacity is 322/28 GW. The dam crest is 320 meters long and 12 meters wide.
Its maximum height and base width are, respectively, 142 and 420 meters. Slope of the upstream face is
1:1/4055 and slope of the downstream face is 1:1/50. The concrete slab thickness is 0/3 meters at the
crest level and 0/7 meters at the foundation level [10]. The Torul dam body consists of a concrete slab,
transition zones of A2 and A3, and rock-fill zones of B3, C3 and D3 respectively from the upstream to
downstream. These zones are arranged from the upstream to downstream areas from smaller to larger
grains. The largest two- dimensional cross-section of the dam is shown in Figure 1.
Figure 1. Two-dimensional cross-section of CRF dam [10]
In the following figures, 2 normal modes from the first 10 normal modes of modelled structure vibration in
ABAQUS are shown in two forms, i.e. with foundation (Figure 2) and without foundation (Figure 3).
Figure 2. The first normal mode (A) and the second normal mode (B) of frequency of dam without foundation

SUPPLEMENT ISSUE
www.iioab.org | Jafari et al. 2016 | IIOABJ | Vol. 7 | Suppl 4 | 566–574 | 569
Figure 3. The second normal mode (A) and the fifth normal mode (B) of frequency of dam with foundation
According to the frequencies obtained from the modal analysis of the structure, two appropriate earthquake
records were selected and their characteristics are given in Table 1. These records are related to the Sakaria
earthquake with the dominant frequency of 6/25 and Northridge earthquake 3/864 with the dominant
frequency. The dominant frequency of Sakaria earthquake record is between the fifth and sixth modes of
frequency of dam with foundation, and Northridge earthquake dominant frequency is between the second
and third modes of the frequency of the dam with foundation. Records are selected so that the dominant
frequency between two frequencies is among the 10 normal frequencies of the structure.
Table 1. Attributes of the two selected earthquake records Earthquake
record Maximum
acceleration (g)
Maximum acceleration
duration (sec)
Maximum velocity (cm/sec)
Maximum velocity duration
(sec)
Maximum displacement
(sec)
Maximum displacement duration (sec)
Dominant period (sec)
Dominant frequency
Sakaria 826/0 22/5 78853/33 72/8 87536/52 26/82 88/0 25/8
Northridge 586/0 23/6 02237/52 88/6 28883/6 23/8 28/0 638/7
Time history of acceleration, velocity, displacement, and the Fourier spectrum of the selected earthquake
records is shown in the following diagrams.
Diagram 1. Time history of acceleration, velocity and displacement (A) and Fourier amplitude spectrum (B) of
Northridge earthquake record
Diagram 2. Time history of acceleration, velocity and displacement (A) and Fourier amplitude spectrum (B) of
Sakaria earthquake record
Methods presented in the regulations of seismic analysis and design of structures are based on two main
methods of equivalent static analysis and dynamic analysis. Dynamic analysis is performed in two ways,
namely, spectral analysis and time history dynamic analysis. After calculating the damping coefficients and
selecting two appropriate earthquake records, nonlinear time history analysis of the dam structure has been

SUPPLEMENT ISSUE
www.iioab.org | Jafari et al. 2016 | IIOABJ | Vol. 7 | Suppl 4 | 566–574 | 570
performed on the two-dimensional model, once with the empty tank and the other time with a full tank of
water using PLAXIS software.
Soil behavioral models in PLAXIS software include:
1. Mohr-Coulomb model (MC)
2. Jointed Rock model (JR)
3. Hardening Soil model (HS)
4. Soft Soil Creep model (SSR)
5. Softening Soil model (SS)
6. Modified Cam-clay model (MCC)
Mohr-Coulomb model (elastic - plastic) is a popular model that includes 5 parameters, namely, Young's
modulus, dilation angle, Poisson's ratio, soil internal angle of friction, and the cohesion. This model was
used in the analysis performed in this study.
Utilizing the plane strain model This program generates triangular elements using two 6-node and 15-node models. The 6-node elements
has 3 internal nodes in which the program calculates the generated stresses and strains in the analysis
phase. Moreover, the 15-node elements offers better results by having 12 internal nodes and this requires
more time and greater use of computer memory. This program is recommended for two-dimensional models
of using 6-node element and also for complex models of using 15-node elements. In this study, the 15-node
elements are used for the modeling. The number of elements is 1205 for the dam. The finite element model
used in PLAXIS program is presented in Figure 4. Also, the concrete face has been modeled as Plate with 27
“5-node” elements.
Figure 4: The finite element model used in PLAXIS program
RESULTS In the following, the results of non-linear time history analysis on the two-dimensional CRFD model have
been analyzed in the PLAXIS finite element software in two conditions of the empty tank and the full tank.
Responses of acceleration, velocity and displacement have been presented for a point above the dam near
the crest with the coordinates (135 and 199) which have been under the effect of Northridge and Sakaria
earthquake records for 20 seconds. The mentioned point is located at the dam section in Figure 4. Also, the
axial stress level generated at the concrete face is also provided. The purpose of examining the axial stress
is to investigate the potential for crack generation in the concrete face.
Results of the empty tank case In Diagram 3, responses of two-dimensional model which have been analyzed in PLAXIS software, including
acceleration, velocity and displacement are presented for a point above the dam near the crest which was
under the effect of Northridge earthquake records for 20 seconds.
Diagram (3) Time history responses of acceleration (A), velocity (B) and displacement (C) of Northridge
earthquake in the empty tank case
In Diagram 3, it can be observed that the maximum acceleration rate for a point above the dam near the
crest is about 3 seconds and about 0/8 meters per second squared. The maximum velocity rate for the
mentioned point is about 6 seconds and a little more than 0/08 meters per second squared, and finally, the
SUPPLEMENT ISSUE
www.iioab.org | Jafari et al. 2016 | IIOABJ | Vol. 7 | Suppl 4 | 566–574 | 571
maximum displacement rate in the x direction for the point under study is about 7/5 sec and less than 6
cm.
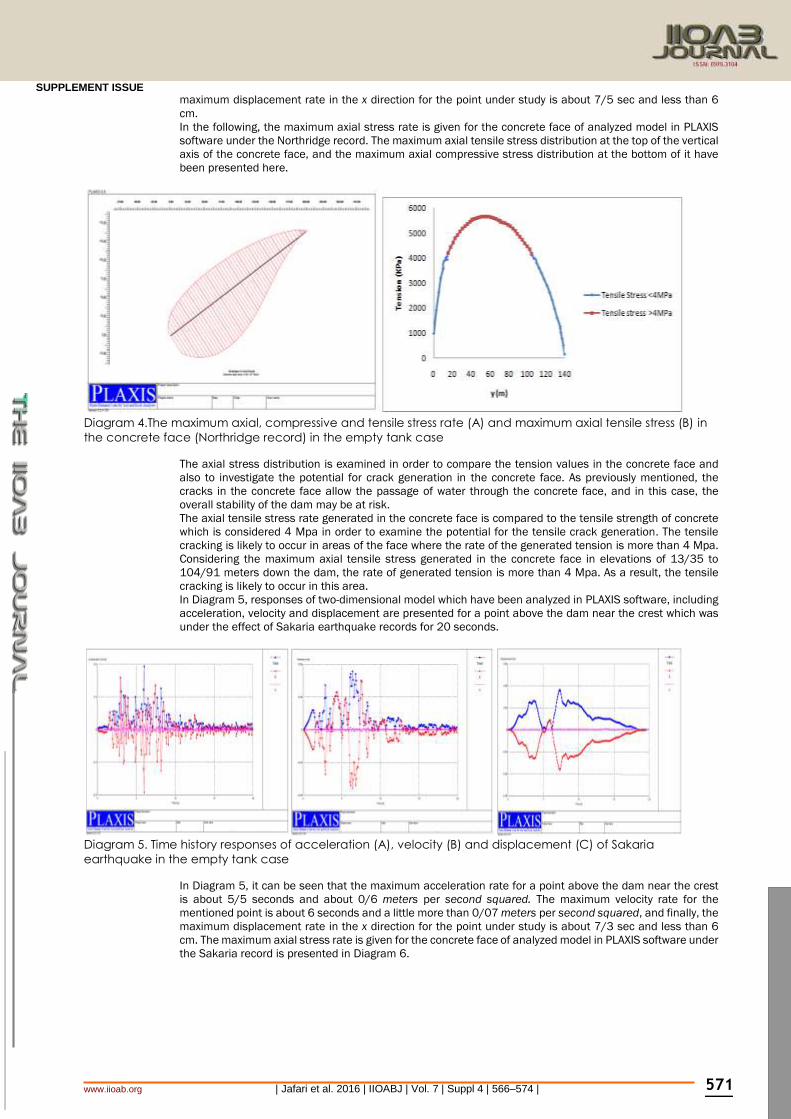
In the following, the maximum axial stress rate is given for the concrete face of analyzed model in PLAXIS
software under the Northridge record. The maximum axial tensile stress distribution at the top of the vertical
axis of the concrete face, and the maximum axial compressive stress distribution at the bottom of it have
been presented here.
Diagram 4.The maximum axial, compressive and tensile stress rate (A) and maximum axial tensile stress (B) in
the concrete face (Northridge record) in the empty tank case
The axial stress distribution is examined in order to compare the tension values in the concrete face and
also to investigate the potential for crack generation in the concrete face. As previously mentioned, the
cracks in the concrete face allow the passage of water through the concrete face, and in this case, the
overall stability of the dam may be at risk.
The axial tensile stress rate generated in the concrete face is compared to the tensile strength of concrete
which is considered 4 Mpa in order to examine the potential for the tensile crack generation. The tensile
cracking is likely to occur in areas of the face where the rate of the generated tension is more than 4 Mpa.
Considering the maximum axial tensile stress generated in the concrete face in elevations of 13/35 to
104/91 meters down the dam, the rate of generated tension is more than 4 Mpa. As a result, the tensile
cracking is likely to occur in this area.
In Diagram 5, responses of two-dimensional model which have been analyzed in PLAXIS software, including
acceleration, velocity and displacement are presented for a point above the dam near the crest which was
under the effect of Sakaria earthquake records for 20 seconds.
Diagram 5. Time history responses of acceleration (A), velocity (B) and displacement (C) of Sakaria
earthquake in the empty tank case
In Diagram 5, it can be seen that the maximum acceleration rate for a point above the dam near the crest
is about 5/5 seconds and about 0/6 meters per second squared. The maximum velocity rate for the
mentioned point is about 6 seconds and a little more than 0/07 meters per second squared, and finally, the
maximum displacement rate in the x direction for the point under study is about 7/3 sec and less than 6
cm. The maximum axial stress rate is given for the concrete face of analyzed model in PLAXIS software under
the Sakaria record is presented in Diagram 6.
SUPPLEMENT ISSUE
www.iioab.org | Jafari et al. 2016 | IIOABJ | Vol. 7 | Suppl 4 | 566–574 | 572
Diagram 6.The maximum axial, compressive and tensile stress rate (A) and maximum axial tensile stress (B) in
the concrete face (Sakaria record) in the empty tank case
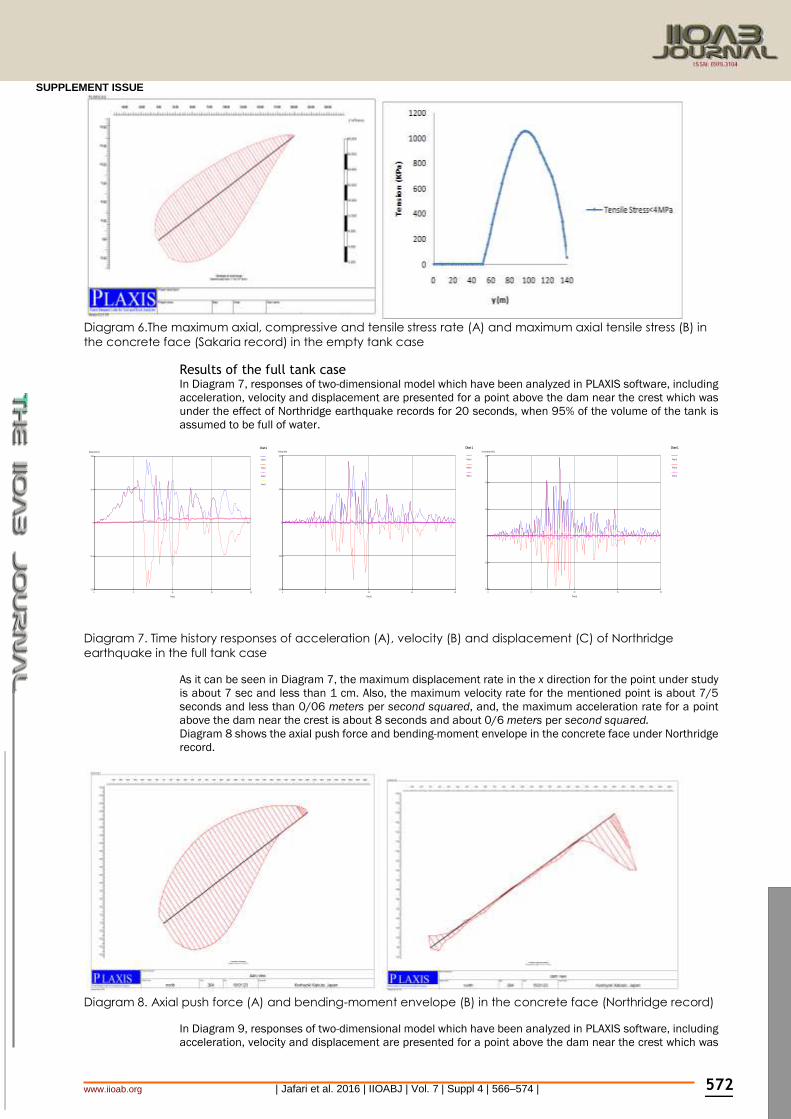
Results of the full tank case In Diagram 7, responses of two-dimensional model which have been analyzed in PLAXIS software, including
acceleration, velocity and displacement are presented for a point above the dam near the crest which was
under the effect of Northridge earthquake records for 20 seconds, when 95% of the volume of the tank is
assumed to be full of water.
Diagram 7. Time history responses of acceleration (A), velocity (B) and displacement (C) of Northridge
earthquake in the full tank case
As it can be seen in Diagram 7, the maximum displacement rate in the x direction for the point under study
is about 7 sec and less than 1 cm. Also, the maximum velocity rate for the mentioned point is about 7/5
seconds and less than 0/06 meters per second squared, and, the maximum acceleration rate for a point
above the dam near the crest is about 8 seconds and about 0/6 meters per second squared.
Diagram 8 shows the axial push force and bending-moment envelope in the concrete face under Northridge
record.
Diagram 8. Axial push force (A) and bending-moment envelope (B) in the concrete face (Northridge record)
In Diagram 9, responses of two-dimensional model which have been analyzed in PLAXIS software, including
acceleration, velocity and displacement are presented for a point above the dam near the crest which was
0 5 10 15 20
-0.4
-0.2
0
0.2
0.4
0.6
Time [s]
Acceleration [m/s2]
Chart 1
Point A
Point A
Point A
0 5 10 15 20
-0.06
-0.03
0
0.03
0.06
Time [s]
Velocity [m/s]
Chart 1
Point A
Point A
Point A
0 5 10 15 20
-0.01
-5e-3
0
5e-3
0.01
Time [s]
Displacement [m]
Chart 1
Point A
Point A
Point A
Point A

SUPPLEMENT ISSUE
www.iioab.org | Jafari et al. 2016 | IIOABJ | Vol. 7 | Suppl 4 | 566–574 | 573
under the effect of Sakaria earthquake records for 20 seconds, when 95% of the volume of the tank is
assumed to be full of water.
Diagram 9. Time history responses of acceleration (A), velocity (B) and displacement (C) of Sakaria
earthquake in the full tank case
In Diagram 9, it can be observed that the maximum displacement rate in the x direction for the point under
study is about 7 sec and less than 1 cm. Also, the maximum velocity rate for the mentioned point is about
6/5 seconds and less than 0/07 meters per second squared, and the maximum acceleration rate for a point
above the dam near the crest is about 6 seconds and about 0/6 meters per second squared.
Also, the axial push force and bending-moment envelope in the concrete face under Sakaria record are
presented in Diagram 8.
Diagram 8. Axial push force (A) and bending-moment envelope (B) in the concrete face (Sakaria record)
The free surface flow in the dam body for the two-dimensional analyzed model in PLAXIS software in the
full tank case is shown in Figure 11.
Diagram11. The free surface flow in the dam body (Sakaria record)
0 5 10 15 20
-0.6
-0.3
0
0.3
0.6
Time [s]
Acceleration [m/s2]
Chart 1
Point A
Point A
Point A
0 5 10 15 20
-0.08
-0.04
0
0.04
0.08
Time [s]
Velocity [m/s]
Chart 1
Point A
Point A
Point A

SUPPLEMENT ISSUE
www.iioab.org | Jafari et al. 2016 | IIOABJ | Vol. 7 | Suppl 4 | 566–574 | 574
CONCLUSION - In the empty tank case, the rate of the tension generated in the concrete face is more than 4 MPa under
Northridge earthquake records. As a result, the tensile crack is likely to happen in the elevations of 13/35
to 104/91 meters down the dam. Moreover, the tension has not exceeded the tensile strength of 4 Mpa in
any points of the concrete face during the Sakaria earthquake.
- Under Northridge earthquake record, the maximum acceleration rate for a point above the dam near the
crest was about 3 seconds and about 0/8 meters per second squared for the empty tank case. For the full
tank case, it was about 7/5 seconds and about less than 0/06 meters per second squared. The maximum
velocity rate for the mentioned point was about 6 seconds and a little more than 0/08 meters per second
squared for the first case, and it was about 7/5 seconds and less than 0/06 meters per second squared for
the second case. Also, the maximum displacement rate in the x direction for the point under study is about
7/5 sec and less than 6 cm for the first case.
- Under Sakaria earthquake record, the maximum acceleration rate was about 0/6 meters per second
squared in both cases of full and empty tank. The maximum displacement rate in the x direction for the point
under study was about 7/3 sec and less than 6 cm for the empty tank case.
And finally, the maximum velocity rate was about 0/07 meters per second.
CONFLICT OF INTEREST Authors declare no conflict of interest.
ACKNOWLEDGEMENT The authors gratefully acknowledge the technical support given by Dr. Amir javad. Moradloo, Department of Civil Engineering,
University of Zanjan, Zanjan, Iran.
FINANCIAL DISCLOSURE No financial support was received to carry out this project.
REFERENCES
[1] ICOLD (1989a), “Rock fill dams with concrete
facing.International committee on Large Dams”.
[2] Fell R., Mac Groger P. and Stapeldon, (1992), “Geotechnical
Engineering of Embankment Dams”, Balkema Publisher. [3] Vafaeian, M, (2005), "Rock-fill Dams” SID, Isfahan University of
Technology.
[4] Cook, J.B.and Sherard, J.L, (1987),“Concrete-face rockfill
dam:I.Assessment”, Geotechnical Engineering, ASCE,Vol,
No.10 , pp.1096-1112.
[5] Chau, L., (2004), “A Study on Concrete faced Rock fill Dams”,
University of Southern Queensland, Chapter 2,3 & 5.
[6] Uddin, N., (1999), “A dynamic analysis procedure for concrete-
faced rockfill dams subjected to strong seismic excitation”,
Computers and Structures 7, 409-421.
[7] Haeri, M. & Esfahani, M., (2000), "Evaluation of the effects of
changes in the reservoir level on the dynamic response of
CRFDs", Proceedings of the Fourth Conference of the dam
construction, 804-793.
[8] Haeri, M., & Ismaili, Sh., & Esfahani, M., (2007), "Dynamic
Analysis of CRFDs in two-dimensional and three-dimensional
conditions", Fifth International Conference on Seismology and
Earthquake Engineering (Tehran), 8-1.
[9] Wieland, M. (2007), Seismic Performance of CFRDs, Water
Power and Dam Construction, March.
[10] Bayraktar, A. and Krtal, M.E., (2010), “Linear and nonlinear
response of concrete slab on CFR dam during earthquake”,
Soil Dynamics and Earthquake Engineering 30, 990–1003.