seismic assessment of an existing hungarian highway...
TRANSCRIPT
Acta Technica Napocensis: Civil Engineering & Architecture Vol. 56, No. 2 (2013) Journal homepage: http://constructii.utcluj.ro/ActaCivilEng
Special Issue: First International Conference for PhD Students in Civil Engineering, CE-PhD 2012.
Seismic assessment of an existing Hungarian highway bridge
József Simon*1
, László Gergely Vigh2
1,2 Budapest University of Technology and Economics, Department of Structural Engineering
H-1521 Budapest, Műegyetem rkp. 3., Hungary
(Accepted 28 August 2013; Published online 30 September 2013)
Abstract
In this paper a case study of a typical Hungarian highway bridge is presented, illustrating the
seismic performance and damage evaluation method. The investigated large-span bridge consists of
continuous steel box-section superstructure supported by reinforced concrete piers. For the
analysis, a sophisticated beam-element numerical model is developed. Linear spectral response
analysis as well as non-linear static and cyclic analyses are invoked for the evaluation, then their
results are compared. The model incorporates non-linear characteristics of the critical details, such
as pier, pier-to-superstructure joints, etc. Pushover and incremental dynamic analysis using several
earthquake records is applied to determine the fragility curves reflecting the probability of various
damage occurrences. The analyses indicate that the most vulnerable component is the fixed
bearing, the collapse of the whole structure is caused by the local failure of the restrained pier, and
the structure provides relatively large extra resistance against seismic loads.
Keywords: Eurocode 8 analysis methods, time-history analysis, non-linear analysis, pushover
analysis, seismic assessment of continuous girder bridge, incremental dynamic analysis, fragility
curve
1. Introduction
In low or moderate seismicity regions, such as Hungary, bridges conventionally used to be designed
with no or minimal consideration of seismic loads. In 2006 a new seismic hazard map was released
with an increased seismic proneness, classifying Hungary as moderate seismic zone. According to
experiences on newly erected structures in the last decade [1], [2] and parametric study on typical
continuous girder bridges of Hungary [3], many of the girder bridges are vulnerable to earthquake
loads calculated in accordance with Eurocode 8 [4], [5] even in moderate seismic regions. Specific
components such as piers, foundations and bearings can suffer severe damage. Special care should
be taken in case of the assessment of existing structures because of the possible lack of knowledge
of material properties and stiffness values. In order to achieve sufficient seismic performance,
critical details and elements may have to be reinforced even though they would be safe in ultimate
limit state.
The global scope of our research is to evaluate the seismic performance and the expected damage
during the lifetime of existing and newly erected Hungarian bridges on the basis of performance
based design methodology [6]. Based on the results, possible retrofit methods for existing bridges
as well as proper design concept for newly erected bridges may be proposed.
* Corresponding author. Tel./ Fax.: +36 30 425 26 25
E-mail address: [email protected]

József Simon, László Gergely Vigh / Acta Technica Napocensis: Civil Engineering & Architecture Vol. 56 No 2 (2013) 43-57
44
In this paper which is a revised and extended version of a paper that was presented at CE-PhD 2012
[7], a typical continuous girder bridge, the M0 Háros highway bridge in Hungary is examined. A
three dimensional numerical model incorporating non-linear characteristics of the critical details is
developed in Open System for Earthquake Engineering Simulation FEM software (OpenSEES) [8].
According to EC 8-2 [5] conventional linear spectral response analysis is first carried out to
compute probable reaction forces and displacements. Secondly, to determine the collapse
mechanisms, non-linear static pushover analysis is applied. Finally, to capture the actual seismic
behavior of the bridge and to characterize the possible reserve capacity, non-linear time-history
analysis is completed. Based on the results, the critical structural components influencing the
overall seismic performance are determined. To evaluate the feasibility of the different analysis
methods, results are compared to each other on the level of internal forces in the critical elements.
Finally, incremental dynamic analysis based stochastic assessment is used to create fragility curves
of the critical components and to evaluate more precisely the actual seismic performance of the
bridge.
2. Bridge description
The case study bridge is a newly erected highway bridge over the Danube River for the M0
Motorway at Háros. The total length of the bridge is 770.42m (3x73,5m flood, 3x108,5m river and
3x73,5m flood bridges) and the total width of the deck is 21.80m (1.9m sidewalk + 18.0m
carriageway + 1.9m sidewalk). The river bridge is a continuous three span girder with a one-cell
box cross-section with inclined webs and an orthotropic deck. The flood bridges are three span
continuous composite bridges. The steel box is identical to that of the river bridge, but the deck is a
R.C. slab. The bridge is straight in plan. In this study only the river bridge is analyzed. The river
bridge shares two common piers with the flood bridges (pier 4 and pier 7) and is separated from the
flood bridges by a ±70 mm (pier 4) and a ±160 mm (pier 7) expansion joint. In the longitudinal
direction the girder of the river bridge is restrained only at pier 5. The longitudinal view of the
bridge can be seen in Figure 1.
Figure 1. Longitudinal section of the river bridge.
Table 1. Cross-sectional data.
Girder S1 S2 S3 S4
A [m2] 0.82 0.91 1.11 1.15
Iy [m4] 3.20 4.08 5.75 5.84
Iz [m4] 23.50 24.50 25.80 26.90
It [m4] 4.83 5.77 6.52 7.05
P4 S1 S2 S3 S4
A [m2] 23.7 27.4 36.4 108.0
Iy [m4] 14.1 11.9 23.4 393.0
Iz [m4] 486.0 432.0 518.0 2430.0
It [m4] 34.4 35.3 81.1 1170.0
P5 S1 S2 S3 S4
A [m2] 24.2 28.5 39.9 158.0
Iy [m4] 14.4 12.7 29.4 812.0
Iz [m4] 489.0 435.0 598.0 5350.0
It [m4] 35.7 39.4 101.0 2450.0
P6 S1 S2 S3 S4
A [m2] 24.2 28.5 39.9 158.0
Iy [m4] 14.4 12.7 29.4 812.0
Iz [m4] 489.0 435.0 598.0 5350.0
It [m4] 35.7 39.4 101.0 2450.0
P7 S1 S2 S3 S4
A [m2] 24.2 27.6 39.9 172.0
Iy [m4] 14.4 12.1 29.4 976.0
Iz [m4] 489.0 433.0 598.0 6230.0
It [m4] 35.7 36.1 101.0 2930.0

József Simon, László Gergely Vigh / Acta Technica Napocensis: Civil Engineering & Architecture Vol. 56 No 2 (2013) 43-57
45
Figure 2. Side-views of pier 5.
The steel grade of the box girder is S355, the piers are made of C35/45 concrete and the reinforcing
steel is grade S500B. The variable cross-section parameters of the box girder and the piers are listed
in Table 1. The two side-views of pier 5 are shown in Figure 2. The cross-sections are nearly the
same at each pier, only the pier height varies. The superstructure is fixed in the longitudinal
direction at pier 5, whereas one of the two bearings provides lateral restraint at each pier.
In accordance with Eurocode 8 Part 2, the applied seismic parameters are as follows: ground
acceleration of 0.1g, soil type C, importance class II, type 1 spectrum. The applied mass is
calculated from the dead loads and 1.0kN/m2
live load distributed on the carriageway. This leads to
an equivalent 146kN/m distributed line load along the length of the girder.
3. Numerical model
3.1. Global properties of the numerical model
According to the comprehensive literature overview of [9] on seismic numerical modeling of girder
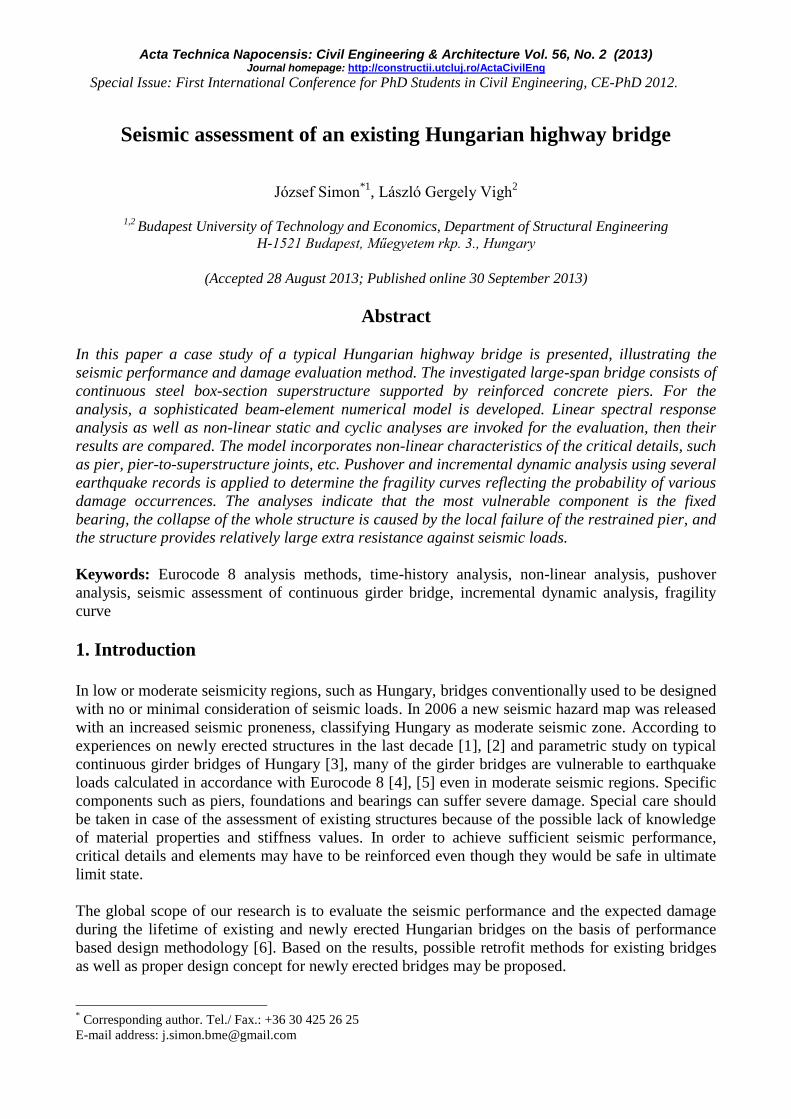
bridges, a three dimensional numerical model is developed in OpenSEES [8]. A schematic picture
of the numerical model can be seen in Figure 3.
The main structure, the girder and the piers are modeled by simple beam elements. The beam
elements are placed in the center of gravity, and eccentricity between the member axis – such as
axis of the superstructure and bearings placed on pier top – is bridged over by the help of rigid
elements. The same rigid elements are used to model the eccentricity of the pier foot and pile cap.
The bearings on the piers and the abutments are modeled by zero-length elements with linear or
non-linear spring characteristics - depending on the analysis type - assigned to three degrees of
freedom (ux, uy, uz), but rotations are free to develop.
Each node has six degrees of freedom. Beam mesh size is typically one meter along the girder and
the piers. This results in approximately 550 nodes (~3300 DOFs) and approximately 540 elements
applied in the final model, which is found sufficient to efficiently achieve results with an acceptable
accuracy.
Since linear and non-linear analyses are also invoked in our investigation two different models are
used which differ mainly in material models and material properties and are presented in the
József Simon, László Gergely Vigh / Acta Technica Napocensis: Civil Engineering & Architecture Vol. 56 No 2 (2013) 43-57
46
following sub-sections.
Figure 3. Numerical model of the bridge. Figure 4. Fiber section [10].
3.2. Linear model
Linear model (LM) is used for the linear response spectrum analysis and the linear time-history
analysis. In this case, geometric and material non-linearity is ignored. Accordingly, both the girder
and the piers are modeled with elastic beam elements. The cross-sectional properties can be seen in
Table 1. The elastic and shear moduli of the girder are: E=210GPa, G=80.77GPa; and of the
concrete piers are: E=32GPa, G=13.7GPa.
According to Hungarian design conventions, it is assumed that fixed bearings are fully rigid, while
expansion bearings provide no restraint in the model. (Note that, in the advanced analysis discussed
in the following sections influence of the actual rigidity of the bearings is investigated.) A linear
spring stiffness of 1e10N/m is adjusted to the fully rigid connections.
The soil-structure interaction at the foundations of the piers is taken into account with integrate
linear springs, adjusted with stiffness values (Table 3) calculated from foundation analysis.
Table 2. Bearing properties. Table 3. Foundation stiffness.
3.3. Non-linear model
Non-linear model (NLM) is used in case of push-over and non-linear time-history analyses as well
as for incremental dynamic analysis. As the girder is expected to remain elastic during a seismic
event, it is modeled with elastic beam element. However, due to the expected plastic deformations,
K1 [kN/mm] 70.0 14.0
K1 [kN/mm] 10.5 0.1
Fy [kN] 960 5
Type ExpansionFixedPier No. 4 5 6 7
Kx [MN/m] 4760 3850 3850 3070
Ky [MN/m] 5130 4550 4550 3220
Kφx [MNm/rad] 350000 500000 500000 350000
Kφx [MNm/rad] 111000 125000 125000 111000
József Simon, László Gergely Vigh / Acta Technica Napocensis: Civil Engineering & Architecture Vol. 56 No 2 (2013) 43-57
47
displacement based fiber section element is used (see Figure 4) for the piers.
The fibers have their own uniaxial stress–strain relationship. This way the cross-section is discretely
modeled, and the confined and unconfined concrete regions as well as the longitudinal steel
reinforcement can be taken into account. Since existing bridges are normally not designed for
seismic events, sufficient confinement cannot be assumed. Conservatively, only unconfined
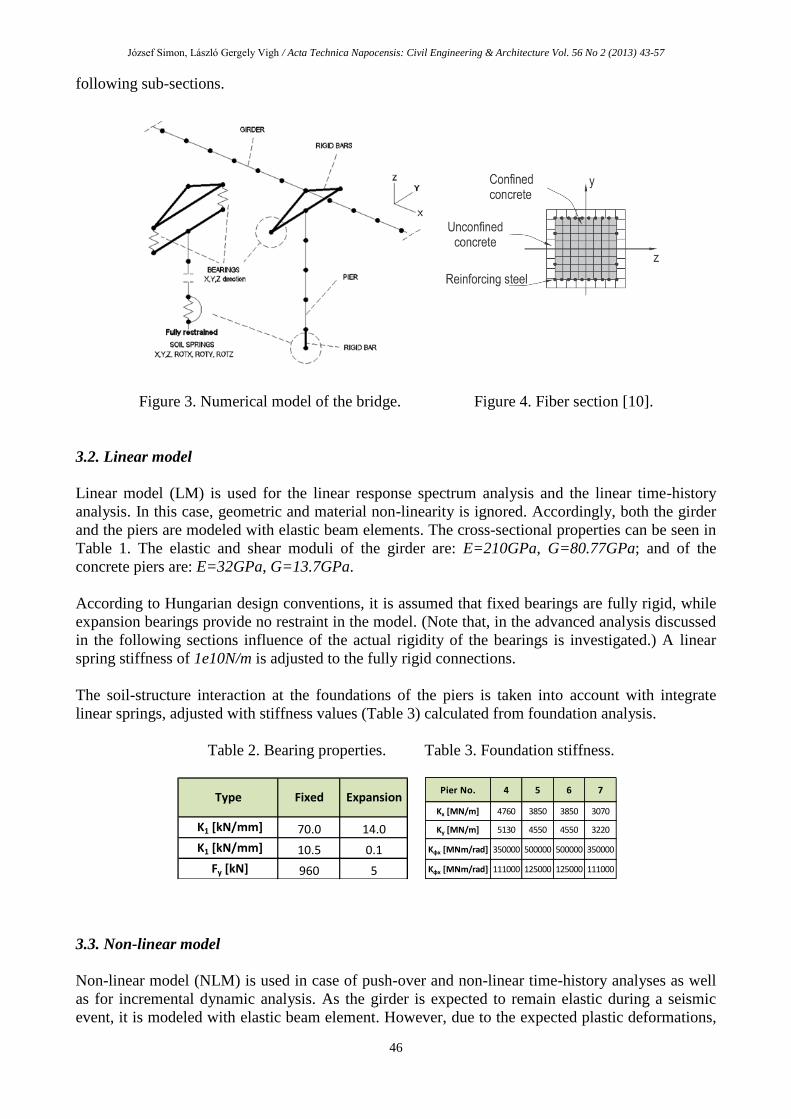
concrete properties are applied in the numerical model of the M0 Háros bridge. For the behavior of
reinforcing steel the Giuffré-Menegotto-Pinto model [11] (Steel02 material in OpenSEES, see
Figure 5), and for the behavior of concrete linear tension softening concrete material model [12]
(Concrete02 material model in OpenSEES, see Figure 6) is adopted. According to EC8, if non-
linear analysis is carried out material properties should be taken into account with mean values.
These values are calculated by assuming lognormal distribution and are presented in Table 4.
Figure 5. Giuffré-Menegotto-Pinto steel
model [10].
Figure 6. Linear tension softening concrete
model [10].
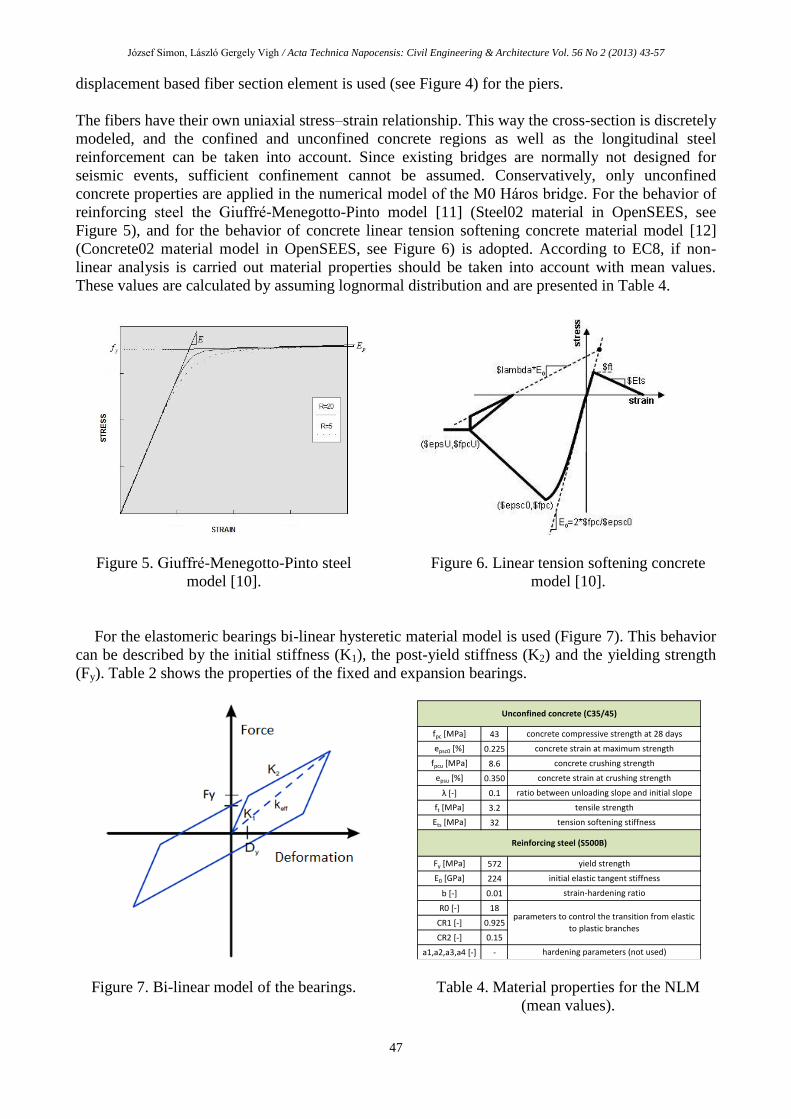
For the elastomeric bearings bi-linear hysteretic material model is used (Figure 7). This behavior
can be described by the initial stiffness (K1), the post-yield stiffness (K2) and the yielding strength
(Fy). Table 2 shows the properties of the fixed and expansion bearings.
Figure 7. Bi-linear model of the bearings. Table 4. Material properties for the NLM
(mean values).
fpc [MPa] 43
epsc0 [%] 0.225
fpcu [MPa] 8.6
epsu [%] 0.350
λ [-] 0.1
ft [MPa] 3.2
Ets [MPa] 32
Fy [MPa] 572
E0 [GPa] 224
b [-] 0.01
R0 [-] 18
CR1 [-] 0.925
CR2 [-] 0.15
a1,a2,a3,a4 [-] - hardening parameters (not used)
tensile strength
tension softening stiffness
Reinforcing steel (S500B)
yield strength
initial elastic tangent stiffness
strain-hardening ratio
parameters to control the transition from elastic
to plastic branches
ratio between unloading slope and initial slope
Unconfined concrete (C35/45)
concrete compressive strength at 28 days
concrete strain at maximum strength
concrete crushing strength
concrete strain at crushing strength

József Simon, László Gergely Vigh / Acta Technica Napocensis: Civil Engineering & Architecture Vol. 56 No 2 (2013) 43-57
48
Three damage states are defined in the NLM to evaluate the seismic performance of the structure
(see Section 5). The damage is measured in deformation and in curvature ductility (μ=φu/φy) in case
of the fixed bearing and the piers, respectively. The corresponding values are 50mm, 100mm,
150mm of deformation and μ = 1, 4 and 7 curvature ductility for slight, moderate and full damages.
These values are based on recommendations provided by HAZUS [13].
4. Comparison of analysis methods
The described linear (LM) and non-linear (NLM) models are applied for different analysis methods
and compared to each other. The major results are discussed in the following sections.
4.1. Linear response spectrum analysis (LRSA)
Linear response spectrum analysis is the most commonly used earthquake analysis method among
designers due to its relative simplicity and effectiveness. Original seismic design of the investigated
structure was also made by LRSA. In the linear analysis, geometric and material non-linearity is
ignored. Here the spring stiffness of the fixed bearings is set to model fully rigid connection. The
effect of this modeling approximation is later investigated.
The linear dynamic analysis is carried out in accordance to EC8-2 [5]. The behavior factor (q) is 1.5
for the continuous girder (superstructure) as well as for the pier walls, and q = 1.0 shall be used for
the analysis and design of the bearings, abutments and foundations. The parameters of the standard
acceleration response spectrum curve are: ag = 1.0m/s2, soil type C, M > 5.5, ξ = 0.05. The applied
spectrums can be seen in Figure 8. Typical modal shapes and frequencies, obtained from the modal
analysis, are illustrated in Figure 9. For typical continuous girder bridges with relatively flexible
piers the first fundamental mode shape normally represents longitudinal motions [3]. In our case the
piers stand in the Danube River, accordingly the cross-sections are robust, so the vertical stiffness
of the girder is less than the longitudinal stiffness of the structure.
The internal and reaction forces are calculated by the CQC method. Results for the bearings and for
the piers are summarized in Table 5. According to the analysis, the critical structural components
are the longitudinally restrained pier 5 and its fixed bearings. The results show good accordance
with [3].
Figure 8. Applied standard response spectra. Figure 9. Typical modal shapes.
Here, only the representative results of the critical components are presented. The longitudinal (My)
and transversal (Mx) moments of the longitudinally restrained pier are 229907kNm and 275367kNm,
while the longitudinal (Fx) and transversal (Fy) reaction forces of the fixed bearing are 5075kN and
7809kN. The maximum displacements are 27mm and 36mm in the transversal (y) and longitudinal
(x) directions, respectively; while the maximum deflection (mostly from the dead loads; in z
direction) is 247mm.
József Simon, László Gergely Vigh / Acta Technica Napocensis: Civil Engineering & Architecture Vol. 56 No 2 (2013) 43-57
49
4.2. Linear time-history analysis (LTHA)
With time-history analysis the seismic behavior can be revealed more precisely since the structure
is analyzed in the time domain in contrast to LRSA which generally overestimates the reaction
forces in a conservative manner.
A new algorithm is developed in MATLAB [14] to create artificial acceleration records for time-
history analysis. The records are determined to follow the given standard spectral acceleration curve
(see Section 4.1. and Figure 8) within a defined range. According to EC 8-2, the 5%-damped elastic
response spectrum of the design seismic action shall be used for the fitting and the defined period
range is between 0,2T1 and 1,5T1, where T1 is the natural period of the fundamental mode of the
structure. The difference between the original spectrum curve and the responses of the artificial
record should be less than 10%.
In preliminary study, the authors investigated the applicability of different artificial seismic record
creation algorithms satisfying the EC criteria and found that the restriction of the fitting range is not
sufficient if several modes are relevant, e.g. in the lateral direction. To bridge over this problem, the
authors developed a new algorithm providing good matching in any period ranges.
The main idea of the algorithm is presented here. Common methods are based on minimizing the
differences between the artificial motion’s response spectrum and target spectrum in a least-square
sense. Despite, the basic idea of the algorithm developed by the authors is to define the A amplitude
vector (see Eq. 1) through iteration procedure. The function of the ground acceleration is assumed
to be the sum of independent cosine waves with different frequency, amplitude and period shift.
Therefore the following form is obtained:
, (1)
where Ai is the amplitude of the i-th cosine wave (initially 1.0 for each member), ωi is calculated
from the i-th natural period defined in advance:
, (2)
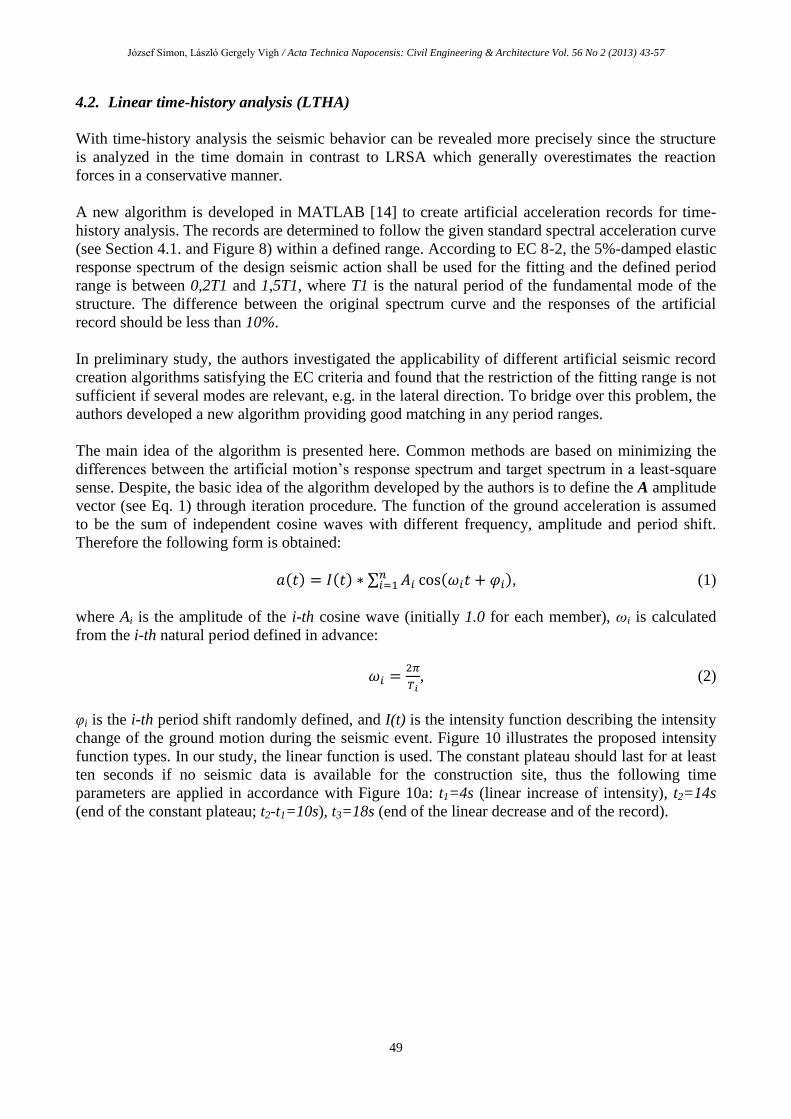
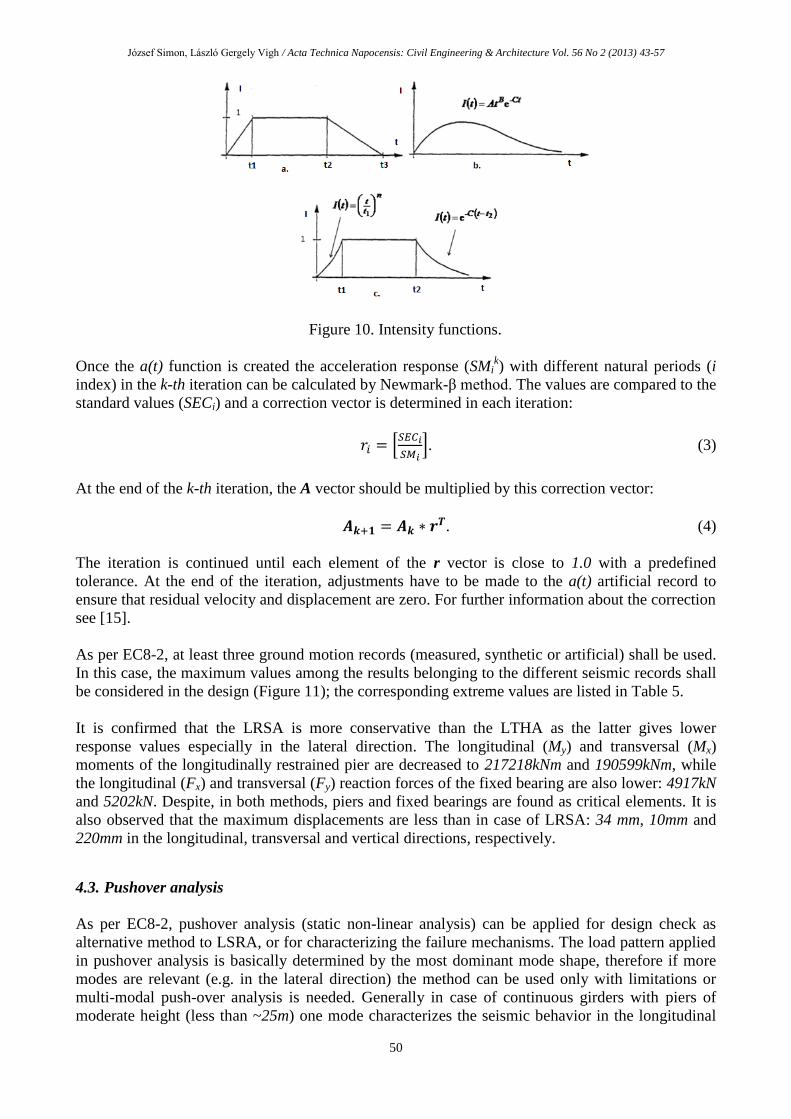
φi is the i-th period shift randomly defined, and I(t) is the intensity function describing the intensity
change of the ground motion during the seismic event. Figure 10 illustrates the proposed intensity
function types. In our study, the linear function is used. The constant plateau should last for at least
ten seconds if no seismic data is available for the construction site, thus the following time
parameters are applied in accordance with Figure 10a: t1=4s (linear increase of intensity), t2=14s
(end of the constant plateau; t2-t1=10s), t3=18s (end of the linear decrease and of the record).
József Simon, László Gergely Vigh / Acta Technica Napocensis: Civil Engineering & Architecture Vol. 56 No 2 (2013) 43-57
50
Figure 10. Intensity functions.
Once the a(t) function is created the acceleration response (SMik) with different natural periods (i
index) in the k-th iteration can be calculated by Newmark-β method. The values are compared to the
standard values (SECi) and a correction vector is determined in each iteration:
. (3)
At the end of the k-th iteration, the A vector should be multiplied by this correction vector:
. (4)
The iteration is continued until each element of the r vector is close to 1.0 with a predefined
tolerance. At the end of the iteration, adjustments have to be made to the a(t) artificial record to
ensure that residual velocity and displacement are zero. For further information about the correction
see [15].
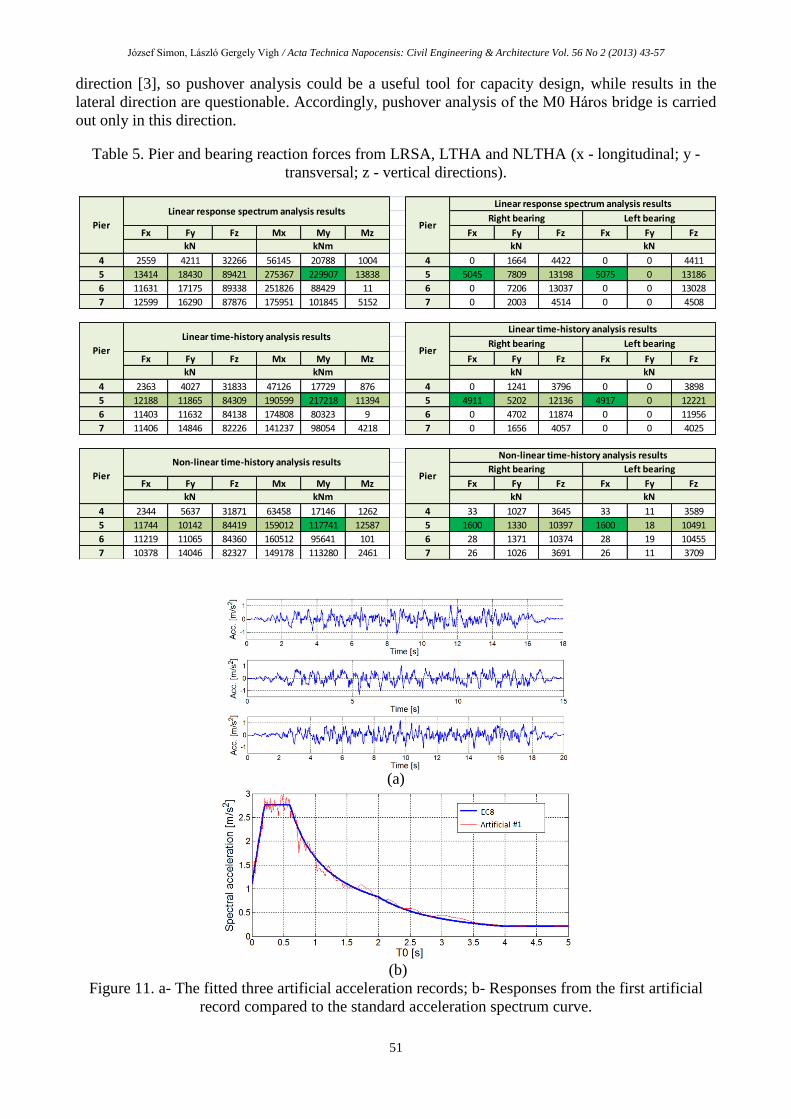
As per EC8-2, at least three ground motion records (measured, synthetic or artificial) shall be used.
In this case, the maximum values among the results belonging to the different seismic records shall
be considered in the design (Figure 11); the corresponding extreme values are listed in Table 5.
It is confirmed that the LRSA is more conservative than the LTHA as the latter gives lower
response values especially in the lateral direction. The longitudinal (My) and transversal (Mx)
moments of the longitudinally restrained pier are decreased to 217218kNm and 190599kNm, while
the longitudinal (Fx) and transversal (Fy) reaction forces of the fixed bearing are also lower: 4917kN
and 5202kN. Despite, in both methods, piers and fixed bearings are found as critical elements. It is
also observed that the maximum displacements are less than in case of LRSA: 34 mm, 10mm and
220mm in the longitudinal, transversal and vertical directions, respectively.
4.3. Pushover analysis
As per EC8-2, pushover analysis (static non-linear analysis) can be applied for design check as
alternative method to LSRA, or for characterizing the failure mechanisms. The load pattern applied
in pushover analysis is basically determined by the most dominant mode shape, therefore if more
modes are relevant (e.g. in the lateral direction) the method can be used only with limitations or
multi-modal push-over analysis is needed. Generally in case of continuous girders with piers of
moderate height (less than ~25m) one mode characterizes the seismic behavior in the longitudinal
József Simon, László Gergely Vigh / Acta Technica Napocensis: Civil Engineering & Architecture Vol. 56 No 2 (2013) 43-57
51
direction [3], so pushover analysis could be a useful tool for capacity design, while results in the
lateral direction are questionable. Accordingly, pushover analysis of the M0 Háros bridge is carried
out only in this direction.
Table 5. Pier and bearing reaction forces from LRSA, LTHA and NLTHA (x - longitudinal; y -
transversal; z - vertical directions).
(a)
(b)
Figure 11. a- The fitted three artificial acceleration records; b- Responses from the first artificial
record compared to the standard acceleration spectrum curve.
Fx Fy Fz Mx My Mz Fx Fy Fz Fx Fy Fz
4 2559 4211 32266 56145 20788 1004 4 0 1664 4422 0 0 4411
5 13414 18430 89421 275367 229907 13838 5 5045 7809 13198 5075 0 13186
6 11631 17175 89338 251826 88429 11 6 0 7206 13037 0 0 13028
7 12599 16290 87876 175951 101845 5152 7 0 2003 4514 0 0 4508
Fx Fy Fz Mx My Mz Fx Fy Fz Fx Fy Fz
4 2363 4027 31833 47126 17729 876 4 0 1241 3796 0 0 3898
5 12188 11865 84309 190599 217218 11394 5 4911 5202 12136 4917 0 12221
6 11403 11632 84138 174808 80323 9 6 0 4702 11874 0 0 11956
7 11406 14846 82226 141237 98054 4218 7 0 1656 4057 0 0 4025
Fx Fy Fz Mx My Mz Fx Fy Fz Fx Fy Fz
4 2344 5637 31871 63458 17146 1262 4 33 1027 3645 33 11 3589
5 11744 10142 84419 159012 117741 12587 5 1600 1330 10397 1600 18 10491
6 11219 11065 84360 160512 95641 101 6 28 1371 10374 28 19 10455
7 10378 14046 82327 149178 113280 2461 7 26 1026 3691 26 11 3709
kNm
Linear response spectrum analysis results
kN
Pier
Pier
Pier
kN kNm
Non-linear time-history analysis results
Linear time-history analysis results
kN kNm
Pier
Linear response spectrum analysis results
Right bearing Left bearing
kN kN
Pier
Linear time-history analysis results
Right bearing Left bearing
kN kN
Pier
Non-linear time-history analysis results
Right bearing Left bearing
kN kN
József Simon, László Gergely Vigh / Acta Technica Napocensis: Civil Engineering & Architecture Vol. 56 No 2 (2013) 43-57
52
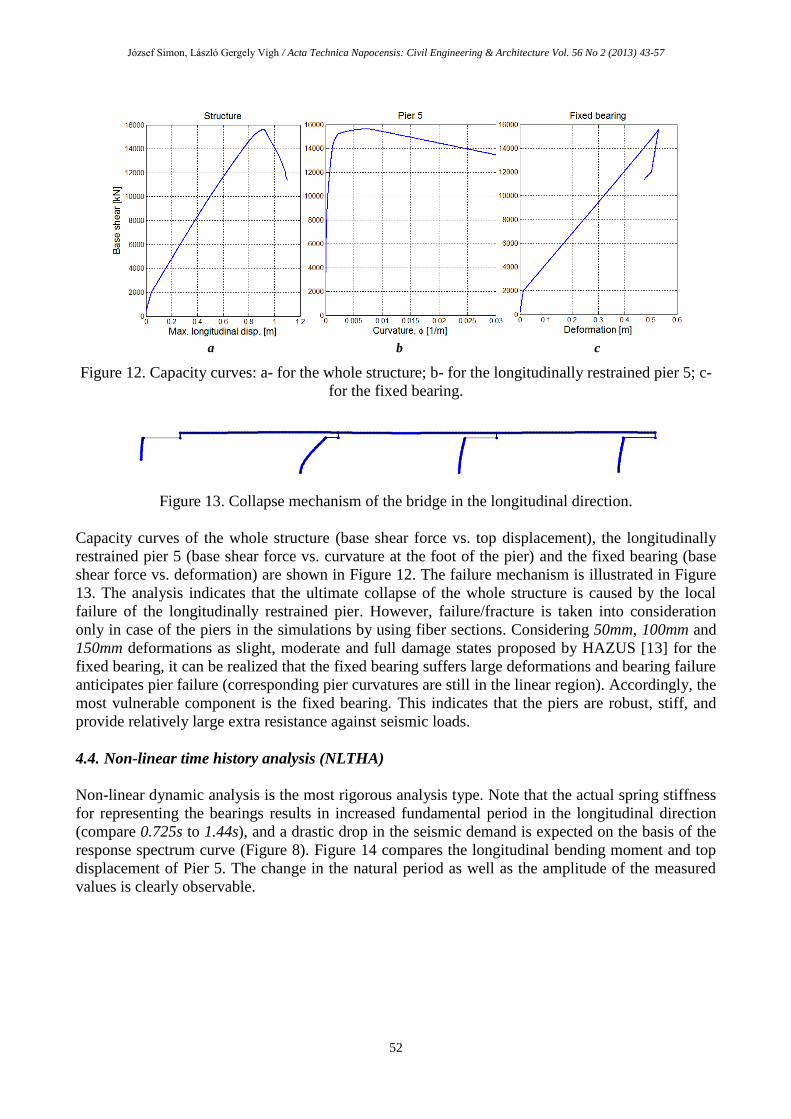
a b c
Figure 12. Capacity curves: a- for the whole structure; b- for the longitudinally restrained pier 5; c-
for the fixed bearing.
Figure 13. Collapse mechanism of the bridge in the longitudinal direction.
Capacity curves of the whole structure (base shear force vs. top displacement), the longitudinally
restrained pier 5 (base shear force vs. curvature at the foot of the pier) and the fixed bearing (base
shear force vs. deformation) are shown in Figure 12. The failure mechanism is illustrated in Figure
13. The analysis indicates that the ultimate collapse of the whole structure is caused by the local
failure of the longitudinally restrained pier. However, failure/fracture is taken into consideration
only in case of the piers in the simulations by using fiber sections. Considering 50mm, 100mm and
150mm deformations as slight, moderate and full damage states proposed by HAZUS [13] for the
fixed bearing, it can be realized that the fixed bearing suffers large deformations and bearing failure
anticipates pier failure (corresponding pier curvatures are still in the linear region). Accordingly, the
most vulnerable component is the fixed bearing. This indicates that the piers are robust, stiff, and
provide relatively large extra resistance against seismic loads.
4.4. Non-linear time history analysis (NLTHA)
Non-linear dynamic analysis is the most rigorous analysis type. Note that the actual spring stiffness
for representing the bearings results in increased fundamental period in the longitudinal direction
(compare 0.725s to 1.44s), and a drastic drop in the seismic demand is expected on the basis of the
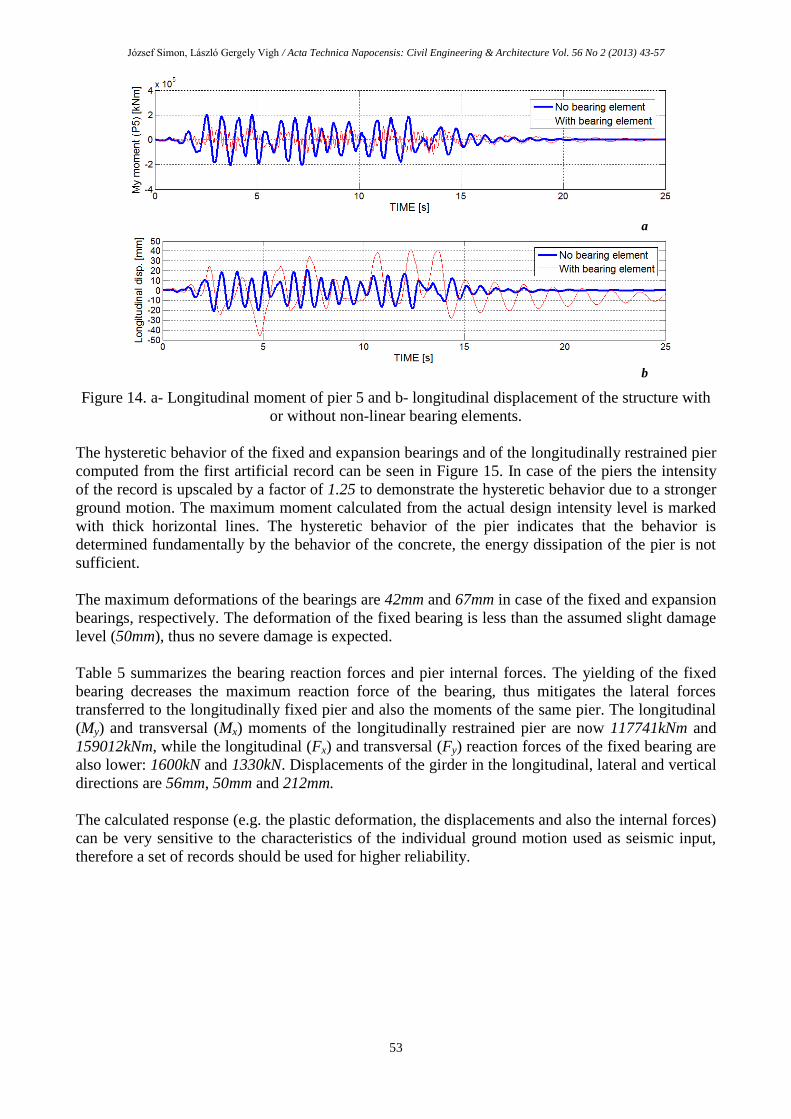
response spectrum curve (Figure 8). Figure 14 compares the longitudinal bending moment and top
displacement of Pier 5. The change in the natural period as well as the amplitude of the measured
values is clearly observable.
József Simon, László Gergely Vigh / Acta Technica Napocensis: Civil Engineering & Architecture Vol. 56 No 2 (2013) 43-57
53
a
b
Figure 14. a- Longitudinal moment of pier 5 and b- longitudinal displacement of the structure with
or without non-linear bearing elements.
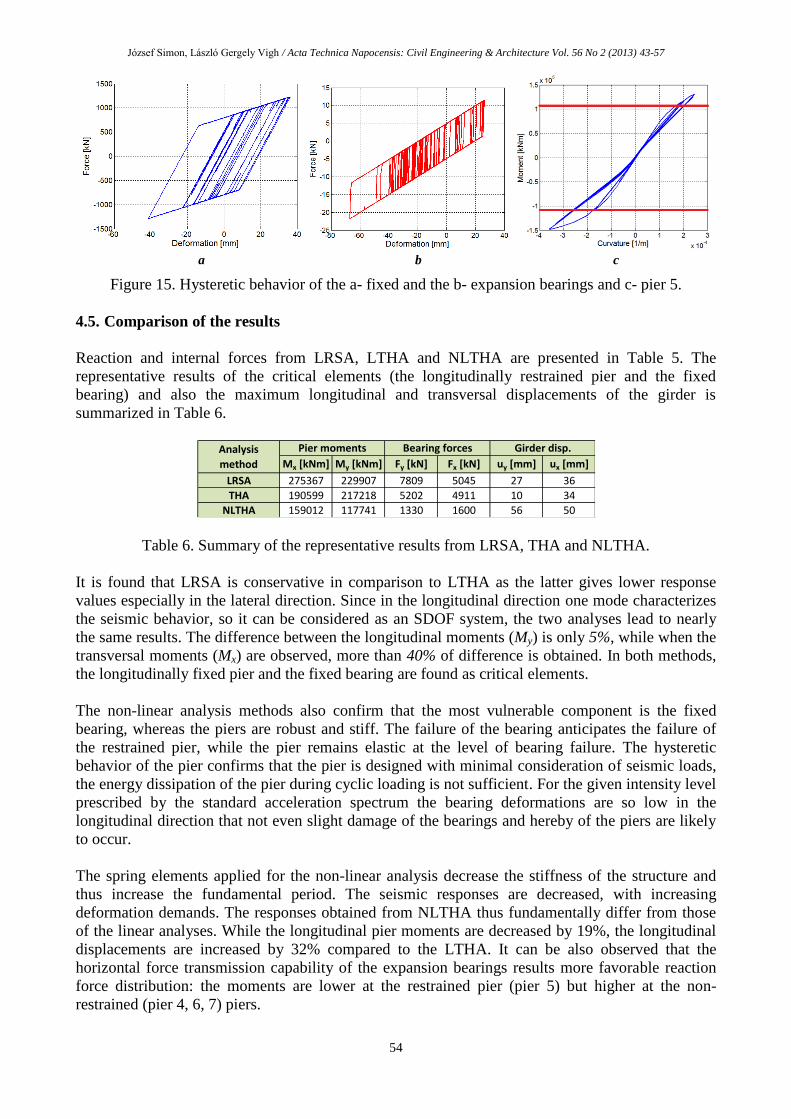
The hysteretic behavior of the fixed and expansion bearings and of the longitudinally restrained pier
computed from the first artificial record can be seen in Figure 15. In case of the piers the intensity
of the record is upscaled by a factor of 1.25 to demonstrate the hysteretic behavior due to a stronger
ground motion. The maximum moment calculated from the actual design intensity level is marked
with thick horizontal lines. The hysteretic behavior of the pier indicates that the behavior is
determined fundamentally by the behavior of the concrete, the energy dissipation of the pier is not
sufficient.
The maximum deformations of the bearings are 42mm and 67mm in case of the fixed and expansion
bearings, respectively. The deformation of the fixed bearing is less than the assumed slight damage
level (50mm), thus no severe damage is expected.
Table 5 summarizes the bearing reaction forces and pier internal forces. The yielding of the fixed
bearing decreases the maximum reaction force of the bearing, thus mitigates the lateral forces
transferred to the longitudinally fixed pier and also the moments of the same pier. The longitudinal
(My) and transversal (Mx) moments of the longitudinally restrained pier are now 117741kNm and
159012kNm, while the longitudinal (Fx) and transversal (Fy) reaction forces of the fixed bearing are
also lower: 1600kN and 1330kN. Displacements of the girder in the longitudinal, lateral and vertical
directions are 56mm, 50mm and 212mm.
The calculated response (e.g. the plastic deformation, the displacements and also the internal forces)
can be very sensitive to the characteristics of the individual ground motion used as seismic input,
therefore a set of records should be used for higher reliability.
József Simon, László Gergely Vigh / Acta Technica Napocensis: Civil Engineering & Architecture Vol. 56 No 2 (2013) 43-57
54
a b c
Figure 15. Hysteretic behavior of the a- fixed and the b- expansion bearings and c- pier 5.
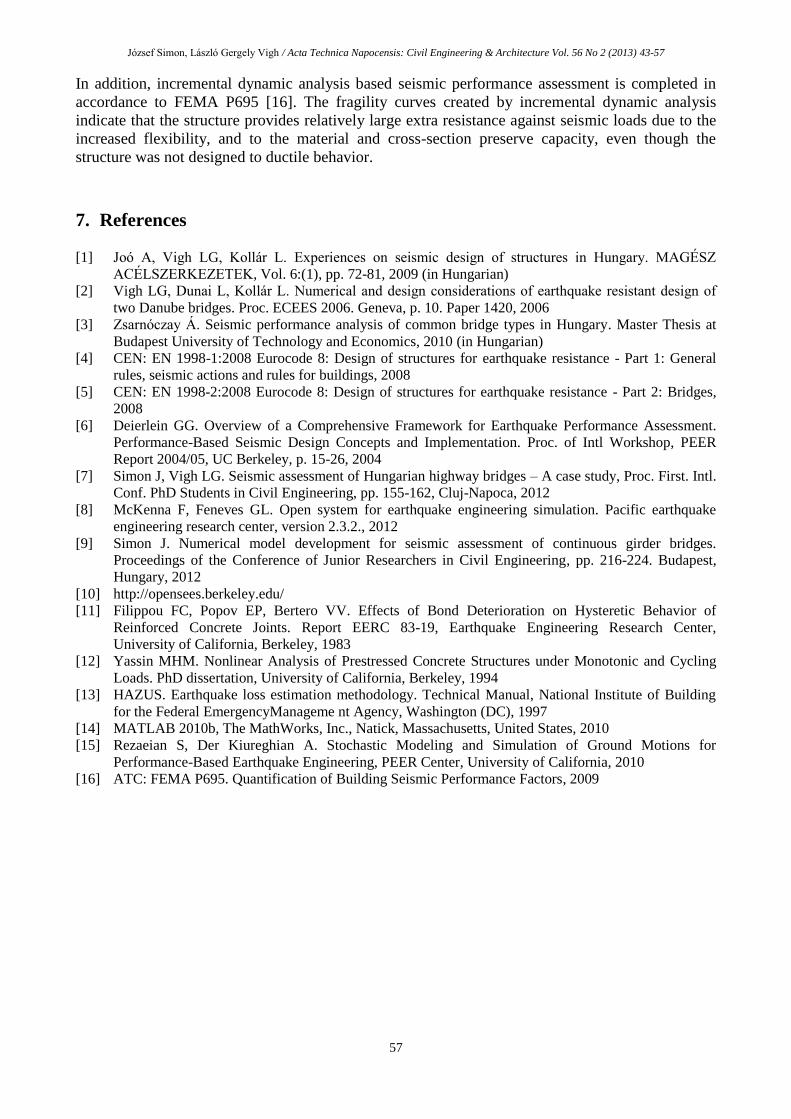
4.5. Comparison of the results
Reaction and internal forces from LRSA, LTHA and NLTHA are presented in Table 5. The
representative results of the critical elements (the longitudinally restrained pier and the fixed
bearing) and also the maximum longitudinal and transversal displacements of the girder is
summarized in Table 6.
Table 6. Summary of the representative results from LRSA, THA and NLTHA.
It is found that LRSA is conservative in comparison to LTHA as the latter gives lower response
values especially in the lateral direction. Since in the longitudinal direction one mode characterizes
the seismic behavior, so it can be considered as an SDOF system, the two analyses lead to nearly
the same results. The difference between the longitudinal moments (My) is only 5%, while when the
transversal moments (Mx) are observed, more than 40% of difference is obtained. In both methods,
the longitudinally fixed pier and the fixed bearing are found as critical elements.
The non-linear analysis methods also confirm that the most vulnerable component is the fixed
bearing, whereas the piers are robust and stiff. The failure of the bearing anticipates the failure of
the restrained pier, while the pier remains elastic at the level of bearing failure. The hysteretic
behavior of the pier confirms that the pier is designed with minimal consideration of seismic loads,
the energy dissipation of the pier during cyclic loading is not sufficient. For the given intensity level
prescribed by the standard acceleration spectrum the bearing deformations are so low in the
longitudinal direction that not even slight damage of the bearings and hereby of the piers are likely
to occur.
The spring elements applied for the non-linear analysis decrease the stiffness of the structure and
thus increase the fundamental period. The seismic responses are decreased, with increasing
deformation demands. The responses obtained from NLTHA thus fundamentally differ from those
of the linear analyses. While the longitudinal pier moments are decreased by 19%, the longitudinal
displacements are increased by 32% compared to the LTHA. It can be also observed that the
horizontal force transmission capability of the expansion bearings results more favorable reaction
force distribution: the moments are lower at the restrained pier (pier 5) but higher at the non-
restrained (pier 4, 6, 7) piers.
Mx [kNm] My [kNm] Fy [kN] Fx [kN] uy [mm] ux [mm]
LRSA 275367 229907 7809 5045 27 36
THA 190599 217218 5202 4911 10 34
NLTHA 159012 117741 1330 1600 56 50
Girder disp.Analysis
method
Pier moments Bearing forces

József Simon, László Gergely Vigh / Acta Technica Napocensis: Civil Engineering & Architecture Vol. 56 No 2 (2013) 43-57
55
5. Incremental dynamic analysis (IDA)
The analysis methods discussed in the previous sections can highlight the most vulnerable
components and details of the structure and they provide results for a given intensity level, but do
not characterize the probability of failure of the structure. This probability can be expressed by
creating the fragility curves of different components or the whole structure. The seismic
performance can be very sensitive to the characteristics of the individual acceleration record.
Following the instructions of FEMA P695 [16] document, incremental dynamic analysis is invoked
using a set of 44 different ground motions. The earthquake records are sampled to provide a very
diverse accelerogram set. First, this set is normalized by the peak ground velocities so that the
variance of each record is reduced to an acceptable level. The normalized set then is scaled the way
that the median acceleration response spectrum of the set equals the response spectrum used for the
design at the fundamental period of the structure. The procedure is illustrated in Figure 16, where
the scaling is completed at a period of 1.44s, which corresponds to the dominant natural period of
the non-linear model in the longitudinal direction. The analysis is carried out only in the critical
longitudinal direction.
Figure 16. Response of the set of ground motion records scaled to a pre-defined spectral
acceleration level at T=1.44s.
At each scaling level the maximum longitudinal displacement of the girder, the maximum curvature
of the bottom section of the fixed pier and the fixed bearing deformation is registered for each
ground motion. The displacement vs. spectral intensity – defined as the spectral acceleration –
relation for each record is shown in Figure 17. Plateau of the curve corresponding to a seismic
record (meaning rapidly increased deformations) indicates the structural collapse for the given
record. Three damage levels (slight, moderate and full) are determined for each structural
component. The damage is measured in deformation and in curvature ductility (μ=φu/φy) in case of
the fixed bearing and the piers, respectively. The corresponding values are 50mm, 100mm, 150mm
of deformation and μ = 1, 4 and 7 curvature ductility for slight, moderate and full damages. These
values are based on recommendations provided by HAZUS [13]. According to this, fragility curves
are created and shown in Figure 18.
The curves confirm the previous observation as the most vulnerable component in collapse
prevention performance objective is the fixed bearing: the failure of the whole structure is
determined by the full damage of the bearing (Figure 18 thick, solid line). Piers are so robust that
they do not even suffer slight damage when the bearing is failed.

József Simon, László Gergely Vigh / Acta Technica Napocensis: Civil Engineering & Architecture Vol. 56 No 2 (2013) 43-57
56
Figure 17. Maximum longitudinal displacement values from each ground motion record at different
spectral acceleration levels.
Figure 18. Fragility curves (slight, moderate and full damage) for the fixed bearing and the
longitudinally restrained pier.
The standard spectral acceleration at the fundamental period (1.44s) is 1.175m/s2. The curves
indicate that the actual seismic performance of the structure is sufficient: relatively large extra
resistance against seismic loads is provided by the preserve material and cross-section capacities,
even though the structure was not designed to ductile behavior.
The authors emphasize that the analysis is completed only to the longitudinal motions. Performance
of the pier can be sensitive to the accompanying lateral effects and thus three-dimensional seismic
analysis is necessary to investigate the actual failure probability.
6. Concluding remarks
In this paper the M0 Háros highway bridge in Hungary is investigated. Linear and non-linear
analyses are carried out and compared to each other. The results confirm that the most vulnerable
component is the fixed bearing, anticipating the failure of the restrained pier. Comparison of the
analysis results shows that the LRSA overestimates the reaction forces and displacements compared
to the LTHA, NLTHA methods. Using more sophisticated model incorporating non-linear elements
results in more flexible structure, with decreased reaction forces and increased deformations.
József Simon, László Gergely Vigh / Acta Technica Napocensis: Civil Engineering & Architecture Vol. 56 No 2 (2013) 43-57
57
In addition, incremental dynamic analysis based seismic performance assessment is completed in
accordance to FEMA P695 [16]. The fragility curves created by incremental dynamic analysis
indicate that the structure provides relatively large extra resistance against seismic loads due to the
increased flexibility, and to the material and cross-section preserve capacity, even though the
structure was not designed to ductile behavior.
7. References [1] Joó A, Vigh LG, Kollár L. Experiences on seismic design of structures in Hungary. MAGÉSZ
ACÉLSZERKEZETEK, Vol. 6:(1), pp. 72-81, 2009 (in Hungarian)
[2] Vigh LG, Dunai L, Kollár L. Numerical and design considerations of earthquake resistant design of
two Danube bridges. Proc. ECEES 2006. Geneva, p. 10. Paper 1420, 2006
[3] Zsarnóczay Á. Seismic performance analysis of common bridge types in Hungary. Master Thesis at
Budapest University of Technology and Economics, 2010 (in Hungarian)
[4] CEN: EN 1998-1:2008 Eurocode 8: Design of structures for earthquake resistance - Part 1: General
rules, seismic actions and rules for buildings, 2008
[5] CEN: EN 1998-2:2008 Eurocode 8: Design of structures for earthquake resistance - Part 2: Bridges,
2008
[6] Deierlein GG. Overview of a Comprehensive Framework for Earthquake Performance Assessment.
Performance-Based Seismic Design Concepts and Implementation. Proc. of Intl Workshop, PEER
Report 2004/05, UC Berkeley, p. 15-26, 2004
[7] Simon J, Vigh LG. Seismic assessment of Hungarian highway bridges – A case study, Proc. First. Intl.
Conf. PhD Students in Civil Engineering, pp. 155-162, Cluj-Napoca, 2012
[8] McKenna F, Feneves GL. Open system for earthquake engineering simulation. Pacific earthquake
engineering research center, version 2.3.2., 2012
[9] Simon J. Numerical model development for seismic assessment of continuous girder bridges.
Proceedings of the Conference of Junior Researchers in Civil Engineering, pp. 216-224. Budapest,
Hungary, 2012
[10] http://opensees.berkeley.edu/
[11] Filippou FC, Popov EP, Bertero VV. Effects of Bond Deterioration on Hysteretic Behavior of
Reinforced Concrete Joints. Report EERC 83-19, Earthquake Engineering Research Center,
University of California, Berkeley, 1983
[12] Yassin MHM. Nonlinear Analysis of Prestressed Concrete Structures under Monotonic and Cycling
Loads. PhD dissertation, University of California, Berkeley, 1994
[13] HAZUS. Earthquake loss estimation methodology. Technical Manual, National Institute of Building
for the Federal EmergencyManageme nt Agency, Washington (DC), 1997
[14] MATLAB 2010b, The MathWorks, Inc., Natick, Massachusetts, United States, 2010
[15] Rezaeian S, Der Kiureghian A. Stochastic Modeling and Simulation of Ground Motions for
Performance-Based Earthquake Engineering, PEER Center, University of California, 2010
[16] ATC: FEMA P695. Quantification of Building Seismic Performance Factors, 2009