seismic design of a slope stabilization work using piles ... papers/sanchez lizarraga... · seismic...
TRANSCRIPT
6th International Conference on Earthquake Geotechnical Engineering 1-4 November 2015 Christchurch, New Zealand
Seismic Design of a Slope Stabilization Work Using Piles and Tendons
H. Sanchez Lizarraga1
ABSTRACT
Seismic slope stability is usually addressed in design practice using pseudo-static approaches or
simplified dynamic methods of the Newmark type. However, these methodologies lead to over conservative solutions when a combination of different construction technologies is adopted. The study presents the design process for a stabilization solution of a slope supporting critical facilities (oil industry). In order to meet predefined limit states criteria, a combination of retaining wall, large diameter piles, and active tendons is used. Therefore, dynamic fully nonlinear two-dimensional analyses were performed to determine dimensions and reinforcing of the structural elements, as well as seismic induced displacements and settlements. The different contributions of piles and tendons to the overall stability of the slope during the ground motion are investigated. It is shown that, for the specific case study, in addition to the large diameter piles, the tendons play a crucial role after the initial phase of the earthquake.
Introduction
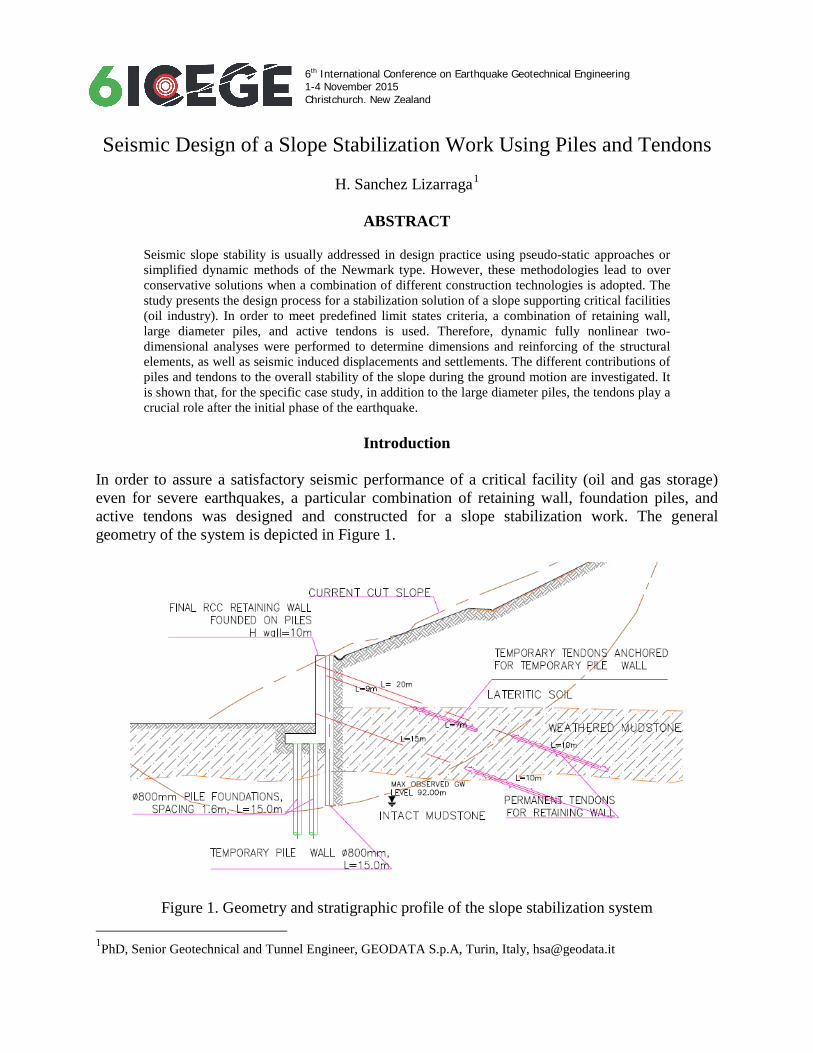
In order to assure a satisfactory seismic performance of a critical facility (oil and gas storage) even for severe earthquakes, a particular combination of retaining wall, foundation piles, and active tendons was designed and constructed for a slope stabilization work. The general geometry of the system is depicted in Figure 1.
Figure 1. Geometry and stratigraphic profile of the slope stabilization system 1PhD, Senior Geotechnical and Tunnel Engineer, GEODATA S.p.A, Turin, Italy, [email protected]
From the early stages of the project, it was clear that using pseudo-static methods would produce over conservative and inconsistent results. For this reason, advanced numerical analyses were performed using spectrum-compatible natural ground motions. The simulations allowed investigating the different contributions of wall, piles and tendons during and after the seismic shaking. Although limited to the specific case study herein examined, the results provide an interesting insight into the seismic behavior of a non-conventional geotechnical construction work. The following sections of the paper address the details of the design and verification process. Geotechnical Characterization
The main parameters of the geotechnical units adopted for the stability analyses, based on the available data, are shown in Table 1.
Table 1. Geotechnical parameters adopted.
Layer γ
[kN/m3]
γsat
[kN/m3]
φ’
[°]
c’
[kPa]
Lateritic soil 18.5 20 28 5
Weathered mudstone 18.5 20 24 8
Intact mudstone 18.5 20 26 35
Seismic Hazard at the Site Given the critical content of the facilities, a seismicity level corresponding to 975 years return period was associated with a Degree II (repairable) level of damage according to PIANC (2001), Table 2. A site specific Probabilistic Seismic Hazard Analysis (PSHA) provided the Uniform Hazard Spectrum (UHS) used in this study. Based on the results from the PSHA (both UHS and deaggregation) a set of natural accelerograms to be used as input ground motions in the dynamic analyses was selected.
Table 2. Acceptable level of damage in performance-based design (adapted from PIANC, 2001).
Level of damage Structural Operational
Degree I: Serviceable Minor or no damage Little or no loss of
serviceability
Degree II: Repairable Controlled damage Short term loss of
serviceability
Degree III: Near collapse Extensive damage in near collapse
Long-term or complete loss of serviceability
Degree IV: Collapse Complete loss of
structure Complete loss of
serviceability

Spectrum Compatible Natural Records for Dynamic Analyses All the ground motions were recorded on rock (or stiff site) and were retrieved from the PEER NGA Database (Chiou et al. 2008). Afterwards, baseline correction and high-frequency filtering was applied to all selected records using a dedicated software (SeismoSoft, 2010). Figure 2 shows the elastic response spectra of the 7 accelerograms for the 975-year return period together with their mean spectrum. The figure also shows the compatibility of the mean response spectrum of the selected natural records (pertaining to the 975-year return period) to the UHS at the site.
Figure 2. Elastic response spectra of the 7 accelerograms for the 975-year return period along with the mean spectrum of the set (5% damping ratio)
Numerical Model
A two-dimensional nonlinear finite difference model of the slope-retaining wall system was developed using FLAC 2D (ITASCA, 2000). The overall dimensions of the model are 100 m (length) x 50 m (depth). It is important to recall that, for dynamic analyses, the size of the grid elements is controlled by the soil shear wave velocity. For this reason, in this study, the largest grid element measures 1 m x 0.75 m. The soil was idealized using a Mohr-Coulomb constitutive model, together with the degradation curve by Sun et al. (1988). Moreover, in order to completely damp out high-frequency components, a small amount of stiffness proportional Rayleigh damping was used in conjunction with hysteretic damping. For this study a value of 0.2% at the dominant frequency was assigned. Absorbing boundaries modelled using Lysmer-Kuhlemeyer (1969) formulation were assigned at the bottom of the grid, while free-field boundaries were used at both sides. The following construction stages were considered: a) Geostatic (static equilibrium computation); b) Pile wall construction; c) Temporary excavation (Figure 3); d) Installation of temporary tendons; e) Complete excavation (Figure 4); f) Foundation piles construction; g) Retaining wall construction (Figure 5); h) Installation of final tendons. Finally, the dynamic analyses were performed after the last construction stage.
0 0.5 1 1.5 2 2.5 30
2
4
6
8
10
12
14
16
18
20
Period [s]
Sa [m
/s2 ]
975 years return period
Mean Response spectra of setUHS for 975 yearsResponse spectrum of individual input
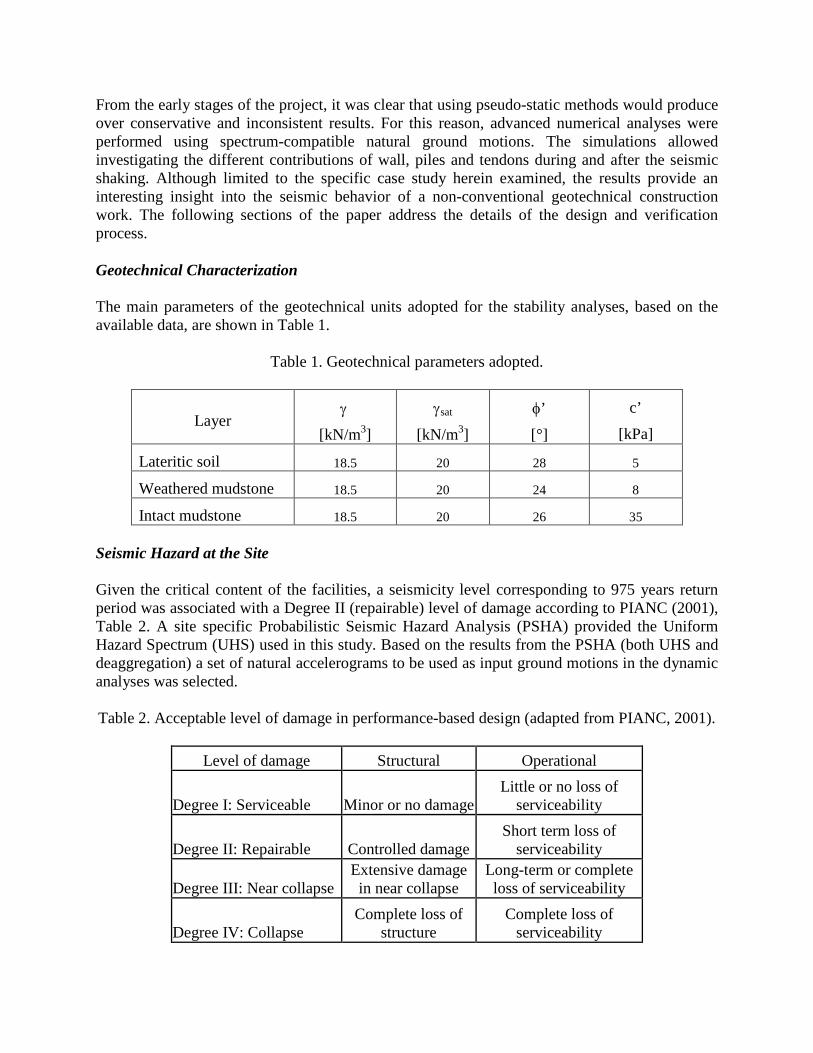
a) b)
Figure 3 a) Horizontal displacements after temporary excavation (3 m), maximum value 2 cm at top of pile wall; b) Moment after first excavation phase (maximum value 167 kN·m)
a) b)
Figure 4 a) Horizontal displacements after final excavation, maximum value 5 cm at top of pile wall; b) Moment on pile wall (320 kN·m) and axial force (91k N/m) on tendon after final
excavation
a) b)
Figure 5 a) Construction of retaining wall and definitive tendons; b) Horizontal displacement after construction of wall (3 cm top of pile wall)

Dynamic Analyses For clarity reasons, only the results obtained with a single input ground motion (record #2 of the set) are presented in this section. Figure 6 shows the horizontal and vertical displacements contours at the end of time history (duration of the shaking 25 s).
a) b)
Figure 6 a) Horizontal displacements at end of time history; b) Vertical displacements at end
time history A series of control points were assigned to monitor the behaviour of the soil and structural elements during the earthquake. Figure 7 a) illustrates the position of a control point at the top of the retaining wall. Figure 7 b) shows the control points for piles and tendons. The horizontal and vertical displacement time histories registered at the control point are reported in Figure 8.
a) b)
Figure 7 a) Control points assigned to monitor the behaviour of retaining wall; b) Control points
assigned to monitor the behaviour of tendons and piles
Control point at top of wall
Control points
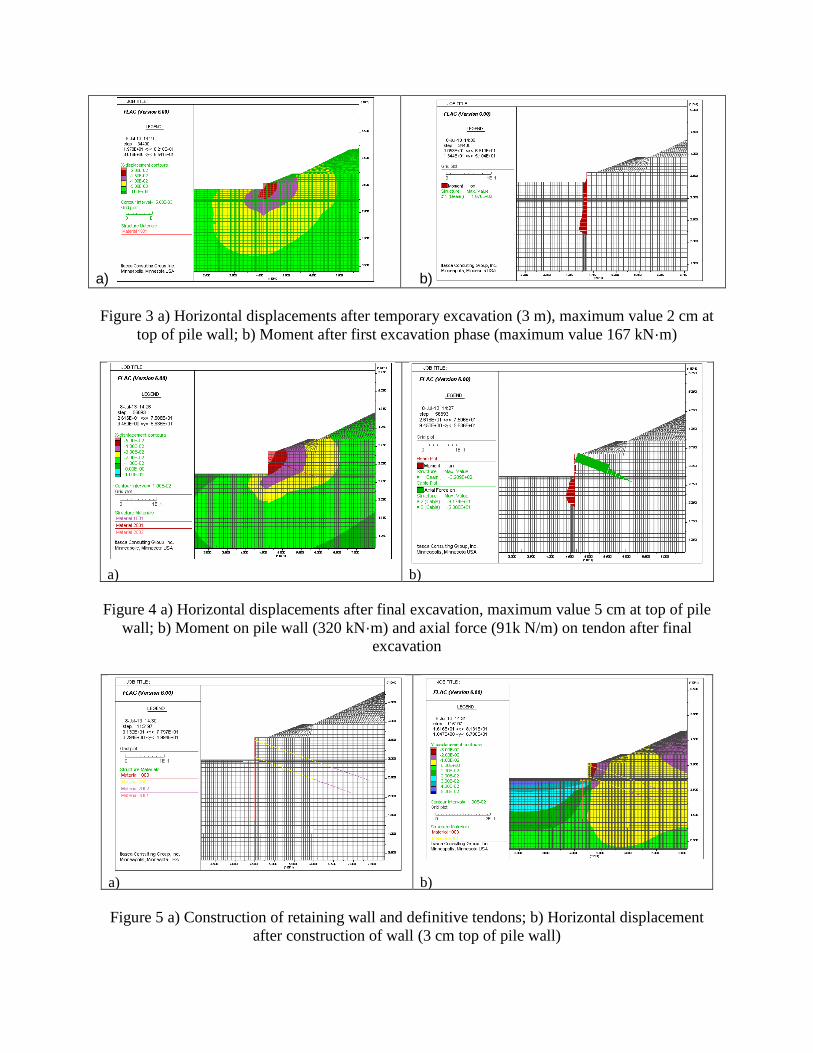
a) b)
Figure 8 a) Horizontal displacement time history at top of retaining wall at end of time history;
b) Vertical displacements time history at top of retaining wall The horizontal residual displacement after 25 s of earthquake motion is 27 cm, while the vertical residual displacement is 9 cm. According to the performance-based design methodology, the acceptable level of damage should be specified according to the specific needs of the user/owner and may be defined on the basis of acceptable level of structural and operational damage. The tolerable levels used in this study are defined in Table 3 (PIANC, 2001). The Normalized Residual Horizontal Displacement (NRHD) was taken as the controlling Engineering Demand Parameter (EDP). Since the height of the wall is 10 m, a displacement of 27 cm turns into a NRHD of 2.7%. This NRHD corresponds to a Degree II damage level (Table 3). This was the target performance selected at the beginning of the design. Hence, the analyses demonstrate the validity of the chosen stabilization system.
Table 3. Minimum requirements for damage criteria for retaining walls (adapted from PIANC,
2001).
EDP Level of damage
Degree I Degree II Degree III Degree IV
NHRD (d/H) Less than 0.015 1.5~5% 5~10% Larger than 0.1
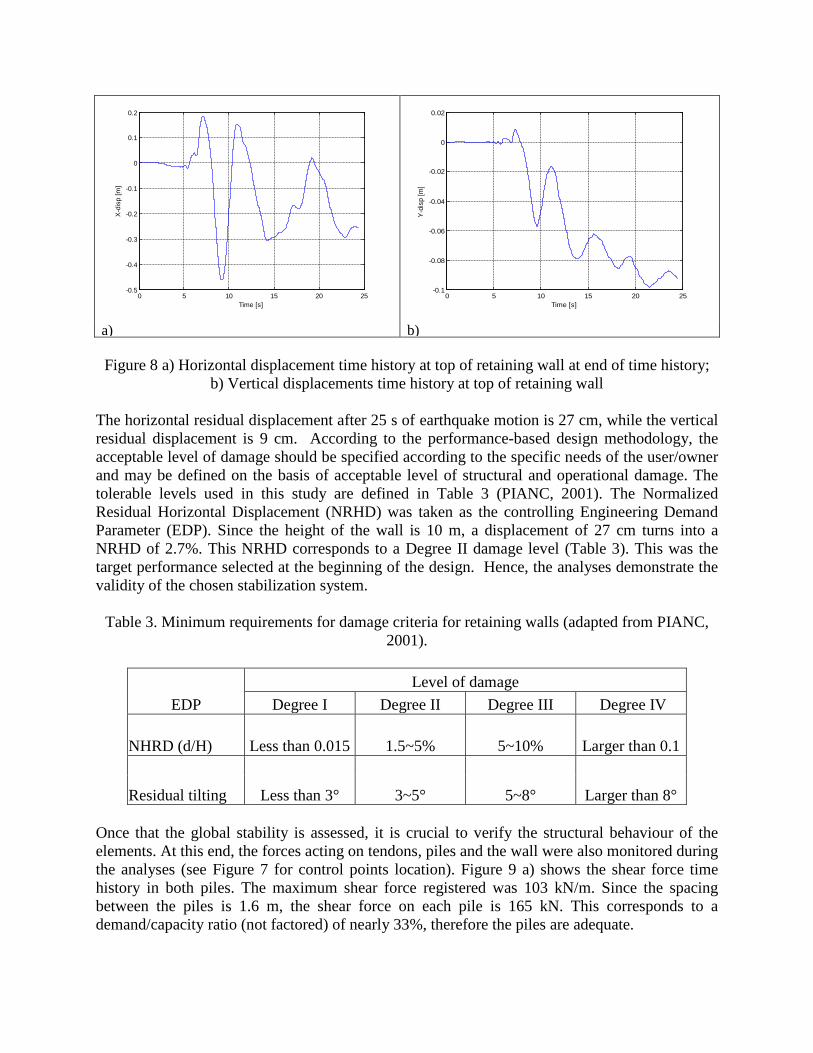
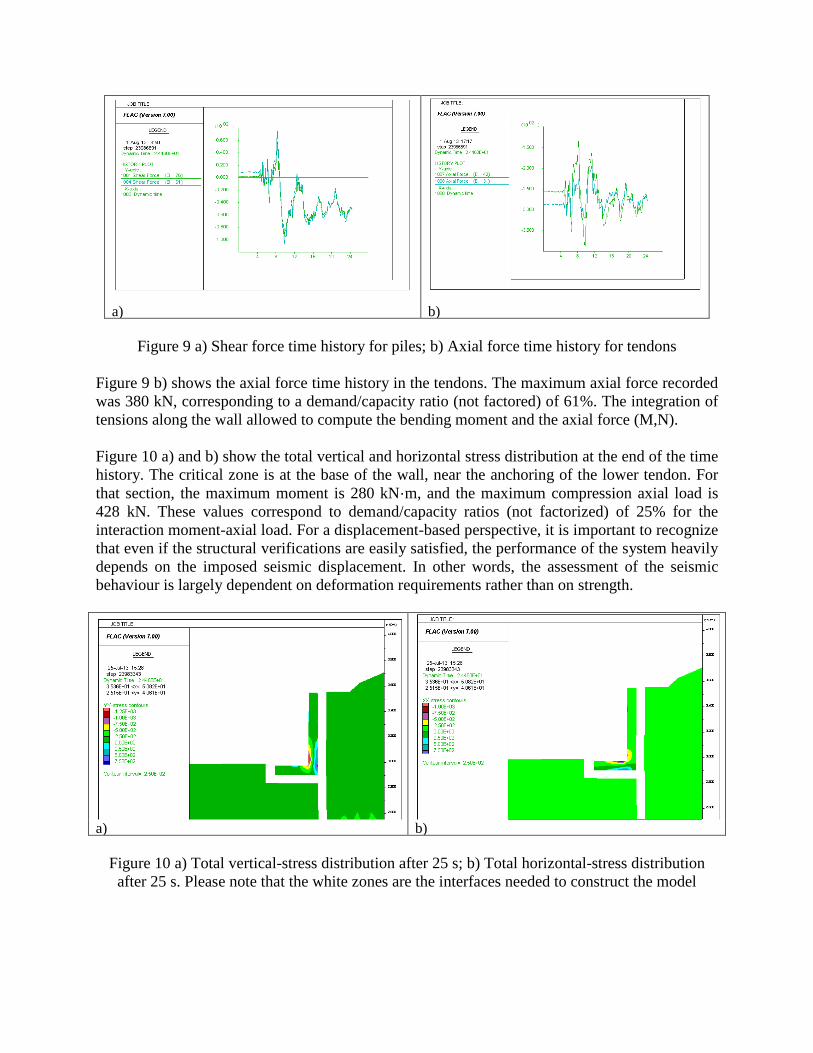
Residual tilting Less than 3° 3~5° 5~8° Larger than 8° Once that the global stability is assessed, it is crucial to verify the structural behaviour of the elements. At this end, the forces acting on tendons, piles and the wall were also monitored during the analyses (see Figure 7 for control points location). Figure 9 a) shows the shear force time history in both piles. The maximum shear force registered was 103 kN/m. Since the spacing between the piles is 1.6 m, the shear force on each pile is 165 kN. This corresponds to a demand/capacity ratio (not factored) of nearly 33%, therefore the piles are adequate.
0 5 10 15 20 25-0.5
-0.4
-0.3
-0.2
-0.1
0
0.1
0.2
Time [s]
X-d
isp
[m]
0 5 10 15 20 25-0.1
-0.08
-0.06
-0.04
-0.02
0
0.02
Time [s]
Y-di
sp [m
]
a) b)
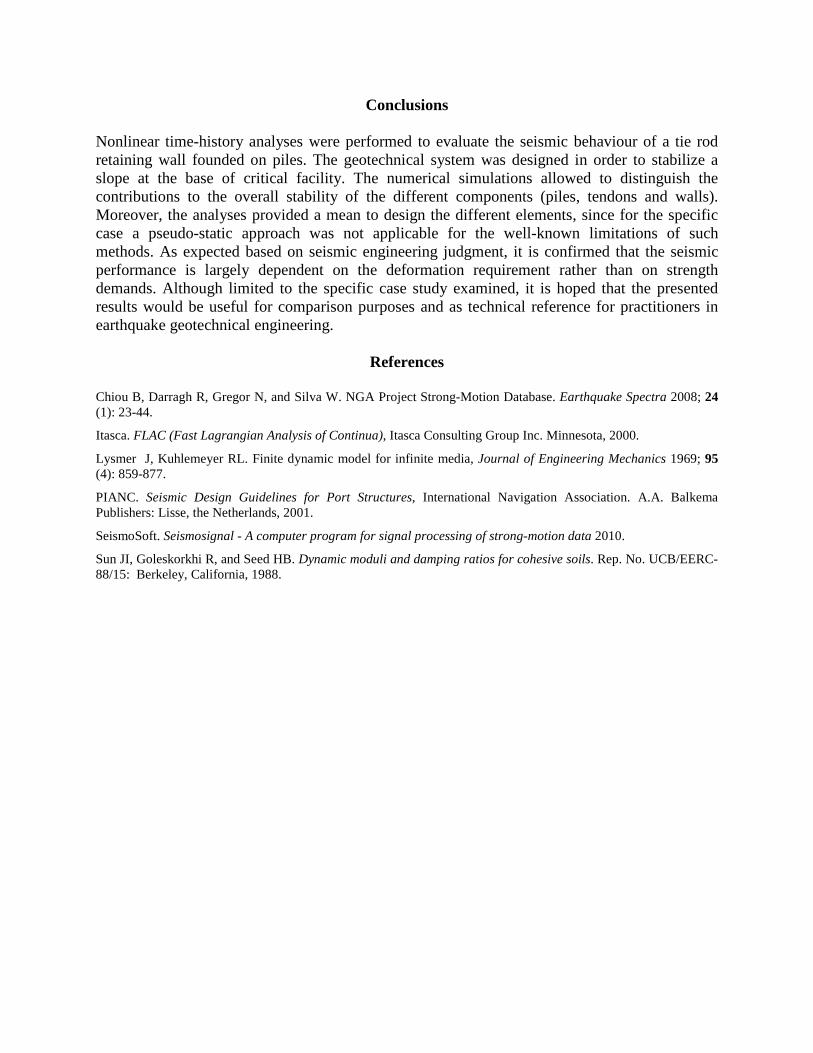
Figure 9 a) Shear force time history for piles; b) Axial force time history for tendons Figure 9 b) shows the axial force time history in the tendons. The maximum axial force recorded was 380 kN, corresponding to a demand/capacity ratio (not factored) of 61%. The integration of tensions along the wall allowed to compute the bending moment and the axial force (M,N). Figure 10 a) and b) show the total vertical and horizontal stress distribution at the end of the time history. The critical zone is at the base of the wall, near the anchoring of the lower tendon. For that section, the maximum moment is 280 kN·m, and the maximum compression axial load is 428 kN. These values correspond to demand/capacity ratios (not factorized) of 25% for the interaction moment-axial load. For a displacement-based perspective, it is important to recognize that even if the structural verifications are easily satisfied, the performance of the system heavily depends on the imposed seismic displacement. In other words, the assessment of the seismic behaviour is largely dependent on deformation requirements rather than on strength.
a) b)
Figure 10 a) Total vertical-stress distribution after 25 s; b) Total horizontal-stress distribution after 25 s. Please note that the white zones are the interfaces needed to construct the model
Conclusions Nonlinear time-history analyses were performed to evaluate the seismic behaviour of a tie rod retaining wall founded on piles. The geotechnical system was designed in order to stabilize a slope at the base of critical facility. The numerical simulations allowed to distinguish the contributions to the overall stability of the different components (piles, tendons and walls). Moreover, the analyses provided a mean to design the different elements, since for the specific case a pseudo-static approach was not applicable for the well-known limitations of such methods. As expected based on seismic engineering judgment, it is confirmed that the seismic performance is largely dependent on the deformation requirement rather than on strength demands. Although limited to the specific case study examined, it is hoped that the presented results would be useful for comparison purposes and as technical reference for practitioners in earthquake geotechnical engineering.
References
Chiou B, Darragh R, Gregor N, and Silva W. NGA Project Strong-Motion Database. Earthquake Spectra 2008; 24 (1): 23-44.
Itasca. FLAC (Fast Lagrangian Analysis of Continua), Itasca Consulting Group Inc. Minnesota, 2000.
Lysmer J, Kuhlemeyer RL. Finite dynamic model for infinite media, Journal of Engineering Mechanics 1969; 95 (4): 859-877.
PIANC. Seismic Design Guidelines for Port Structures, International Navigation Association. A.A. Balkema Publishers: Lisse, the Netherlands, 2001.
SeismoSoft. Seismosignal - A computer program for signal processing of strong-motion data 2010.
Sun JI, Goleskorkhi R, and Seed HB. Dynamic moduli and damping ratios for cohesive soils. Rep. No. UCB/EERC-88/15: Berkeley, California, 1988.