seismic fragility analysis of improved rc …jestec.taylors.edu.my/vol 12 issue 4 april...
TRANSCRIPT
Journal of Engineering Science and Technology Vol. 12, No. 4 (2017) 913 - 934 © School of Engineering, Taylor’s University
913
SEISMIC FRAGILITY ANALYSIS OF IMPROVED RC FRAMES USING DIFFERENT TYPES OF BRACING
HAMED HAMIDI JAMNANI*, GHOLAMREZA ABDOLLAHZADEH,
HADI FAGHIHMALEKI
Faculty of Civil Engineering, Babol Noshirvani University of Technology, Iran
*Corresponding Author: [email protected]
Abstract
Application of bracings to increase the lateral stiffness of building structures is
a technique of seismic improvement that engineers frequently have recourse to.
Accordingly, investigating the role of bracings in concrete structures along with
the development of seismic fragility curves are of overriding concern to civil
engineers. In this research, an ordinary RC building, designed according to the
1st edition of Iranian seismic code, was selected for examination. According to
FEMA 356 code, this building is considered to be vulnerable. To improve the
seismic performance of this building, 3 different types of bracings, which are
Concentrically Braced Frames, Eccentrically Braced Frames and Buckling
Restrained Frames were employed, and each bracing element was distributed in
3 different locations in the building. The researchers developed fragility curves
and utilized 30 earthquake records on the Peak Ground Acceleration seismic
intensity scale to carry out a time history analysis. Tow damage scale, including
Inter-Story Drifts and Plastic Axial Deformation were also used. The numerical
results obtained from this investigation confirm that Plastic Axial Deformation
is more reliable than conventional approaches in developing fragility curves for
retrofitted frames. In lieu of what is proposed, the researchers selected the
suitable damage scale and developed and compared log-normal distribution of
fragility curves first for the original and then for the retrofitted building.
Keywords: Fragility curve, Seismic retrofitting, Mid-rise RC frames, Braced
frame, Dynamic time history analysis.
1. Introduction
Before a building is hit by an earthquake, there are two possible ways to improve
its seismic performance. The first technique is to increase the number of the
structural elements of the building, like applying more shear walls or steel braces.
914 H. Hamidi Jamnani et al.
Journal of Engineering Science and Technology April 2017, Vol. 12(4)
Nomenclatures
R Response coefficient
T Period of oscillation, s
Greek Symbols
β Standard deviation of the seismic intensity scale
φ Standard Normal Cumulative Distribution
µ Average value of seismic intensity scale
Abbreviations
APD Axial Plastic Deformation
BRB Buckling Restrained Frames
CBF Concentrically Braced Frames
CFPR Carbon-Fiber-Reinforced Polymer
CP Collapse Prevention
EBF Eccentrically Braced Frames
FRP Fiber-Reinforced Plastic
IDA Incremental Dynamic Analysis
IO Immediate Occupancy
ISD Inter Story Drift
LS Life Safety
NLTH Nonlinear Dynamic Time History Analysis
PGA Peak Ground Acceleration
PHR Plastic Hinge Rotation
PL Performance Level
RC Reinforced Concrete
The second technique is to improve the performance of inefficient structural
elements with concrete or steel covers or by using carbon-fiber-reinforced
polymer (CFPR) or fiber-reinforced plastic (FRP) encasements [1 - 5]. In the first
technique, concentrically and eccentrically braced frames are used in steel
structures, and shear walls are affixed to ordinary reinforced concrete buildings.
Nonetheless, in recent years, research has been done on the use of braces to
improve the seismic performance of concrete buildings as well [6 - 8].The
performance of bracing systems in retrofitting of steel structures was previously
studied by some researchers [9, 10], the focus here is to study their performance
in RC buildings. Pagni and Lowes [11] developed seismic fragility functions
aiming to determine a method for repairing old reinforced concrete (RC) beam-
column subassemblies by earthquake loading. Kappos et al. [12] also presented a
technique for assessing the vulnerability of reinforced concrete (RC) and
unreinforced masonry (URM) structures. Jeong and Elnashai [13] presented an
approach whereby a set of fragility relationships with known reliability is derived
based on the fundamental response quantities of stiffness, strength and ductility.
Lagaros [14] carried out a fragility assessment test on reinforced concrete
structures by devising three different methods.
Recently, Kircil and Polat [15] developed fragility curves for mid-rise RC
frame buildings in Istanbul, which are, according to Turkey’s seismic design
code, designed based on numerical simulations in accordance with the number
of the stories of the buildings. In their study, Polat and Kirchil designed 3, 5,
Seismic Fragility Analysis of Improved RC Frames Using Different Types . . . . 915
Journal of Engineering Science and Technology April 2017, Vol. 12(4)
and 7 story buildings and employed incremental dynamic analysis (IDA) to
measure the yielding and collapse capacity of the designed buildings under
twelve artificial ground motions. According to the aptitude of the buildings,
they produced fragility curves for the yielding and collapse capacities of the
structures under lognormal distribution parameters on the basis of elastic
pseudo spectral acceleration, Peak Ground Acceleration (PGA), and elastic
spectral displacement. Afterwards, they employed regression analysis to
determine the effect of the number of the stories of the buildings on fragility
parameters. Their study disclosed that there was a reverse relationship between
the number of the stories and fragility parameters.
In this article, the researchers intend to study and evaluate the effect of
multiple steel bracings with proper distribution on the improvement of a mid-rise
RC frame building’s behaviour during seismic activity. To assess the capacity of
the studied building to withstand seismic oscillations, nonlinear dynamic time
history analysis is carried out and a fragility curve is developed and presented.
2. Developing Fragility Curves By Using Nonlinear Dynamic Time
History Analysis
To develop a fragility curve for any kind of building based on nonlinear dynamic
time history analysis (NLTHA), it is necessary to consider the following steps:
Considering multiple buildings as specimen and various kinds of soil as their
construction site.
Calibrating the studied buildings on the basis of the nonlinear behavior of
their materials and their deterioration properties.
Selecting various artificial ground motions recorded from previous
earthquakes on the basis of their frequency content and in respect to the soil
type of the site, and then scaling them in accordance to various Peak Ground
Acceleration (PGA) variables.
Considering a proper damage scale for the building materials or the frames
used, such as “inter story drift (ISD)”, “plastic hinge rotation (PHR)”, and
“axial plastic deformation (APD)”.
Considering a number of acceptable breaking points in accordance to
different building design codes.
Carrying out a nonlinear dynamic time history analysis (NLTHA) for each
building regarding different levels of PGA.
Choosing a proper probability-density function.
Presenting fragility curves and tables.
3. Damage Scale and Level of Performance During Seismic Activity
To develop fragility curves, it is necessary to use a reasonable damage scale for
each structural element. Researchers have extensively studied plastic hinge
rotations in beams and columns. In this study, however, inter story drifts and axial
plastic deformations in bracing elements are considered as suitable fragility scales
to assess the seismic fragility of RC frame structures. Subsequently, to discover
which damage scale is more suitable for the bracing frames, the results will be
compared. Inter story drift ratio is an important damage demand parameter of
building structures under earthquake loads. Consequently, the correct and
916 H. Hamidi Jamnani et al.
Journal of Engineering Science and Technology April 2017, Vol. 12(4)
convenient evaluation on maximum inter story drift is fairly significant to seismic
analysis and design of buildings. Based on the continuous shear-beam model and
wave propagation theory [16]. Plastic axial deformation reduces the force that the
structural element must resist, provides a fuse to limit actions on other structural
elements (e.g., the foundation system) and can provide for significant effective
damping [17].
Estekanchi and Arjomandi [18], investigated damage Scales based on a lot of
parameters in order to find a correlation between their numerical values. They had
compared the selected damage Scales by applying them in the nonlinear analysis
of various low rise steel frames subjected to a set of seven earthquake
accelerograms corresponding to a specific soil condition. Their results show a
relatively satisfactory correlation with maximum drift scale. Some scales such as
modal parameters based indexes and plastic ductility index are less satisfactorily
correlated to drift index. It is also shown that better correlation between indexes
can be achieved by using more comprehensive indexes.
Level of damage to a building can be considered as minimal, moderate and
severe, which is often regarded as the performance level (PL) of the building during
seismic activities and is treated as a specific seismic hazard level. In the report
published by FEMA 306 [19], these three levels of performance are called
Immediate Occupancy (IO), Life Safety (LS) and Collapse Prevention (CP), which
are the terms employed in this research as well. Hence, the point where damage
scale exceeds each of the three damage levels is regarded as system fragility.
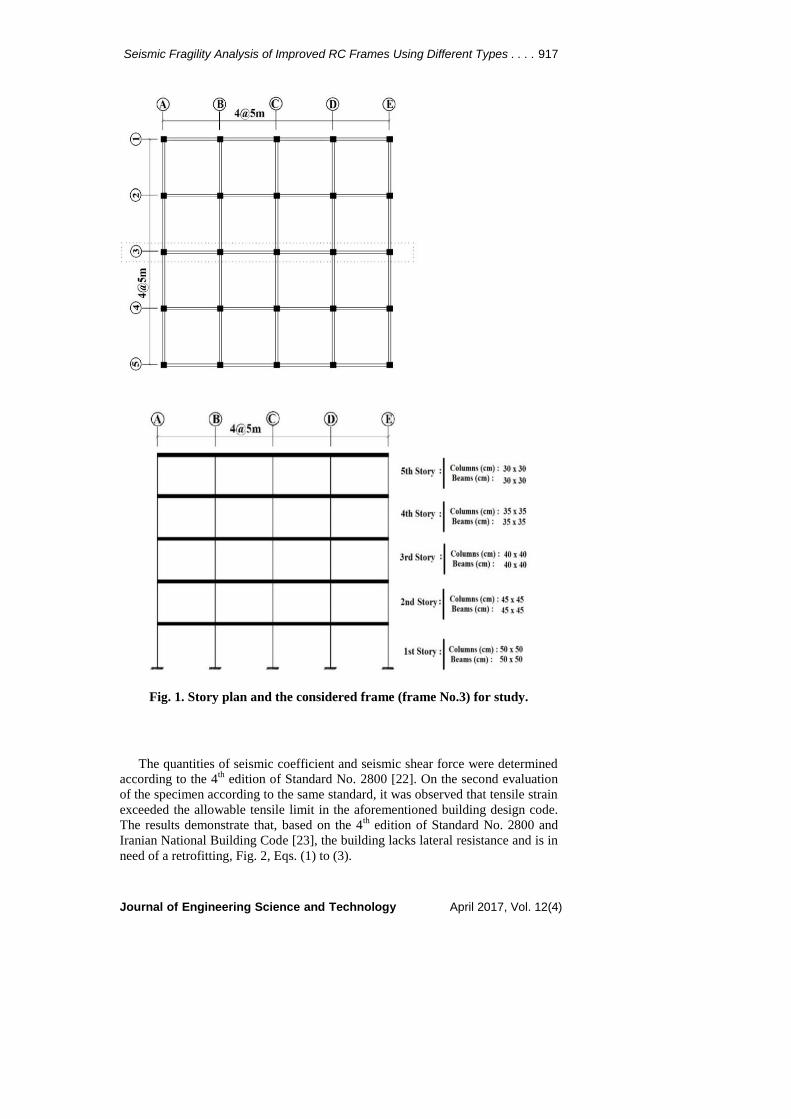
4. Modelling and Analysis of the Basic Structure
For this study, a mid-rise RC frame building located in an earthquake-prone
region in Iran was selected. The building was residential and designed according
to the 1st edition (the oldest version) of Iranian seismic code (known as Standard
No. 2800) [20]. It was a five-story building, with ordinary concrete beam-
columns frames, without any shear walls. Figure 1 illustrates the ground plan and
the intended frame. Central loads are comprised of dead and live loads. Hence,
the design load in this study consists of a dead load of 550 kg/m2. For the ground
floor, a live load of 200 kg/m2 and a roof load of 150 kg/m
2. Other types of loads,
such as snow loads or wind loads, were ignored. Furthermore, soil interaction was
also overlooked and consequently it was presumed that the columns were
perfectly stable in the ground. Story height was also considered to be 3.2 meters.
In the studied building, the compressive strength of concrete was considered
to be 210 kg/cm2 and the thickness of concrete slabs in each story was considered
15 centimeters. Stirrups were also 8 millimeters in diameter and placed 20
centimeters apart in structural elements.
The seismic performance of the studied building was analyzed with SeismoStruct
ver.6 [21]. Alike all limited element software, this software is able to perform all
linear or non-linear dynamic and static analyses and it has a special efficiency to
perform Incremental Dynamic Analysis (IDA). This software was selected as the
excellent software in this field in the 15th world conference for earthquake
engineering (2012) which was held in Lisbon, Portugal.
Seismic Fragility Analysis of Improved RC Frames Using Different Types . . . . 917
Journal of Engineering Science and Technology April 2017, Vol. 12(4)
Fig. 1. Story plan and the considered frame (frame No.3) for study.
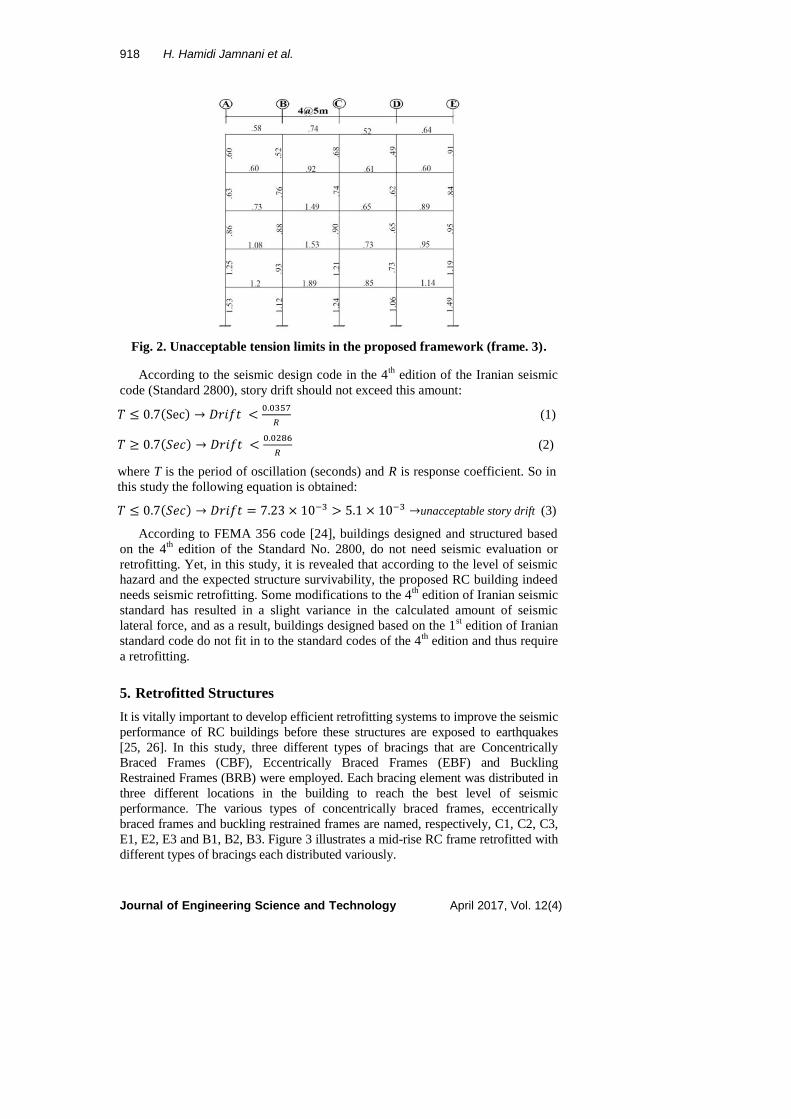
The quantities of seismic coefficient and seismic shear force were determined
according to the 4th
edition of Standard No. 2800 [22]. On the second evaluation
of the specimen according to the same standard, it was observed that tensile strain
exceeded the allowable tensile limit in the aforementioned building design code.
The results demonstrate that, based on the 4th edition of Standard No. 2800 and
Iranian National Building Code [23], the building lacks lateral resistance and is in
need of a retrofitting, Fig. 2, Eqs. (1) to (3).
918 H. Hamidi Jamnani et al.
Journal of Engineering Science and Technology April 2017, Vol. 12(4)
Fig. 2. Unacceptable tension limits in the proposed framework (frame. 3).
According to the seismic design code in the 4th
edition of the Iranian seismic
code (Standard 2800), story drift should not exceed this amount:
𝑇 ≤ 0.7(Sec) → 𝐷𝑟𝑖𝑓𝑡 <0.0357
𝑅 (1)
𝑇 ≥ 0.7(𝑆𝑒𝑐) → 𝐷𝑟𝑖𝑓𝑡 <0.0286
𝑅 (2)
where T is the period of oscillation (seconds) and R is response coefficient. So in
this study the following equation is obtained:
𝑇 ≤ 0.7(𝑆𝑒𝑐) → 𝐷𝑟𝑖𝑓𝑡 = 7.23 × 10⁻³ > 5.1 × 10⁻³ →unacceptable story drift (3)
According to FEMA 356 code [24], buildings designed and structured based
on the 4th
edition of the Standard No. 2800, do not need seismic evaluation or
retrofitting. Yet, in this study, it is revealed that according to the level of seismic
hazard and the expected structure survivability, the proposed RC building indeed
needs seismic retrofitting. Some modifications to the 4th
edition of Iranian seismic
standard has resulted in a slight variance in the calculated amount of seismic
lateral force, and as a result, buildings designed based on the 1st edition of Iranian
standard code do not fit in to the standard codes of the 4th edition and thus require
a retrofitting.
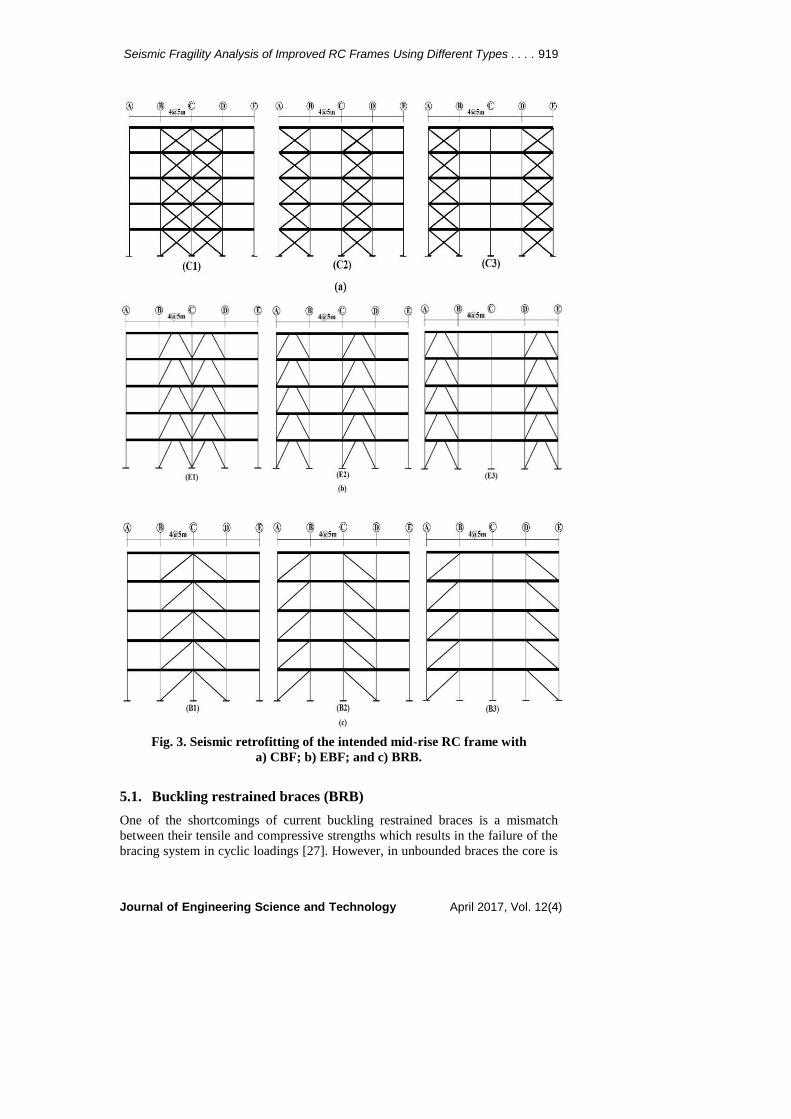
5. Retrofitted Structures
It is vitally important to develop efficient retrofitting systems to improve the seismic
performance of RC buildings before these structures are exposed to earthquakes
[25, 26]. In this study, three different types of bracings that are Concentrically
Braced Frames (CBF), Eccentrically Braced Frames (EBF) and Buckling
Restrained Frames (BRB) were employed. Each bracing element was distributed in
three different locations in the building to reach the best level of seismic
performance. The various types of concentrically braced frames, eccentrically
braced frames and buckling restrained frames are named, respectively, C1, C2, C3,
E1, E2, E3 and B1, B2, B3. Figure 3 illustrates a mid-rise RC frame retrofitted with
different types of bracings each distributed variously.
Seismic Fragility Analysis of Improved RC Frames Using Different Types . . . . 919
Journal of Engineering Science and Technology April 2017, Vol. 12(4)
Fig. 3. Seismic retrofitting of the intended mid-rise RC frame with
a) CBF; b) EBF; and c) BRB.
5.1. Buckling restrained braces (BRB)
One of the shortcomings of current buckling restrained braces is a mismatch
between their tensile and compressive strengths which results in the failure of the
bracing system in cyclic loadings [27]. However, in unbounded braces the core is
920 H. Hamidi Jamnani et al.
Journal of Engineering Science and Technology April 2017, Vol. 12(4)
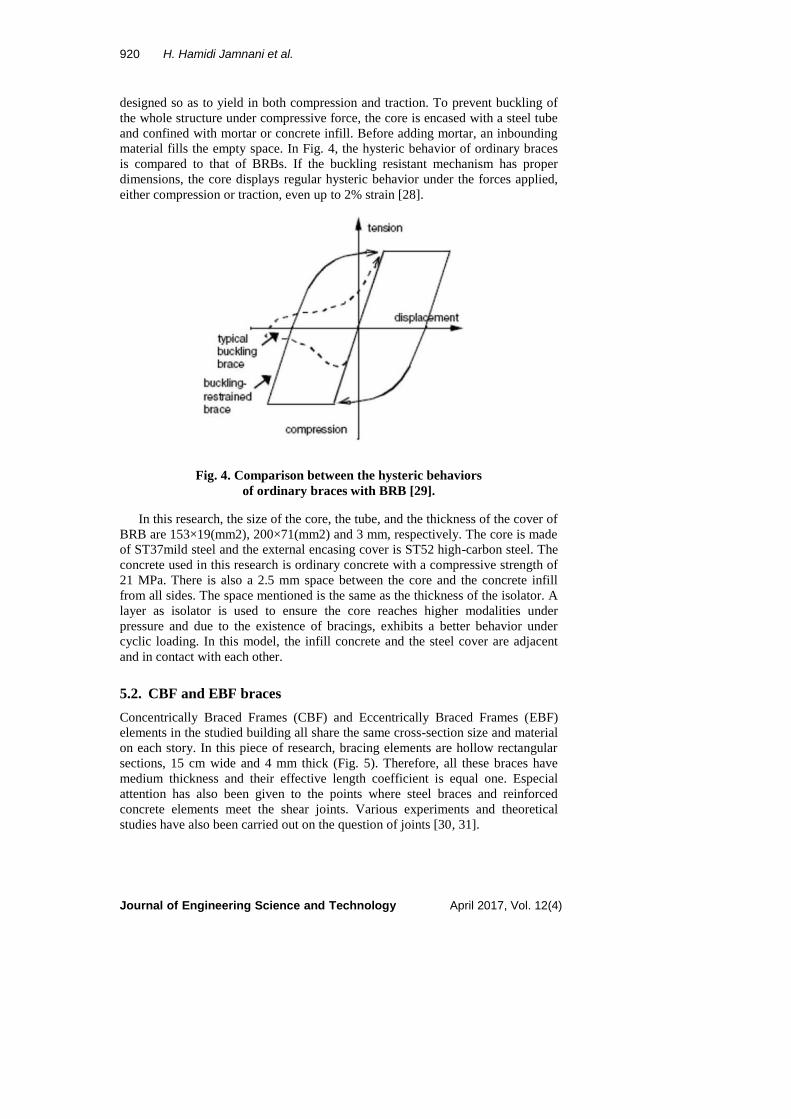
designed so as to yield in both compression and traction. To prevent buckling of
the whole structure under compressive force, the core is encased with a steel tube
and confined with mortar or concrete infill. Before adding mortar, an inbounding
material fills the empty space. In Fig. 4, the hysteric behavior of ordinary braces
is compared to that of BRBs. If the buckling resistant mechanism has proper
dimensions, the core displays regular hysteric behavior under the forces applied,
either compression or traction, even up to 2% strain [28].
Fig. 4. Comparison between the hysteric behaviors
of ordinary braces with BRB [29].
In this research, the size of the core, the tube, and the thickness of the cover of
BRB are 153×19(mm2), 200×71(mm2) and 3 mm, respectively. The core is made
of ST37mild steel and the external encasing cover is ST52 high-carbon steel. The
concrete used in this research is ordinary concrete with a compressive strength of
21 MPa. There is also a 2.5 mm space between the core and the concrete infill
from all sides. The space mentioned is the same as the thickness of the isolator. A
layer as isolator is used to ensure the core reaches higher modalities under
pressure and due to the existence of bracings, exhibits a better behavior under
cyclic loading. In this model, the infill concrete and the steel cover are adjacent
and in contact with each other.
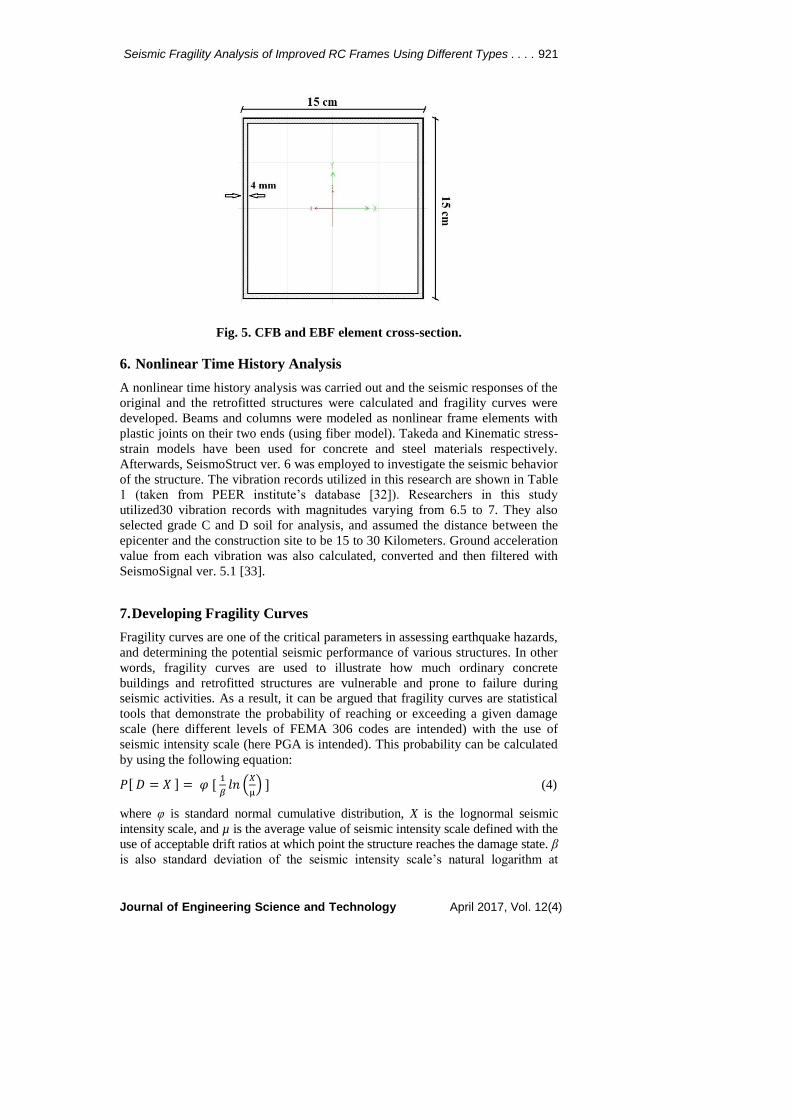
5.2. CBF and EBF braces
Concentrically Braced Frames (CBF) and Eccentrically Braced Frames (EBF)
elements in the studied building all share the same cross-section size and material
on each story. In this piece of research, bracing elements are hollow rectangular
sections, 15 cm wide and 4 mm thick (Fig. 5). Therefore, all these braces have
medium thickness and their effective length coefficient is equal one. Especial
attention has also been given to the points where steel braces and reinforced
concrete elements meet the shear joints. Various experiments and theoretical
studies have also been carried out on the question of joints [30, 31].
Seismic Fragility Analysis of Improved RC Frames Using Different Types . . . . 921
Journal of Engineering Science and Technology April 2017, Vol. 12(4)
Fig. 5. CFB and EBF element cross-section.
6. Nonlinear Time History Analysis
A nonlinear time history analysis was carried out and the seismic responses of the
original and the retrofitted structures were calculated and fragility curves were
developed. Beams and columns were modeled as nonlinear frame elements with
plastic joints on their two ends (using fiber model). Takeda and Kinematic stress-
strain models have been used for concrete and steel materials respectively.
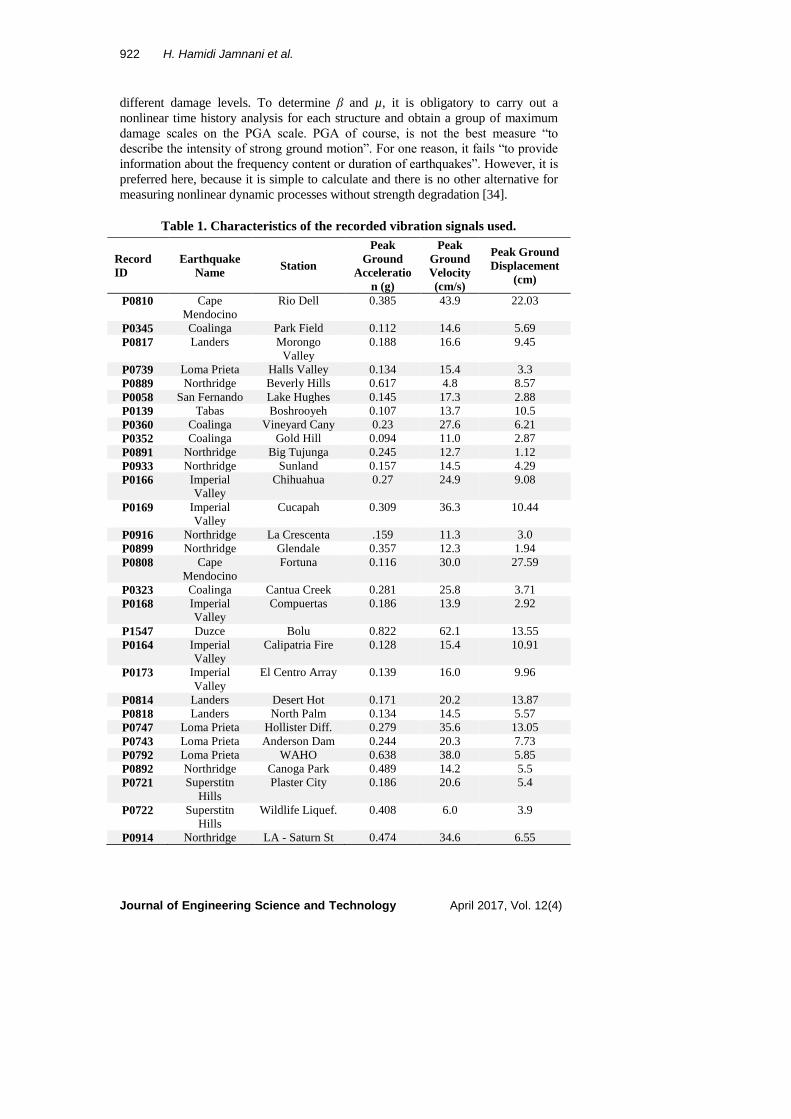
Afterwards, SeismoStruct ver. 6 was employed to investigate the seismic behavior
of the structure. The vibration records utilized in this research are shown in Table
1 (taken from PEER institute’s database [32]). Researchers in this study
utilized30 vibration records with magnitudes varying from 6.5 to 7. They also
selected grade C and D soil for analysis, and assumed the distance between the
epicenter and the construction site to be 15 to 30 Kilometers. Ground acceleration
value from each vibration was also calculated, converted and then filtered with
SeismoSignal ver. 5.1 [33].
7. Developing Fragility Curves
Fragility curves are one of the critical parameters in assessing earthquake hazards,
and determining the potential seismic performance of various structures. In other
words, fragility curves are used to illustrate how much ordinary concrete
buildings and retrofitted structures are vulnerable and prone to failure during
seismic activities. As a result, it can be argued that fragility curves are statistical
tools that demonstrate the probability of reaching or exceeding a given damage
scale (here different levels of FEMA 306 codes are intended) with the use of
seismic intensity scale (here PGA is intended). This probability can be calculated
by using the following equation:
𝑃[ 𝐷 = 𝑋 ] = 𝜑 [ 1
𝛽𝑙𝑛 (
𝑋
µ) ] (4)
where φ is standard normal cumulative distribution, X is the lognormal seismic
intensity scale, and µ is the average value of seismic intensity scale defined with the
use of acceptable drift ratios at which point the structure reaches the damage state. β
is also standard deviation of the seismic intensity scale’s natural logarithm at
922 H. Hamidi Jamnani et al.
Journal of Engineering Science and Technology April 2017, Vol. 12(4)
different damage levels. To determine β and µ, it is obligatory to carry out a
nonlinear time history analysis for each structure and obtain a group of maximum
damage scales on the PGA scale. PGA of course, is not the best measure “to
describe the intensity of strong ground motion”. For one reason, it fails “to provide
information about the frequency content or duration of earthquakes”. However, it is
preferred here, because it is simple to calculate and there is no other alternative for
measuring nonlinear dynamic processes without strength degradation [34].
Table 1. Characteristics of the recorded vibration signals used.
Record
ID
Earthquake
Name Station
Peak
Ground
Acceleratio
n (g)
Peak
Ground
Velocity
(cm/s)
Peak Ground
Displacement
(cm)
P0810 Cape
Mendocino
Rio Dell 0.385 43.9 22.03
P0345 Coalinga Park Field 0.112 14.6 5.69
P0817 Landers Morongo
Valley
0.188 16.6 9.45
P0739 Loma Prieta Halls Valley 0.134 15.4 3.3
P0889 Northridge Beverly Hills 0.617 4.8 8.57
P0058 San Fernando Lake Hughes 0.145 17.3 2.88
P0139 Tabas Boshrooyeh 0.107 13.7 10.5
P0360 Coalinga Vineyard Cany 0.23 27.6 6.21
P0352 Coalinga Gold Hill 0.094 11.0 2.87
P0891 Northridge Big Tujunga 0.245 12.7 1.12
P0933 Northridge Sunland 0.157 14.5 4.29
P0166 Imperial
Valley
Chihuahua 0.27 24.9 9.08
P0169 Imperial
Valley
Cucapah 0.309 36.3 10.44
P0916 Northridge La Crescenta .159 11.3 3.0
P0899 Northridge Glendale 0.357 12.3 1.94
P0808 Cape
Mendocino
Fortuna 0.116 30.0 27.59
P0323 Coalinga Cantua Creek 0.281 25.8 3.71
P0168 Imperial
Valley
Compuertas 0.186 13.9 2.92
P1547 Duzce Bolu 0.822 62.1 13.55
P0164 Imperial
Valley
Calipatria Fire 0.128 15.4 10.91
P0173 Imperial
Valley
El Centro Array 0.139 16.0 9.96
P0814 Landers Desert Hot 0.171 20.2 13.87
P0818 Landers North Palm 0.134 14.5 5.57
P0747 Loma Prieta Hollister Diff. 0.279 35.6 13.05
P0743 Loma Prieta Anderson Dam 0.244 20.3 7.73
P0792 Loma Prieta WAHO 0.638 38.0 5.85
P0892 Northridge Canoga Park 0.489 14.2 5.5
P0721 Superstitn
Hills
Plaster City 0.186 20.6 5.4
P0722 Superstitn
Hills
Wildlife Liquef. 0.408 6.0 3.9
P0914 Northridge LA - Saturn St 0.474 34.6 6.55
Seismic Fragility Analysis of Improved RC Frames Using Different Types . . . . 923
Journal of Engineering Science and Technology April 2017, Vol. 12(4)
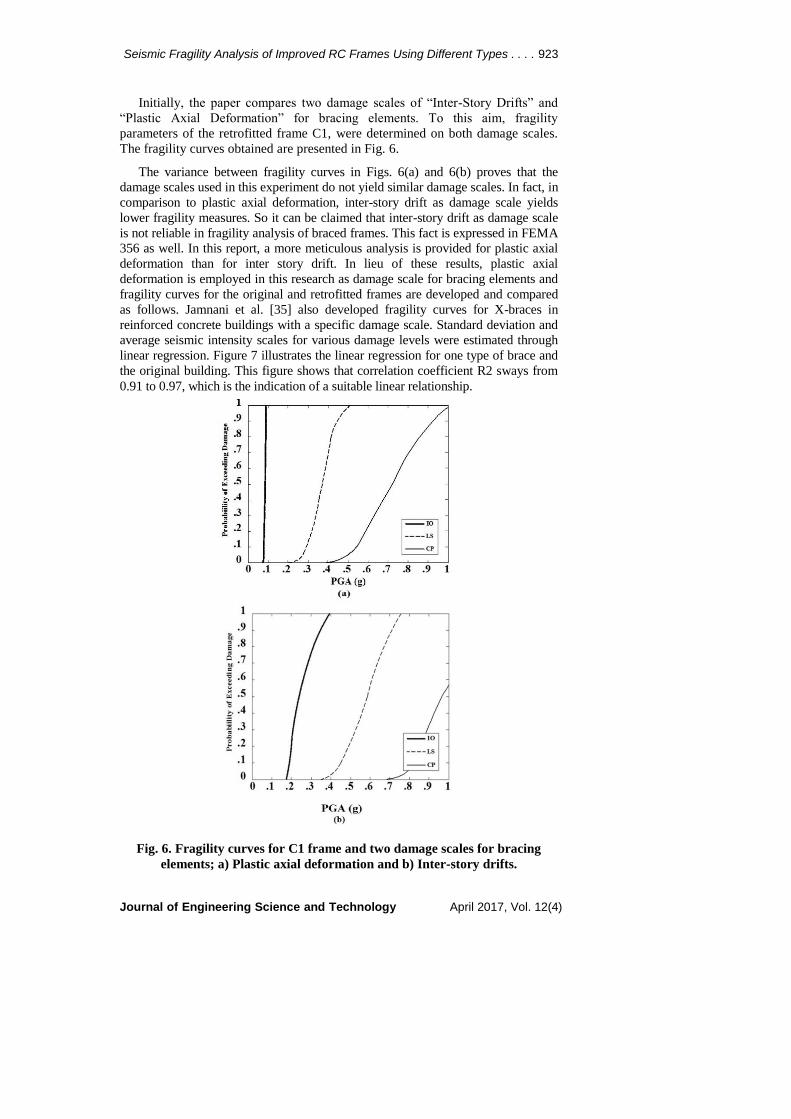
Initially, the paper compares two damage scales of “Inter-Story Drifts” and
“Plastic Axial Deformation” for bracing elements. To this aim, fragility
parameters of the retrofitted frame C1, were determined on both damage scales.
The fragility curves obtained are presented in Fig. 6.
The variance between fragility curves in Figs. 6(a) and 6(b) proves that the
damage scales used in this experiment do not yield similar damage scales. In fact, in
comparison to plastic axial deformation, inter-story drift as damage scale yields
lower fragility measures. So it can be claimed that inter-story drift as damage scale
is not reliable in fragility analysis of braced frames. This fact is expressed in FEMA
356 as well. In this report, a more meticulous analysis is provided for plastic axial
deformation than for inter story drift. In lieu of these results, plastic axial
deformation is employed in this research as damage scale for bracing elements and
fragility curves for the original and retrofitted frames are developed and compared
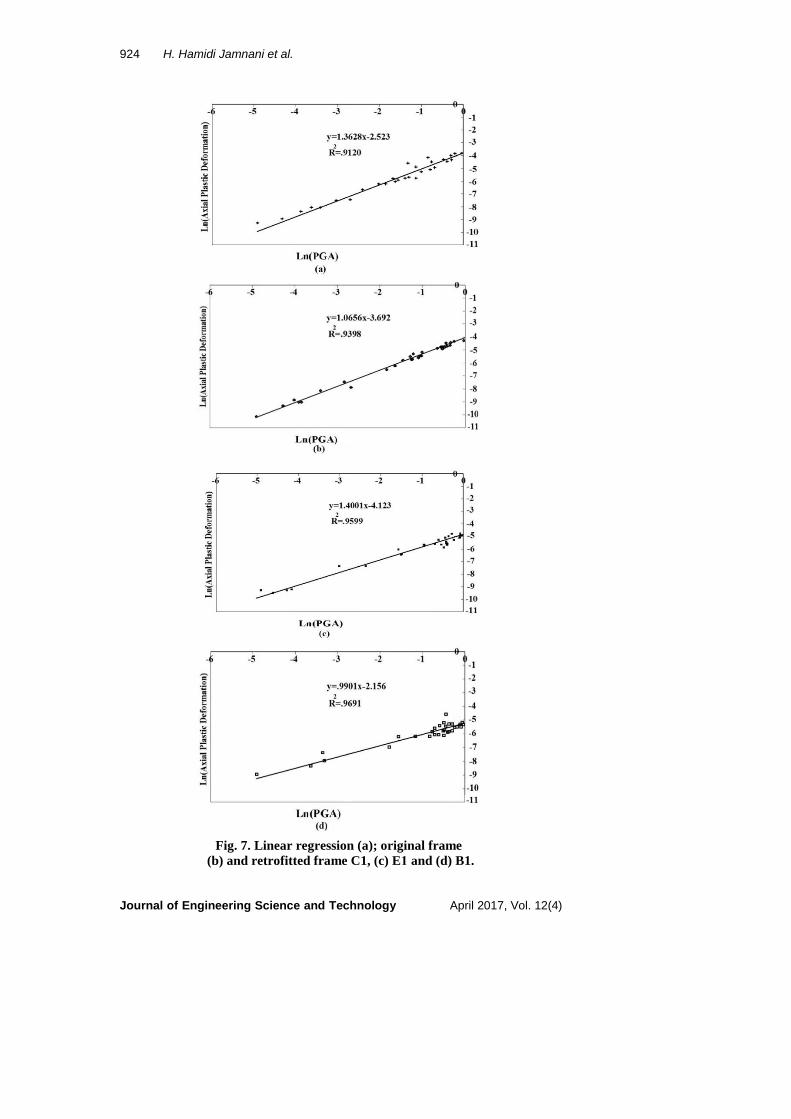
as follows. Jamnani et al. [35] also developed fragility curves for X-braces in
reinforced concrete buildings with a specific damage scale. Standard deviation and
average seismic intensity scales for various damage levels were estimated through
linear regression. Figure 7 illustrates the linear regression for one type of brace and
the original building. This figure shows that correlation coefficient R2 sways from
0.91 to 0.97, which is the indication of a suitable linear relationship.
Fig. 6. Fragility curves for C1 frame and two damage scales for bracing
elements; a) Plastic axial deformation and b) Inter-story drifts.
924 H. Hamidi Jamnani et al.
Journal of Engineering Science and Technology April 2017, Vol. 12(4)
Fig. 7. Linear regression (a); original frame
(b) and retrofitted frame C1, (c) E1 and (d) B1.
Seismic Fragility Analysis of Improved RC Frames Using Different Types . . . . 925
Journal of Engineering Science and Technology April 2017, Vol. 12(4)
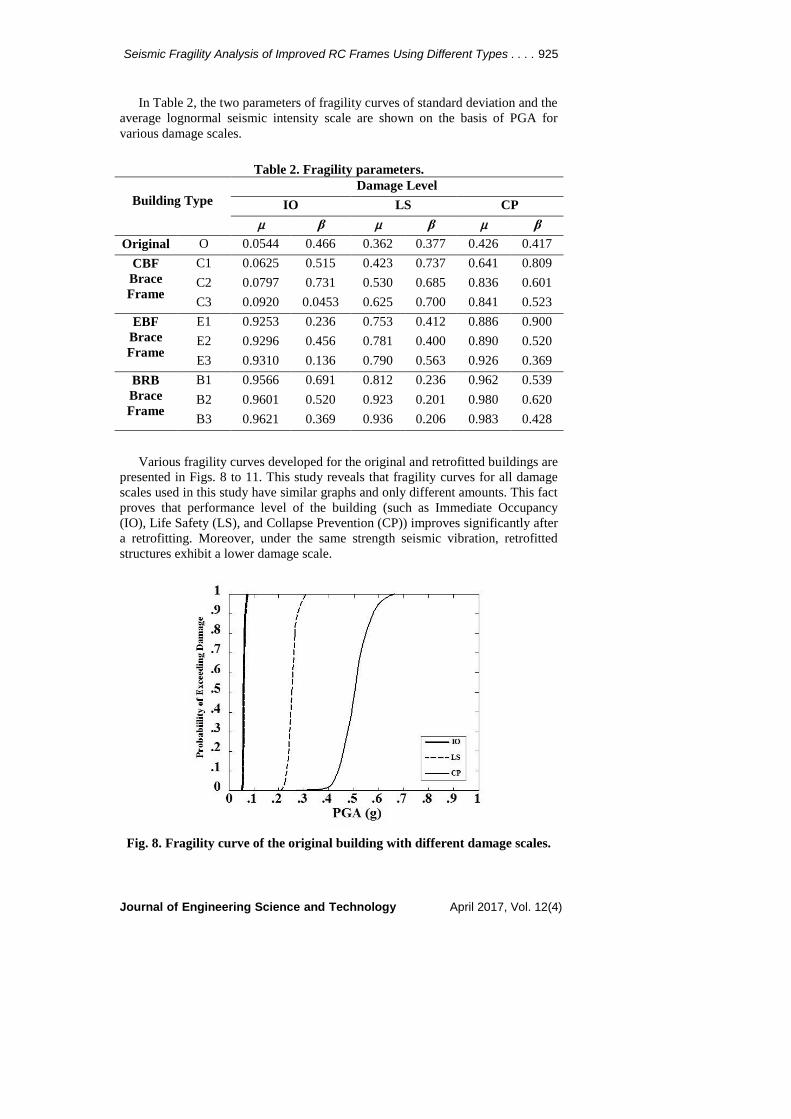
In Table 2, the two parameters of fragility curves of standard deviation and the
average lognormal seismic intensity scale are shown on the basis of PGA for
various damage scales.
Table 2. Fragility parameters.
Damage Level
Building Type
CP LS IO
β µ β µ β µ
0.417 0.426 0.377 0.362 0.466 0.0544 O Original
0.809 0.641 0.737 0.423 0.515 0.0625 C1 CBF
Brace
Frame 0.601 0.836 0.685 0.530 0.731 0.0797 C2
0.523 0.841 0.700 0.625 0.0453 0.0920 C3
0.900 0.886 0.412 0.753 0.236 0.9253 E1 EBF
Brace
Frame 0.520 0.890 0.400 0.781 0.456 0.9296 E2
0.369 0.926 0.563 0.790 0.136 0.9310 E3
0.539 0.962 0.236 0.812 0.691 0.9566 B1 BRB
Brace
Frame 0.620 0.980 0.201 0.923 0.520 0.9601 B2
0.428 0.983 0.206 0.936 0.369 0.9621 B3
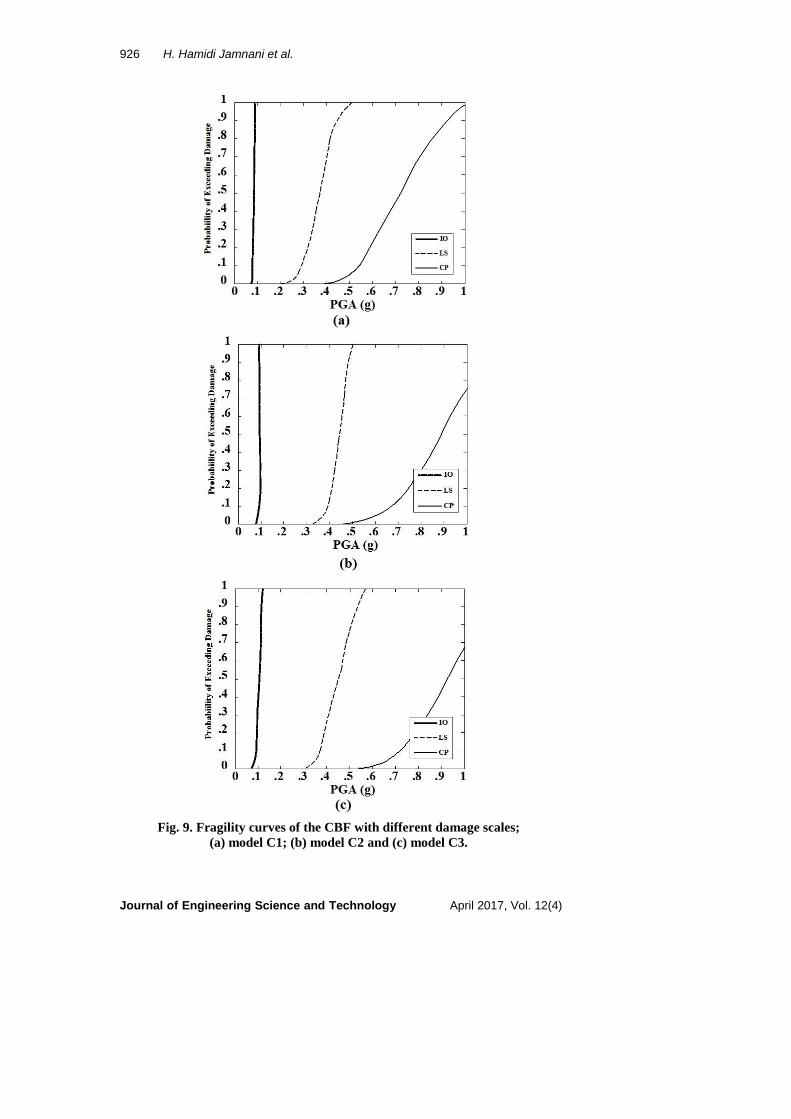
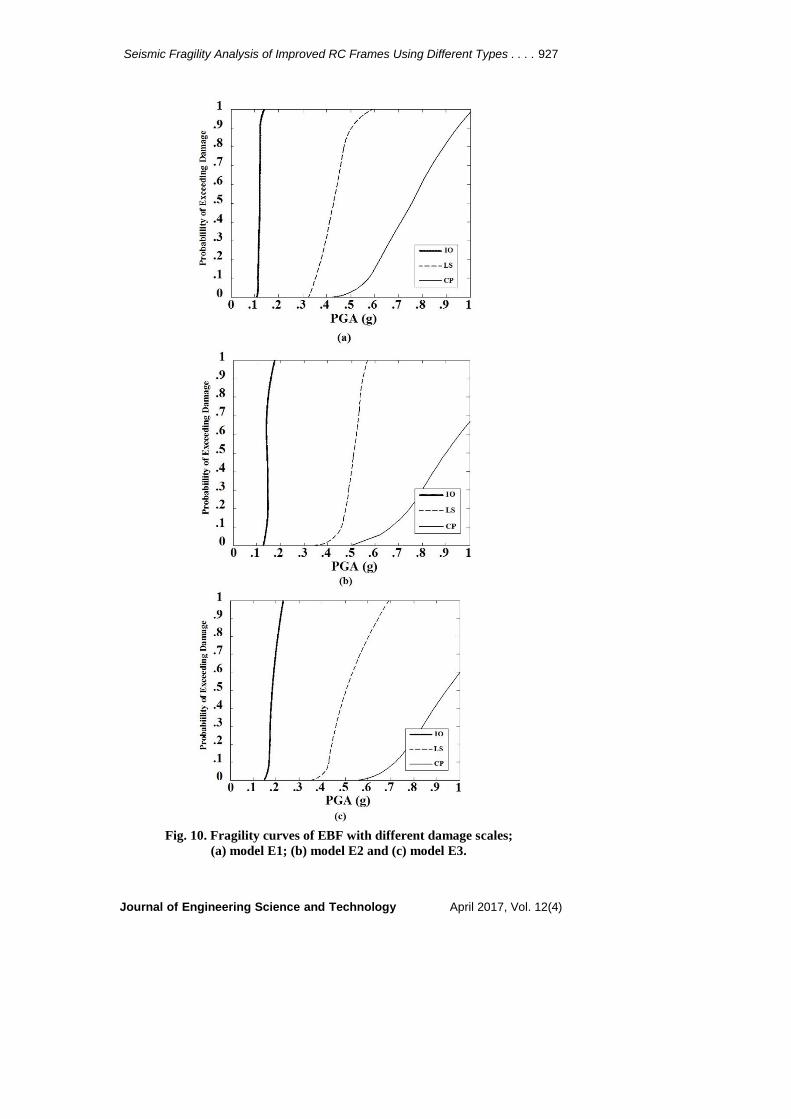
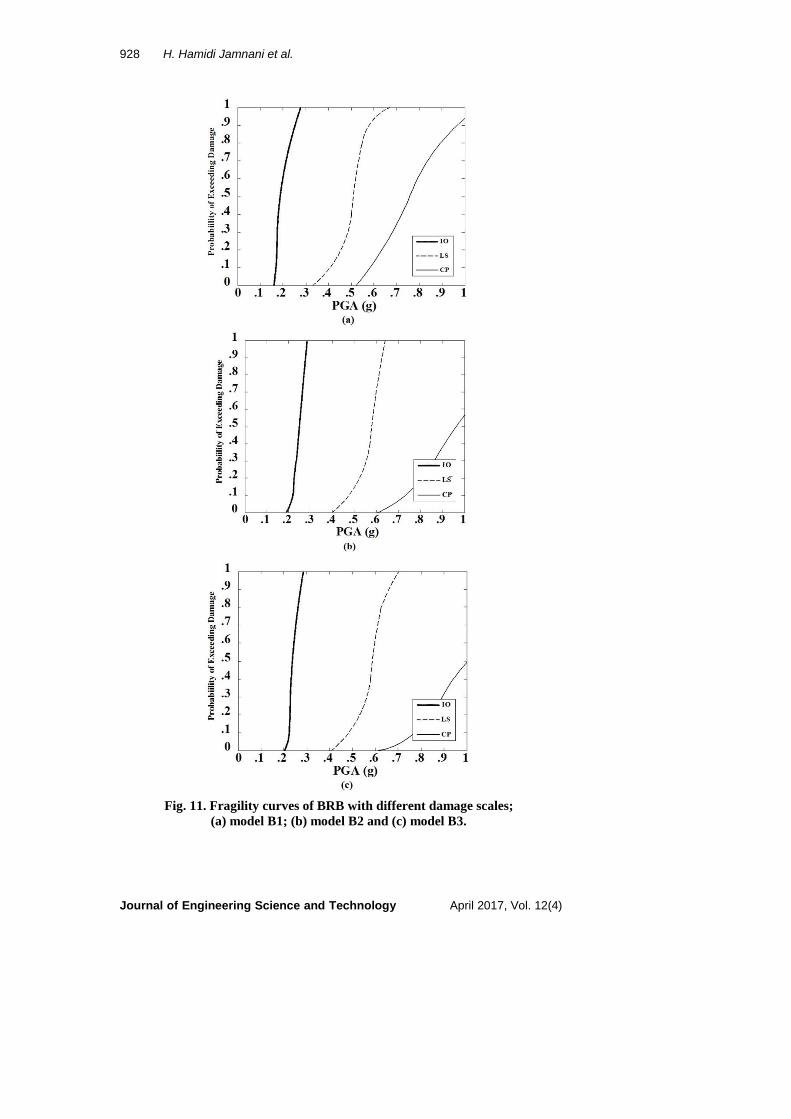
Various fragility curves developed for the original and retrofitted buildings are
presented in Figs. 8 to 11. This study reveals that fragility curves for all damage
scales used in this study have similar graphs and only different amounts. This fact
proves that performance level of the building (such as Immediate Occupancy
(IO), Life Safety (LS), and Collapse Prevention (CP)) improves significantly after
a retrofitting. Moreover, under the same strength seismic vibration, retrofitted
structures exhibit a lower damage scale.
Fig. 8. Fragility curve of the original building with different damage scales.
926 H. Hamidi Jamnani et al.
Journal of Engineering Science and Technology April 2017, Vol. 12(4)
Fig. 9. Fragility curves of the CBF with different damage scales;
(a) model C1; (b) model C2 and (c) model C3.
Seismic Fragility Analysis of Improved RC Frames Using Different Types . . . . 927
Journal of Engineering Science and Technology April 2017, Vol. 12(4)
Fig. 10. Fragility curves of EBF with different damage scales;
(a) model E1; (b) model E2 and (c) model E3.
928 H. Hamidi Jamnani et al.
Journal of Engineering Science and Technology April 2017, Vol. 12(4)
Fig. 11. Fragility curves of BRB with different damage scales;
(a) model B1; (b) model B2 and (c) model B3.

Seismic Fragility Analysis of Improved RC Frames Using Different Types . . . . 929
Journal of Engineering Science and Technology April 2017, Vol. 12(4)
The fragility curves of the original and the retrofitted frames explain that; first,
when the force and intensity of the vibrations start to build up, damage scale of
the buildings begins to fluctuate, until each building has to tackle the maximum
level of seismic intensity it can resist and then collapses; second, with slight PGA
modifications, damage level alters substantially, which is the sign of response
amplitude uncertainty. Response amplitude uncertainty increases as PGA
increases and as a result nonlinear movements escalate.
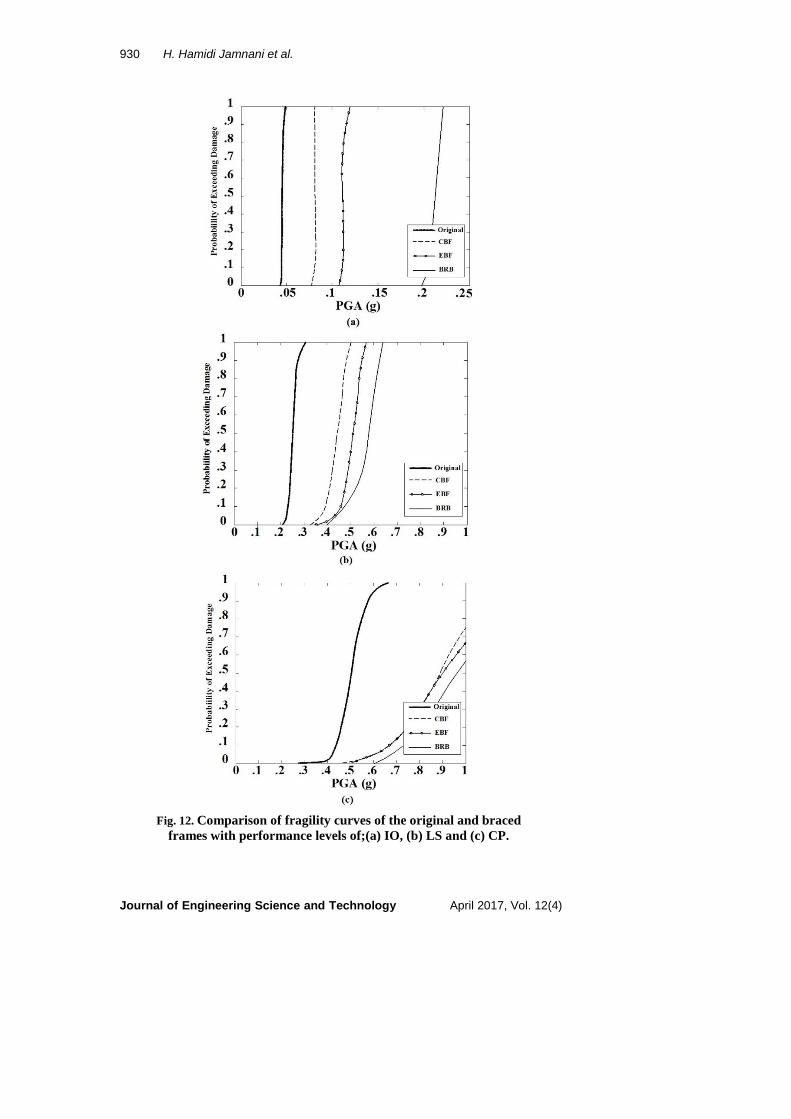
Regarding the fact that distribution of braces is just slightly different for each
type, it is only necessary to calculate standard deviation and average fragility
parameters [see Table 2] to compare their functionality. With this intention,
fragility curves are developed for each single damage scale, as can be seen in
Fig. 12, which proves the functionality and efficiency of the braces used. As the
figures indicate, when damage scale boosts, the braces act consummately and
increase the seismic performance of the building.
From this fact it can be concluded that, C3, E3, and B3 frames perform most
competently under various load distributions during seismic activities. These
frames, during seismic activities of the same strength, are less likely to collapse
when damage scale is high (CP for instance). This fact can be generalized about
all other damage scales. Load distribution in these braces is symmetrical and in
maximum distance. As a result, the anchor becomes more robust when torsion
increases and the distance between the center of stiffness and the center of mass
is minimized and so there are no torsions in the floor plan as a result of an
earthquake and the frames perform reliably.
From among the three models preferred (which means C3, E3 and B3), the
fragility curves show that B3 is the best bracing type. B3 employs BRB and
therefore its hysteric behavior is the same under pressure or compression (see
Fig. 4), and consequently it has a better seismic performance. Furthermore, the
comparison of the fragility curves of C3 and E3 shows that E3 performs better
than C3 under seismic activity, for it uses EBF. EBFs absorb more seismic
energy than CBFs, and consequently, destructive forces (such as kinetic and
potential energies) are reduced in eccentrically braced frames.
Abdollahzadeh and Faghihmaleki [36] have amply analyzed and evaluated the
performance of both steel and concrete BRBs and EBFs and compared the
amount of energy they absorb to the original amount of seismic force exerted on
the braces. Furthermore, Faghihmaleki et al. [37] have analyzed the effect of
structure height in seismic fragility curve. Peak ground acceleration is estimated
as 0.22 to 0.39 for the IO level of performance. For LS level, this amount reaches
0.29 to 0.57 and for CP it hits at least 0.41.
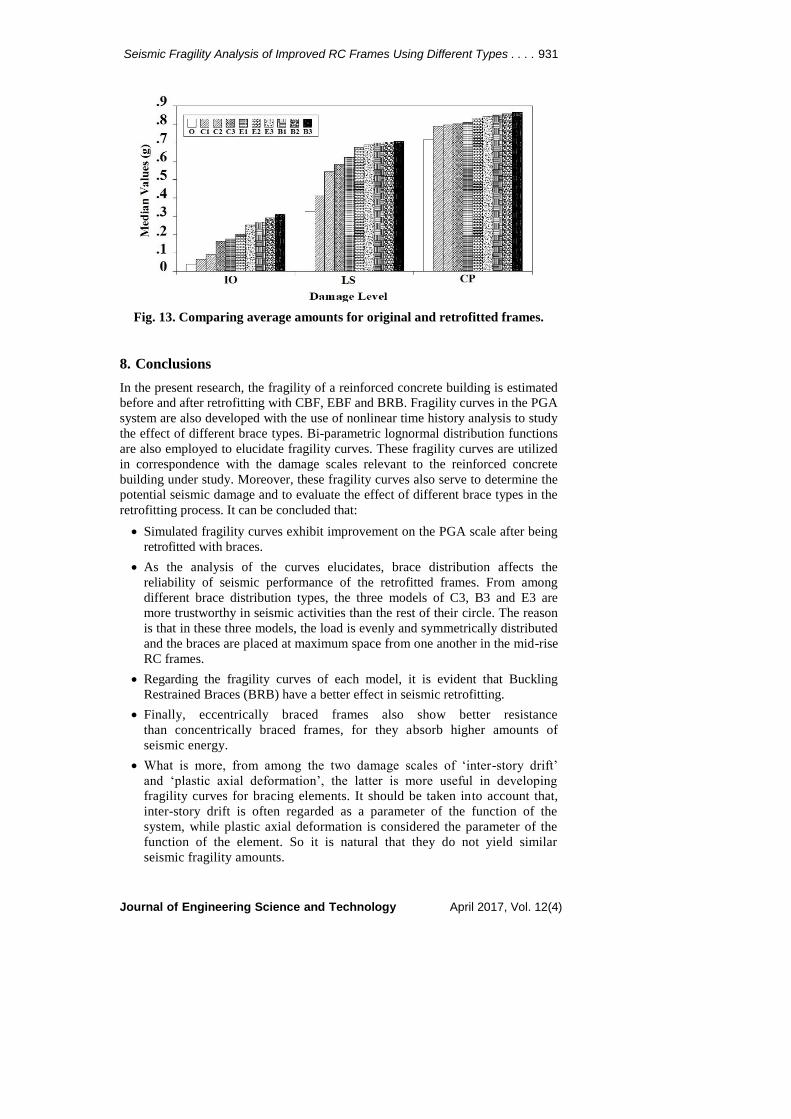
It is also evident that for average vibration intensity at each level, the changes
in retrofitted frames are puny. To better understand the consequences of brace
distribution, a histogram is used to illustrate the average probability of exceeding
the allowable limit (see Fig. 13).
930 H. Hamidi Jamnani et al.
Journal of Engineering Science and Technology April 2017, Vol. 12(4)
Fig. 12. Comparison of fragility curves of the original and braced
frames with performance levels of;(a) IO, (b) LS and (c) CP.
Seismic Fragility Analysis of Improved RC Frames Using Different Types . . . . 931
Journal of Engineering Science and Technology April 2017, Vol. 12(4)
Fig. 13. Comparing average amounts for original and retrofitted frames.
8. Conclusions
In the present research, the fragility of a reinforced concrete building is estimated
before and after retrofitting with CBF, EBF and BRB. Fragility curves in the PGA
system are also developed with the use of nonlinear time history analysis to study
the effect of different brace types. Bi-parametric lognormal distribution functions
are also employed to elucidate fragility curves. These fragility curves are utilized
in correspondence with the damage scales relevant to the reinforced concrete
building under study. Moreover, these fragility curves also serve to determine the
potential seismic damage and to evaluate the effect of different brace types in the
retrofitting process. It can be concluded that:
Simulated fragility curves exhibit improvement on the PGA scale after being
retrofitted with braces.
As the analysis of the curves elucidates, brace distribution affects the
reliability of seismic performance of the retrofitted frames. From among
different brace distribution types, the three models of C3, B3 and E3 are
more trustworthy in seismic activities than the rest of their circle. The reason
is that in these three models, the load is evenly and symmetrically distributed
and the braces are placed at maximum space from one another in the mid-rise
RC frames.
Regarding the fragility curves of each model, it is evident that Buckling
Restrained Braces (BRB) have a better effect in seismic retrofitting.
Finally, eccentrically braced frames also show better resistance
than concentrically braced frames, for they absorb higher amounts of
seismic energy.
What is more, from among the two damage scales of ‘inter-story drift’
and ‘plastic axial deformation’, the latter is more useful in developing
fragility curves for bracing elements. It should be taken into account that,
inter-story drift is often regarded as a parameter of the function of the
system, while plastic axial deformation is considered the parameter of the
function of the element. So it is natural that they do not yield similar
seismic fragility amounts.
932 H. Hamidi Jamnani et al.
Journal of Engineering Science and Technology April 2017, Vol. 12(4)
References
1. Al-Zand, A.W.; Badaruzzaman, W.H.W.; Mutalib, A.A.; and Hilo, S.J.
(2017). Modelling the delamination failure along the CFRP-CFST beam
interaction surface using different finite element techniques. Journal of
Engineering Science and Technology (JESTEC), 12(1), 214-228.
2. Khelifa, M.; and Celzard, A. (2014). Numerical analysis of flexural
strengthening of timber beams reinforced with CFRP strips. Journal of
Composite Structures, 111, 393-400.
3. Youssef, O.; ElGawady, M.A.; and Mills, J.E. (2016). Static cyclic behaviour
of FRP-confined crumb rubber concrete columns. Engineering Structures,
113, 371-387.
4. Allahyari, H.; Dehestani, M.; HosseynaliBeygi, M.; NavayiNeya, B.; and
Rahmani, E. (2014). Mechanical behavior of steel-concrete composite decks
with perfobond shear connectors. Journal of Steel and Composite Structures,
17(13), 339-358.
5. Naghipour, M.; Nematzadeh, M.; and Yahyazadeh, Q. (2011). Analytical and
experimental study on flexural performance of WPC_FRP beams. Journal of
Construction and Building Materials, 25(2011), 829-837.
6. Di Sarno, L.; and Elnashai, A.S. (2009). Bracing systems for seismic
retrofitting of steel frames. Journal of Constructional Steel Research, 65(2),
452-465.
7. Tan. H.; Huang, L.; Yan, L.; Yi, H.; and Tian, X. (2014). Seismic behavior of
newly constructed three-bay steel X-braced RC space frame. Journal of
Earthquake and Tsunami, 8(4), 1-17.
8. Nazri, F.M.; and Yan, P.S. (2014). Seismic performance of moment-resisting
concrete Frames subjected to earthquake excitation. Journal of Engineering
Science and Technology, 9(6), 717-727.
9. GhodratiAmiri, G.; Jamnani, H.H.; and Ahmadi H.R. (2009). The effect of
analysis methods on the response of steel dual-system frame buildings for
seismic retrofitting. International Journal of Engineering, 22(4), 317-331.
10. Parsaeifard, N.; and Nateghi, F.A. (2012). The effect of local damage on
energy absorption of steel frame buildings during earthquake. International
Journal of Engineering-Transactions B: Applications, 26(2), 143-152.
11. Pagni, C.A.; and Lowes, L.N. (2006). Fragility functions for older reinforced
concrete beam–column joints. Journal of Earthquake Spectra, 22(1), 215-
238.
12. Kappos, A.J.; Panagopoulos, G.; Panagiotopoulos, C.; and Penelis, G. (2006).
A hybrid method for the vulnerability assessment of RC and URM buildings.
Journal of Bulletin of Earthquake Engineering, 4(4), 391-413.
13. Jeong, S.-H.; and Elnashai, A.S. (2007). Probabilistic fragility analysis
parameterized by fundamental response quantities. Journal of Engineering
Structures, 29(6), 1238-1251.
14. Lagaros, N.D. (2008). Probabilistic fragility analysis of RC buildings
designed with different rules. Journal of Earthquake Engineering and
Engineering Vibrations, 7(1), 45-56.
Seismic Fragility Analysis of Improved RC Frames Using Different Types . . . . 933
Journal of Engineering Science and Technology April 2017, Vol. 12(4)
15. Kircil, M.S.; and Polat, Z. (2006). Fragility analysis of mid-rise RC frame
buildings. Journal of Engineering Structures, 28(9), 1335-1345.
16. Miranda, E.; and Akkar, S.D. (2006). Generalized inter story drift spectrum.
Journal of Structural Engineering, 132(6), 840-852.
17. Thomsen, J.H.; and Wallace, J.W. (1995). Displacement-based design of RC
structural wall: an experimental investigation of walls with rectangular and
T-shaped cross-sections. Report No. Cu/Cee-95-06, Department of Civil and
Environmental Engineering at Clark University, USA.
18. Estekanchi, H.; and Arjomandi, K. (2007). Comparison of damage indexes in
nonlinear time history analysis of steel moment frames. Asian Journal of
Civil Engineering (building and housing), 8(6), 629-646.
19. FEMA 306. (1998). Evaluation of earthquake damaged concrete and masonry
wall buildings. Federal Emergency Management Agency, Washington, D.C.
20. Standard No. 2800. (1990). Building and housing research center. Iranian
code of practice for seismic resistant design of buildings, 1st
revision, Tehran,
Iran.
21. Abdollahzadeh, G.R.; Faghihmaleki, H. (2017). A method to evaluate the
risk-based robustness index in blast-influenced structures. Earthquakes and
Structures, 12(1), 47- 54.
22. Standard No. 2800. (2013). Building and housing research center. Iranian
code of practice for seismic resistant design of buildings, 4th
revision, Tehran,
Iran.
23. Iranian National Building Code. (2009). Design and implementation of
concrete buildings. Office of National Building Regulations, Tehran, Iran.
24. FEMA 356. (2006). Prestandard and commentary for the seismic
rehabilitation of buildings. FEMA-356, Federal Emergency Management
Agency, Washington, D.C.
25. Faghihmaleki, H.; Nejati, F.; Mirzagoltabar-Roshan, A.; and Y. Batebi-
Motlagh. (2017). An evaluation of multi-hazard risk subjected to blast and
earthquake loads in RC moment frame with shear wall. Journal of
Engineering Science and Technology (JESTEC), 12(3), 636-647.
26. Adiyanto, M.I.; and Majid, T.A. (2014). Seismic design of two storey
reinforced concrete building in Malaysia with low class ductility. Journal of
Engineering Science and Technology (JESTEC), 9(1), 27-46.
27. Abdollahzadeh, G.R.; and Faghihmaleki, H. (2014). Response modification
factor of SMRF improved with EBF and BRBs. Journal of Advanced
Research in Dynamical and Control Systems, 6(4), 42-55.
28. Sabeli, R.; Mahin, S.; and Chang, C. (2003). Seismic demand on steel braces
frame building with buckling restrained braces. Journal of Engineering
Structures, 25(5), 655-666.
29. Abdollahzadeh, G.R.; and Banihashemi, M.R. (2013). Response modification
factor of dual moment resistant frame with buckling restrained brace (BRB).
Journal of Steel and Composite Structures, 14(6), 621-636.
30. Mazzolani, F.M. (2008). Innovative metal systems for seismic upgrading of
RC structures. Journal of Constructional Steel Research, 64(8), 82-95.
934 H. Hamidi Jamnani et al.
Journal of Engineering Science and Technology April 2017, Vol. 12(4)
31. D’Aniello, M.; Della Corte, G.; and Mazzolani, F.M. (2006). Seismic
upgrading of RC buildings by steel eccentric braces. Experimental results vs.
numerical modeling. Proceedings of the 5th
International Conference on
Behavior of Steel Structures in Seismic Areas.
32. Next Generation Attenuation, N.G.A. (2005). Project strong motion database.
Retrieved November 5, 2015, from http://peer.berkeley.edu/nga/.
33. SeismoSoft. (2012). Seismosignal. Earthquake engineering software
solutions. Version 5.1.0. Retrieved October 5, 2015, from http://www.seismo
soft.com/.
34. Symth, A.W.; Altay, G.; Deodatis, G.; Erdik, M.; Franco, G.; and Gülkan, P.
(2004). Probabilistic benefit-cost analysis for earthquake damage mitigation:
Evaluating measures for apartment houses in Turkey. Journal of Earthquake
Spectra, 20(1), 171-203.
35. Jamnai, H.H.; Faghihmaleki, H.; and Gholampour, S. (2014). Seismic
improvement of reinforced concrete buildings with X-brace by fragility
curve. 8th
National Congress on Civil Engineering, Babol Noshirvani
University of Technology, Babol, Iran.
36. Abdollahzadeh, G.R.; and Faghihmaleki, H. (2013). Seismic improvement of
concrete bending frames with shear-wall and BRB brace. 4th
International
Conference on Concrete & Development, Tehran, Iran.
37. Faghihmaleki, H.; Abdollahzadeh, G.; and Jamnani, H.H. (2014). Effect of
structure height in seismic fragility curve. Journal of Applied Mathematics in
Engineering, Management and Technology, 2(6), 498-503.