seismic performance assessment of high-rise building
TRANSCRIPT
International Research Journal of Engineering and Technology (IRJET) e-ISSN: 2395-0056
Volume: 08 Issue: 07 | July 2021 www.irjet.net p-ISSN: 2395-0072
© 2021, IRJET | Impact Factor value: 7.529 | ISO 9001:2008 Certified Journal | Page775
Seismic Performance Assessment of High-Rise Building
Chirag Ramesh Gudhka1, Sahil Shrikant Bhandari2, Pritesh Sudhir Morankar3, Aayush Deepak
Badade4
-----------------------------------------------------------------------***--------------------------------------------------------------------Abstract: From various studies, it is seen that the symmetric structure is more resistive to the wind and seismic load effects. A raft foundation can develop adequate resistance to horizontal and moment loadings and thus be suitable for buildings with moderate height. Story Shear (Drift) values are seen to be maximum at the base and gradually increase with Zone.
ETABS is useful for large and complex models to analyze the nonlinear construction sequencing and time effect. ETABS provides every detail of the member and helps in reducing the workload and design time. Manual calculations match with software results that provide an extra edge over the reliability and efficiency of the software.
Regular structure with RC moment-resisting frame and masonry walls performs better under seismic load compared to re-entrant corner structure which performs worse than irregular structure. Structures with shear walls are more efficient than the structure without shear walls in resisting lateral forces acting on the structure. The shear structure is hence suitable in earthquake-prone areas due to its higher stiffness and less displacement. Building models compared on different effects such as moments, shear force, lateral loads, drift, and base shear helps to choose the optimized design. Drift is decreased in a shear wall structure than frame structure. Story acceleration is more in shear structure than frame structure. The story drift due to wind load mainly acts in the middle of the structure and as the height of the building increases the story drift reduces while the story shear is maximum at the base. The Response Spectrum Method provides a real-time representation of seismic loads in the form of static loads and also demonstrates the behavior of the structure under it.
Seismic retrofitting an existing building most often would be more challenging than designing a new one. Viscous Dampers and seismic resisting devices such as shear walls, dampers, rubber pads, and spring can be used in new structures. The new techniques within the seismic style of structures or retrofitting of the present buildings are supported by everchanging the dynamic characteristics of the system to receive less seismic force.
1. Introduction
1.1 Introduction for High Rise Building
High-Rise building is not a modern feature, ancient cities in Egypt and Rome had living
accommodation up to 6 to 7 floors. As time passed through centuries, tall buildings were limited to religious and civic buildings. Even the commercial centers were not building high but instead use large plots of land. The general progress towards the high-rise building was seen with the industrial revolution and with the invention of lifts which help to build tall buildings with ease in reaching top floors and the subsequent population migration from rural to town and city living.
The first country to start constructing high-rise buildings in the 19th century in Chicago and soon in New York embarked on the development of high-rise buildings. But as the bricks were the major construction material, the general limit to the buildings was upmost 10 stories. As advances were made the quest for the true skyscraper was started in earnest. By the turn of the 19th-century, high-rise construction techniques had been all but perfected and with the adoption of the electrical Lift, high-rise living was a fact. The term “high-rise building” means any building having occupied floors located more than 75 feet above the lowest level of Fire Department vehicle access at that point of time under their national code of conduct.
As per the building code of India, tall buildings are one with more than four floors and high-rise is one with more than 15m in height. The BMC proposed a building with a height of 30m to be considered a high-rise building. But from the structural point of view, it can be defined as the building that its height will be affected by lateral forces resulting from earthquakes and wind forces to such an extent that such forces will play a major role in the process of design. In India, more than 2500 high-rise buildings, a majority of them are constructed in India’s commercial capital, Mumbai. Also, more than a thousand mid-rises exist already in the city. Mumbai has seen a massive construction boom with buildings reaching heights of 100, 150, 200, and even 250m.
1.2 Seismic Effect
As we move forward and look for sustainable development and continue the growth of the cities, we need software to calculate many factors that will affect the building in the long term. The wind and earthquake factors were earlier not taken into consideration and if they were considered they were the same for the different shapes, sizes, and methods. Hence new codes were developed worldwide and adopted for high-rise buildings. In India, we have the Bureau of Indian Standards that came up with the 6th revision of seismic
International Research Journal of Engineering and Technology (IRJET) e-ISSN: 2395-0056
Volume: 08 Issue: 06 | June 2021 www.irjet.net p-ISSN: 2395-0072
© 2021, IRJET | Impact Factor value: 7.529 | ISO 9001:2008 Certified Journal | Page 776
code IS1893 which covers the Design Earthquake Resistant Structure for High Rise Structures.
Broadly, earthquake-resistant buildings can be divided into four categories:
1. Earthquake Resistant-Operational
2. Earthquake Resistant-Immediate Occupancy
3. Earthquake Resistant-Life Safety
4. Earthquake Resistant-Collapse Prevention.
High-rises in most parts of India adopt the last, which simply may prevent a collapse. Further, high-rises need a separate code because how an earthquake hits a 5-storey building is very different from the way it hits a 20-storey building.
1.3 IS Code
Loads that need to be taken into consideration when designing a building are vertical loads from self-weight, imposed loads, snow loads, and horizontal loads from both wind and unintended inclinations. The horizontal loading from wind is sometimes the design load for tall buildings, which produces an instant within the column. The vertical loads are the self-weights, finishing loads, and live loads, and that they are transferred to the muse through columns, load-bearing walls, or towers.
IS 875 Part 1
● Dead Load:
Dead load is because of the self-weight of the structural elements like beams, columns, slabs, interior, and exterior walls. Dead loads are the permanent loads that are always present. Dead loads depend on the unit weight of the building material. Dead loads include the self-weight of walls, floors, beams, columns, etc. The unit weight of commonly used building materials is given within the code.
IS 875 Part 2
● Live Load:
Live loads on floors and roofs accommodate all the load masses which are temporarily placed on the structure, for example, a stack-like load of people, furniture, machines, etc. Live loads keep on changing with time. Live loads are also called imposed loads.
IS 875 Part 3
● Wind Load:
The force exerted by the horizontal component of wind is to be considered within the design of the building. Wind loads rely on the rate of the wind, shape, and size of the building. The strategy of calculating wind loads on the structure is given in IS 875 (Part-3):1987.
IS 1893 (2002)
Criteria for Earthquake Resistant Design of Structures,
Part 1: General Provisions and Buildings
The guidelines are given by the Indian Standard Codes for Earthquake Resistant Structure. After observing Indian earthquakes for several years, the Bureau of Indian Standard has divided the country into five zones depending upon the severity of the earthquake. The factor Earthquake Resistant Design is the topmost priority for designing a structure.
Earthquake loads rely upon the zone and place where the building is located. As per code, India is classified into four seismic zones. Now, it’s mandatory to follow these recommendations for the design of structures and recommends earthquake-resistant design of the structure.
IS 13920:2016
Ductile Design and Detailing of Reinforced Concrete Structure Subjected to Seismic Forces
It provides ductile detailing of varied members sort of a beam, columns, shear wall, etc. This will ensure the designated behavior of the RCC structure during cycling loads like an earthquake. These standard addresses lateral load resisting structural system of RC structure composed of:
a. RC moment-resisting frames
b. RC moment-resisting frames with unreinforced masonry infill walls
c. RC moment-resisting frames with RC structural walls
d. RC structural walls
This shall be adopted for all lateral loads systems and in several Seismic Zones like Seismic Zone III, IV, or V (Standard optional is Seismic Zone II). Further, the code covers the details and formula for Longitudinal Reinforcement, Transverse Reinforcement, Special Confining Reinforcement & Special Shear Walls.
International Research Journal of Engineering and Technology (IRJET) e-ISSN: 2395-0056
Volume: 08 Issue: 06 | June 2021 www.irjet.net p-ISSN: 2395-0072
2. Aim and Objective
Aim
In this project, we will assess the sustainability and performance of high-rise stack-like buildings against Earthquake and Wind loads.
Also, to calculate the Base Shear, Bending Moment, Drift, and Torsion.
We are also going to check the reliability of the E-Tabs software.
Objective
To know the effects of the seismic forces on the overall structure.
To understand the effect of wind forces on different floors of a multi-rise structure.
To determine the safety of the structure against all the external forces that can act on the structure.
To learn the advantages of the software in the assessment of a high-rise structure.
3. Seismic Performance Assessment of High-Rise Building
1. In this project, we are going to assess the sustainability and Performance of a High-Rise Building against Earthquake Loads.
2. The Software that we are adopting for the design and analysis is ETABS.
3. Also, we are Checking the Reliability of the software for design and analysis purposes by comparing it with Manual Calculations.
4. The reliability of the software is checked by analyzing a G+6 structure manually and on ETABS.
5. In our manual calculations, we have evaluated the stability of the structure by using Kani’s Method and we have also designed a generalized Excel Sheet for load calculations and analysis of the structure.
6. For analyzing the stability of the structure different methods such as Moment Distribution Method, Stiffness Matrix Method, Kani’s Method, etc. can be used.
7. For the calculation of Seismic Loading, the Response Spectrum Method is used.
4. Methodology
Kani’s Method
Prof. Gasper Kani of Germany in 1947 first introduced Kani’s method. The method is named after him. This is an indirect extension of the slope deflection method. This is an efficient method due to the simplicity
of moment distribution. The method offers an iterative scheme for applying the slope deflection method of structural analysis. Whereas the moment distribution method reduces the number of linear simultaneous equations and such equations needed is equal to the number of translator displacements, the number of equations needed is zero in case of the Kani’s method. Kani developed a method of iteration for statically indeterminate structures. It is an approximate method that can save a good amount of time compared to the moment distribution method, especially when considering structural floors with a couple of stories or more.
This method may be considered as a further simplification of the moment distribution method wherein the problems involving sway were attempted in a tabular form thrice (for double story frames) and two shear coefficients had to be determined which when inserted in end moments gave us the end moments. All this effort can be cut short very considerably by using this method. Kani developed a method of iteration for statically indeterminate structures. It is an approximate method that can save a great deal of time compared to the moment distribution method, especially when considering structural floors with a couple of stories or more. If you know the sum of restrained moments at a joint and know all the rotation contributions of members meeting at that point, you can find the end rotation contributions. After systematically working through the frame, you can determine the moments in those members in the structural frame.
Advantages of Kani’s method:
•All the computations are carried out in a single line diagram of the structure.
•The effects of joint rotations and sway are considered in each cycle of iteration. Henceforth, no need to derive and solve the simultaneous equations. This method thus becomes very effective and easy to use especially in the case of multistory building frames.
•The method is self-correcting, that is, the error, if any, in a cycle is corrected automatically in the subsequent cycles. The checking is easier as only the last cycle is required to be checked.
•The convergence is quick. It leads to the solutions in just a few cycles of iterations.
5. Software
Various types of software that are commonly used nowadays are enlisted below. In the construction industry, the innovation of software has stood as a boon for the analysis of structures. Instead of manual calculations, the software gives us various kinds of
© 2021, IRJET | Impact Factor value: 7.529 | ISO 9001:2008 Certified Journal | Page 777
International Research Journal of Engineering and Technology (IRJET) e-ISSN: 2395-0056
Volume: 08 Issue: 06 | June 2021 www.irjet.net p-ISSN: 2395-0072
results with a single click. They also suggest some better structures in case of failure.
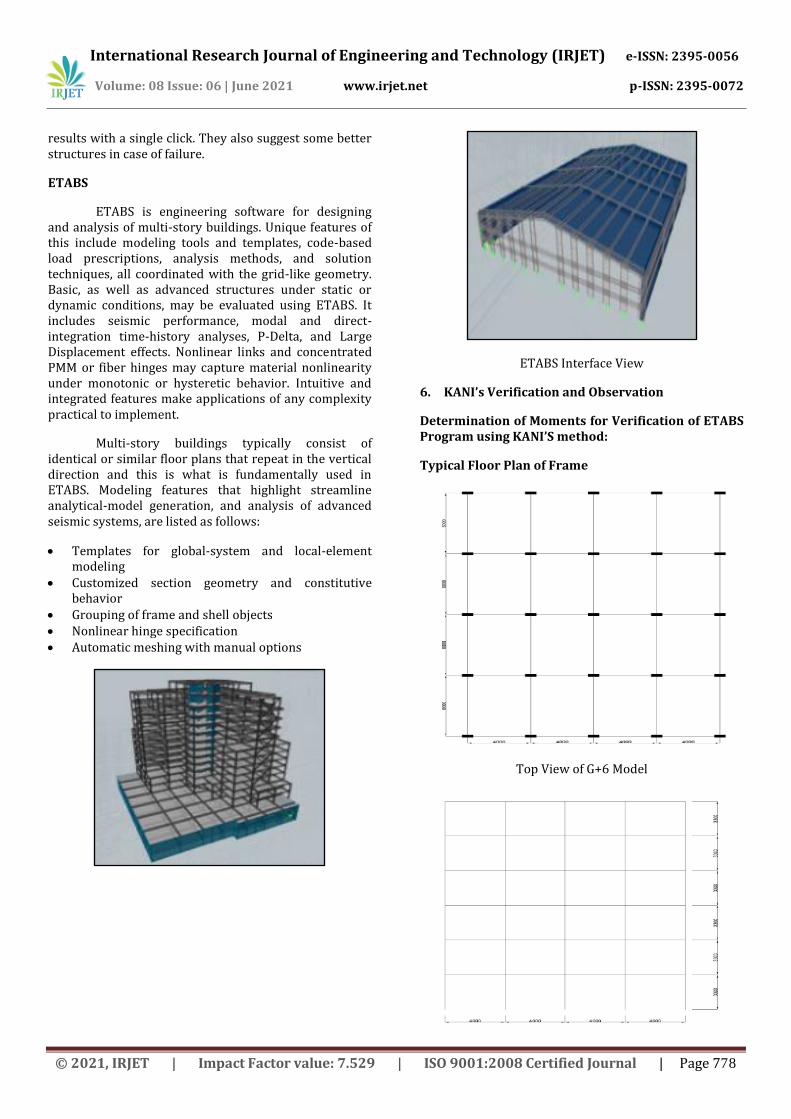
ETABS
ETABS is engineering software for designing and analysis of multi-story buildings. Unique features of this include modeling tools and templates, code-based load prescriptions, analysis methods, and solution techniques, all coordinated with the grid-like geometry. Basic, as well as advanced structures under static or dynamic conditions, may be evaluated using ETABS. It includes seismic performance, modal and direct-integration time-history analyses, P-Delta, and Large Displacement effects. Nonlinear links and concentrated PMM or fiber hinges may capture material nonlinearity under monotonic or hysteretic behavior. Intuitive and integrated features make applications of any complexity practical to implement.
Multi-story buildings typically consist of identical or similar floor plans that repeat in the vertical direction and this is what is fundamentally used in ETABS. Modeling features that highlight streamline analytical-model generation, and analysis of advanced seismic systems, are listed as follows:
Templates for global-system and local-element modeling
Customized section geometry and constitutive behavior
Grouping of frame and shell objects Nonlinear hinge specification Automatic meshing with manual options
ETABS Interface View
6. KANI’s Verification and Observation
Determination of Moments for Verification of ETABS Program using KANI’S method:
Typical Floor Plan of Frame
Top View of G+6 Model
© 2021, IRJET | Impact Factor value: 7.529 | ISO 9001:2008 Certified Journal | Page 778
International Research Journal of Engineering and Technology (IRJET) e-ISSN: 2395-0056
Volume: 08 Issue: 06 | June 2021 www.irjet.net p-ISSN: 2395-0072
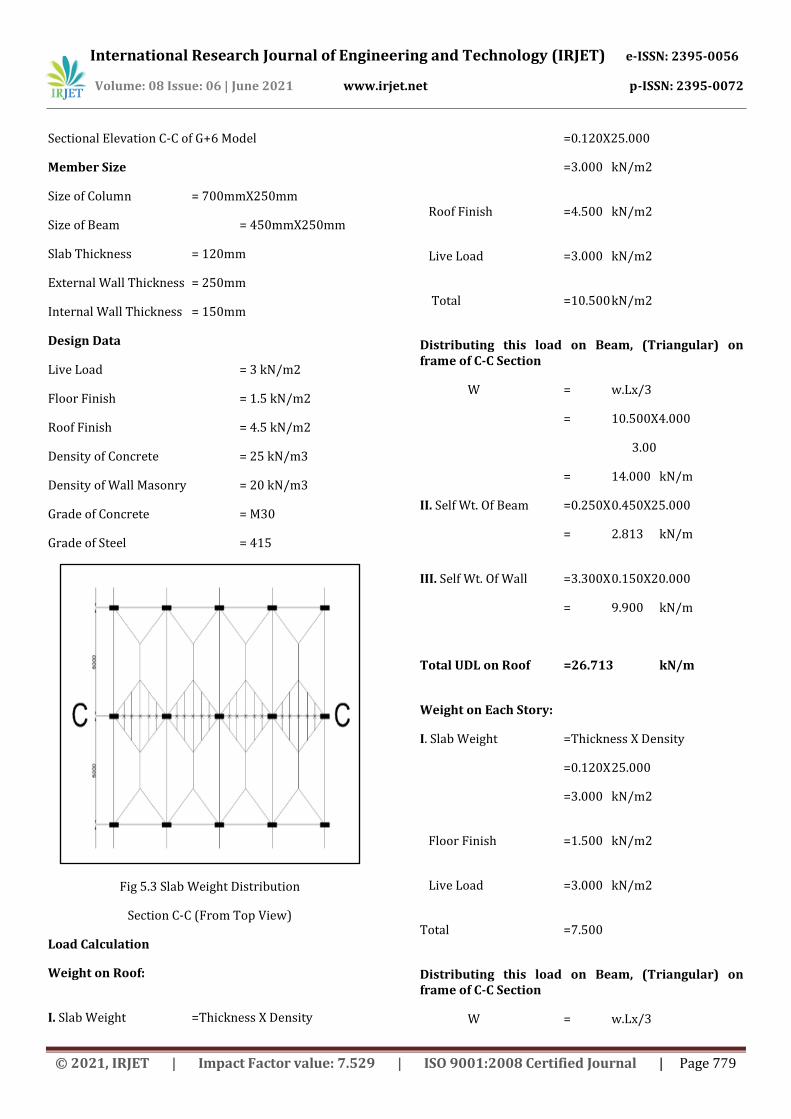
Sectional Elevation C-C of G+6 Model
Member Size
Size of Column = 700mmX250mm
Size of Beam = 450mmX250mm
Slab Thickness = 120mm
External Wall Thickness = 250mm
Internal Wall Thickness = 150mm
Design Data
Live Load = 3 kN/m2
Floor Finish = 1.5 kN/m2
Roof Finish = 4.5 kN/m2
Density of Concrete = 25 kN/m3
Density of Wall Masonry = 20 kN/m3
Grade of Concrete = M30
Grade of Steel = 415
Fig 5.3 Slab Weight Distribution
Section C-C (From Top View)
Load Calculation
Weight on Roof:
I. Slab Weight =Thickness X Density
=0.120X25.000
=3.000 kN/m2
Roof Finish =4.500 kN/m2
Live Load =3.000 kN/m2
Total =10.500 kN/m2
Distributing this load on Beam, (Triangular) on frame of C-C Section
W = w.Lx/3
= 10.500X4.000
3.00
= 14.000 kN/m
II. Self Wt. Of Beam =0.250X 0.450X25.000
= 2.813 kN/m
III. Self Wt. Of Wall =3.300X 0.150X20.000
= 9.900 kN/m
Total UDL on Roof =26.713 kN/m
Weight on Each Story:
I. Slab Weight =Thickness X Density
=0.120X 25.000
=3.000 kN/m2
Floor Finish =1.500 kN/m2
Live Load =3.000 kN/m2
Total =7.500
Distributing this load on Beam, (Triangular) on frame of C-C Section
W = w.Lx/3
© 2021, IRJET | Impact Factor value: 7.529 | ISO 9001:2008 Certified Journal | Page 779
International Research Journal of Engineering and Technology (IRJET) e-ISSN: 2395-0056
Volume: 08 Issue: 06 | June 2021 www.irjet.net p-ISSN: 2395-0072
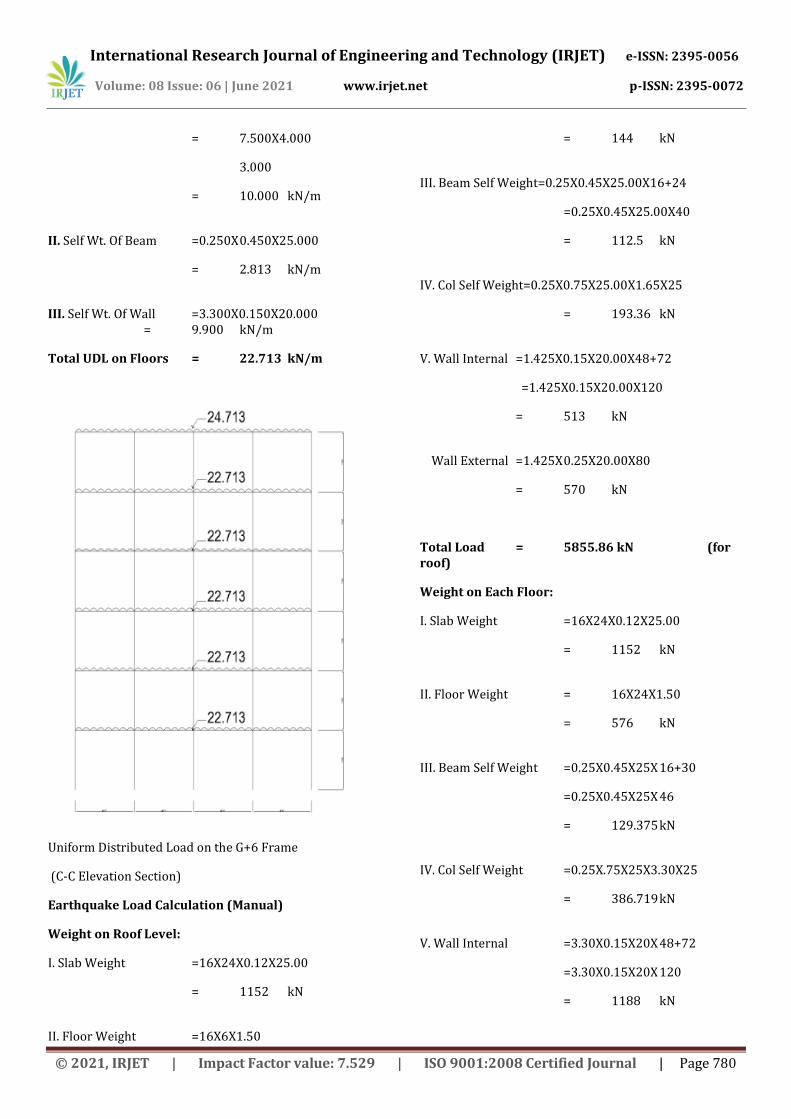
= 7.500X4.000
3.000
= 10.000 kN/m
II. Self Wt. Of Beam =0.250X 0.450X25.000
= 2.813 kN/m
III. Self Wt. Of Wall =3.300X0.150X20.000 = 9.900 kN/m
Total UDL on Floors = 22.713 kN/m
Uniform Distributed Load on the G+6 Frame
(C-C Elevation Section)
Earthquake Load Calculation (Manual)
Weight on Roof Level:
I. Slab Weight =16X24X0.12X25.00
= 1152 kN
II. Floor Weight =16X6X1.50
= 144 kN
III. Beam Self Weight=0.25X0.45X25.00X16+24
=0.25X0.45X25.00X40
= 112.5 kN
IV. Col Self Weight=0.25X0.75X25.00X1.65X25
= 193.36 kN
V. Wall Internal =1.425X0.15X20.00X48+72
=1.425X0.15X20.00X120
= 513 kN
Wall External =1.425X 0.25X20.00X80
= 570 kN
Total Load = 5855.86 kN (for roof)
Weight on Each Floor:
I. Slab Weight =16X24X0.12X25.00
= 1152 kN
II. Floor Weight = 16X24X1.50
= 576 kN
III. Beam Self Weight =0.25X0.45X25X 16+30
=0.25X0.45X25X 46
= 129.375 kN
IV. Col Self Weight =0.25X.75X25X3.30X25
= 386.719 kN
V. Wall Internal =3.30X0.15X20X 48+72
=3.30X0.15X20X 120
= 1188 kN
© 2021, IRJET | Impact Factor value: 7.529 | ISO 9001:2008 Certified Journal | Page 780
International Research Journal of Engineering and Technology (IRJET) e-ISSN: 2395-0056
Volume: 08 Issue: 06 | June 2021 www.irjet.net p-ISSN: 2395-0072
Wall External =3.30X0.25X20X 80
= 1320 kN
VI. Live Load =16X6X 3.00
= 288 kN
Total Load = 5040.094 kN (for typical floor)
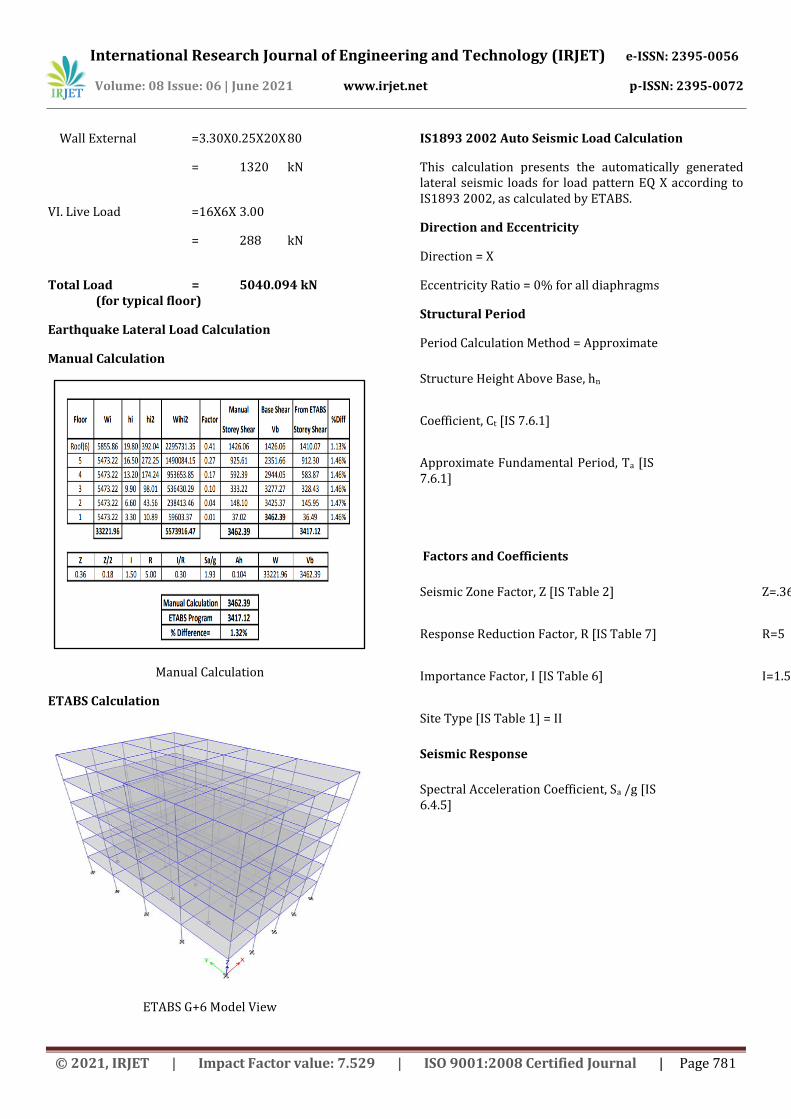
Earthquake Lateral Load Calculation
Manual Calculation
Manual Calculation
ETABS Calculation
ETABS G+6 Model View
IS1893 2002 Auto Seismic Load Calculation
This calculation presents the automatically generated lateral seismic loads for load pattern EQ X according to IS1893 2002, as calculated by ETABS.
Direction and Eccentricity
Direction = X
Eccentricity Ratio = 0% for all diaphragms
Structural Period
Period Calculation Method = Approximate
Structure Height Above Base, hn hn=19.8 m
Coefficient, Ct [IS 7.6.1] Ct=0.075m
Approximate Fundamental Period, Ta [IS 7.6.1]
Ta=0.704 sec
Factors and Coefficients
Seismic Zone Factor, Z [IS Table 2] Z=.36
Response Reduction Factor, R [IS Table 7] R=5
Importance Factor, I [IS Table 6] I=1.5
Site Type [IS Table 1] = II
Seismic Response
Spectral Acceleration Coefficient, Sa /g [IS 6.4.5]
Sa /g=1.36
© 2021, IRJET | Impact Factor value: 7.529 | ISO 9001:2008 Certified Journal | Page 781
International Research Journal of Engineering and Technology (IRJET) e-ISSN: 2395-0056
Volume: 08 Issue: 06 | June 2021 www.irjet.net p-ISSN: 2395-0072
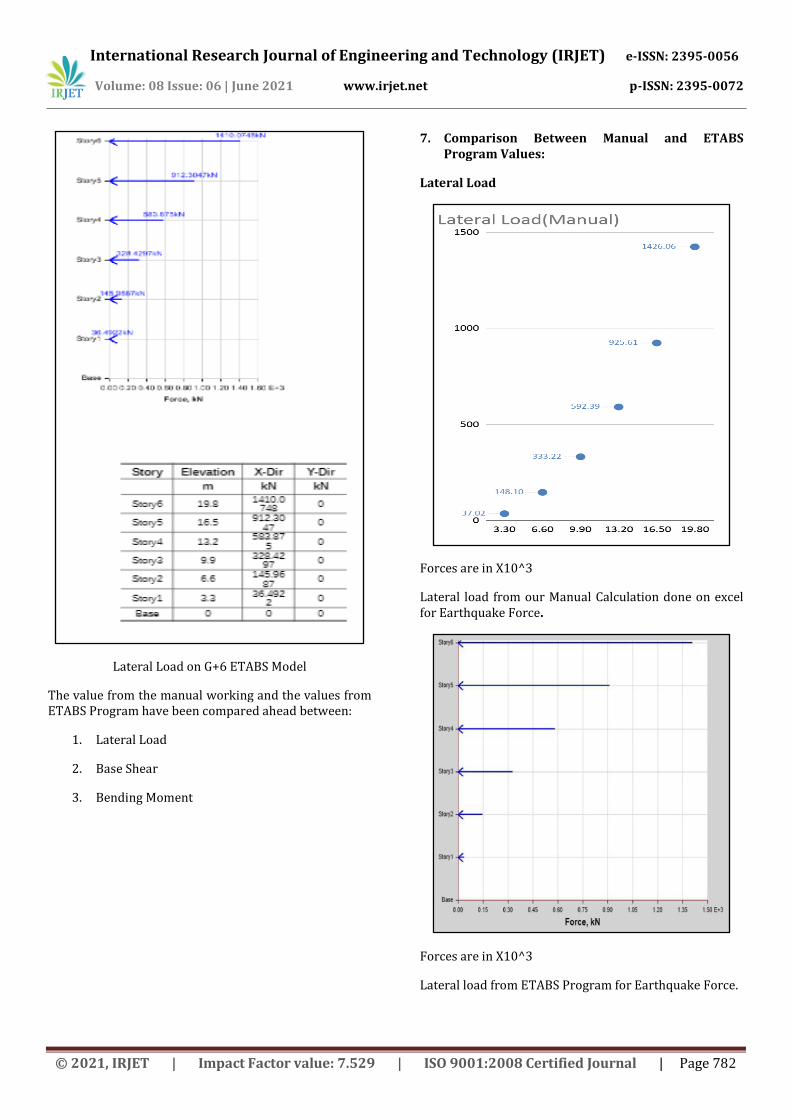
Lateral Load on G+6 ETABS Model
The value from the manual working and the values from ETABS Program have been compared ahead between:
1. Lateral Load
2. Base Shear
3. Bending Moment
7. Comparison Between Manual and ETABS Program Values:
Lateral Load
Forces are in X10^3
Lateral load from our Manual Calculation done on excel for Earthquake Force.
Forces are in X10^3
Lateral load from ETABS Program for Earthquake Force.
© 2021, IRJET | Impact Factor value: 7.529 | ISO 9001:2008 Certified Journal | Page 782
International Research Journal of Engineering and Technology (IRJET) e-ISSN: 2395-0056
Volume: 08 Issue: 06 | June 2021 www.irjet.net p-ISSN: 2395-0072
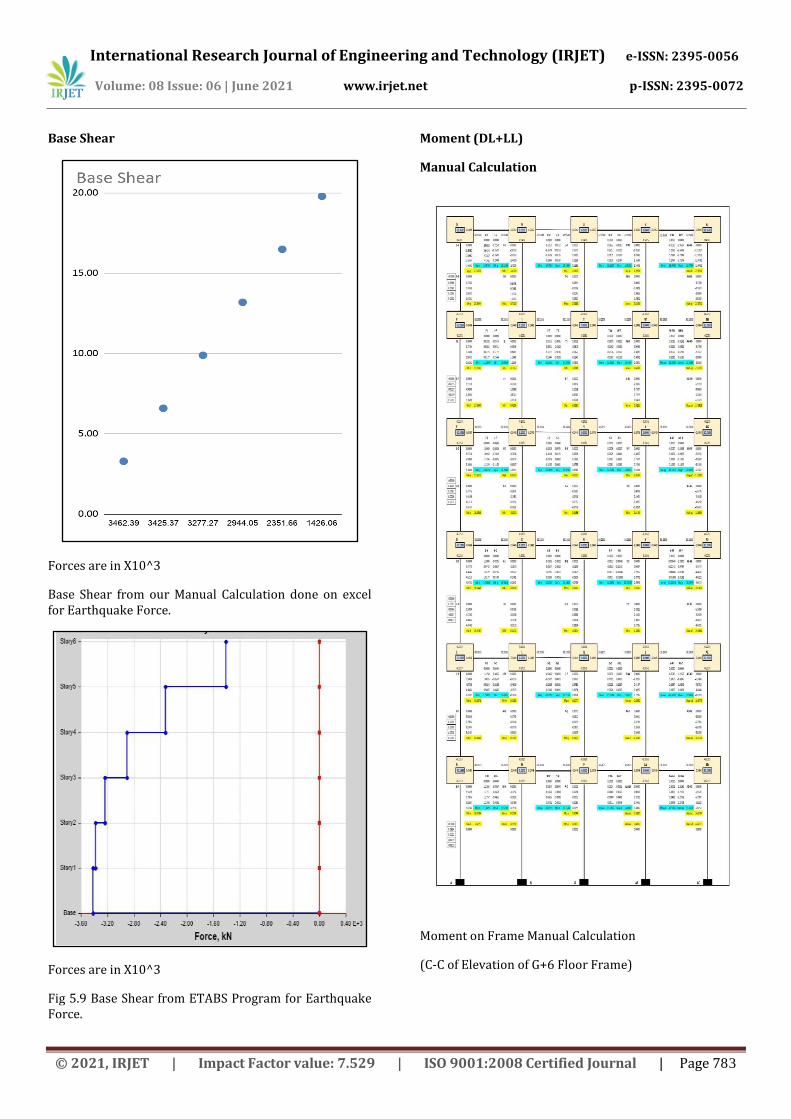
Base Shear
Forces are in X10^3
Base Shear from our Manual Calculation done on excel for Earthquake Force.
Forces are in X10^3
Fig 5.9 Base Shear from ETABS Program for Earthquake Force.
Moment (DL+LL)
Manual Calculation
Moment on Frame Manual Calculation
(C-C of Elevation of G+6 Floor Frame)
© 2021, IRJET | Impact Factor value: 7.529 | ISO 9001:2008 Certified Journal | Page 783
International Research Journal of Engineering and Technology (IRJET) e-ISSN: 2395-0056
Volume: 08 Issue: 06 | June 2021 www.irjet.net p-ISSN: 2395-0072
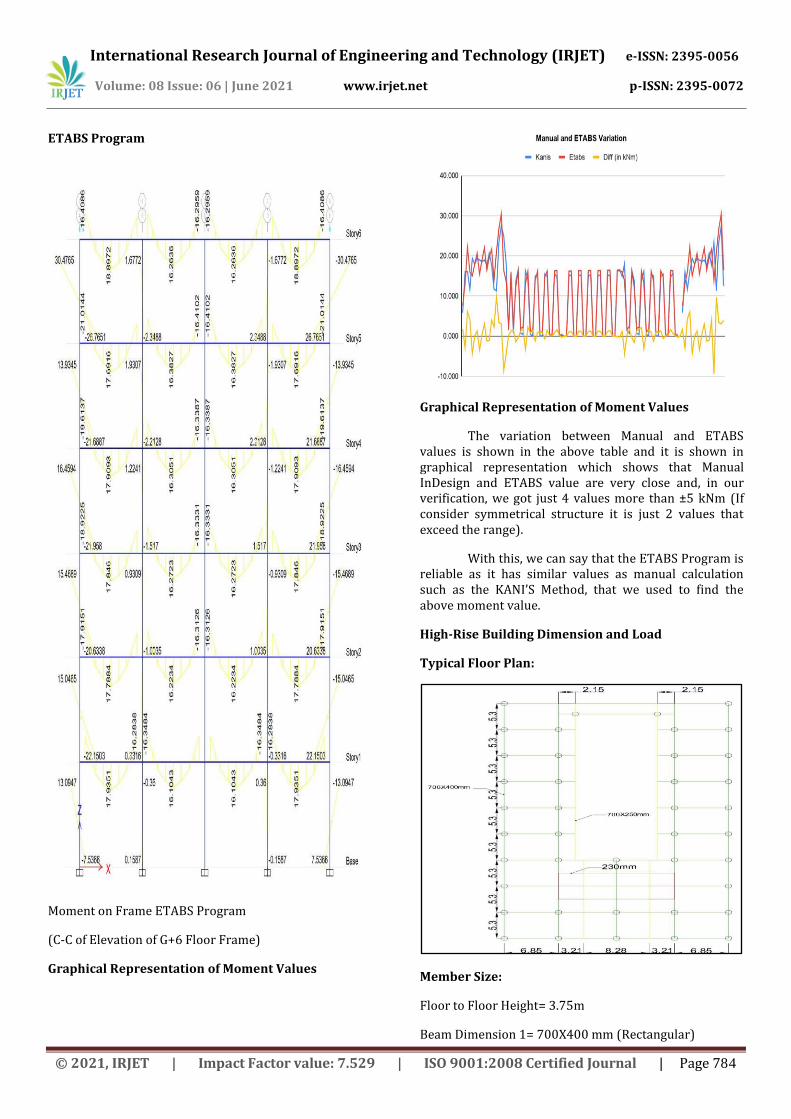
ETABS Program
Moment on Frame ETABS Program
(C-C of Elevation of G+6 Floor Frame)
Graphical Representation of Moment Values
Graphical Representation of Moment Values
The variation between Manual and ETABS values is shown in the above table and it is shown in graphical representation which shows that Manual InDesign and ETABS value are very close and, in our verification, we got just 4 values more than ±5 kNm (If consider symmetrical structure it is just 2 values that exceed the range).
With this, we can say that the ETABS Program is reliable as it has similar values as manual calculation such as the KANI’S Method, that we used to find the above moment value.
High-Rise Building Dimension and Load
Typical Floor Plan:
Member Size:
Floor to Floor Height= 3.75m
Beam Dimension 1= 700X400 mm (Rectangular)
© 2021, IRJET | Impact Factor value: 7.529 | ISO 9001:2008 Certified Journal | Page 784

International Research Journal of Engineering and Technology (IRJET) e-ISSN: 2395-0056
Volume: 08 Issue: 06 | June 2021 www.irjet.net p-ISSN: 2395-0072
Beam Dimension 2= 700X250 mm (Rectangular)
Column Dimension= 900 mm (Circular)
Slab Dimension= 150 mm
Exterior Wall Dimension= 250 mm
Interior Wall Dimension= 150 mm
Shear Wall Dimension= 230 mm
Grade of Concrete M30
Grade of Steel Fy415
Design Data:
Density of Concrete= 25
Density of Masonry= 20
Live Load= 3 kN/m2
Floor Finish= 1.5 kN/m2
Roof Finish= 4.5 kN/m2
Wind Load is applied on Diaphragm
Earthquake Load= 1.5 kN/m2 (Half of Live Load)
Mass Source:
Dead Load 100%
Live Load 25%
Floor Finish 25%
Roof Finish 25%
ETABS Model Data:
Typical floor plan of High-Rise Building
© 2021, IRJET | Impact Factor value: 7.529 | ISO 9001:2008 Certified Journal | Page 785
International Research Journal of Engineering and Technology (IRJET) e-ISSN: 2395-0056
Volume: 08 Issue: 06 | June 2021 www.irjet.net p-ISSN: 2395-0072
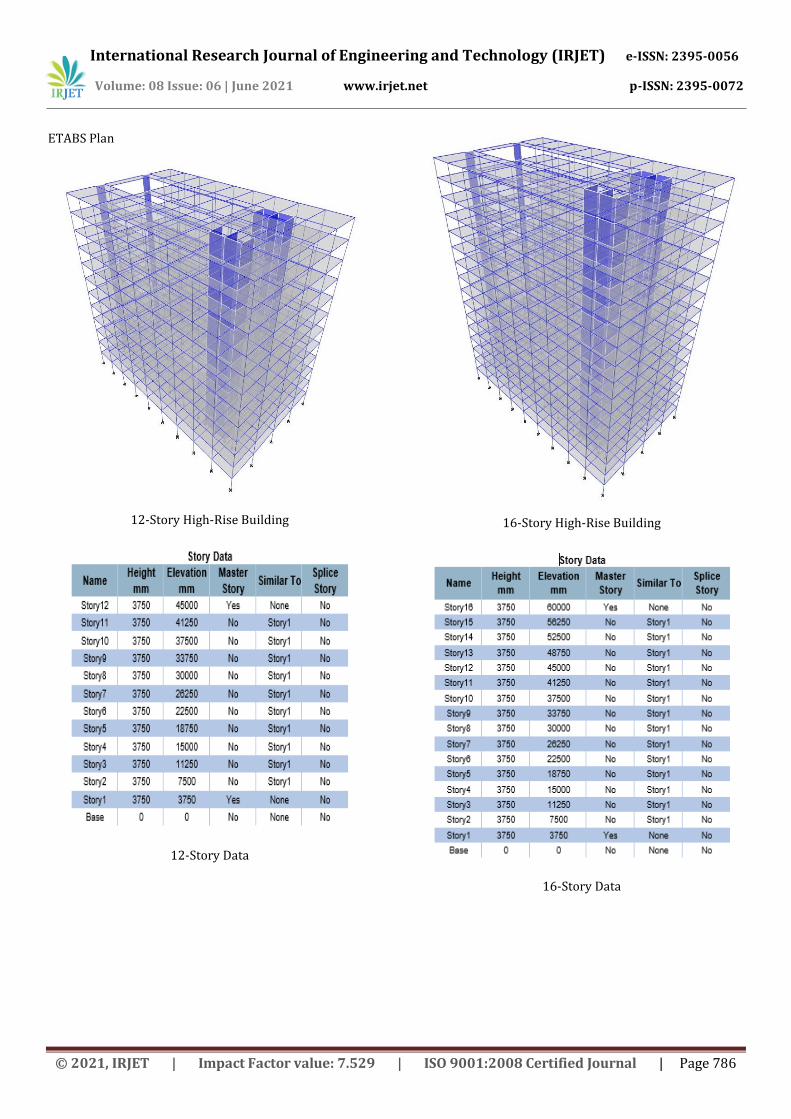
ETABS Plan
12-Story High-Rise Building
12-Story Data
16-Story High-Rise Building
16-Story Data
© 2021, IRJET | Impact Factor value: 7.529 | ISO 9001:2008 Certified Journal | Page 786
International Research Journal of Engineering and Technology (IRJET) e-ISSN: 2395-0056
Volume: 08 Issue: 06 | June 2021 www.irjet.net p-ISSN: 2395-0072
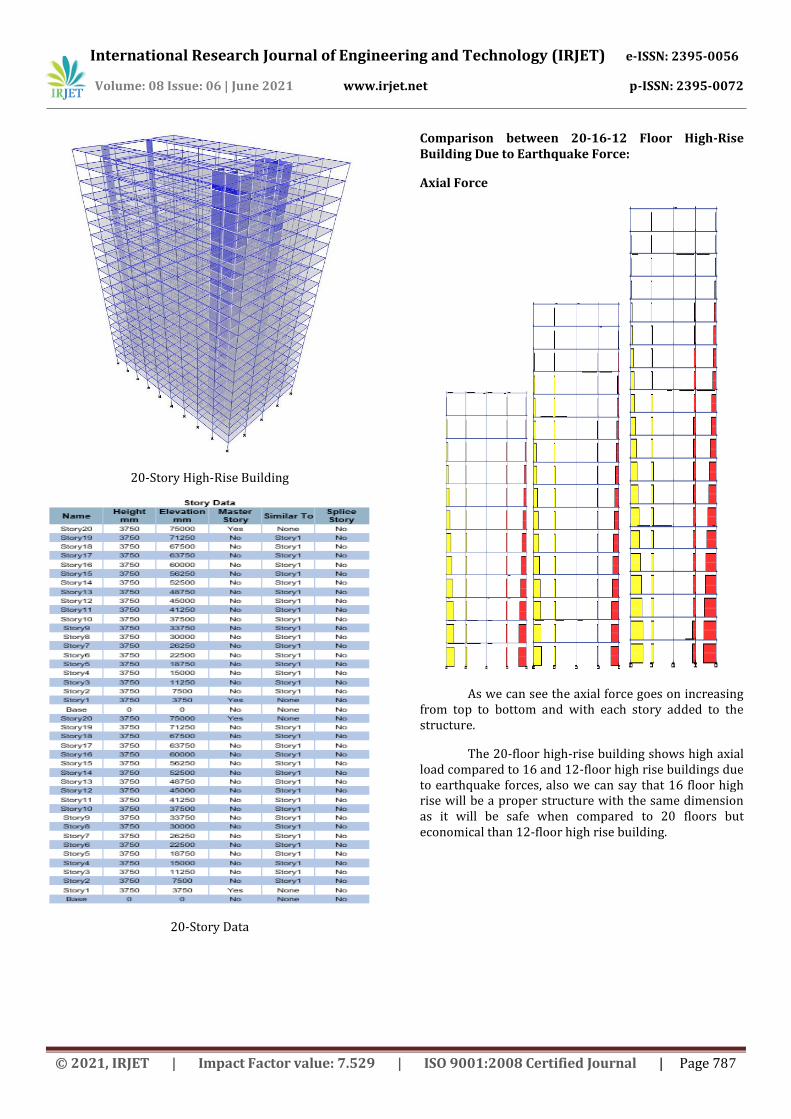
20-Story High-Rise Building
20-Story Data
Comparison between 20-16-12 Floor High-Rise Building Due to Earthquake Force:
Axial Force
As we can see the axial force goes on increasing from top to bottom and with each story added to the structure.
The 20-floor high-rise building shows high axial load compared to 16 and 12-floor high rise buildings due to earthquake forces, also we can say that 16 floor high rise will be a proper structure with the same dimension as it will be safe when compared to 20 floors but economical than 12-floor high rise building.
© 2021, IRJET | Impact Factor value: 7.529 | ISO 9001:2008 Certified Journal | Page 787
International Research Journal of Engineering and Technology (IRJET) e-ISSN: 2395-0056
Volume: 08 Issue: 06 | June 2021 www.irjet.net p-ISSN: 2395-0072
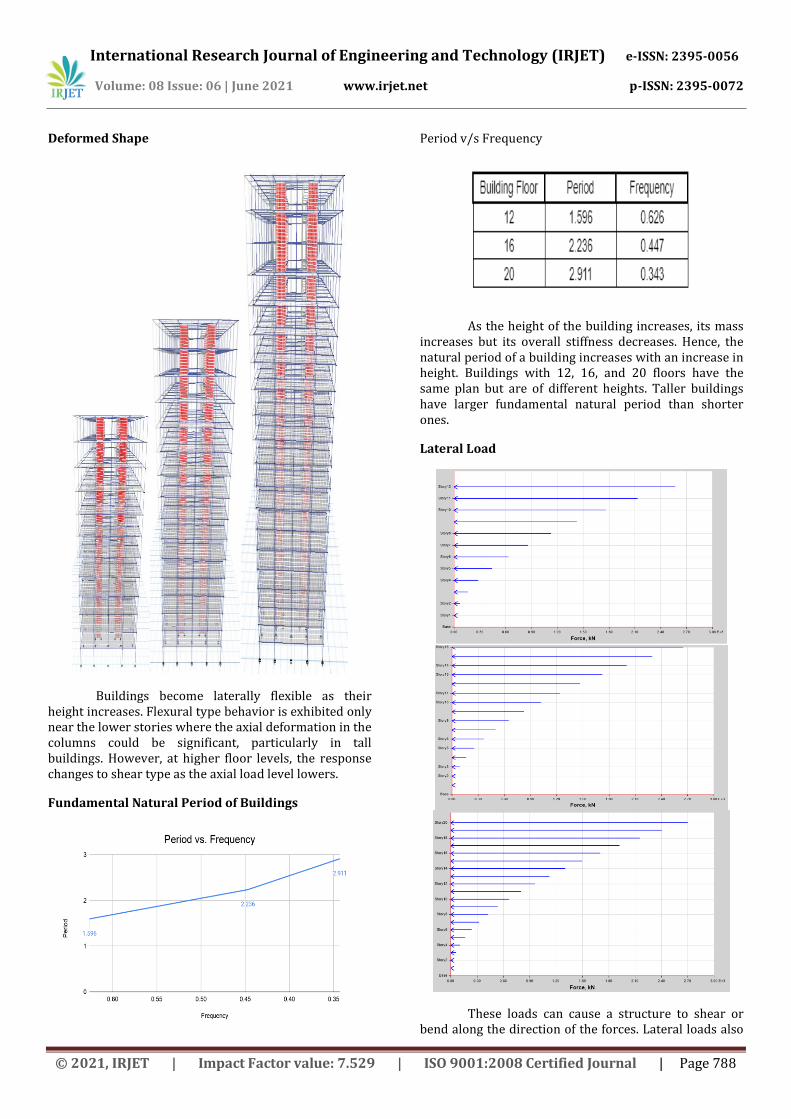
as their height increases. Flexural type behavior is exhibited only near the lower stories where the axial deformation in the columns could be significant, particularly in tall buildings. However, at higher floor levels, the response changes to shear type as the axial load level lowers.
Fundamental Natural Period of Buildings
Period v/s Frequency
As the height of the building increases, its mass increases but its overall stiffness decreases. Hence, the natural period of a building increases with an increase in height. Buildings with 12, 16, and 20 floors have the same plan but are of different heights. Taller buildings have larger fundamental natural period than shorter ones.
Lateral Load
These loads can cause a structure to shear or bend along the direction of the forces. Lateral loads also
Deformed Shape
Buildings become laterally flexible
© 2021, IRJET | Impact Factor value: 7.529 | ISO 9001:2008 Certified Journal | Page 788
International Research Journal of Engineering and Technology (IRJET) e-ISSN: 2395-0056
Volume: 08 Issue: 06 | June 2021 www.irjet.net p-ISSN: 2395-0072
exert constant and instantaneous forces and vary with the shape and height of the building. Hence, we see that a 20-floor high-rise building faces high lateral force and deforms mode than the other two.
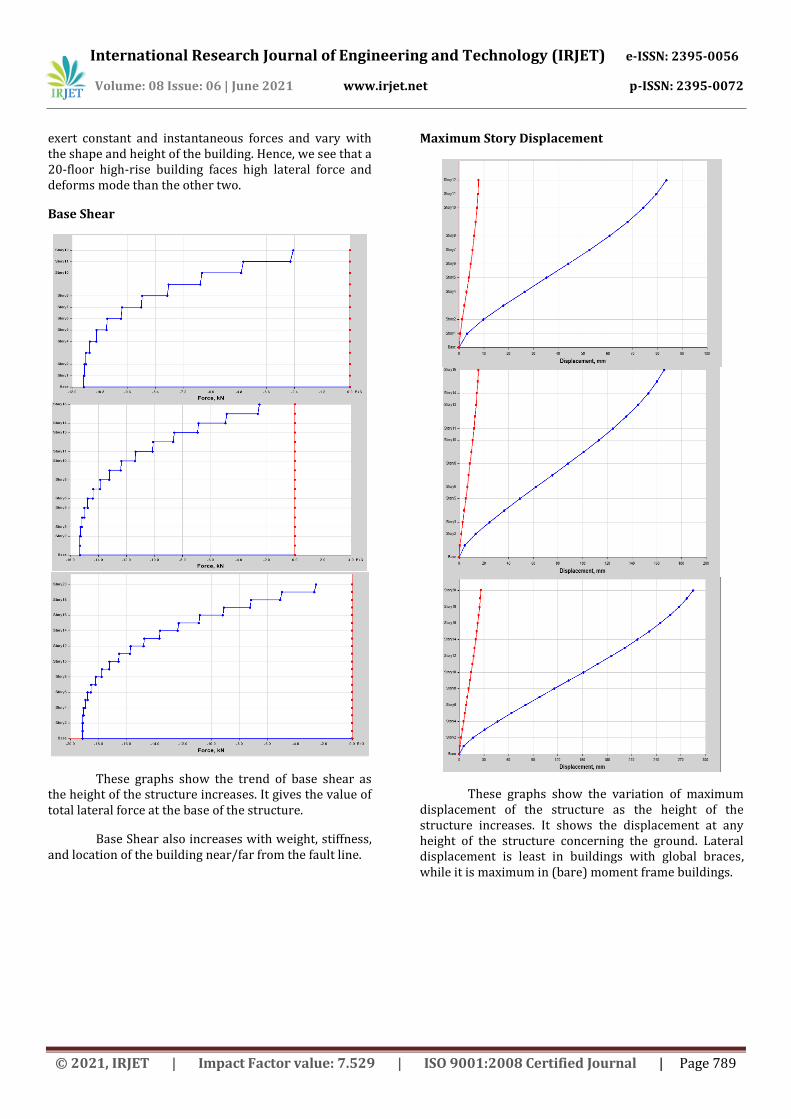
Base Shear
These graphs show the trend of base shear as the height of the structure increases. It gives the value of total lateral force at the base of the structure.
Base Shear also increases with weight, stiffness, and location of the building near/far from the fault line.
Maximum Story Displacement
These graphs show the variation of maximum displacement of the structure as the height of the structure increases. It shows the displacement at any height of the structure concerning the ground. Lateral displacement is least in buildings with global braces, while it is maximum in (bare) moment frame buildings.
© 2021, IRJET | Impact Factor value: 7.529 | ISO 9001:2008 Certified Journal | Page 789
International Research Journal of Engineering and Technology (IRJET) e-ISSN: 2395-0056
Volume: 08 Issue: 06 | June 2021 www.irjet.net p-ISSN: 2395-0072
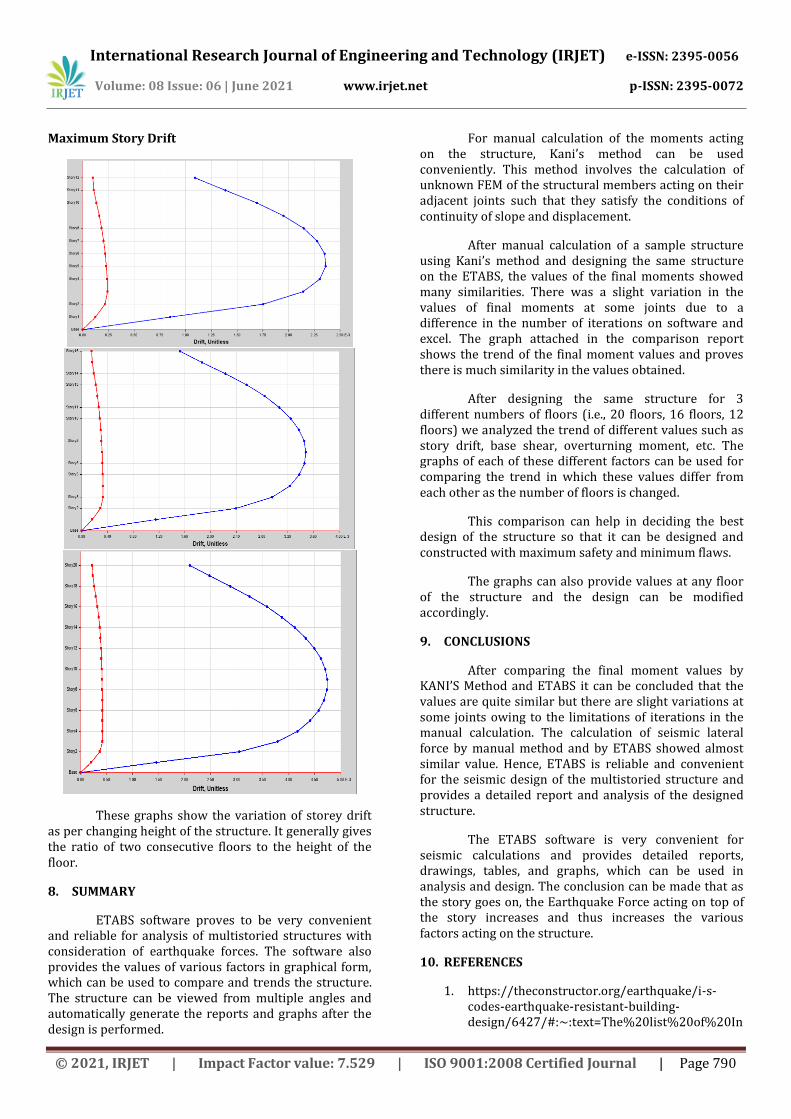
Maximum Story Drift
These graphs show the variation of storey drift as per changing height of the structure. It generally gives the ratio of two consecutive floors to the height of the floor.
8. SUMMARY
ETABS software proves to be very convenient and reliable for analysis of multistoried structures with consideration of earthquake forces. The software also provides the values of various factors in graphical form, which can be used to compare and trends the structure. The structure can be viewed from multiple angles and automatically generate the reports and graphs after the design is performed.
For manual calculation of the moments acting on the structure, Kani’s method can be used conveniently. This method involves the calculation of unknown FEM of the structural members acting on their adjacent joints such that they satisfy the conditions of continuity of slope and displacement.
After manual calculation of a sample structure using Kani’s method and designing the same structure on the ETABS, the values of the final moments showed many similarities. There was a slight variation in the values of final moments at some joints due to a difference in the number of iterations on software and excel. The graph attached in the comparison report shows the trend of the final moment values and proves there is much similarity in the values obtained.
After designing the same structure for 3 different numbers of floors (i.e., 20 floors, 16 floors, 12 floors) we analyzed the trend of different values such as story drift, base shear, overturning moment, etc. The graphs of each of these different factors can be used for comparing the trend in which these values differ from each other as the number of floors is changed.
This comparison can help in deciding the best design of the structure so that it can be designed and constructed with maximum safety and minimum flaws.
The graphs can also provide values at any floor of the structure and the design can be modified accordingly.
9. CONCLUSIONS
After comparing the final moment values by KANI’S Method and ETABS it can be concluded that the values are quite similar but there are slight variations at some joints owing to the limitations of iterations in the manual calculation. The calculation of seismic lateral force by manual method and by ETABS showed almost similar value. Hence, ETABS is reliable and convenient for the seismic design of the multistoried structure and provides a detailed report and analysis of the designed structure.
The ETABS software is very convenient for seismic calculations and provides detailed reports, drawings, tables, and graphs, which can be used in analysis and design. The conclusion can be made that as the story goes on, the Earthquake Force acting on top of the story increases and thus increases the various factors acting on the structure.
10. REFERENCES
1. https://theconstructor.org/earthquake/i-s-codes-earthquake-resistant-building-design/6427/#:~:text=The%20list%20of%20In
© 2021, IRJET | Impact Factor value: 7.529 | ISO 9001:2008 Certified Journal | Page 790
International Research Journal of Engineering and Technology (IRJET) e-ISSN: 2395-0056
Volume: 08 Issue: 06 | June 2021 www.irjet.net p-ISSN: 2395-0072
dian%20standard,%2C%20IS%3A%2013935%E2%80%931993
2. https://www.iitk.ac.in/nicee/skj/Research_Papers/Review-IndianSeismicCodeIS1893(Part1)2002.pdf
3. https://civilengineering.blog/2017/11/04/dead-loads-live-loads-wind-loads/#:~:text=Dead%20loads%20includes%2C%20the%20self,(part%2DI)%2D1987
History
http://ijetch.org/papers/671-EA1012.pdf
Precaution
1. https://www.nbmcw.com/tech-articles/tall-construction/36266-india-s-towering-aspirations-a-reality-now.html
2. https://rahat.up.nic.in/sdmplan/Earthquake/AnnexureI-V/AnnexureI_Bldg.%20Earthquake.pdf
Methodology
Approximate method
1. https://nptel.ac.in/content/storage2/courses/105105109/pdf/m6l36.
2. https://www.nitsri.ac.in/Department/Civil%20Engineering/Civil_401_Chapter_9.pdf
KANI’S Method
1. http://www.sietk.org/downloads/QB/B.Tech/Civil/III%20B.Tech/STRUCTURAL%20ANALYSIS%20-II/UNIT-III.pdf
2. http://ethesis.nitrkl.ac.in/2395/1/STUDY_OF_SUBSTITUTE_FRAME_METHOD_OF_ANALYSIS_FOR_LATERAL_LOADING_CONDITIONS.pdf
Software
1. https://wiki.csiamerica.com/display/etabs/Home
2. https://wiki.csiamerica.com/pages/viewpage.action?pageId=9896206
Earthquake Behavior of Structure
(Graph and Explanation)
https://www.iitk.ac.in/nicee/IITK-GSDMA/EBB_001_30May2013.pdf
© 2021, IRJET | Impact Factor value: 7.529 | ISO 9001:2008 Certified Journal | Page 791