seismic performance evaluation of a rc special moment frameshb.skku.edu/_res/hibs/etc/26.pdf ·...
TRANSCRIPT

Structural Engineering and Mechanics, Vol. 27, No. 6 (2007) 671-682 671
Seismic performance evaluation of a RC special moment frame
Taewan Kim† and Jinkoo Kim
‡
Department of Architectural Engineering, SungKyunKwan University,
Cheoncheon-dong, Jangan-gu, Suwon, Korea
(Received October 30, 2006, Accepted June 12, 2007)
Abstract. The probability and the reliability-based seismic performance evaluation procedure proposedin the FEMA-355F was applied to a reinforced concrete moment frame building in this study. For theFEMA procedure, which was originally developed for steel moment frame structures, to be applied toother structural systems, the capacity should be re-defined and the factors reflecting the uncertaintiesrelated to capacity and demand need to be determined. To perform the evaluation procedure a prototypebuilding was designed per IBC 2003, and inelastic dynamic analyses were conducted applying site-specific ground motions to determine the parameters for performance evaluation. According to theanalysis results, distribution of the determined capacities turned out to be relatively smaller than that ofthe demands, which showed that the defined capacity was reasonable. It was also shown that theprototype building satisfied the target performance since the determined confidence levels exceeded theobjectives for both local and global collapses.
Keywords: reinforced concrete special moment frame; seismic capacity; confidence; performanceevaluation.
1. Introduction
After the Loma Prieta earthquake in 1989 and the Northridge earthquake in 1994, the SEAOC
Vision 2000 report (1995) was developed to initiate the concept of performance-based seismic
engineering. This led to the publication of the FEMA-273/274 (1997) and the ATC-40 reports
(1997), which prescribed engineering procedures to evaluate seismic performance of structures. The
seismic performance evaluation method was further developed in FEMA-355 (2000) to include
uncertainty in seismic hazard and building capacity. Especially the report, FEMA-355F - State of the
Art Report on Performance Prediction and Evaluation of Steel Moment-Frame Buildings, presents
an overview of the current state of knowledge with regard to the prediction of the performance of
moment-resisting steel frame buildings. This state of the art report was prepared by the SAC Joint
Venture to address the issue of the seismic performance of moment-resisting steel frame structures.
Yun et al. (2002) and Lee and Foutch (2002) used the technique to evaluate the seismic
performance of various types of steel moment-resisting frames.
† Currently Manager of Chang & Minwoo Structural Consultants‡ Associate Professor, Corresponding author, E-mail: [email protected]

672 Taewan Kim and Jinkoo Kim
In this study the seismic performance of a reinforced concrete building structure designed per the
IBC-2003 was evaluated based on the FEMA-355F procedure. As the FEMA procedure was
originally developed for steel moment frames, some of variables and coefficients needed to be re-
defined. To achieve the research objective, the following procedure was followed: 1) Design of the
example structure; 2) Selection of a frame for nonlinear dynamic analysis; 3) definement of the
partial and total collapse of a structure; and 4) determination of the demand and capacity and of the
coefficients to consider the associated uncertainty in estimation of the demand and capacity.
2. Design and analytical modeling of example structure
The analysis model, shown in Fig. 1, is a three-story reinforced concrete structure assumed to be
located in downtown Los Angeles. Structural members were designed using the ACI 318-02 (2002)
and seismic load was determined based on the IBC 2003. The dark-colored perimeter frames were
designed as special moment frames and the internal moment frames were designed to resist only the
gravity load. The coefficients for seismic design load based on IBC 2003 are presented in Table 1.
The main lateral load-resisting system is the RC special moment-resisting frames with the response
modification factor (R) and the deflection amplification factor (Cd) 8 and 5.5, respectively. The limit
state for inter-story drift is 2% of the story height. The design of the special moment frame
followed the ‘Ch. 21 - Special Provisions for Seismic Design’ of the ACI 318-02. The internal
frames were also designed following the provision to have enough ductility. Table 2 and Table 3
present the member property of the moment frames.
Fig. 1 3-story RC moment frame for numerical analysis
Table 1 Seismic design variables for model structure
Maximum considered earthquake Ss = 1.61 g, S1 = 0.79 g
Site class Class D, Stiff Soil: Fa = 1.0, Fv = 1.5
Design earthquake SDS = 1.07 g, SD1 = 0.79 g
Seismic use group Group II: IE = 1.25
Seismic design category D

Seismic performance evaluation of a RC special moment frame 673
Among the earthquake ground motions developed for the SAC project by Somerville et al.
(1997), twenty records representing earthquake of 2475 year return period in Los Angeles area
(LA21~LA40) were used in the dynamic analysis. The records were scaled using the method
proposed in FEMA-355F so that the Sa (spectral acceleration) value became close to the MCE
(Maximum Considered Earthquake) value in Los Angeles area, which is 1.61 g.
In this study only the frames located along the horizontal direction are considered in the analysis.
DRAIN-2DX (2004) was used for nonlinear dynamic analysis. Mathematical model for a reinforced
concrete member is composed of a linear element representing member length and nonlinear
connecting elements representing rotational degree of freedom. The member length is determined as
the center to center distance between connections. In this mathematical modeling the hysteretic
energy is dissipated only by the nonlinear elements located at the ends of each member. For linear
element the No. 2-Plastic Hinge Beam-Column Element in DRAIN-2DX was used, and the No. 10-
Connection Element developed Erbay et al. (2004) was used for nonlinear hysteretic modeling of a
RC member. As shown in Fig. 2 the No. 10 element can represent the stiffness degradation, strength
degradation, and pinching of a RC component. In the figure the variable Mg represents the amount
Table 2 Member size and reinforcing steel used in the exterior special moment frames
Beams Columns
Story
Member size
(mm)
Reinforcing steel Member
size(mm)
Reinforcing steel
Exterior members Interior members Exteriormembers
InteriormembersBottom Top Bottom Top
2nd story 560×760 8-D25 12-D25 6-D25 12-D25
660×660 16-D36 18-D363rd story 560×680 4-D29 11-D25 4-D29 11-D25
Roof 560×600 3-D29 6-D29 3-D29 6-D29
Table 3 Member size and reinforcing steel used in the interior moment frames
Member Member size (mm) Reinforcing steel
Beams 460 × 500 Bottom: 5-D29, Top: 3-D25
Columns 400 × 400 8-D25
Fig. 2 Hysteresis model for RC connecting elements with pinching and strength degradation
674 Taewan Kim and Jinkoo Kim
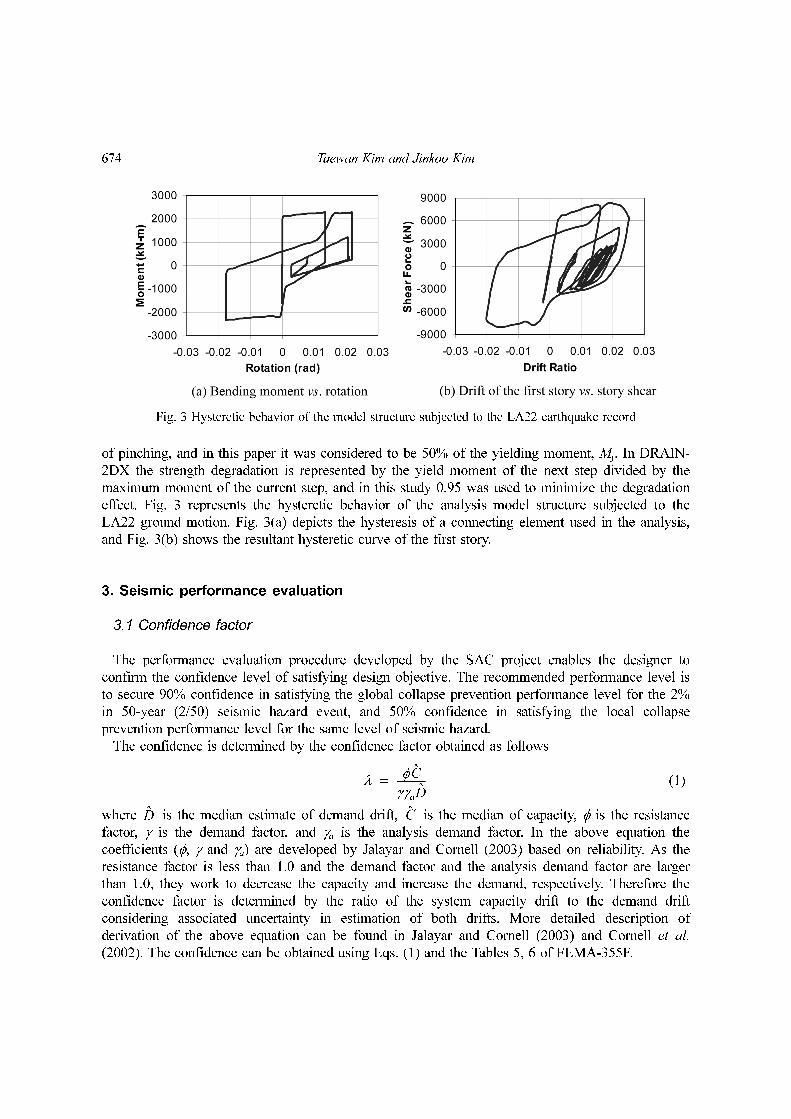
of pinching, and in this paper it was considered to be 50% of the yielding moment, My. In DRAIN-
2DX the strength degradation is represented by the yield moment of the next step divided by the
maximum moment of the current step, and in this study 0.95 was used to minimize the degradation
effect. Fig. 3 represents the hysteretic behavior of the analysis model structure subjected to the
LA22 ground motion. Fig. 3(a) depicts the hysteresis of a connecting element used in the analysis,
and Fig. 3(b) shows the resultant hysteretic curve of the first story.
3. Seismic performance evaluation
3.1 Confidence factor
The performance evaluation procedure developed by the SAC project enables the designer to
confirm the confidence level of satisfying design objective. The recommended performance level is
to secure 90% confidence in satisfying the global collapse prevention performance level for the 2%
in 50-year (2/50) seismic hazard event, and 50% confidence in satisfying the local collapse
prevention performance level for the same level of seismic hazard.
The confidence is determined by the confidence factor obtained as follows
(1)
where is the median estimate of demand drift, is the median of capacity, φ is the resistance
factor, γ is the demand factor, and γa is the analysis demand factor. In the above equation the
coefficients (φ, γ and γa) are developed by Jalayar and Cornell (2003) based on reliability. As the
resistance factor is less than 1.0 and the demand factor and the analysis demand factor are larger
than 1.0, they work to decrease the capacity and increase the demand, respectively. Therefore the
confidence factor is determined by the ratio of the system capacity drift to the demand drift
considering associated uncertainty in estimation of both drifts. More detailed description of
derivation of the above equation can be found in Jalayar and Cornell (2003) and Cornell et al.
(2002). The confidence can be obtained using Eqs. (1) and the Tables 5, 6 of FEMA-355F.
λφ C
γγaD
------------=
D C
Fig. 3 Hysteretic behavior of the model structure subjected to the LA22 earthquake record

Seismic performance evaluation of a RC special moment frame 675
3.2 Performance point at global collapse
The performance point at global collapse was obtained using the Incremental Dynamic Analysis
(IDA) proposed by Vamvatsikos and Cornell (2002), and the procedure is as follows: select a suite
of earthquake records representative of given hazard level; perform an elastic time-history analysis
and draw a straight line on a spectral acceleration - maximum drift diagram; Calculate the slope for
the rest of the accelerograms and calculate the median slope. This is referred to as the elastic slope,
Se; perform a nonlinear time-history analyses with increasing amplitude of accelerograms and plot
the points of maximum drifts and corresponding spectral accelerations on the graph; draw straight
lines between two consecutive points, and if the slope of a line becomes less than 0.2 Se, then
Table 4 Seismic demand drift and capacity drift for each accelerogram (%)
Accelergram 21 22 23 24 25 26 27 28 29 30
Demand 4.04 2.57 0.85 1.62 2.40 3.18 2.25 1.78 0.90 1.19
Local 4.57 4.02 3.80 3.51 6.25 5.22 5.15 10.0 3.09 6.70
Capacity
Global 10.0 9.13 10.0 6.56 10.0 10.0 10.0 10.0 10.0 10.0
Accelergram 31 32 33 34 35 36 37 38 39 40
Demand 2.24 2.60 1.27 1.47 3.21 2.18 1.87 1.84 0.76 0.50
Local 3.54 3.90 4.57 3.94 5.74 5.44 6.97 7.52 4.93 7.02
Capacity
Global 10.0 10.0 6.85 10.0 7.21 7.19 7.41 5.72 10.0 4.93
Table 5 Median and standard deviation of log of demand and capacity
Variables Median Standard deviation of log
Demand 0.017 0.538
Local 0.051 0.305
Capacity
Global 0.086 0.225
Table 6 Spectral acceleration (Sa) and drift demand at damage index of 1.0
Accelergram 21 22 23 24 25 26 27 28 29 30
Special frameSa (g) 4.8 4.5 4.8 4.7 4.8 4.5 4.6 4.8 4.8 4.8
Drift (%) 10.0 9.29 10.0 8.78 10.0 8.95 8.97 10.0 10.0 10.0
Internal frameSa (g) 3.7 2.3 3.8 3.3 3.8 2.7 3.1 4.8 2.9 4.8
Drift (%) 4.57 4.02 3.80 3.51 6.25 5.22 5.15 10.0 3.09 6.70
Accelergram 31 32 33 34 35 36 37 38 39 40
Special frameSa (g) 4.8 4.8 4.7 4.8 3.1 2.7 3.1 1.9 4.8 1.6
Drift (%) 10.0 10.0 9.26 10.0 9.15 9.05 9.54 9.77 10.0 9.59
Internal frameSa (g) 3.8 3.3 3.4 3.1 2.5 2.0 2.5 1.7 3.8 1.4
Drift (%) 3.54 3.90 4.57 3.94 5.74 5.44 6.97 7.52 4.93 7.02
676 Taewan Kim and Jinkoo Kim
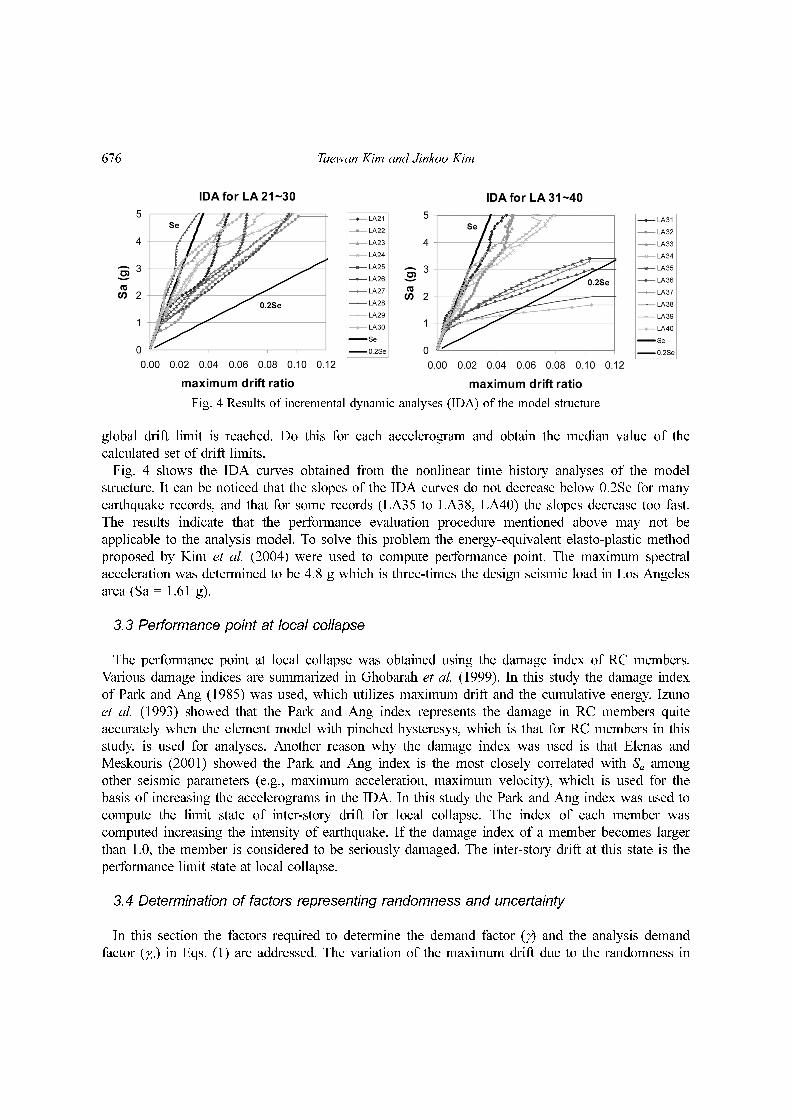
global drift limit is reached. Do this for each accelerogram and obtain the median value of the
calculated set of drift limits.
Fig. 4 shows the IDA curves obtained from the nonlinear time history analyses of the model
structure. It can be noticed that the slopes of the IDA curves do not decrease below 0.2Se for many
earthquake records, and that for some records (LA35 to LA38, LA40) the slopes decrease too fast.
The results indicate that the performance evaluation procedure mentioned above may not be
applicable to the analysis model. To solve this problem the energy-equivalent elasto-plastic method
proposed by Kim et al. (2004) were used to compute performance point. The maximum spectral
acceleration was determined to be 4.8 g which is three-times the design seismic load in Los Angeles
area (Sa = 1.61 g).
3.3 Performance point at local collapse
The performance point at local collapse was obtained using the damage index of RC members.
Various damage indices are summarized in Ghobarah et al. (1999). In this study the damage index
of Park and Ang (1985) was used, which utilizes maximum drift and the cumulative energy. Izuno
et al. (1993) showed that the Park and Ang index represents the damage in RC members quite
accurately when the element model with pinched hysteresys, which is that for RC members in this
study, is used for analyses. Another reason why the damage index was used is that Elenas and
Meskouris (2001) showed the Park and Ang index is the most closely correlated with Sa among
other seismic parameters (e.g., maximum acceleration, maximum velocity), which is used for the
basis of increasing the accelerograms in the IDA. In this study the Park and Ang index was used to
compute the limit state of inter-story drift for local collapse. The index of each member was
computed increasing the intensity of earthquake. If the damage index of a member becomes larger
than 1.0, the member is considered to be seriously damaged. The inter-story drift at this state is the
performance limit state at local collapse.
3.4 Determination of factors representing randomness and uncertainty
In this section the factors required to determine the demand factor (γ) and the analysis demand
factor (γa) in Eqs. (1) are addressed. The variation of the maximum drift due to the randomness in
Fig. 4 Results of incremental dynamic analyses (IDA) of the model structure

Seismic performance evaluation of a RC special moment frame 677
the orientation of the building to the ground motions and the uncertainty in estimation of natural
period, damping ratio, and material strength is used to obtain the factors. It should be noted that the
detailed procedure for obtaining each factor is omitted here because the whole procedure can be
found in the FEMA-355F.
The FEMA procedure requires considering the effect of the building orientation when it is located
close to the fault. The difference of seismic demand drifts for earthquake records with two
perpendicular directions is used to determine the effect. To this end the earthquake records provided
by Somerville et al. (1997) for near fault site (NF21~NF40) were divided into fault-parallel and
fault-normal components. The effect of the directions of buildings to fault is represented by β of the
difference between two mean values of the natural log of drift demands for both fault-parallel and
fault–normal direction, and β is used for determination of demand factor (γ).
In addition to the randomness in building orientation to the ground motion, there exist various
uncertainties in analysis. When analytical model for nonlinear analysis is constructed, the values of
required variables such as natural period, damping ratio, material strength, are not 100% exact. For
example, the nominal strength used in the design is more likely a minimum value. The uncertainties
in estimating those parameters were considered by computing mean and standard deviation of
measured values. The demand drifts for each earthquake record were obtained using the mean and
the mean + standard deviation of each variable. Then the natural log of the two sets of demand
drifts were averaged and β was computed using the difference of the two averaged values to be
used in the determination of the analysis demand factor (γa).
The information about the damping ratios and the natural periods of reinforced concrete moment
frames was obtained from Goel and Chopra (1997). Each data were arranged with respect to the
building height, and then the means (dependent on the height) and standard deviations (independent
on the height) of each data were determined by regression analysis. The determined standard
deviations were 0.27 second for the natural period and 1.18% for the damping ratio. The regression
lines for the natural period and the damping ratio with respsect to the height are shown in Fig. 5
and Fig. 6, respectively. The mean values of the natural period and the damping ratio were
determined to be 0.49 second and 6.82%, respectively, and the mean + standard deviation were 0.76
Fig. 5 Fundamental natural period of RC momentframes with respect to the building height(Goel and Chopra 1997)
Fig. 6 Damping ratio of RC moment frames withrespect to the building height (Goel andChopra 1997)

678 Taewan Kim and Jinkoo Kim
second and 8.00%, respectively.
The variation of the material strength was considered only for reinforcing steel, because the
bending moment capacity is largely affected by the strength of reinforcing steel. The data for yield
strength of reinforcing steel was obtained from Nowak and Szerszen (2001) and the mean and the
standard deviation turned out to be 472 MPa and 24 MPa, respectively, and the mean+standard
deviation to be 496 MPa.
4. Seismic performance evaluation of the model structure
4.1 Seismic demand and capacity for inter-story drift
The median estimate for seismic demand and capacity for story drift were obtained to compute
the confidence factor (λ), where the capacity was categorized by the global and local collapses.
Table 4 presents the analysis results for seismic demand and capacity for each earthquake record.
The median and the standard deviation of the demand and the capacity are shown in Table 5. The
natural log of the results was used to obtain standard deviation, because it was believed that they
followed the log-normal distribution. It can be observed that the median value to the demand is
0.017, which is less than 2%. The standard deviation of the log of the demand resulted in relatively
high value of 0.5. This is used to compute the demand factor (γ) which represents the variation of
the demand. It was observed that the spectral accelerations of the 20 accelergrams used in the
analysis showed large variation near the natural period of the model structure (0.5 second), and this
resulted in the large standard deviation of the demand.
The median values of the capacity were about 5% and 8% of the story height for local collapse
(member level) and global collapse (system level), respectively. These are about 3 to 5 times larger
than the seismic demand. Although the ratio of the capacity and the demand will decrease due to
the inclusion of the resistance factor and the demand factors, the ratio is important to estimate the
seismic safety of the structure. It also can be observed that the standard deviation of the capacity is
significantly smaller than that of the demand, which implies that the capacity is less sensitive to the
dynamic characteristics of input earthquake records than the seismic demand. The member level
limit state is determined by the damage index of structural components and the global limit state is
caused by the collapse mechanism or system instability due to P-Delta effect. As the damage index
is determined by the maximum displacement and the dissipated energy, the local collapse is more
likely to be affected by the characteristics of earthquake records. This can be confirmed by the
analysis results for standard deviation presented in Table 5. Table 6 presents the spectral
acceleration, Sa, and the maximum inter-story drift ratio of the internal and external frames when
the damage index exceeded 1.0. It was observed that the damage index of internal frames reached
1.0 at lower spectral acceleration and inter-story drift than the external special moment frames. This
implies that the local collapse was mostly determined from the damage in the internal frames
designed to resist gravity load.
4.2 Factors reflecting randomness and uncertainty in evaluation procedure
The effect of the building orientation is considered by the difference in seismic demands for fault-
normal and fault-parallel earthquakes. Table 7 presents the demand of inter-story drift ratio for

Seismic performance evaluation of a RC special moment frame 679
earthquake records divided into fault-parallel (even numbered) and fault-normal (odd numbered)
directions. It can be noticed that the demand is larger for vertical vibration than for horizontal
vibration. Based on these results, the value of β was determined to be 0.27. As β is considered to
affect the demand factor when it is larger than about 0.1, the effect of orientation is considered to
exist in this example.
Table 8 presents drift demands obtained for the mean and the standard deviation of the variables
affecting the analysis demand factors, such as natural period, damping ratio, and the yield strength
of reinforcing steel. The mean values of those variables are 0.49 second, 8.62%, and 472 MPa,
respectively. The demand and the capacity of the structure were computed using these mean values
in the previous section. The elastic modulus was modified so that the natural period of the model
structure became identical to the mean value. The Rayleigh damping was used to set the
fundamental damping ratio to the mean value. The mean yield strength of the reinforcing bars was
used to determine the bending moment strength of RC members.
Table 7 Drift demand for fault-parallel (even numbered) and fault-normal (odd numbered) earthquake records
(%)
Fault-normal 21 23 25 27 29 31 33 35 37 39 Median Mean of log
Demand drift 2.19 10.3 1.30 3.99 4.91 5.79 5.60 4.50 1.35 3.86 3.66 −3.306
Fault-parallel 22 24 26 28 30 32 34 36 38 40 Median Mean of log
Demand drift 1.26 1.72 1.37 0.87 0.73 0.89 0.83 0.61 0.82 0.75 1.45 −4.231
Table 8 Drift demand for each earthquake record obtained using mean and mean+standard deviation ofuncertainty parameters (%)
Accelerogram 21 22 23 24 25 26 27 28 29 30
Mean 4.04 2.57 0.85 1.62 2.40 3.18 2.25 1.78 0.90 1.19
Mean+
STD
Period 3.66 3.06 1.70 2.04 3.51 4.45 2.94 2.90 1.36 1.77
Damping 3.97 2.45 0.78 1.51 2.27 2.97 2.09 1.75 0.85 1.12
Yield strength 4.17 2.66 0.80 1.52 2.35 3.17 2.18 1.84 0.87 1.17
Accelerogram 31 32 33 34 35 36 37 38 39 40
Mean 2.24 2.60 1.27 1.47 3.21 2.18 1.87 1.84 0.76 0.50
Mean+
STD
Period 2.37 4.22 2.46 1.54 3.61 4.09 3.48 3.75 1.10 1.17
Damping 2.12 2.52 1.24 1.43 2.97 1.86 1.70 1.74 0.75 0.50
Yield strength 2.25 2.68 1.25 1.51 3.14 1.99 1.70 1.70 0.76 0.52
Table 9 Statistical values of the drift demands shown in Table 8
Variables Median Mean of log β
Mean 0.017 −4.067 -
Mean+
STD
Period 0.025 −3.676 0.39
Damping 0.016 −4.122 0.05
Yield strength 0.017 −4.084 0.02

680 Taewan Kim and Jinkoo Kim
In order to reflect the effect of uncertainty in each variable, an analysis was carried out using the
mean + standard deviation of a variable while the other variables were fixed to the mean values.
The demand computed for the mean + standard deviation in the analysis was compared with the
demand obtained using the mean value to determine the β. The statistical values and β for all
variables are presented in Table 9. The damping ratio and the yield strength affect the analysis
demand factor very little considering that the values of β are less than 0.1, whereas the natural
period with β of 0.39 contributes significantly. The β values of the damping ratio and the yield
strength remain small because the standard deviations are small and their contribution to the
nonlinear behavior of the model structure is not significant. The relatively large β for the natural
period resulted from the large standard deviation and the rapid change of response spectrum in short
periods. If the natural period of the model structure were longer than 1.0 second, the β for natural
period would be somewhat smaller.
4.3 Confidence level for 2/50 hazard
Table 10 presents the confidence factors and confidence levels of the model structure both for
local and global collapse. Also presented are the factors required to compute the confidence factor.
For global collapse the median of capacity was 0.086. This was multiplied by the resistance factor
(φ) of 0.77, and the resultant capacity was reduced to 0.066. Likewise the median demand of 0.017
was multiplied by the demand factor (γ) of 1.72 and the analysis demand factor (γa) of 1.34, and the
final value of demand became 0.039. The ratio of the capacity and the demand became the
confidence factor (λ) of 1.692, which is significantly less than 5.0 obtained without considering the
resistance and the demand factors.
As can be noticed in Table 10 the confidence level of the model structure for given earthquake
records corresponding to 2/50 hazard turned out to be 76% for local collapse and 96% for global
collapse. These are higher than the target confidence level of 50% for local and 90% for global
collapse. Therefore it can be concluded that the model structure satisfies the performance objective
both in local and global levels.
5. Conclusions
Seismic performance evaluation of a reinforced concrete structure designed in accordance with
IBC-2003 was performed following the procedure proposed in FEMA-355F. Nonlinear dynamic
analyses were carried out to compute the demand and capacity and other variables considering the
uncertainty envolved in the evaluation process. Finally the confidence level of the model structure
for 2/50 hazard level was determined using the capacity and the demand drifts and the appropriate
factors.
Table 10 Values of variables required to obtain the confidence level for 2/50 hazard
Variables φ γ γa λConfidence level (%)
Local collapse 0.72 0.051 1.72 1.34 0.017 0.937 76
Global collapse 0.77 0.086 1.72 1.34 0.017 1.692 96
C D

Seismic performance evaluation of a RC special moment frame 681
The FEMA-355F process, which was originally developed for steel structure, was applied to the
reinforced concrete structure after modifying the procedure for determining capacity drift. The
modified method, which utilized median estimate and standard deviation values, turned out to
produce reasonable results. For determining the capacity drift against local collapse, the Park and
Ang damage index was used, and the results were consistent with those of the capacity against
global collapse.
The median value of the seismic demand drift increased 2.3 times and the capacity drift decreased
3/4 times due to the uncertainty in estimation of both drifts. This resulted in significant reduction of
the ratio of the capacity and demand. Therefore the use of deterministic analysis results of capacity
and demand may overestimate the seismic safety of a structure.
Among the factors reflecting uncertainty, the uncertainty in estimating natural period was found to
affect the confidence factor. This is due to the large scatter in the measured natural period and to the
rapid change in response spectra near the fundamental period of the model structure. Therefore to
obtain precise natural frequency is most important in nonlinear analysis.
According to the analysis result, the 3-story reinforced concrete structure designed per the IBC
2003 turned out to satisfy the target confidence level and thus the performance objective given in
FEMA-355F. It should be mentioned, however, that different conclusion can be drawn depending on
the shape and number of story of model structures, the way of performance evaluation, etc.
Therefore further research is still necessary to investigate the seismic performance and safety of
structures designed based on the current seismic code with different design variables.
Acknowledgements
This work was supported by the National Research Laboratory Program (M10600000234-
06J0000-23410) from the Ministry of Science and Technology in Korea. The authors appreciate the
financial support.
References
ACI 318 (2002), Building Code Requirements for Structural Concrete (ACI 318-02) and Commentary (318R-02). American Concrete Institute, Farmington Hill, MI.
ATC (1996), Seismic Evaluation and Retrofit of Concrete Building. ATC-40 Report, Applied Technical Council,Redwood City, CA.
Cornell, C.A., Jalayer, F., Hamburger, R.O. and Foutch, D.A. (2002), “Probabilistic basis for 2000 SAC FederalEmergency Management Agency steel moment frame guidelines”, J. Struct. Eng., ASCE, 128(4), 526-533.
Elenas, A. and Meskouris, K. (2001), “Correlation study between seismic acceleration parameters and damageindices of structures”, Eng. Struct., 23, 698-704.
Erbay, O.O., Yun, S.-Y., Foutch, D.A. and Aschheim, M.A. (2004), UIUC Extensions to the Library of Elementsfor DRAIN-2DX. Paper No. 2530, 13th World Conference on Earthquake Engineering, Vancouver, BritishColumbia, Canada.
FEMA-273 (1997), NEHRP Guidelines for the Seismic Rehabilitation of Buildings. Federal EmergencyManagement Agency, Washington, D.C..
FEMA-274 (1997), NEHRP Commentary on the Guidelines for the Seismic Rehabilitation of Buildings. FederalEmergency Management Agency, Washington, D.C..
FEMA-355F (2000), State of the Art Report on Performance Prediction and Evaluation of Steel Moment-frame

682 Taewan Kim and Jinkoo Kim
Buildings. Federal Emergency Management Agency, Washington, D.C..Ghobarah, A., Abou-Elfath, H. and Biddah, A. (1999), “Response-based damage assessment of structures”,
Earthq. Eng. Struct. Dyn., 28, 79-104.Goel, R.K. and Chopra, A.K. (1997), Vibration Properties of Buildings Determined from Recorded Earthquake
Motions. Report No. UCB/EERC-97/14, University of California at Berkeley, Berkeley, CA.ICC (2003), International Building Code. International Code Council, Inc., Birmingham, AL.Izuno, K., Iemura, H., Yamada, Y. and Fujisawa, S. (1993), “Seismic damage assessment of RC structures using
different hysteretic models”, Memoirs Faculty Eng., 55(1), 1-19.Jalayer, F. and Cornell, C.A. (2003), A Technical Framework for Probability-based Demand and Capacity Factor
Design (DCFD) Seismic Formats. PEER Report 2003/8, Pacific Earthquake Engineering Center, University ofCalifornia at Berkeley, Berkeley, CA.
Kim, T.-W., Foutch, D.A., LaFave, J.M. and Wilcoski, J. (2004), Performance Assessment of ReinforcedConcrete Structural Walls for Seismic Loads. Structural Research Series - No. 634, Dept. of Civil andEnvironmental Eng., University of Illinois at Urbana-Champaign, Urbana, IL.
Lee, K. and Foutch, D.A. (2002), “Seismic performance evaluation of pre-Northridge steel frame buildings withbrittle connections”, J. Struct. Eng., ASCE, 128(4), 546-555.
Lee, K. and Foutch, D.A. (2002), “Performance evaluation of new steel frame buildings for seismic loads”,Earthq. Eng. Struct. Dyn., 31(3), 653-670.
Nowak, A.S. and Szerszen, M.M. (2001), Reliablility-based Calibration for Structural Concrete, Phase 1.Research Report UMCEE 01-04, University of Michigan, Ann Arbor, MI.
Park, Y.J. and Ang, A.H.-S. (1985), “Mechanistic seismic damage model for reinforced concrete”, J. Struct. Eng.,ASCE, 111(4), 722-739.
Prakash, V., Powell, G. and Campbell, S. (1993), DRAIN-2DX base Program Description and User Guide –version 1.10. Report no. UCB/SEMM-93/17 and 93/18, Structural Eng. Mechanics and Materials, Dept. ofCivil Eng., Univ. of California, Berkeley, CA.
SEAOC (1995), Performance based Seismic Engineering of Building. SEAOC Vision 2000 Committee,Structural Engineers Association of California, CA.
Somerville, P., Smith, N., Puntamurthula, S. and Sun, J. (1997), Development of Ground Motion Time Historiesfor phase 2 of the FEMA/SAC Steel Project. SAC Background Document Report No. SAC/BD-97/04, SACJoint Venture, Richmond, CA.
Vamvatsikos, D. and Cornell, C.A. (2002), “Incremental dynamic analysis”, Earthq. Eng. Struct. Dyn., 31(3),491-514.
Yun, S.-Y., Hamburger, R.O., Cornell, C.A. and Foutch, D.A. (2002), “Seismic performance evaluation for steelmoment frames”, J. Struct. Eng., ASCE, 128(4), 534-545.