seismic performance evaluation of retrofitted bridge …
TRANSCRIPT
ISSN 1822-427X print / ISSN 1822-4288 online
http://www.bjrbe.vgtu.lt
1. Introduction
Most of existing bridges already display developed aged-ness and their seismic performance in case of potential earthquakes are being questioned. Bridges that do not sat-isfy standard seismic performance level need installations of effective seismic retrofit, and the most popular methods would include retrofit bridge bearings, piers and abutments, foundations and underlying soil, and using seismic isola-tion bearings (Juozapaitis et al. 2008; Zavadskas et al. 2008; Dulinskas et al. 2008; Sivilevičius et al. 2008; Kashevskaya 2007; Masanobu et al. 2003; Kamiński, Trapko 2006).
Particularly, the seismic isolation bearings are rec-ommended not only for the seismic design of newly constructed bridges, but also for the seismic retrofits of existing bridges, and are increasingly being applied to con-structions. The method of using the seismic isolation bear-ings can improve the seismic performance without retrofit existing piers or foundations by reducing the inertia force generated in case of earthquakes (Han et al. 2008; Park, Han 2004). In particular, it minimizes extra construction expenses because it utilizes the seismic isolation bear-ings to replace the aged bridge bearings. As the necessity of seismic isolation bearings are being recognized and its construction cases are being increased, the process of ac-curately inspecting its capacity of seismic performance im-provement is required. The inspection process of the per-formance of seismic isolation bearings is important as it tests whether it actually accomplishes the aimed level of seismic performance of the seismically reinforced bridg-es. Recently, several valuable research studies have been
conducted to evaluate the performance of various isolated structural system (Bakir et al. 2007; Chehab, El Naggar 2003; Komodromos et al. 2007; Nagarajaiah, Narasim-han 2007; Grigorjeva et al. 2008; Kala 2008). However, these research studies are broad and do not particularly address the practical issues concerned with the seismic performance of seismic isolated bridges.
This study inspects the improvement of the bridg-es seismic performance in case when the seismic isola-tion bearing is applied, through an analysis method. For this purpose, two types of most popularly applied seismic isolation bearings were selected and actually applied to a non-seismically constructed existing bridge. The static and dynamic non-linear analysis had been implemented to measure the responses of the bridge's seismic perform-ance before and after the retrofit, and the properties were compared for the analysis. Also, as the result of non-linear analysis, the capacity spectrum is organized and the per-formance points of the bridges estimated displacement is measured. Non-linear time-history analysis is implemented to compare the responses of the performance points to in-spect the accuracy of the capacity spectrum method, which is an illustrational seismic performance evaluation method for bridges reinforced with seismic isolation bearings.
2. The application of seismic isolation and the analysis model
The seismic design for existing bridges increased the re-sistance capacity toward transverse-directional loads and was designed to absorb the seismic energy with the ine-
SEISMIC PERFORMAnCE EVALUATIOn OF RETROFITTED BRIDGE BY ISOLATIOn BEARInGS
Kyoung-Bong Han1, Sung-nam Hong2, Sun-Kyu Park3
1,2,3Dept of Civil & Environmental Engineering, Sungkyunkwan University, 300, Chunchun-Dong, Jangan-Gu, Suwon-Si, Gyeonggi-Do, 440-746 Republic of Korea
E-mails: [email protected]; [email protected]; [email protected]
Abstract. The seismic performance evaluation and retrofit process are very important in existing bridges. If the result is not appropriate, then retrofit process are required. Among various retrofit methods, the seismic isolation is a very useful method, because it can be applied by replacing old bridge bearings. In this study, the effectiveness of seismic isolation is rationally verified. For this purpose, two seismic isolations used widely are selected and non-linear static and non-linear dynamic analyses are performed. The responses of existing bridges are compared with those of retrofitted bridge by seis-mic isolation bridge for earthquake of target level, and seismic performances are evaluated.
Keywords: seismic performance evaluation, retrofit, existing bridges, seismic isolations, non-linear analysis, target level.
DOI: 10.3846/1822-427X.2009.4.134-142
THE BALTIC JOURNAL OF ROAD AND BRIDGE ENGINEERING
2009 4(3): 134–142

The Baltic Journal of Road and Bridge Engineering, 2009, 4(3): 134–142 135
lastic behaviors of the structural members. However, this method had the potential to develop gradual failure due to the inelastic deformation of the structural members, to display considerable horizontal displace- ment, and to cause fragility failure and amplification of response due to overloading and putting excessive expectation of re-sistance on the bridge joints. Currently, by using the seis-mic isolation bearings, the horizontal seismic force that is transferred from the superstructure to the substructure in case of earthquakes is reduced to achieve not only safety but also economical efficiency. The seismic isolation bear-ings can replace the aged bearings of existing bridges that the installation process is very simplified.
The major purpose of the seismic isolation bearings is to reduce the destructive energy of earthquakes that is transferred to the structures. Many different types of methods were proposed to achieve this purpose. For the analysis of this study, two most popularly applied seismic isolation bearings were selected.
2.1. Rubber bearing
Rubber bearing (RB) is mostly made out of laminated rub-ber with more than one reinforcing steel sheets inside. It is the most broadly studied and applied seismic isolation bearing, because it represses the expansion situation of the rubber in case of compressive deformation in order to im-prove the load resistance capacity. For the basic structure, rubber is used as the major material for flexible bending rigidity and the steel sheets are inserted to reinforce the horizontal stiffness. In the case of applying RB to actual bridges, the max range of displacement should be designed to be less than the displacement capacity of RB. The forma-tion of RB, the analysis model and the theoretical hyster-esis curve are as shown in Fig. 1. As indicated in the figure, RB is idealized to perform full elasticity behavior.
RB is mostly made out of laminated rubber with more than one reinforcing steel sheets inside. It is the most broadly studied and applied seismic isolation bearing, be-cause it represses the expansion situation of the rubber in case of compressive deformation in order to improve the load resistance capacity. For the basic structure, rubber is used as the major material for flexible bending rigidity and the steel sheets are inserted to reinforce the horizontal stiffness. In the case of applying RB to actual bridges, the
max range of displacement should be designed to be less than the displacement capacity of RB.
2.2. Lead lubber bearing
Lead rubber bearing (LRB) is designed to improve the weakness of RB. RB has low damping and displays huge deformation for static loads. Therefore, LRB inserts a lead plug in RB, as shown in Fig. 2, to provide damping to re-sponse to earthquakes and to resist static loads. Because the lead plug inserted into the LRB is characterized by al-most full elasto-plastic hysteresis loop, the rigidity of the bearing after the yielding of the lead is equal to that of RB, and the capacity of LRB can be determined by vertical load, random horizontal reaction, and scale of construc-tion expansion. Generally, in the case of designing a LRB, the diameter of the lead plug that is determined by the co-efficient of horizontal reaction and should be ideally small. The formation of LRB, the analysis model and the theoreti-cal hysteresis curve are as shown in Fig. 2.
3. The evaluation of seismic performance
3.1. Evaluation of seismic performance according to the capacity spectrum methodBy comparing the seismic performances of an existing non-seismically bridge and a seismically reinforced bridge with seismic isolation bearings, the improvement achieved by the seismic isolation bearings can be inspected. To evalu-ate the seismic performance of the bridges, various aspects should be considered. Whether or not it guarantees stand-ard seismic performance level to resist the earthquakes with max seismic force should be evaluated reasonably. For the bridges, installed with seismic isolation bearings, the force response of the pier generally decreases, but the relative displacement of the superstructure and substruc-ture increases. All piers of the bridges with seismic isola-tion bearings resist the seismic load and redistribute the load that it is different than the existing bridges that resist the seismic load with one fixed pier. It is not reasonable to evaluate the performance of the bridge system with the response of only one pier. Therefore, the bridge should be considered as a separate vibrant unit from the contract point prior to evaluating each vibrant system. The capacity spectrum of a structure is a method of directly comparing the capacity and seismic demand of each vibrant system,
Fig. 1. Formation (a) and analysis model and theoretical hysteresis curve (b) of the RB
Fig. 2. Formation (a) and analysis model and theoretical hysteresis curve (b) of the LRB

136 K.-B. Han et al. Seismic Performance Evaluation of Retrofitted Bridge by Isolation Bearings
and the capacity is measured by non-linear static analy-sis. The capacity of earthquake endurance can be organ-ized by converting the response spectrum to fit the aimed performance level. The capacity spectrum method, in par-ticular, is one of the most useful methods in evaluating the performance of existing concrete structures and in design-ing the reinforcement, and is widely used to evaluate the seismic performance of structures in performance-based seismic design.
3.2. Capacity and demand estimationIn order to estimate the capacity while considering the non-linear response of the bridges, pushover analysis is implemented. In case that the stress on one part of an in-determinate structure reaches the yielding point, the nodal point yields; and the load is increased, the stress remains at the yielding point. But another nodal point that had not reached the yielding point stays within the range of elastic-ity. The stress redistribution allows this system structure to possess the redundant force, so that it can resist the load until it reaches unstable state. Also the relationship of load and displacement of a structure as the load increases can be estimated. In the case of implementing the pushover analysis, an increase of load is continuously applied until the structure reaches unstableness due to gradual yield-ing. For the pushover analysis, the material behavior is as-sumed to be bilinear. In this study, the pushover analysis is implemented by using the bilinear material model. The load-displacement relation-ships estimated by the pusho-ver analysis causes base shear and top displacement of the structure.
The capacity demand for earthquakes becomes the design response spectrum to fit the aimed level of capacity. The design response spectrum is defined. The values of the seismic coefficients, CA and CV, are determined by the in-spected region and its geological conditions. The situation model of the material and the design response spectrum are shown in Fig. 3 (Han et al. 2004).
The design response spectrum designed to estimate the capacity demand toward earthquakes should consider the non-linear responses of the structures and be expressed as non-linear design response spectrum. Generally, the non-linear spectrum can be estimated by being reduced using the reduction coefficient while considering the duc-tility toward linear spectrum. The method of organizing the non-linear spectrum using equivalent damping of a structure instead of ductility is used. However, the influ-ence of damping in the non-linear spectrum organization is almost non-effective in case that the natural period of the structure is exceptionally long or short. In addition, as the non-linear displacement increases after yielding, that is as the ductility of a structure increases, the effectiveness of the damping reduces significantly. In the case of con-verting to capacity spectrum, iteration process is required to calculate the performance point representing the max linear capacity of a structure. In this case, sometimes the conversion cannot be converged. Therefore, the ductility of a structure should be considered in order to organize the actual non-linear spectrum (Peter 1999).
3.3. Organization of capacity spectrum
After estimating the capacity of a structure through the pushover analysis and the capacity demand through the non-linear design response spectrum, the capacity and ca-pacity demand are converted into same format and illus-trated on a graph to organize the capacity spectrum. The capacity of a structure is converted into the capacity curve and the capacity demand into the demand curve (Chopra, Goel 1999). The conversion formula is as follows.
(1) conversion formula into capacity curve:
, (1)
, (2)
where Sa – spectral acceleration; Sd – spectral displacement; Δroof
– top displacement, V – bottom shear force; W – to-tal load. ϕ1,roof
– first mode shape at top roof. α1 and PF1 represent the modal mass coefficient for the first natural mode and the modal participation factor of the mode 1, in respective.
, (3)
(4)
where mi – mass at level i; φi1 – ordinate of mode shape i at level 1.
Fig. 3. Plastic behavior (a), bilinear material model (b) and linear response spectrum (c) of the reinforcement concrete
The Baltic Journal of Road and Bridge Engineering, 2009, 4(3): 134–142 137
(2) conversion formula into demand curve:
(5)
where T – period.
4. Example of improvement in seismic performance of bridge
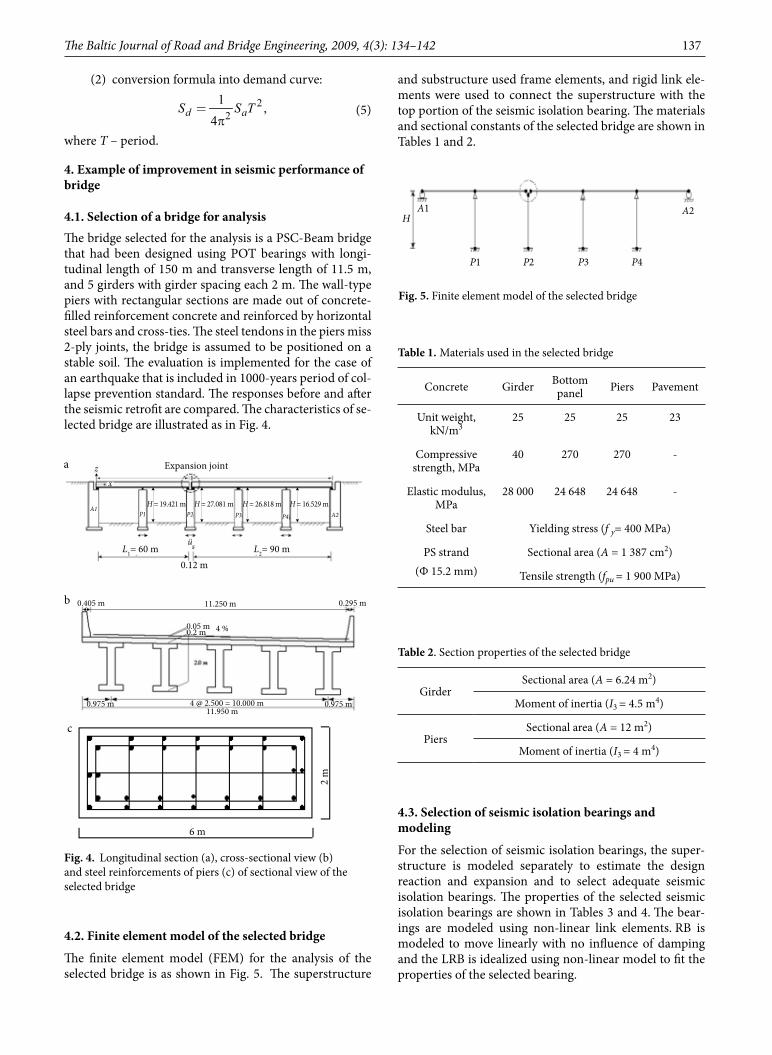
4.1. Selection of a bridge for analysis The bridge selected for the analysis is a PSC-Beam bridge that had been designed using POT bearings with longi-tudinal length of 150 m and transverse length of 11.5 m, and 5 girders with girder spacing each 2 m. The wall-type piers with rectangular sections are made out of concrete-filled reinforcement concrete and reinforced by horizontal steel bars and cross-ties. The steel tendons in the piers miss 2-ply joints, the bridge is assumed to be positioned on a stable soil. The evaluation is implemented for the case of an earthquake that is included in 1000-years period of col-lapse prevention standard. The responses before and after the seismic retrofit are compared. The characteristics of se-lected bridge are illustrated as in Fig. 4.
4.2. Finite element model of the selected bridge
The finite element model (FEM) for the analysis of the selected bridge is as shown in Fig. 5. The superstructure
and substructure used frame elements, and rigid link ele-ments were used to connect the superstructure with the top portion of the seismic isolation bearing. The materials and sectional constants of the selected bridge are shown in Tables 1 and 2.
Table 1. Materials used in the selected bridge
Concrete Girder Bottom panel Piers Pavement
Unit weight, kN/m3
25 25 25 23
Compressive strength, MPa
40 270 270 -
Elastic modulus, MPa
28 000 24 648 24 648 -
Steel bar Yielding stress (f y= 400 MPa)
PS strand (ϕ 15.2 mm)
Sectional area (A = 1 387 cm2)
Tensile strength (fpu = 1 900 MPa)
Table 2. Section properties of the selected bridge
GirderSectional area (A = 6.24 m2)
Moment of inertia (I3 = 4.5 m4)
PiersSectional area (A = 12 m2)
Moment of inertia (I3 = 4 m4)
4.3. Selection of seismic isolation bearings and modeling
For the selection of seismic isolation bearings, the super-structure is modeled separately to estimate the design reaction and expansion and to select adequate seismic isolation bearings. The properties of the selected seismic isolation bearings are shown in Tables 3 and 4. The bear-ings are modeled using non-linear link elements. RB is modeled to move linearly with no influence of damping and the LRB is idealized using non-linear model to fit the properties of the selected bearing.
b 11.250 m 0.295 m0.405 m
0.975 m 4 @ 2.500 = 10.000 m11.950 m
0.975 m
4 %0.05 m0.2 m
Fig. 4. Longitudinal section (a), cross-sectional view (b) and steel reinforcements of piers (c) of sectional view of the selected bridge
Fig. 5. Finite element model of the selected bridge
138 K.-B. Han et al. Seismic Performance Evaluation of Retrofitted Bridge by Isolation Bearings
Table 3. Properties of RB
D
esig
n lo
ad, k
N
W×L
,mm
Thick
ness
, m
m
Heig
ht,
mm
Expa
nsio
n,
mm
Kv Kh
Outer 1 750 300×500 72 105 50 62 461 191.3
Inner 3 000 450×600 60 89 42 278 000 413.0
Table 4. Properties of LRB
Loca
tion
Des
ign
load
, kN
Stat
ic di
spla-
cem
ent , m
m
Seism
ic di
s-pl
acem
ent,
mm
Heig
ht, m
m
Characteristic propertiesD
y, cm
Qd,
kN
K u, k
N/c
m
K d, k
N/c
m
K v, k
N/c
mOut 2 000 110 250 276 0.8 3.3 5.7 1.5 242.2
In 3 000 80 250 271 0.8 4.3 7.3 2.0 318.9
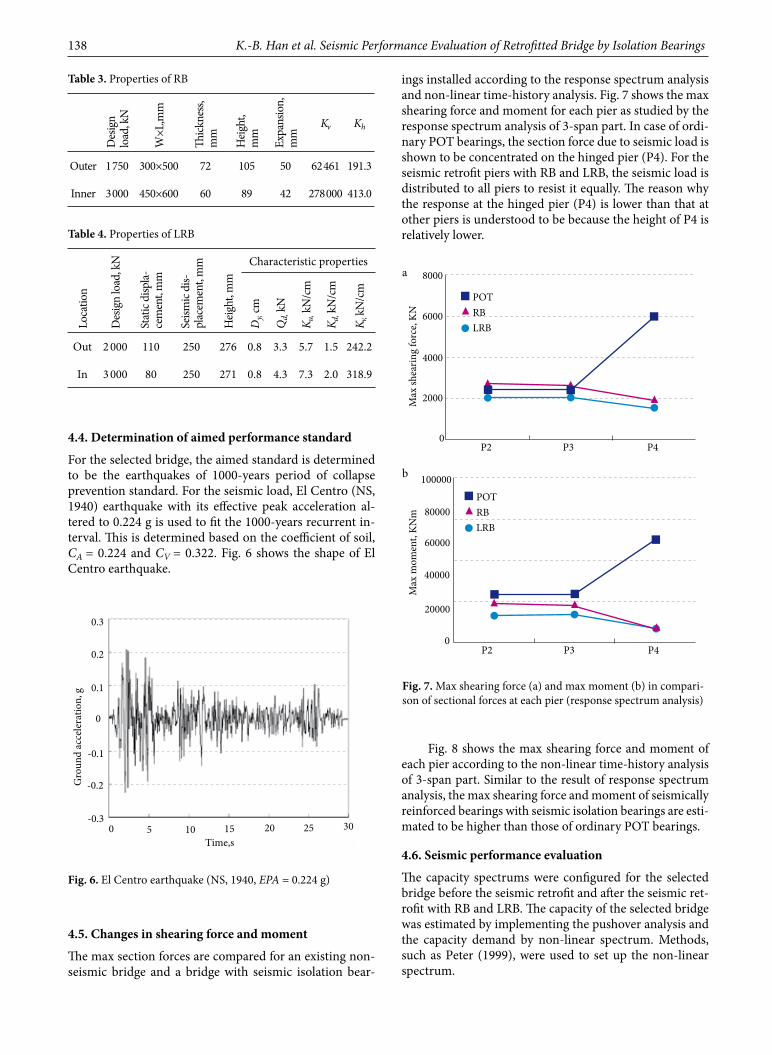
4.4. Determination of aimed performance standard
For the selected bridge, the aimed standard is determined to be the earthquakes of 1000-years period of collapse prevention standard. For the seismic load, El Centro (NS, 1940) earthquake with its effective peak acceleration al-tered to 0.224 g is used to fit the 1000-years recurrent in-terval. This is determined based on the coefficient of soil, CA = 0.224 and CV = 0.322. Fig. 6 shows the shape of El Centro earthquake.
4.5. Changes in shearing force and moment
The max section forces are compared for an existing non-seismic bridge and a bridge with seismic isolation bear-
ings installed according to the response spectrum analysis and non-linear time-history analysis. Fig. 7 shows the max shearing force and moment for each pier as studied by the response spectrum analysis of 3-span part. In case of ordi-nary POT bearings, the section force due to seismic load is shown to be concentrated on the hinged pier (P4). For the seismic retrofit piers with RB and LRB, the seismic load is distributed to all piers to resist it equally. The reason why the response at the hinged pier (P4) is lower than that at other piers is understood to be because the height of P4 is relatively lower.
Fig. 8 shows the max shearing force and moment of each pier according to the non-linear time-history analysis of 3-span part. Similar to the result of response spectrum analysis, the max shearing force and moment of seismically reinforced bearings with seismic isolation bearings are esti-mated to be higher than those of ordinary POT bearings.
4.6. Seismic performance evaluation
The capacity spectrums were configured for the selected bridge before the seismic retrofit and after the seismic ret-rofit with RB and LRB. The capacity of the selected bridge was estimated by implementing the pushover analysis and the capacity demand by non-linear spectrum. Methods, such as Peter (1999), were used to set up the non-linear spectrum.
Fig. 6. El Centro earthquake (NS, 1940, EPA = 0.224 g)
Fig. 7. Max shearing force (a) and max moment (b) in compari-son of sectional forces at each pier (response spectrum analysis)

The Baltic Journal of Road and Bridge Engineering, 2009, 4(3): 134–142 139
4.6.1. Configuration of capacity spectrumThe pushover analysis with controlled displacement was implemented for the existing POT bearings, RB and LRB. With the outcome, the relationship between the top dis-placement and the base shearing force of the bridge is calculated. The distribution shape of load is generally im-portant in the case of implementing the pushover analy-sis. For the standardized structures such as bridges, the longitudinal mode 1 is most influential and generally the mass of the piers is excluded for the analysis that the sim-ple increase of load was applied to the topmost part of the bridge for the pushover analysis. The material model used for the analysis was idealized by the non-linear material models in consideration of the cost of materials such as steel bars. The capacity demand becomes non-linear de-sign response spectrum using displacement ductility fac-tor. Based on the design response spectrum of elasticity, the seismic coefficients CA and CV were modified and used. The coefficients were CA = 0.224 and CV = 0.322. The process of configuring non-linear response spectrum implies altering the factors of horizontal and yielding dis-placements for each span of aimed displacement ductility factor in order to draw out the satisfying target ductility factor (Masanobu et al. 2002). In this case, the non-lin-ear design response spectrum can be estimated by apply-
ing the coefficients related to the displacement ductility factor where the acceleration, velocity and displacements should be treated delicately. After configuring the capac-ity curve using the results of the pushover analysis, the conversion Eqs (1) and (2) are applied to convert the out-comes into the capacity curve. The dynamic characteris-tic properties of mode 1 of the selected bridge required for the equation can be calculated by analyzing the eigen-values. The results are shown in Table 5.
Table 5. Dynamic characteristics of mode 1 piers according to the eigenvalue analysis
Type of bearing
Natural vibration period, s
Modal participation
factor
Modal mass coefficient
POT 0.897 1.079 0.376
RB 1.189 1.137 0.404
LRB 1.165 1.157 0.553
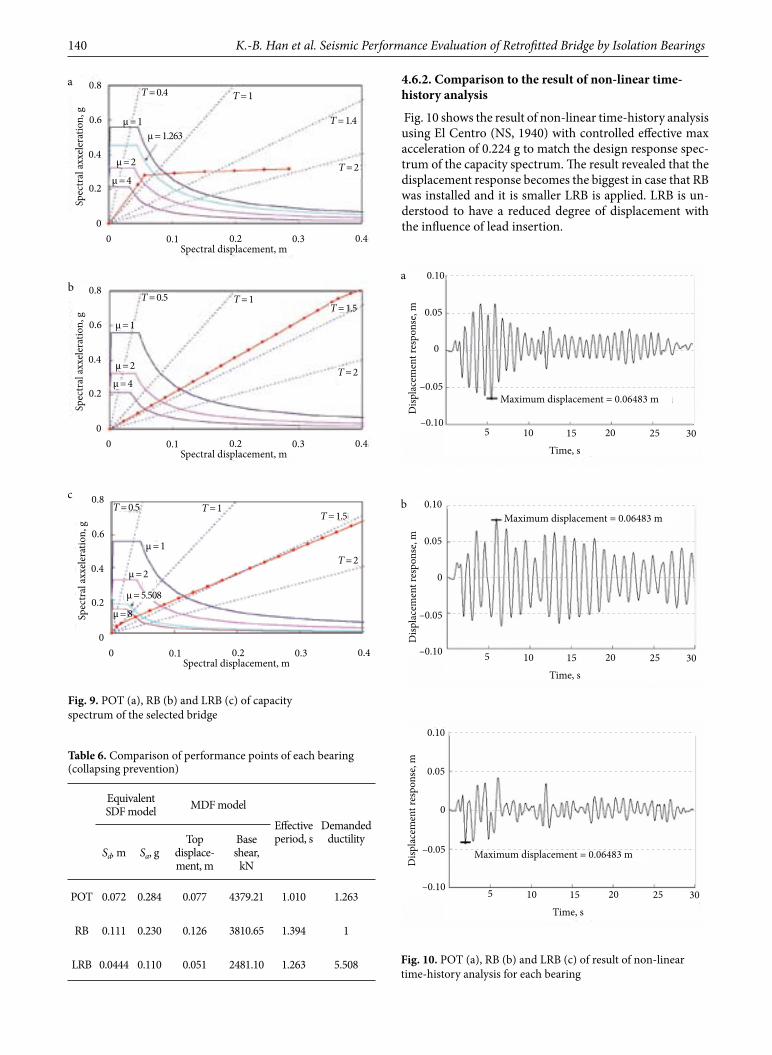
After converting the non-linear design response spectrum into the demand curve by using the relation-ship between spectrum displacement and period of Eq (5), the capacity spectrum is configured by illustrating the capacity and demand curves that had been convert-ed into Acceleration Displacement Response Spectrum (ADRS) form, on a same graph. Fig. 9 shows the capac-ity spectrum of each type of pier. With the existing non-seismic POT bearing, the piers were expected to yield when the estimated displacement exceeds the yielding displacement in case of collapsing prevention standard earthquakes. In case that RB or LRB were applied, the piers performed elastic behavior without yielding. Also, in case of LRB installation, the lead yielded very soon due to its low yielding strength and after its yielding, the rub-ber deformation occurred, as in RB. Moreover, the bear-ing spans, expressed as the inclination of the capacity curve in the capacity spectrum, proved that the seismic isolation bearings contributed to the lengthening of the bridge bearing span, when compared to that before the retrofit (non-seismic POT bearings).
To calculate the estimated displacement and perfor-mance point of each bearing, the ratio of horizontal and yielding dispositions was altered for each span of target ductility factor in order to find the satisfying target duc-tility factor.
The top displacements, base shear, effective periods, and other at the performance points are shown in Table 6. Compared to the case of existing POT bearing, RB con-tributed to an increase of the displacement, the declina-tion of the degree of shearing force, and eventually the lengthening of the life span achieving the design concept of the seismic isolation bearings.
Fig. 8. Max shearing force (a) and max moment (b) in comparison of section force of each pier (non-linear time history analysis)
140 K.-B. Han et al. Seismic Performance Evaluation of Retrofitted Bridge by Isolation Bearings
Table 6. Comparison of performance points of each bearing (collapsing prevention)
Equivalent SDF model MDF model
Effective period, s
Demanded ductility
Sd, m Sa, gTop
displace-ment, m
Base shear,
kN
POT 0.072 0.284 0.077 4379.21 1.010 1.263
RB 0.111 0.230 0.126 3810.65 1.394 1
LRB 0.0444 0.110 0.051 2481.10 1.263 5.508
4.6.2. Comparison to the result of non-linear time-history analysis
Fig. 10 shows the result of non-linear time-history analysis using El Centro (NS, 1940) with controlled effective max acceleration of 0.224 g to match the design response spec-trum of the capacity spectrum. The result revealed that the displacement response becomes the biggest in case that RB was installed and it is smaller LRB is applied. LRB is un-derstood to have a reduced degree of displacement with the influence of lead insertion.
Fig. 9. POT (a), RB (b) and LRB (c) of capacity spectrum of the selected bridge
Fig. 10. POT (a), RB (b) and LRB (c) of result of non-linear time-history analysis for each bearing
The Baltic Journal of Road and Bridge Engineering, 2009, 4(3): 134–142 141
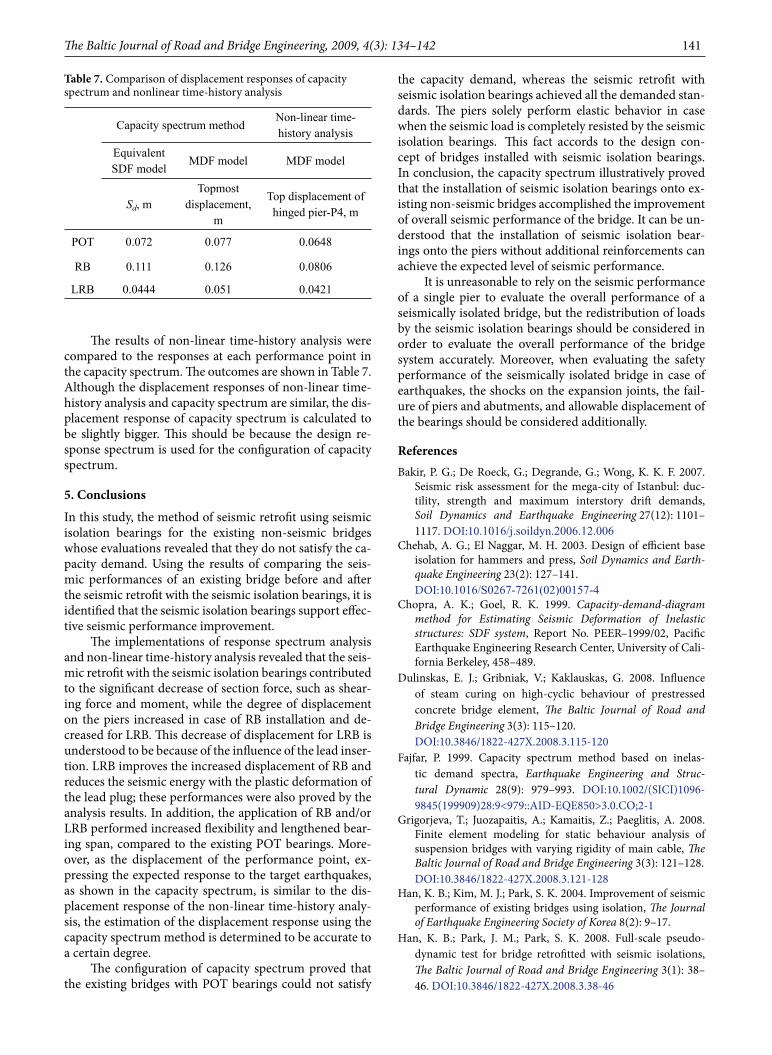
Table 7. Comparison of displacement responses of capacity spectrum and nonlinear time-history analysis
Capacity spectrum methodNon-linear time-history analysis
Equivalent SDF model
MDF model MDF model
Sd, mTopmost
displacement, m
Top displacement of hinged pier-P4, m
POT 0.072 0.077 0.0648
RB 0.111 0.126 0.0806
LRB 0.0444 0.051 0.0421
The results of non-linear time-history analysis were compared to the responses at each performance point in the capacity spectrum. The outcomes are shown in Table 7. Although the displacement responses of non-linear time-history analysis and capacity spectrum are similar, the dis-placement response of capacity spectrum is calculated to be slightly bigger. This should be because the design re-sponse spectrum is used for the configuration of capacity spectrum.
5. Conclusions
In this study, the method of seismic retrofit using seismic isolation bearings for the existing non-seismic bridges whose evaluations revealed that they do not satisfy the ca-pacity demand. Using the results of comparing the seis-mic performances of an existing bridge before and after the seismic retrofit with the seismic isolation bearings, it is identified that the seismic isolation bearings support effec-tive seismic performance improvement.
The implementations of response spectrum analysis and non-linear time-history analysis revealed that the seis-mic retrofit with the seismic isolation bearings contributed to the significant decrease of section force, such as shear-ing force and moment, while the degree of displacement on the piers increased in case of RB installation and de-creased for LRB. This decrease of displacement for LRB is understood to be because of the influence of the lead inser-tion. LRB improves the increased displacement of RB and reduces the seismic energy with the plastic deformation of the lead plug; these performances were also proved by the analysis results. In addition, the application of RB and/or LRB performed increased flexibility and lengthened bear-ing span, compared to the existing POT bearings. More-over, as the displacement of the performance point, ex-pressing the expected response to the target earthquakes, as shown in the capacity spectrum, is similar to the dis-placement response of the non-linear time-history analy-sis, the estimation of the displacement response using the capacity spectrum method is determined to be accurate to a certain degree.
The configuration of capacity spectrum proved that the existing bridges with POT bearings could not satisfy
the capacity demand, whereas the seismic retrofit with seismic isolation bearings achieved all the demanded stan-dards. The piers solely perform elastic behavior in case when the seismic load is completely resisted by the seismic isolation bearings. This fact accords to the design con-cept of bridges installed with seismic isolation bearings. In conclusion, the capacity spectrum illustratively proved that the installation of seismic isolation bearings onto ex-isting non-seismic bridges accomplished the improvement of overall seismic performance of the bridge. It can be un-derstood that the installation of seismic isolation bear-ings onto the piers without additional reinforcements can achieve the expected level of seismic performance.
It is unreasonable to rely on the seismic performance of a single pier to evaluate the overall performance of a seismically isolated bridge, but the redistribution of loads by the seismic isolation bearings should be considered in order to evaluate the overall performance of the bridge system accurately. Moreover, when evaluating the safety performance of the seismically isolated bridge in case of earthquakes, the shocks on the expansion joints, the fail-ure of piers and abutments, and allowable displacement of the bearings should be considered additionally.
ReferencesBakir, P. G.; De Roeck, G.; Degrande, G.; Wong, K. K. F. 2007.
Seismic risk assessment for the mega-city of Istanbul: duc-tility, strength and maximum interstory drift demands, Soil Dynamics and Earthquake Engineering 27(12): 1101–1117. DOI:10.1016/j.soildyn.2006.12.006
Chehab, A. G.; El Naggar, M. H. 2003. Design of efficient base isolation for hammers and press, Soil Dynamics and Earth-quake Engineering 23(2): 127–141.
DOI:10.1016/S0267-7261(02)00157-4Chopra, A. K.; Goel, R. K. 1999. Capacity-demand-diagram
method for Estimating Seismic Deformation of Inelastic structures: SDF system, Report No. PEER–1999/02, Pacific Earthquake Engineering Research Center, University of Cali-fornia Berkeley, 458–489.
Dulinskas, E. J.; Gribniak, V.; Kaklauskas, G. 2008. Influence of steam curing on high-cyclic behaviour of prestressed concrete bridge element, The Baltic Journal of Road and Bridge Engineering 3(3): 115–120.
DOI:10.3846/1822-427X.2008.3.115-120 Fajfar, P. 1999. Capacity spectrum method based on inelas-
tic demand spectra, Earthquake Engineering and Struc-tural Dynamic 28(9): 979–993. DOI:10.1002/(SICI)1096-9845(199909)28:9<979::AID-EQE850>3.0.CO;2-1
Grigorjeva, T.; Juozapaitis, A.; Kamaitis, Z.; Paeglitis, A. 2008. Finite element modeling for static behaviour analysis of suspension bridges with varying rigidity of main cable, The Baltic Journal of Road and Bridge Engineering 3(3): 121–128.
DOI:10.3846/1822-427X.2008.3.121-128Han, K. B.; Kim, M. J.; Park, S. K. 2004. Improvement of seismic
performance of existing bridges using isolation, The Journal of Earthquake Engineering Society of Korea 8(2): 9–17.
Han, K. B.; Park, J. M.; Park, S. K. 2008. Full-scale pseudo-dynamic test for bridge retrofitted with seismic isolations, The Baltic Journal of Road and Bridge Engineering 3(1): 38–46. DOI:10.3846/1822-427X.2008.3.38-46
142 K.-B. Han et al. Seismic Performance Evaluation of Retrofitted Bridge by Isolation Bearings
Juozapaitis, A.; Norkus, A.; Vainiūnas, P. 2008. Shape stabilization of steel suspension bridge, The Baltic Journal of Road and Bridge Engineering 3(3): 137–144.
DOI:10.3846/1822-427X.2008.3.137-144 Kala, Z. 2008. Fuzzy probability analysis of the fatigue resistance
of steel structural members under bending, Journal of Civil Engineering and Management 14(1): 67–72.
DOI:10.3846/1392-3730.2008.14.67-72Kamiński, M.; Trapko, T. 2006. Experimental behavior of rein-
forced concrete column models strengthened by CFRP ma-terials, Journal of Civil Engineering and Management 12(2): 109–115.
Kashevskaya, E. 2007. Bases of quality management of construc-tion and repair of highways, The Baltic Journal of Road and Bridge Engineering 2(3): 101–109.
Komodromos, P.; Polycarpou, P. C.; Papaloizou, L.; Phocas, M. C. 2007. Response of seismically isolated buildings considering poundings, Earthquake Engineering and Structural Dynamics 36(12): 1605–1622. DOI:10.1002/eqe.692
Masanobu, S.; Sang-Hoon, K.; Shigeru, K.; Jin-Hak, Y. 2002. Fra-gility curves of concrete bridges retrofitted by column jacket-ing, Earthquake Engineering and Engineering Vibration 1(2): 195–205. DOI:10.1007/s11803-002-0065-2
Masanobu, S.; Yuko, M.; Xuejiang, D.; Youwei, Z.; Orlikowski, M. J. 2003. Effect of seismic retrofit of bridges on transportation
networks, Earthquake Engineering and Engineering Vibration 2(2): 169–179. DOI:10.1007/s11803-003-0001-0
Nagarajaiah, S.; Narasimhan, S. 2007. Seismic control of smart base isolated buildings with new semi-active variable damper, Earthquake Engineering and Structural Dynamics 36(6): 729–749. DOI:10.1002/eqe.650
Park, S. K.; Han, K. B. 2004. Effect of seismic isolation bearing with sliding mechanism on the response of bridge, Materials and Structures 37(270): 412–421. DOI:10.1617/13871
Riley, M.; Stark, Ch.; Kempner, L. Jr.; Mueller, W. 2006. Seis-mic retrofit using spring damper devices on high-voltage equipment stands, Earthquake Spectra 22(733): 733–753. DOI:10.1193/1.2216736
Sivilevičius, H.; Zavadskas, E. K.; Turskis, Z. 2008. Quality attri-butes and complex assessment methodology of the asphalt mixing plant, The Baltic Journal of Road and Bridge Engineering 3(3): 161–166. DOI:10.3846/1822-427X.2008.3.161-166
Zavadskas, E. K.; Liias, R.; Turskis, Z. 2008. Multi-attribute decision-making method in bridges and road construction state-of-the-art surveys, The Baltic Journal of Road and Bridge Engineering 3(3): 152–160.
DOI:10.3846/1822-427X.2008.3.152-160
Received 15 May 2008; accepted 27 August 2009