seİsmİc performance of a structure with double concave friction pendulum isolatİon ...€¦ ·...
TRANSCRIPT

1
SEİSMİC PERFORMANCE OF A STRUCTURE WITH DOUBLE
CONCAVE FRICTION PENDULUM ISOLATİON SYSTEM.
Antonio DI CESARE1 Felice C. PONZO2, Domenico NIGRO3,
Michele SIMONETTI4, Gianmarco LECCESE5
ABSTRACT
An extensive experimental seismic testing programme, named project JETBIS (Joint Experimental
Testing of Base Isolation Systems), has been developed within the RELUIS (2010-2013) project -
Task 2.3.2, involving partners from different Italian universities. This paper describes the tests
performed on seismic devices based on Double Concave Friction Pendulum (DCFP).
In order to assess the fidelity of the considered non-linear model under uni-directional motion,
controlled-displacement and seismic-input experiments were conducted using shaking table at
University of Basilicata and at University of Naples “Federico II”, respectively. The DCFP isolator
contains two separate concave sliding surfaces and exhibits different hysteretic properties at different
stages of displacement and velocity response. The numerical model of DCFP used is general so that no
condition regarding bearing properties, which effect the sequence of sliding stages, are required for the
validity of the model. The experimental model for seismic tests was a 1/3 scaled steel framed structure
with one storey and one bay in both directions. Four DCFP bearings with equal properties of the
concave sliding surfaces were mounted under each column.
The main objective of this work is to evaluate the effectiveness of nonlinear modelling
considering two different finite element programme SAP2000 and CDS-Opensees to investigate on
influence of the sliding velocity and of the vertical load on the behavior of DCFP devices under
different condition of the sliding surfaces (with and without lubrication). A further goal was to verify
the reliability of the numerical models also when large residual displacements due to previous
earthquakes are present in the isolation system. In this paper the experimental outcomes of various
testing model configurations are compared with the results of non linear dynamic analysis obtained by
both numerical simulations.
INTRODUCTION
The seismic design of base isolation systems is a worldwide widespread application in order to make
structure more resistant to earthquake ground motions. The underlying concept of base isolation is the
uncoupling of horizontal building movement from ground motions using a flexible isolation layer
made with either elastomeric (rubber) bearings or sliding bearings (Cardone et al., 2005) Sliding
isolators use velocity dependent friction between composite materials, usually composed of
polyethylene, and stainless steel plates as its energy dissipation system. Most of the seismic isolation
1 Dr Eng, University of Basilicata, Potenza, Italy, [email protected] 2 Prof, University of Basilicata, Potenza, Italy, [email protected] 3 Mr, University of Basilicata, Potenza, Italy, [email protected] 4 PhD Candidate, University of Basilicata, Potenza, Italy, [email protected] 5 Eng., University of Basilicata, Potenza, Italy, [email protected]

2
systems currently in use provide friction properties as their energy dissipation mechanism. Theoretical
and experimental research studies have been focused on developing more versatile and economic
isolation systems such as friction pendulum (Becker and Main 2012; Dao et al. 2013). The friction
pendulum bearing (FPS), proposed by Zayas et al. (1987) is a sliding seismic isolation system which
uses its surface curvature to generate the restoring force from the pendulum action of the weight of the
structure on the FPS. The natural period of the isolated structure becomes independent by the mass of
the superstructure, as it only depends on the radius of the sliding surface (Kim and Yun 2007).
The double concave Friction Pendulum (DCFP) bearing is an adaptation of the well-known
single concave Friction Pendulum Sliding (FPS) bearing. The principal benefit of the DCFP bearing is
its capacity to accommodate larger displacements compared to a traditional FPS bearing of identical
plan dimensions. Moreover, there is the capability to use sliding surfaces with varying radii of
curvature and coefficients of friction, offering the designer greater flexibility to optimize performance
(Fenz and Constantinou 2006; Malekzadeh and Taghikhany, 2010). Recently various studies (Kim and
Yun, 2007) have been carried out on DCFPs revealed that tri-linear behaviour of a DCFP can be
achieved by combining two FPS having different friction coefficients.
Experimental testing (controlled-displacement and seismic-input) on Double Concave Friction
Pendulum bearings have been performed within the JETBIS project in order to assess their fidelity of
the non-linear behaviour under uni-directional motion (Ponzo et al., 2014). The experimental model
for seismic tests was a 1/3 scaled steel framed structure with one storey and one bay in both directions,
in this paper only the model configuration with symmetric mass is considered. The DCFP isolators
have been produced by FIP Industriale containing two separate concave sliding surfaces with same
radius of curvature and a rigid slider covered by UHMW-PE composite material (FIP-Industriale,
2013). Four DCFP bearings with equal properties were mounted under each column considering two
conditions of the sliding surfaces (with and without lubrication).
The paper briefly describes the test set-up and testing results of various experimental model
configurations. Nonlinear time history analysis considering two finite element programmes, SAP2000
and CDS-OpenSees, have been performed to reproduce and understand the experimental response.
Different modelling of DCFP have been considered; in case of SAP2000 two different models
dependent of sliding velocity, while for CDS-OpenSees two different models dependent of axial load.
This paper compares the experimental and numerical behaviour also when initial residual
displacement were present in the seismic tests.
EXPERIMENTAL TESTS
The purpose of this study is to investigate the behaviour of DCFP and their effects in different
conditions of experimental base-isolation testing. The structural 3-D model for experimental seismic
tests was a 1/3-scaled steel frame, 1-storey with a rectangular plan of a 2.5m span along the test
direction by 2.0m in the orthogonal one, shown in Fig.1a.
Y
Z
DCFP
Shaking table
Direction of testing
X
Z
SteelPlates
ConcreteBlocks
ConcreteBlocks
X
Z
Shaking table
Shaking table
AdditionalMasses
AdditionalMasses
Base floor
First floor
Hinges
a) b) c)
Figure 1: a) overview of centred mass configuration; b) lateral view of experimental test (testing
direction); c) base isolation system based on DCFP bearings

A. Di Cesare, F.C. Ponzo, D. Nigro, M. Simonetti, G. Leccese 3
The inter-storey height is 2.9m and a 250mm thick steel-concrete slab is connected to the
primary beams of the first floor. The general layout of the scaled model is shown in Fig.1a. This paper
considers the seismic tests on the experimental model with symmetric masses, as reported in Table.1.
Bolts were used to ensure a rigid connection between the isolators and the basement of the test model,
as shown in Fig.1c. The model response was recorded by a total of 16 three-directional servo-
accelerometers, and 14 laser displacement transducers. More details about experimental model can be
found in Ponzo et al. (2014).
Table 1. Masses of experimental model configurations.
Storey Mass [t]
Base 3.20
1st floor 5.00
Total 8.20
The main design characteristics of single DCFP are: the maximum design vertical load NEd = 32
kN; the equivalent radius of curvature R = 1805 mm, approximately twice geometric radius of
curvature of each sliding surface; an overall displacement capacity dmax ± 180 mm. The rigid slider is
covered by an Ultra-High Molecular Weight Poly-Ethylene (UHMW-PE) high bearing capacity
composite material produced by FIP (FIP-INDUSTRIALE Spa, 2013), model FIP-D 20/360 (1805)
shown in Fig.2. In this application, the DCFP consists of two identical concave sliding surfaces having
external diameter 300 mm, same radius of curvature R1 = R2 = 925 mm, same coefficients of friction
of surfaces μ1 = μ2 and a rigid slider with a diameter 75 mm and height 45 mm.
Figure 2: Overview of the DCFP bearings
NUMERICAL MODELLING
The isolation systems is realized by four DCFP, one under each column, with two spherical stainless
steel surfaces, both accommodating for horizontal displacements and rotations, as shown in Fig.3a.
The vertical load acting on the isolator during seismic tests is Sd = 20.5 kN. The theoretical model to
resemble the functioning of the DCFP was studied by Fenz and Constantinou (2006) and consists to a
bi-linear force-displacement curve as shown in Fig.3b.
The non linear model with initial stiffness ki (before sliding) has friction force F0 (developed
by the isolator at zero displacement), restoring stiffness kr and horizontal force F (at the considered
displacement d) defined by Eq.1.
SdNF0 R
Nk Sd
r dkFF r 0 (1)
When the standard used for design of structures allows to model the non linear behaviour as a
linear equivalent behaviour, the effective stiffness ke, the period Te associated to ke, and the effective
damping e are calculated with the Eq.2.
dRNk Sde
1
dRg
Te
1
12
1
12
R
de
(2)

4
a)
b)
Figure 3: a) functioning scheme of the DCFP device; b) theoretical hysteresis cycle of DCFP bearing having
equal radii of curvature and equal friction coefficients.
The steel frame was modelled using frame-type 3D finite elements in SAP2000 (SAP2000,
2013), Fig.4a, and CDS-OpenSees (Cds-Win, 2014), Fig.4b. The connection between the columns and
the stiff beams at the base of the model was simulated through the use of fixed restraints with the floor
slabs being simulated by imposing a rigid diaphragm assumption.
a) b)
Figure 4: Global and Local modelling of the test model and DCFP: a) SAP2000, b) CDS-OpenSees.
The nonlinear behaviour of the single DCFP isolator has been modelled in SAP2000 (2013) by
using one joint link element type biaxial Friction-Pendulum Isolator, see Fig.4a. The friction and
pendulum forces are directly proportional to the compressive axial force in the element which cannot
carry axial tension. The velocity dependence of the coefficient of friction is described by Eq.3
(Constantinou et al., 1990), where: v is the sliding velocity; fast and slow are the sliding coefficients of
friction at maximum and minimum velocity respectively; is a rate parameter that controls the
transition from slow to fast.
The nonlinear behaviour of the single DCFP isolator has been modelled in CDS-OpenSees
(2014) by using one Friction-Pendulum Isolator, see Fig.4b. The axial load dependence of the
coefficient of friction is described by Eq.4 (FIP-Industriale, 2013), where: Sd and Ed are the vertical
load acting on the isolator and the maximum design vertical load respectively; is coefficient that
controls the lubricate condition of the surfaces.
v
slowfastfast e
)(
(3)
)/( EdSdslow NN
(4)

A. Di Cesare, F.C. Ponzo, D. Nigro, M. Simonetti, G. Leccese 5
Figure 5: friction coefficient; a) sliding velocity dependence; b) dependence of axial load
EXPERIMENTAL AND NUMERICAL RESULTS
Characterization tests
The bearings were tested under a maximum design vertical load NEd = 32 kN. A series of sinusoidal
lateral displacement were imposed in accordance with testing of Curved Surface Sliders prescribed by
Eurocode (UNI-EN 15129, 2009). Fig.6 shows experimental force-displacement relationships of the
DCFP carried out on two conditions of surfaces: i) Lubricated (SL) and ii) Not-lubricated (SNL). The
sliding material is essential to give stability of the hysteretic force vs. displacement curves with
displacement and velocity. A silicone based (lithium soap) lubricant was applied to the top and bottom
face (1 = 2) of the rigid slider. Major details of DCFP characterization testing can be found in Ponzo
et al. (2014).
The numerical simulations with SAP2000 have been calibrated against the results of
displacement- controlled tests by considering two different non-linear model of DCFP:
i) constant friction model whit a rigid-bilinear hysteretic behaviour and constant friction, as
derived from benchmark test (ki = ki,slow ; = slow );
ii) variable friction model with bilinear hysteretic behaviour and velocity dependent friction, as
derived from dynamic tests (ki = ki,fast ; μ defined by Eq.3)
Lubricated (SL) Not Lubricated (SNL)
Slo
w (
50 m
m/s
)
-40
-30
-20
-10
0
10
20
30
40
-200 -100 0 100 200
F [kN]
d [mm]
-40
-30
-20
-10
0
10
20
30
40
-200 -100 0 100 200
F [kN]
d [mm]
Fas
t (4
00m
m/s
)
-40
-30
-20
-10
0
10
20
30
40
-200 -100 0 100 200
F [kN]
d [mm]
-40
-30
-20
-10
0
10
20
30
40
-200 -100 0 100 200
F [kN]
d [mm]
Figure 6: Experimental and numerical (SAP2000) Force–displacement at peak velocities of 50 and 400 mm/s.
Both tests were conducted on Lubricated (SL) and Non-lubricated (SNL) surfaces.
Fig.6 reports the numerical results considering both constant and variable friction depending on
sliding velocity, as modelled by SAP 2000. A good agreement with experimental outcomes is

6
observed when initial stiffness ki, friction , determined by benchmark (slow) and dynamic (fast) tests,
and assuming the values reported in Table.2.
The exponents considered in the numerical model by CDS-OpenSees are reported in Table.2,
these values are indicated by FIP-Industriale (2013).
Table 2. Numerical parameters of DCFP selected on the basic of controlled-displacement test results.
Surfaces condition ki,slow
[kN/m] slow
[%]
ki,fast
[kN/m] fast
[%]
α
[s/m]
[s/m]
Lubricated (SL) 5000 2.5 400 5 5.0 -0.83
Plus (SNL) 5000 5 400 8 5.0 -0.56
Shaking Table Test
Two experimental configurations have been considered in this paper: i) configuration MC-SNL with
centred mass and not-lubricated surfaces (slow = 5%; fast = 8%); ii) configuration MC-SL with
centred masses and lubricated surfaces (slow = 2.5%; fast = 5%). This paper refers of one-directional
shaking table testing considering two natural earthquakes selected from European Strong Motion
Database compatible with soil type A (PGA = 0.25g) and soil type B (PGA = 0.45g). In Table.3 the
main characteristics and the reference PGA of the seismic inputs are reported. To ensure consistency
with the scale of the experimental model, all acceleration profiles were scaled down in duration by a
factor of 1/(1.3)1/2. The normalized elastic spectra of accelerations and of displacements are reported in
Fig.5 compared with the design spectrum given by the code (EC8-1, 2004) for soil type A. During
testing the PGA was increased in percentage of reference PGA (PGA ref, see Table.3). More detail of
complete test programme and major experimental results can be found in Ponzo et al. (2014).
Table 3. Seismic inputs for experimental testing considered in this paper
Waveform ID Earthquake Name Date Mw PGA ref.
[ag/g] Soil class
287 Campano Lucano 23/11/1980 6.9 0.25 A
196 Montenegro 15/04/1979 6.9 0.45 B
0
1
2
3
4
5
0 0.5 1 1.5 2 2.5
Sa/PGA
T [sec]
287
196
Code
0.0
0.2
0.4
0.6
0.8
1.0
0 0.5 1 1.5 2 2.5
Sd [m]
T [sec]
287
196
Code
Figure 7: Seismic inputs normalized elastic spectra of acceleration Sa and displacements Sd
In Fig.8 the experimental values of initial displacements, maximum displacements and
residual displacements of the base isolation system are reported. In case of MC-SNL configuration the
isolation system responded in a different manner with and without initial residual displacements, but
similar maximum displacements were reached. Applying the lubrication (MC-SL configuration), the
displacement of the isolation system increased of about 10% and no residual displacements were
recorded.
Fig.9 displays the shaking table test results in terms of base displacement history MC-SNL and
MC-SL model configurations when accelerograms 287 and 196 with intensity level of 200% (PGA =
0.5g and PGA = 0.9g respectively) were applied. For MC-SNL case the test was repeated resetting the
initial residual displacement (configuration indicated with * in Table.3). Both constant and variable

A. Di Cesare, F.C. Ponzo, D. Nigro, M. Simonetti, G. Leccese 7
friction models of DCFP show a good agreement with shaking table results when the initial
displacement starts from zero.
Fig.s 10 show movement of the DCFP in the vertical plane (YZ) and horizontal (YX) insulator
for MC-SNL and MC-SL test configurations considering accelerograms 287 and 196 at PGA=200%.
From the figures of the displacement in the vertical plane can be observed the curvature equivalent
devices and absence of irregularities related to potential effects of static friction.
0 20 40 60 80 100 120
*196@200%
196@200%
196@150%
196@100%
*287@200%
287@200%
287@150%
287@100%
287@75%
287@50%
287@25%
d[mm]
Initial
Maximum
Residual
0 20 40 60 80 100 120
d[mm]
Initial
Maximum
Residual
0 20 40 60 80 100 120
d[mm]
Figure 8: Comparisons between initial, maximum and residual base displacements from the experimental test
configurations: MC-SNL and MC-SL.
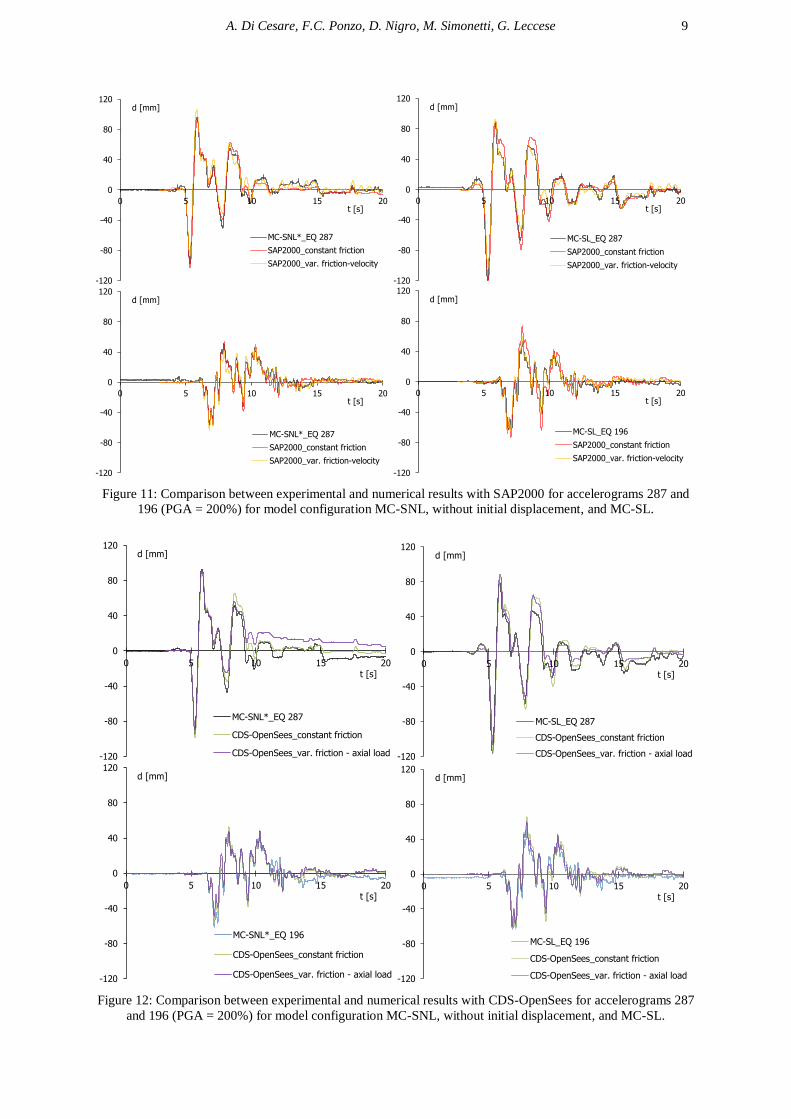
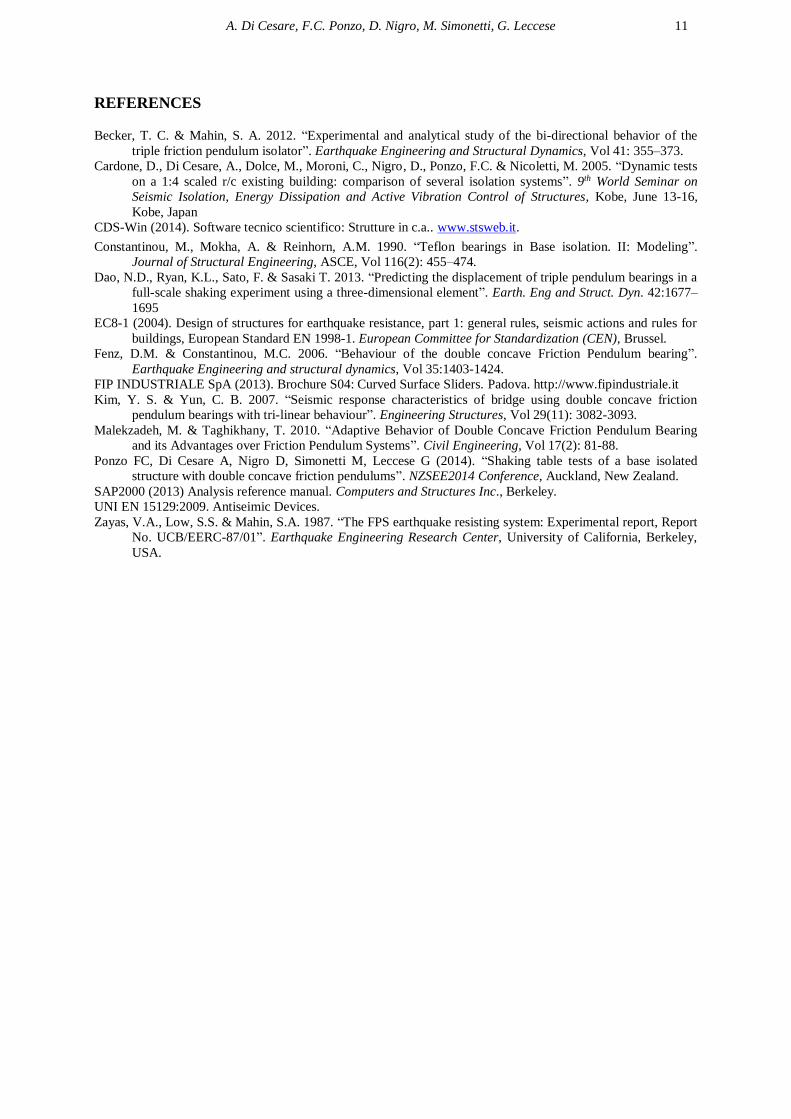
Results of Numerical Simulations Fig. 11 and 12 shows the base displacements obtained from experimental tests considering the inputs
287 and 196 at PGA = 200%, for configurations MC-SNL and MC-SL, compared with the results
obtained by the numerical analysis with SAP2000 and with CSD-OpenSees, respectively. From Fig.11
a good agreement with the experimental results for both velocity dependence models is shown. Also
from Fig.12 a good agreement with the experimental results can be observe only for both axial load
dependence models is shown.
In order to better understand the influence of the residual displacement due to previous
experimental tests further nonlinear time history analysis have been carried out considering the MC-
SNL configuration imposing initial offsets to the SAP 2000 model with constant friction. Fig.13
displays the shaking table test results in terms of base displacement history with inputs 287 and 196
with PGA = 200% with and without initial residual displacement (see Fig.8). The displacement history
of the numerical model with offset shows a trend versus experimental results without initial offset.
More realistic numerical modelling is required in order to improve the reliability to predict the seismic
response also when initial offset are applied to the DCFP isolation system.

8
-120
-80
-40
0
40
80
120
0 5 10 15 20
d [mm]
t [s]
MC-SNL_EQ 287
MC-SNL*_EQ 287
-120
-80
-40
0
40
80
120
0 5 10 15 20
d [mm]
t [s]
MC-SL_EQ 287
-120
-80
-40
0
40
80
120
0 5 10 15 20
d [mm]
t [s]
MC-SNL_EQ 196
MC-SNL*_EQ 196
-120
-80
-40
0
40
80
120
0 5 10 15 20
d [mm]
t [s]
MC-SL_EQ 196
Figure 9: Comparison between experimental test for accelerograms 287 and 196 (PGA = 200%) for model
configuration MC-SNL, with and without initial displacement, and MC-SL.
0
2
4
6
-120 -80 -40 0 40 80 120
displ. Z [mm]
displ. Y[mm]
MC-SNL*_EQ 287
MC-SNL*_EQ 196
0
2
4
6
-120 -80 -40 0 40 80 120
displ. Z [mm]
displ. Y[mm]
MC-SL_EQ 287
MC-SL_EQ 196
-6
-3
0
3
6
-120 -80 -40 0 40 80 120
displ. X [mm]
displ. Y[mm]
MC-SNL*_EQ 287
MC-SNL*_EQ 196
-6
-3
0
3
6
-120 -80 -40 0 40 80 120
displ. X [mm]
displ. Y[mm]
MC-SL_EQ 287
MC-SL_EQ 196
Figure 10: Experimental displacement of the isolation system in the vertical and the horizontal plan for
accelerograms 287 and 196 (PGA = 200%) for model configuration MC-SNL, without initial offset, and MC-SL
A. Di Cesare, F.C. Ponzo, D. Nigro, M. Simonetti, G. Leccese 9
-120
-80
-40
0
40
80
120
0 5 10 15 20
d [mm]
t [s]
MC-SNL*_EQ 287
SAP2000_constant friction
SAP2000_var. friction-velocity
-120
-80
-40
0
40
80
120
0 5 10 15 20
d [mm]
t [s]
MC-SL_EQ 287
SAP2000_constant friction
SAP2000_var. friction-velocity
-120
-80
-40
0
40
80
120
0 5 10 15 20
d [mm]
t [s]
MC-SNL*_EQ 287
SAP2000_constant friction
SAP2000_var. friction-velocity
-120
-80
-40
0
40
80
120
0 5 10 15 20
d [mm]
t [s]
MC-SL_EQ 196
SAP2000_constant friction
SAP2000_var. friction-velocity
Figure 11: Comparison between experimental and numerical results with SAP2000 for accelerograms 287 and
196 (PGA = 200%) for model configuration MC-SNL, without initial displacement, and MC-SL.
-120
-80
-40
0
40
80
120
0 5 10 15 20
d [mm]
t [s]
MC-SNL*_EQ 287
CDS-OpenSees_constant friction
CDS-OpenSees_var. friction - axial load -120
-80
-40
0
40
80
120
0 5 10 15 20
d [mm]
t [s]
MC-SL_EQ 287
CDS-OpenSees_constant friction
CDS-OpenSees_var. friction - axial load
-120
-80
-40
0
40
80
120
0 5 10 15 20
d [mm]
t [s]
MC-SNL*_EQ 196
CDS-OpenSees_constant friction
CDS-OpenSees_var. friction - axial load -120
-80
-40
0
40
80
120
0 5 10 15 20
d [mm]
t [s]
MC-SL_EQ 196
CDS-OpenSees_constant friction
CDS-OpenSees_var. friction - axial load
Figure 12: Comparison between experimental and numerical results with CDS-OpenSees for accelerograms 287
and 196 (PGA = 200%) for model configuration MC-SNL, without initial displacement, and MC-SL.

10
-120
-80
-40
0
40
80
120
0 5 10 15 20
d [mm]
t [s]
MC-SNL*_EQ 287
MC-SNL_EQ 287
SAP2000_constant friction_with offset
-120
-80
-40
0
40
80
120
0 5 10 15 20
d [mm]
t [s]
MC-SNL*_EQ 196
MC-SNL_EQ 196
SAP2000_constant friction_with offset
Figure 13: Comparison between experimental and numerical results with SAP2000 for accelerograms 287 and
196 (PGA = 200%) for model configuration MC-SNL with and without initial displacement.
CONCLUSIONS
In this paper double concave friction pendulum (DCFP) with rigid slider and equal radii of curvature
have been investigated.
The DCFP bearing were tested under both controlled-displacement and earthquake ground
motions. The force–displacement relationship was verified through characterization testing of bearings
with sliding surfaces having same friction coefficient and different conditions of lubrication. This
paper refers of shaking table test considering the configuration of the test model with symmetric mass,
two different sliding conditions (with and without lubrication) and two different seismic inputs. The
earthquake ground motion experiments shown that the dynamic behaviour of DCFP bearings is both
reliable and repeatable even when initial slider offsets are present, showing stable behaviour under all
testing.
The numerical simulations have been performed using two different finite element programme
SAP2000 and CDS-OpenSees. In SAP2000 two models of the isolator with definition of friction
coefficient by constant or variable with sliding velocity, while in CDS-OpenSees two models of the
isolator with definition of friction coefficient by constant or variable with applied axial load.
Both numerical models show similar behaviour to the experimental results in term of
displacement history of a DCFP bearing in a strong earthquake. The peaks of bearing displacement
experimentally observed were generally estimated with sufficient accuracy (within 10% error) also by
mean of constant coefficient models. The model with variable friction coefficient depending on
velocity of sliding offered some improvement in the displacement prediction relative to a constant
friction model. On the contrary, the model with variable friction coefficient depending on vertical
axial load did not shown improvement respect to a constant friction model. The friction coefficient has
responded constantly also for significant change of applied vertical load respect the maximum
designed (Nsd / NEd = 0.64). Further studies are needed to improve the reliability to predict the seismic
response also when initial offset are present and to determine if these conclusions are generally
applicable for standard size bearings.
ACKNOWLEDGEMENTS
This work was funded by the Italian Department of Civil Protection within the project RELUIS II-
Task 2.3.2 and RELUIS III-Line 6. FIP Industriale, Italy, supplied the DCFP devices. This support is
gratefully acknowledged.
A. Di Cesare, F.C. Ponzo, D. Nigro, M. Simonetti, G. Leccese 11
REFERENCES
Becker, T. C. & Mahin, S. A. 2012. “Experimental and analytical study of the bi-directional behavior of the
triple friction pendulum isolator”. Earthquake Engineering and Structural Dynamics, Vol 41: 355–373.
Cardone, D., Di Cesare, A., Dolce, M., Moroni, C., Nigro, D., Ponzo, F.C. & Nicoletti, M. 2005. “Dynamic tests
on a 1:4 scaled r/c existing building: comparison of several isolation systems”. 9th World Seminar on
Seismic Isolation, Energy Dissipation and Active Vibration Control of Structures, Kobe, June 13-16,
Kobe, Japan
CDS-Win (2014). Software tecnico scientifico: Strutture in c.a.. www.stsweb.it.
Constantinou, M., Mokha, A. & Reinhorn, A.M. 1990. “Teflon bearings in Base isolation. II: Modeling”.
Journal of Structural Engineering, ASCE, Vol 116(2): 455–474.
Dao, N.D., Ryan, K.L., Sato, F. & Sasaki T. 2013. “Predicting the displacement of triple pendulum bearings in a
full-scale shaking experiment using a three-dimensional element”. Earth. Eng and Struct. Dyn. 42:1677–
1695
EC8-1 (2004). Design of structures for earthquake resistance, part 1: general rules, seismic actions and rules for
buildings, European Standard EN 1998-1. European Committee for Standardization (CEN), Brussel.
Fenz, D.M. & Constantinou, M.C. 2006. “Behaviour of the double concave Friction Pendulum bearing”.
Earthquake Engineering and structural dynamics, Vol 35:1403-1424.
FIP INDUSTRIALE SpA (2013). Brochure S04: Curved Surface Sliders. Padova. http://www.fipindustriale.it
Kim, Y. S. & Yun, C. B. 2007. “Seismic response characteristics of bridge using double concave friction
pendulum bearings with tri-linear behaviour”. Engineering Structures, Vol 29(11): 3082-3093.
Malekzadeh, M. & Taghikhany, T. 2010. “Adaptive Behavior of Double Concave Friction Pendulum Bearing
and its Advantages over Friction Pendulum Systems”. Civil Engineering, Vol 17(2): 81-88.
Ponzo FC, Di Cesare A, Nigro D, Simonetti M, Leccese G (2014). “Shaking table tests of a base isolated
structure with double concave friction pendulums”. NZSEE2014 Conference, Auckland, New Zealand.
SAP2000 (2013) Analysis reference manual. Computers and Structures Inc., Berkeley.
UNI EN 15129:2009. Antiseimic Devices.
Zayas, V.A., Low, S.S. & Mahin, S.A. 1987. “The FPS earthquake resisting system: Experimental report, Report
No. UCB/EERC-87/01”. Earthquake Engineering Research Center, University of California, Berkeley,
USA.