seismic reflection for gold exploration · seismic reflection for gold exploration gold...
TRANSCRIPT
SEISMIC REFLECTION FOR GOLD EXPLORATION
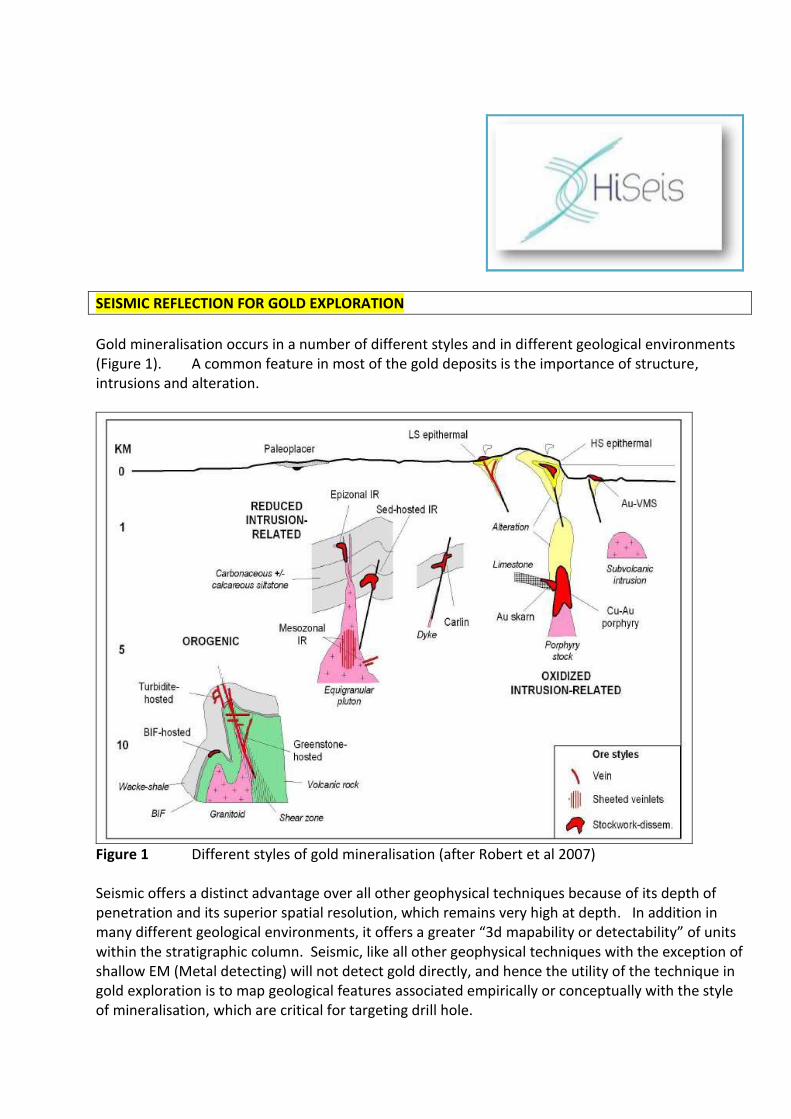
Gold mineralisation occurs in a number of different styles and in different geological environments (Figure 1). A common feature in most of the gold deposits is the importance of structure, intrusions and alteration.
Figure 1 Different styles of gold mineralisation (after Robert et al 2007) Seismic offers a distinct advantage over all other geophysical techniques because of its depth of penetration and its superior spatial resolution, which remains very high at depth. In addition in many different geological environments, it offers a greater “3d mapability or detectability” of units within the stratigraphic column. Seismic, like all other geophysical techniques with the exception of shallow EM (Metal detecting) will not detect gold directly, and hence the utility of the technique in gold exploration is to map geological features associated empirically or conceptually with the style of mineralisation, which are critical for targeting drill hole.

On a regional scale in the Goldfields region of Western Australia, recent work by Goleby (1993) and Chopping (2008) suggests that there are a suite of seismic reflections that have resulted from the interaction of fluids flowing through major structural zones, and that these are imagable down to depths in excess of 5,000 meters (Figure 2). Chopping uses the term “fluid flow reflections”.
Figure 2 Interpretation of the crustal scale seismic transect in the northern Yilgarn (Chopping 2008). On a finer Mine scale, Chopping suggested that based on petrophysical sampling of drill holes in the Sunrise Dam Gold deposit, that the Sunrise Dam Shear has the potential to be directly imaged using seismic. In the case of a semi-regional seismic survey (slightly to the north of the deposit), which had a dominant frequency of 50 Hz (wavelength of approximately 120m ), then if the alteration associated with the shear occurs over a distance of 30 m, it would be imaged as a single high frequency reflection. In the Cortez area of Nevada, USA, seismic has been demonstrated to map the key geological elements of their exploration model down to depths in excess of 1500 meters. These include antiformal closures of favourably prospective startigraphy abutting major thrust structures. This has allowed accurate drill targeting in the pediment covered areas of the Battle Mountain mineralised trend. In the St Ives Gold Camp of Western Australia, recent research has and exploration results have demonstrated the importance of fluid flow and fluid interactions in the formation of significant gold mineralisation. Knowledge of the 3d form of the structure derived from high definition seismic surveying has an important input into exploration targeting.
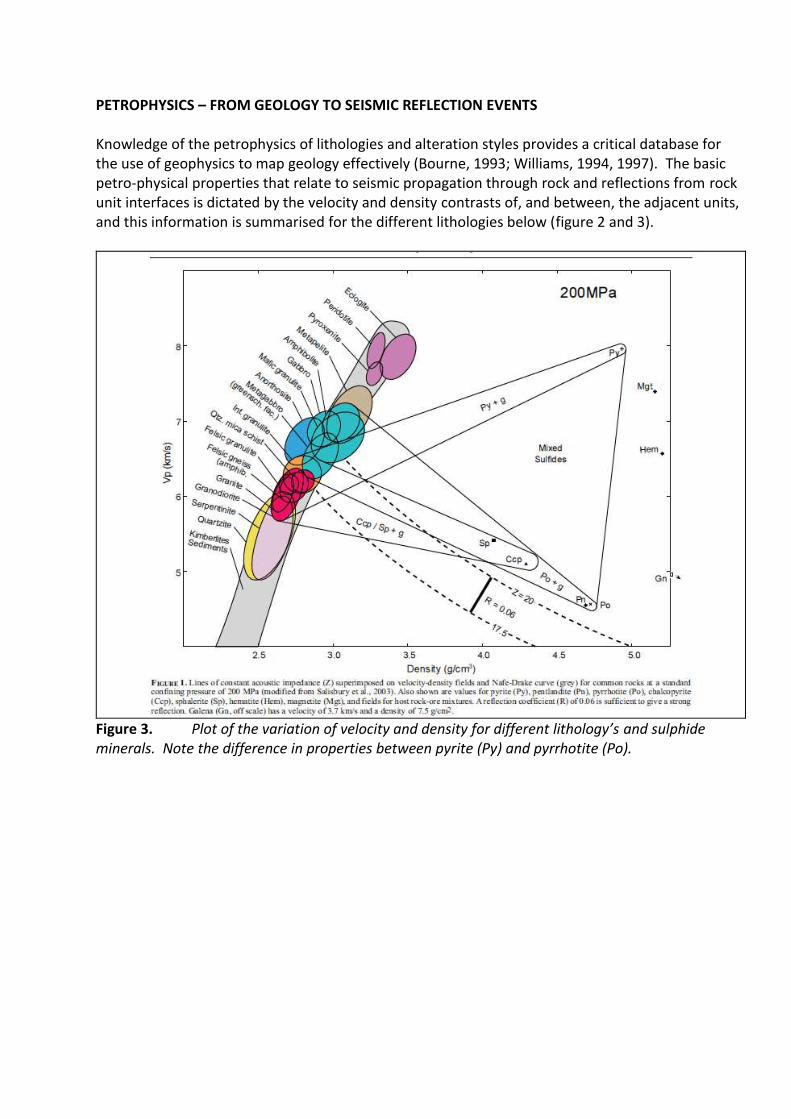
PETROPHYSICS – FROM GEOLOGY TO SEISMIC REFLECTION EVENTS Knowledge of the petrophysics of lithologies and alteration styles provides a critical database for the use of geophysics to map geology effectively (Bourne, 1993; Williams, 1994, 1997). The basic petro-physical properties that relate to seismic propagation through rock and reflections from rock unit interfaces is dictated by the velocity and density contrasts of, and between, the adjacent units, and this information is summarised for the different lithologies below (figure 2 and 3).
Figure 3. Plot of the variation of velocity and density for different lithology’s and sulphide minerals. Note the difference in properties between pyrite (Py) and pyrrhotite (Po).
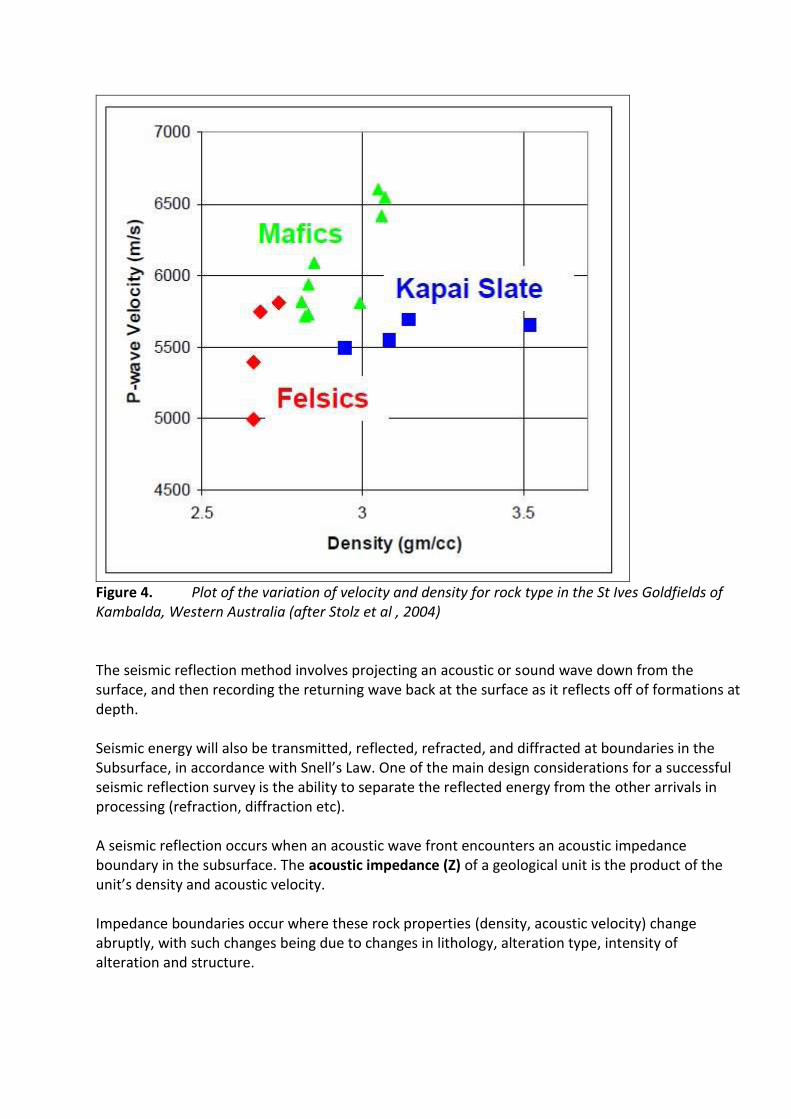
Figure 4. Plot of the variation of velocity and density for rock type in the St Ives Goldfields of Kambalda, Western Australia (after Stolz et al , 2004) The seismic reflection method involves projecting an acoustic or sound wave down from the surface, and then recording the returning wave back at the surface as it reflects off of formations at depth. Seismic energy will also be transmitted, reflected, refracted, and diffracted at boundaries in the Subsurface, in accordance with Snell’s Law. One of the main design considerations for a successful seismic reflection survey is the ability to separate the reflected energy from the other arrivals in processing (refraction, diffraction etc). A seismic reflection occurs when an acoustic wave front encounters an acoustic impedance boundary in the subsurface. The acoustic impedance (Z) of a geological unit is the product of the unit’s density and acoustic velocity. Impedance boundaries occur where these rock properties (density, acoustic velocity) change abruptly, with such changes being due to changes in lithology, alteration type, intensity of alteration and structure.
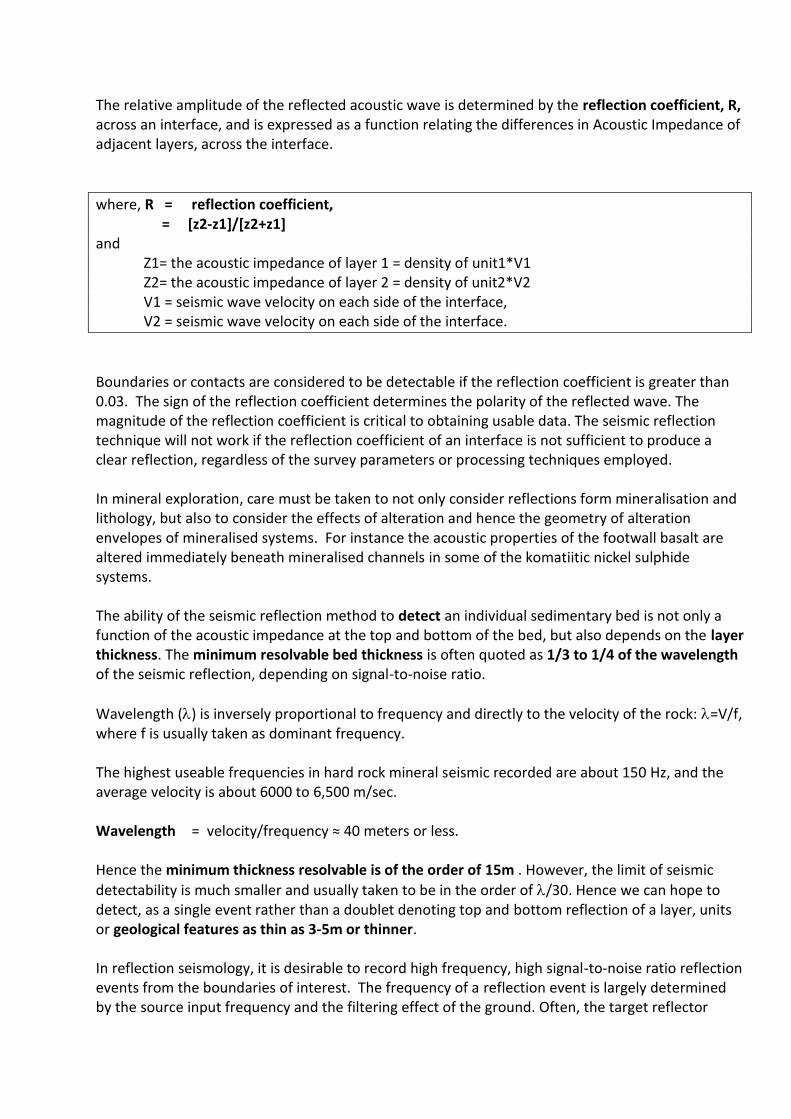
The relative amplitude of the reflected acoustic wave is determined by the reflection coefficient, R, across an interface, and is expressed as a function relating the differences in Acoustic Impedance of adjacent layers, across the interface.
where, R = reflection coefficient, = [z2-z1]/[z2+z1] and Z1= the acoustic impedance of layer 1 = density of unit1*V1 Z2= the acoustic impedance of layer 2 = density of unit2*V2 V1 = seismic wave velocity on each side of the interface, V2 = seismic wave velocity on each side of the interface.
Boundaries or contacts are considered to be detectable if the reflection coefficient is greater than 0.03. The sign of the reflection coefficient determines the polarity of the reflected wave. The magnitude of the reflection coefficient is critical to obtaining usable data. The seismic reflection technique will not work if the reflection coefficient of an interface is not sufficient to produce a clear reflection, regardless of the survey parameters or processing techniques employed. In mineral exploration, care must be taken to not only consider reflections form mineralisation and lithology, but also to consider the effects of alteration and hence the geometry of alteration envelopes of mineralised systems. For instance the acoustic properties of the footwall basalt are altered immediately beneath mineralised channels in some of the komatiitic nickel sulphide systems. The ability of the seismic reflection method to detect an individual sedimentary bed is not only a function of the acoustic impedance at the top and bottom of the bed, but also depends on the layer thickness. The minimum resolvable bed thickness is often quoted as 1/3 to 1/4 of the wavelength of the seismic reflection, depending on signal-to-noise ratio.
Wavelength () is inversely proportional to frequency and directly to the velocity of the rock: =V/f, where f is usually taken as dominant frequency. The highest useable frequencies in hard rock mineral seismic recorded are about 150 Hz, and the average velocity is about 6000 to 6,500 m/sec. Wavelength = velocity/frequency ≈ 40 meters or less. Hence the minimum thickness resolvable is of the order of 15m . However, the limit of seismic
detectability is much smaller and usually taken to be in the order of /30. Hence we can hope to detect, as a single event rather than a doublet denoting top and bottom reflection of a layer, units or geological features as thin as 3-5m or thinner. In reflection seismology, it is desirable to record high frequency, high signal-to-noise ratio reflection events from the boundaries of interest. The frequency of a reflection event is largely determined by the source input frequency and the filtering effect of the ground. Often, the target reflector

frequency is similar to that commonly recorded for coherent noise (in particular, the noise from ground roll), making it difficult or impossible to selectively filter out the noise, on a trace basis. The third factor which influences the ability of the surface seismic method to image a reflective surface, is the dip or plunge of that surface. Surface seismic selectively images flatter (< 45-50 degrees) dipping surfaces. Effective design of a high resolution seismic survey requires a focus on isolating reflection events careful design of field acquisition parameters, including the source/receiver geometry, geophone spacing, shot-point spacing, choice of seismic sources, the spectral characteristics of the geophones, as well as recording parameters, such as sampling rate and filter settings.
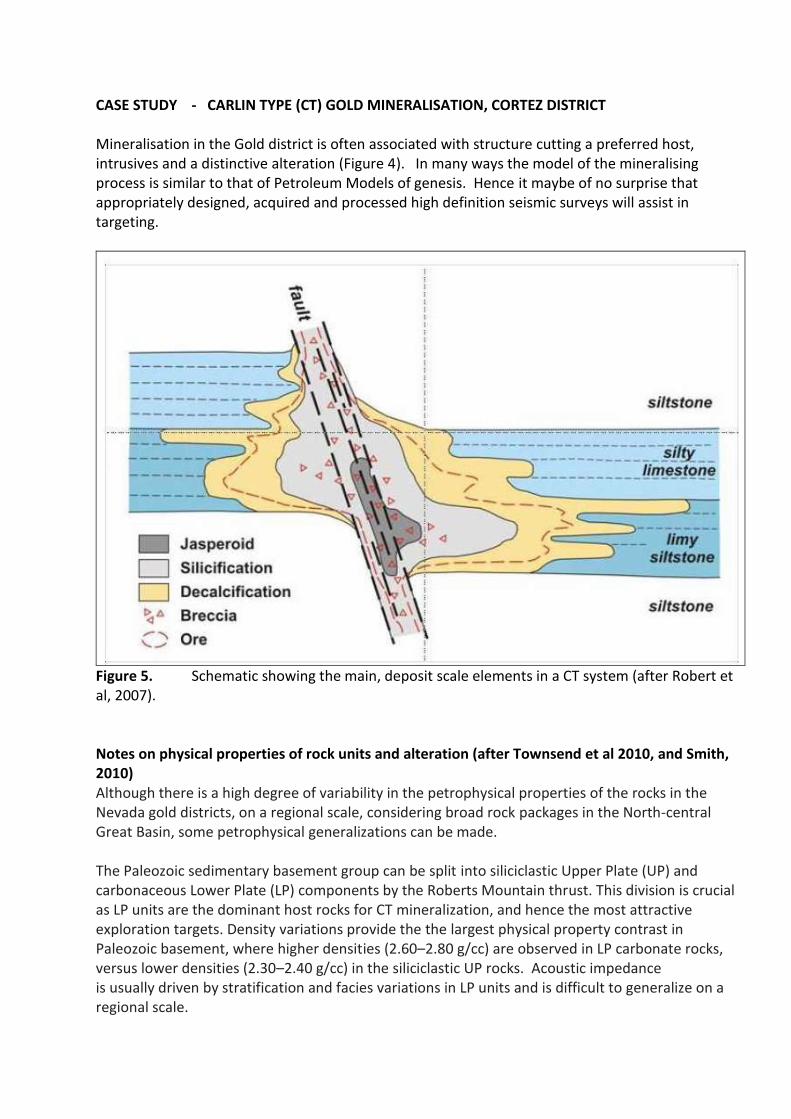
CASE STUDY - CARLIN TYPE (CT) GOLD MINERALISATION, CORTEZ DISTRICT Mineralisation in the Gold district is often associated with structure cutting a preferred host, intrusives and a distinctive alteration (Figure 4). In many ways the model of the mineralising process is similar to that of Petroleum Models of genesis. Hence it maybe of no surprise that appropriately designed, acquired and processed high definition seismic surveys will assist in targeting.
Figure 5. Schematic showing the main, deposit scale elements in a CT system (after Robert et al, 2007). Notes on physical properties of rock units and alteration (after Townsend et al 2010, and Smith, 2010) Although there is a high degree of variability in the petrophysical properties of the rocks in the Nevada gold districts, on a regional scale, considering broad rock packages in the North-central Great Basin, some petrophysical generalizations can be made. The Paleozoic sedimentary basement group can be split into siliciclastic Upper Plate (UP) and carbonaceous Lower Plate (LP) components by the Roberts Mountain thrust. This division is crucial as LP units are the dominant host rocks for CT mineralization, and hence the most attractive exploration targets. Density variations provide the the largest physical property contrast in Paleozoic basement, where higher densities (2.60–2.80 g/cc) are observed in LP carbonate rocks, versus lower densities (2.30–2.40 g/cc) in the siliciclastic UP rocks. Acoustic impedance is usually driven by stratification and facies variations in LP units and is difficult to generalize on a regional scale.
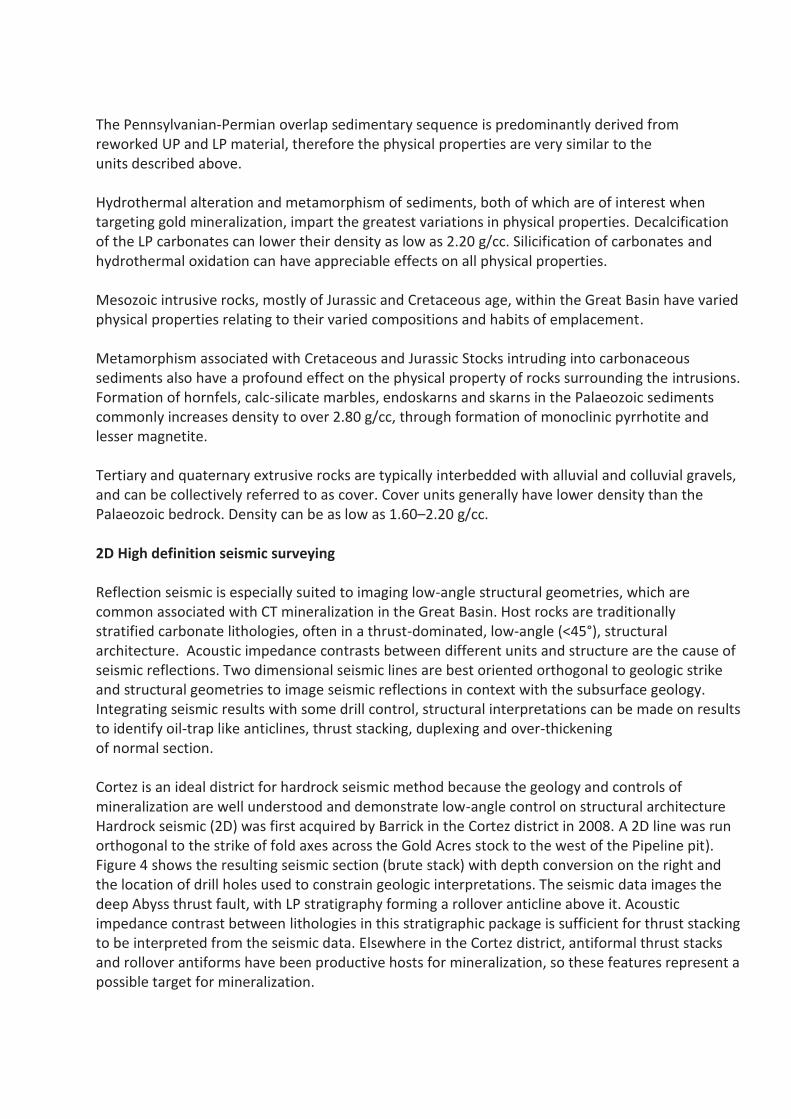
The Pennsylvanian-Permian overlap sedimentary sequence is predominantly derived from reworked UP and LP material, therefore the physical properties are very similar to the units described above. Hydrothermal alteration and metamorphism of sediments, both of which are of interest when targeting gold mineralization, impart the greatest variations in physical properties. Decalcification of the LP carbonates can lower their density as low as 2.20 g/cc. Silicification of carbonates and hydrothermal oxidation can have appreciable effects on all physical properties. Mesozoic intrusive rocks, mostly of Jurassic and Cretaceous age, within the Great Basin have varied physical properties relating to their varied compositions and habits of emplacement. Metamorphism associated with Cretaceous and Jurassic Stocks intruding into carbonaceous sediments also have a profound effect on the physical property of rocks surrounding the intrusions. Formation of hornfels, calc-silicate marbles, endoskarns and skarns in the Palaeozoic sediments commonly increases density to over 2.80 g/cc, through formation of monoclinic pyrrhotite and lesser magnetite. Tertiary and quaternary extrusive rocks are typically interbedded with alluvial and colluvial gravels, and can be collectively referred to as cover. Cover units generally have lower density than the Palaeozoic bedrock. Density can be as low as 1.60–2.20 g/cc. 2D High definition seismic surveying Reflection seismic is especially suited to imaging low-angle structural geometries, which are common associated with CT mineralization in the Great Basin. Host rocks are traditionally stratified carbonate lithologies, often in a thrust-dominated, low-angle (<45°), structural architecture. Acoustic impedance contrasts between different units and structure are the cause of seismic reflections. Two dimensional seismic lines are best oriented orthogonal to geologic strike and structural geometries to image seismic reflections in context with the subsurface geology. Integrating seismic results with some drill control, structural interpretations can be made on results to identify oil-trap like anticlines, thrust stacking, duplexing and over-thickening of normal section. Cortez is an ideal district for hardrock seismic method because the geology and controls of mineralization are well understood and demonstrate low-angle control on structural architecture Hardrock seismic (2D) was first acquired by Barrick in the Cortez district in 2008. A 2D line was run orthogonal to the strike of fold axes across the Gold Acres stock to the west of the Pipeline pit). Figure 4 shows the resulting seismic section (brute stack) with depth conversion on the right and the location of drill holes used to constrain geologic interpretations. The seismic data images the deep Abyss thrust fault, with LP stratigraphy forming a rollover anticline above it. Acoustic impedance contrast between lithologies in this stratigraphic package is sufficient for thrust stacking to be interpreted from the seismic data. Elsewhere in the Cortez district, antiformal thrust stacks and rollover antiforms have been productive hosts for mineralization, so these features represent a possible target for mineralization.
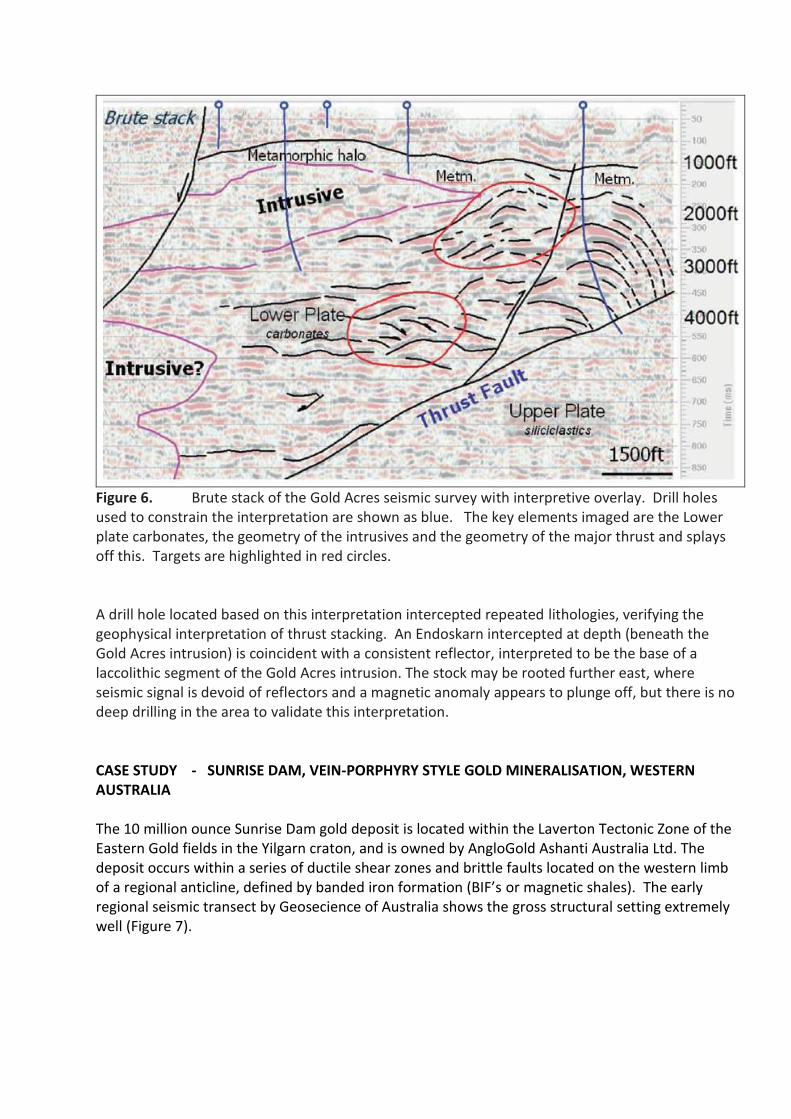
Figure 6. Brute stack of the Gold Acres seismic survey with interpretive overlay. Drill holes used to constrain the interpretation are shown as blue. The key elements imaged are the Lower plate carbonates, the geometry of the intrusives and the geometry of the major thrust and splays off this. Targets are highlighted in red circles. A drill hole located based on this interpretation intercepted repeated lithologies, verifying the geophysical interpretation of thrust stacking. An Endoskarn intercepted at depth (beneath the Gold Acres intrusion) is coincident with a consistent reflector, interpreted to be the base of a laccolithic segment of the Gold Acres intrusion. The stock may be rooted further east, where seismic signal is devoid of reflectors and a magnetic anomaly appears to plunge off, but there is no deep drilling in the area to validate this interpretation. CASE STUDY - SUNRISE DAM, VEIN-PORPHYRY STYLE GOLD MINERALISATION, WESTERN AUSTRALIA The 10 million ounce Sunrise Dam gold deposit is located within the Laverton Tectonic Zone of the Eastern Gold fields in the Yilgarn craton, and is owned by AngloGold Ashanti Australia Ltd. The deposit occurs within a series of ductile shear zones and brittle faults located on the western limb of a regional anticline, defined by banded iron formation (BIF’s or magnetic shales). The early regional seismic transect by Geosecience of Australia shows the gross structural setting extremely well (Figure 7).
Figure 7. Regional seismic transect across the Sunrise Dam area (after Geoscience of Australia, At Sunrise Dam drilling and field mapping have delineated an architecture comprised of early formed shallow dipping shear zones, linked by steeper dipping structures. This geometry has a minimum of 1.5 km depth extent, and may define the structural architecture for the top brittle section of the crust. An investigation of the petrophysical properties (Chopping 2008) of various lithologies and alteration at Sunrise Dam suggest that chemical alteration by fluids flowing in the shear zone will produce an apparent high frequency reflection.
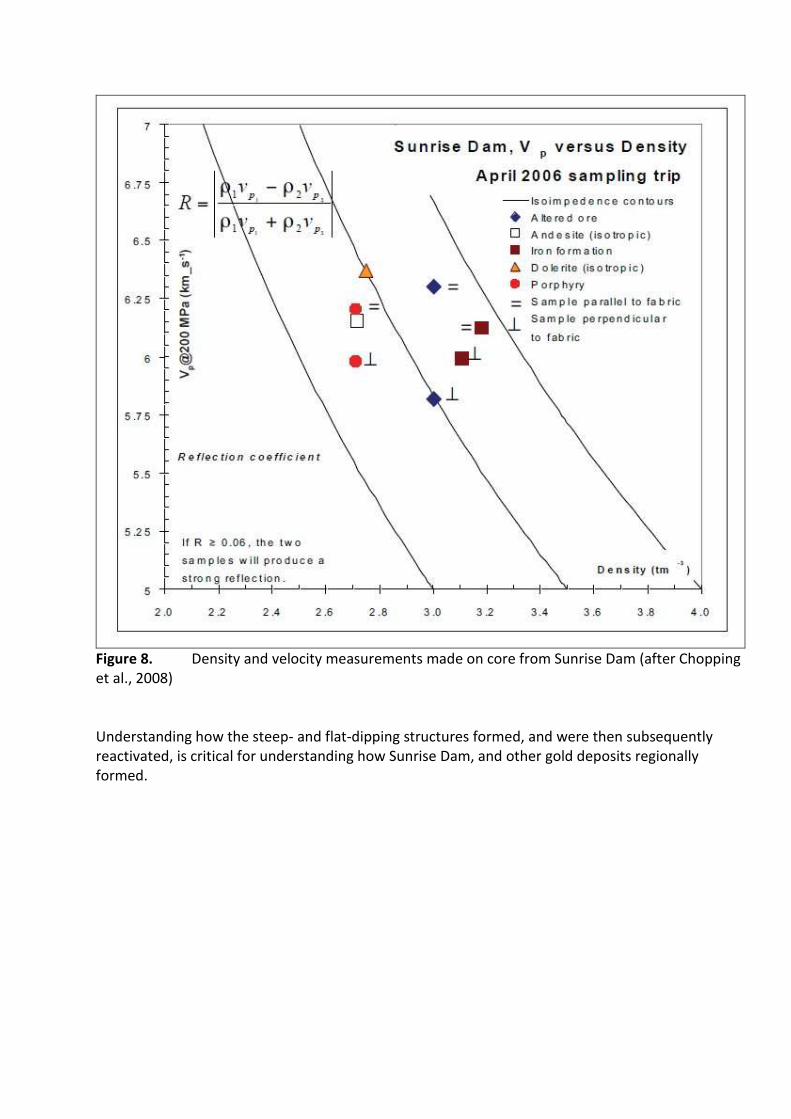
Figure 8. Density and velocity measurements made on core from Sunrise Dam (after Chopping et al., 2008) Understanding how the steep- and flat-dipping structures formed, and were then subsequently reactivated, is critical for understanding how Sunrise Dam, and other gold deposits regionally formed.
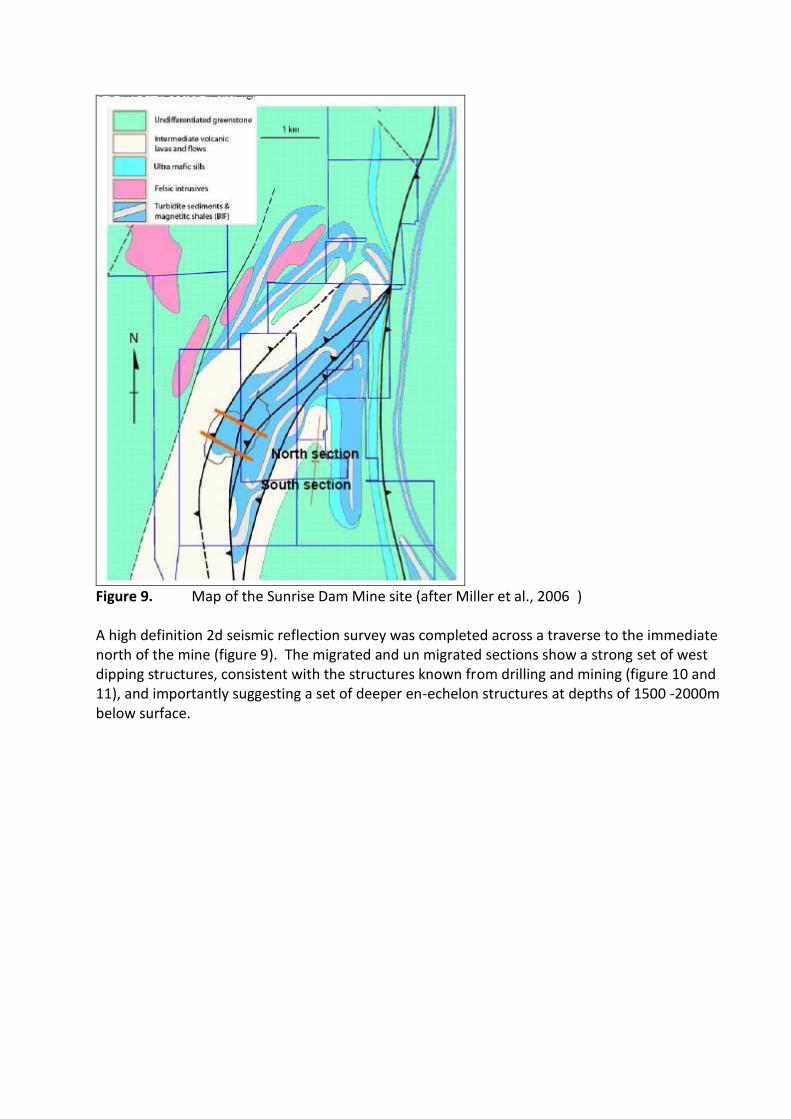
Figure 9. Map of the Sunrise Dam Mine site (after Miller et al., 2006 ) A high definition 2d seismic reflection survey was completed across a traverse to the immediate north of the mine (figure 9). The migrated and un migrated sections show a strong set of west dipping structures, consistent with the structures known from drilling and mining (figure 10 and 11), and importantly suggesting a set of deeper en-echelon structures at depths of 1500 -2000m below surface.
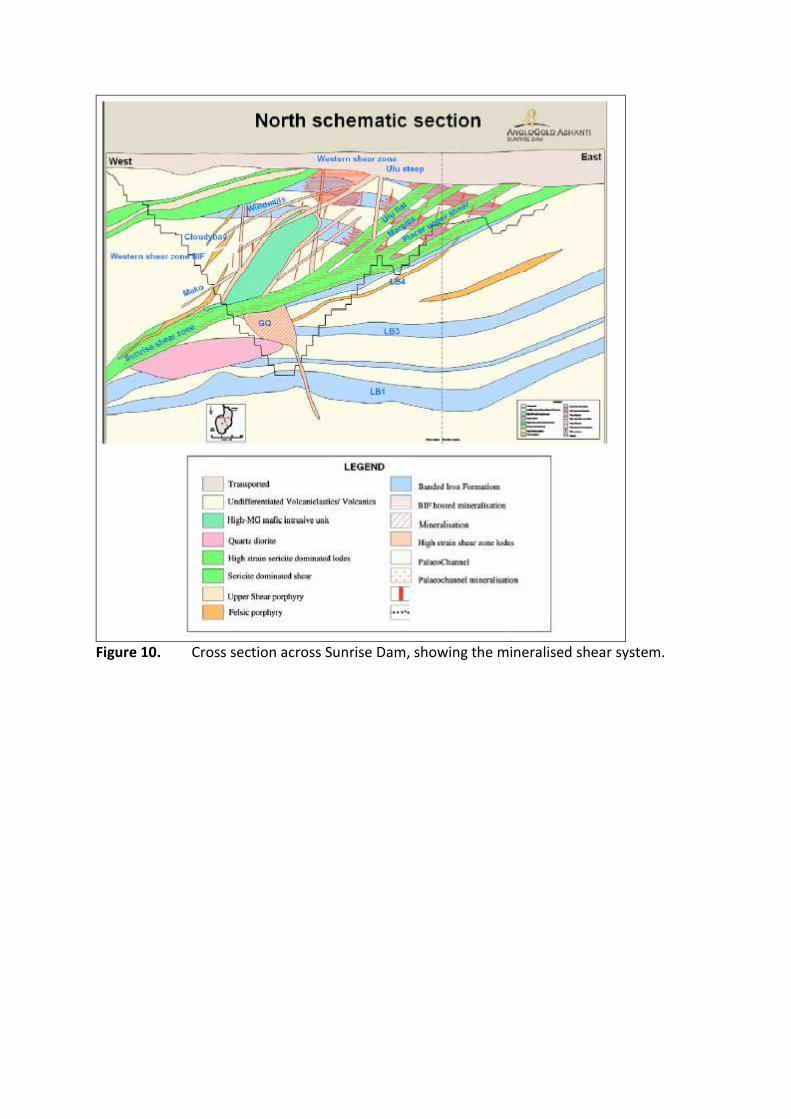
Figure 10. Cross section across Sunrise Dam, showing the mineralised shear system.
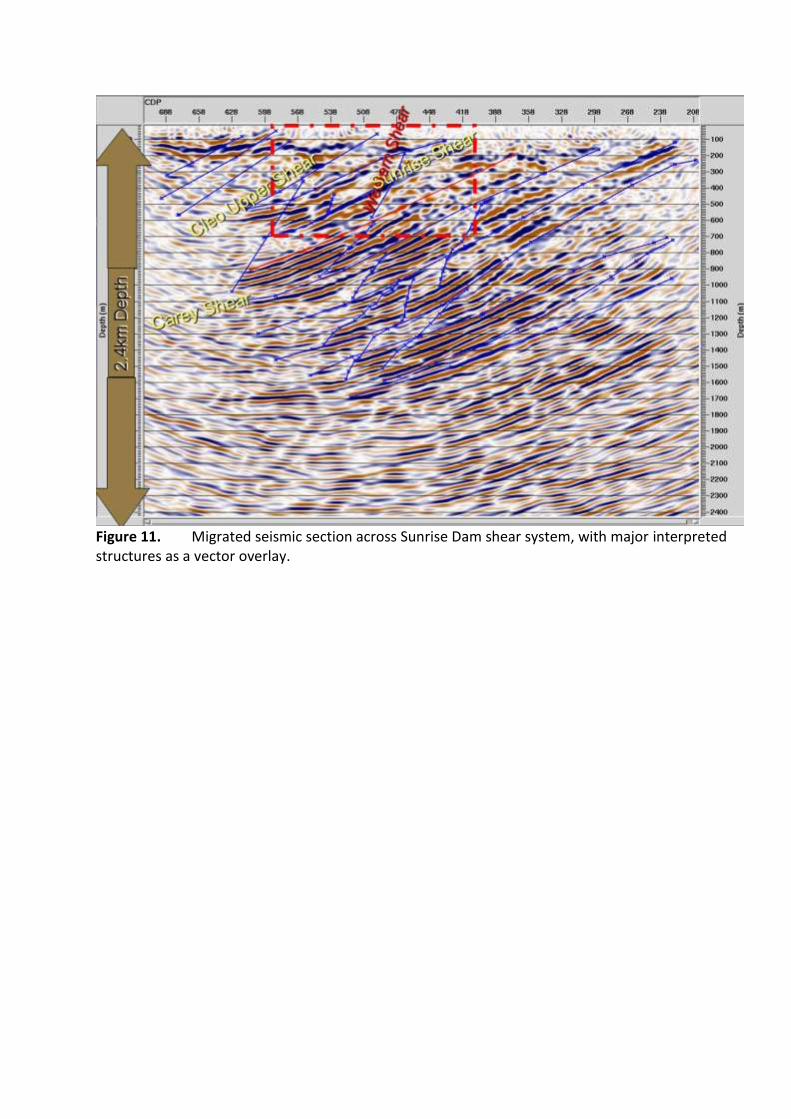
Figure 11. Migrated seismic section across Sunrise Dam shear system, with major interpreted structures as a vector overlay.
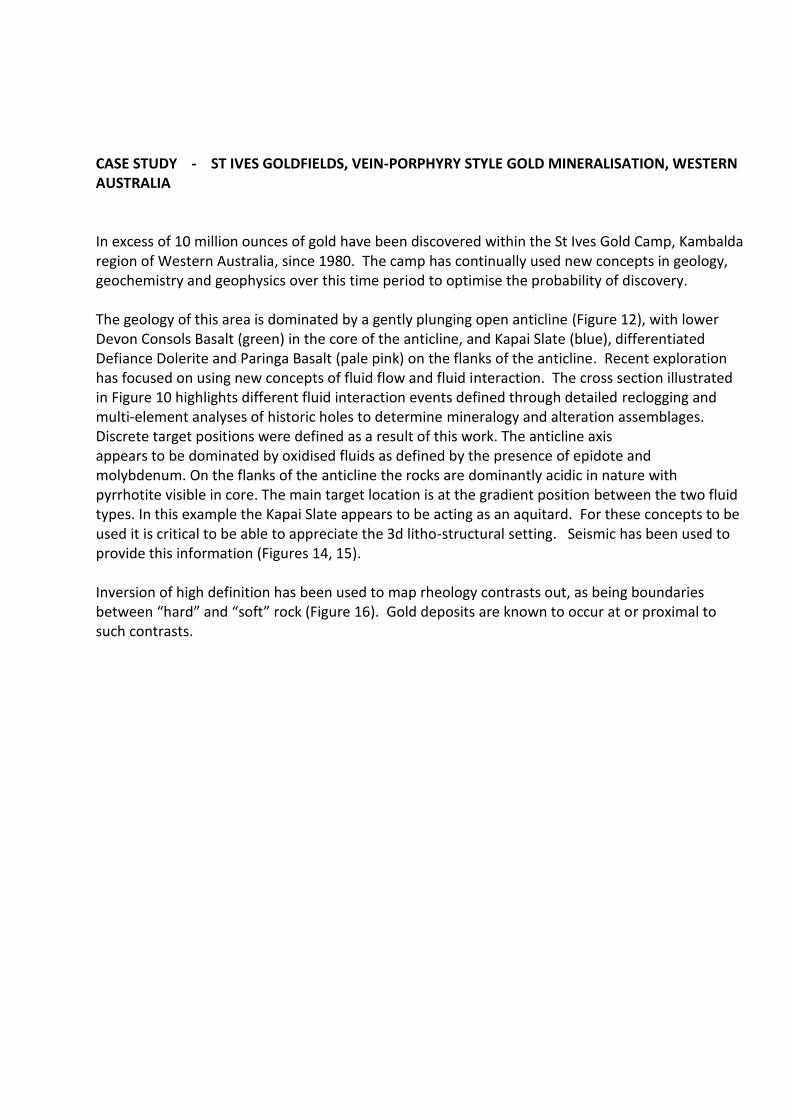
CASE STUDY - ST IVES GOLDFIELDS, VEIN-PORPHYRY STYLE GOLD MINERALISATION, WESTERN AUSTRALIA In excess of 10 million ounces of gold have been discovered within the St Ives Gold Camp, Kambalda region of Western Australia, since 1980. The camp has continually used new concepts in geology, geochemistry and geophysics over this time period to optimise the probability of discovery. The geology of this area is dominated by a gently plunging open anticline (Figure 12), with lower Devon Consols Basalt (green) in the core of the anticline, and Kapai Slate (blue), differentiated Defiance Dolerite and Paringa Basalt (pale pink) on the flanks of the anticline. Recent exploration has focused on using new concepts of fluid flow and fluid interaction. The cross section illustrated in Figure 10 highlights different fluid interaction events defined through detailed reclogging and multi-element analyses of historic holes to determine mineralogy and alteration assemblages. Discrete target positions were defined as a result of this work. The anticline axis appears to be dominated by oxidised fluids as defined by the presence of epidote and molybdenum. On the flanks of the anticline the rocks are dominantly acidic in nature with pyrrhotite visible in core. The main target location is at the gradient position between the two fluid types. In this example the Kapai Slate appears to be acting as an aquitard. For these concepts to be used it is critical to be able to appreciate the 3d litho-structural setting. Seismic has been used to provide this information (Figures 14, 15). Inversion of high definition has been used to map rheology contrasts out, as being boundaries between “hard” and “soft” rock (Figure 16). Gold deposits are known to occur at or proximal to such contrasts.
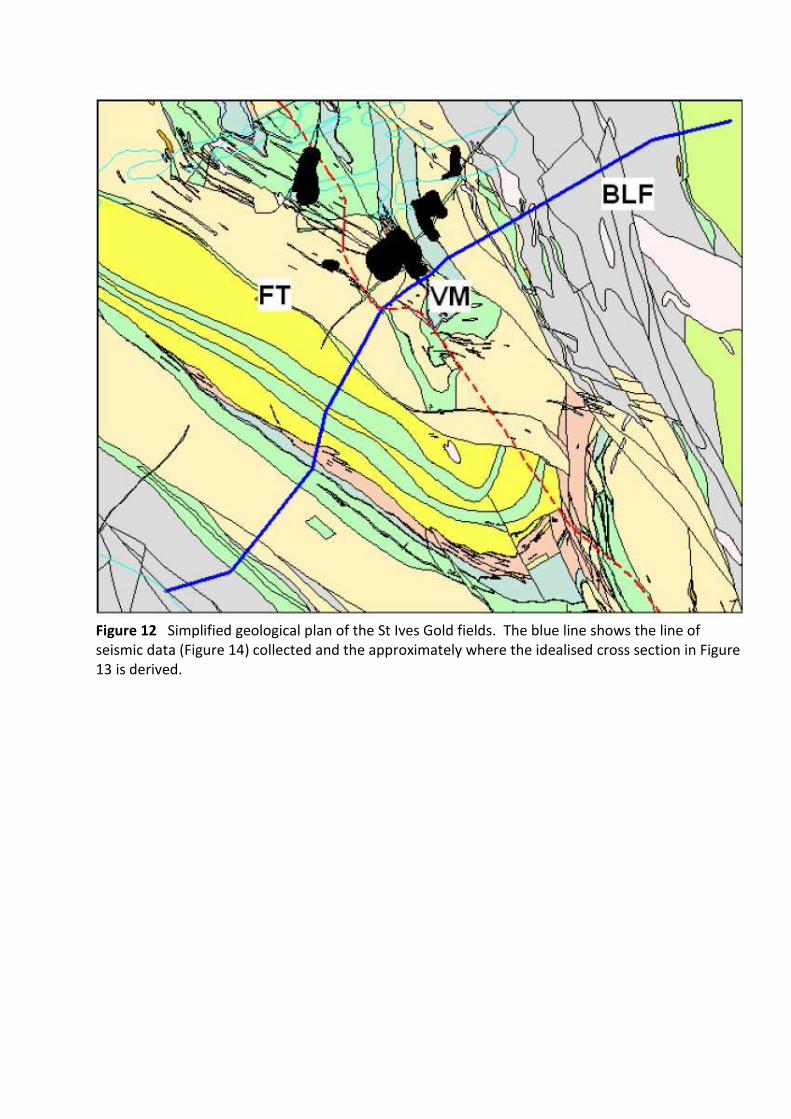
Figure 12 Simplified geological plan of the St Ives Gold fields. The blue line shows the line of seismic data (Figure 14) collected and the approximately where the idealised cross section in Figure 13 is derived.
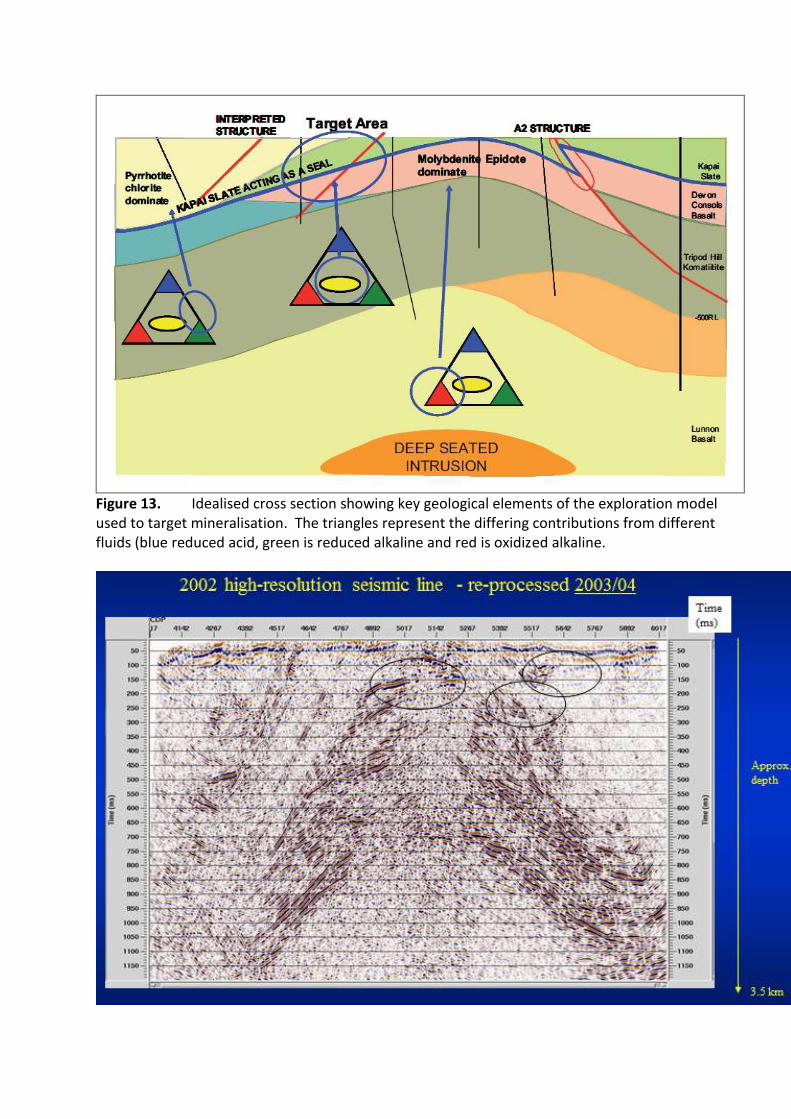
Figure 13. Idealised cross section showing key geological elements of the exploration model used to target mineralisation. The triangles represent the differing contributions from different fluids (blue reduced acid, green is reduced alkaline and red is oxidized alkaline.
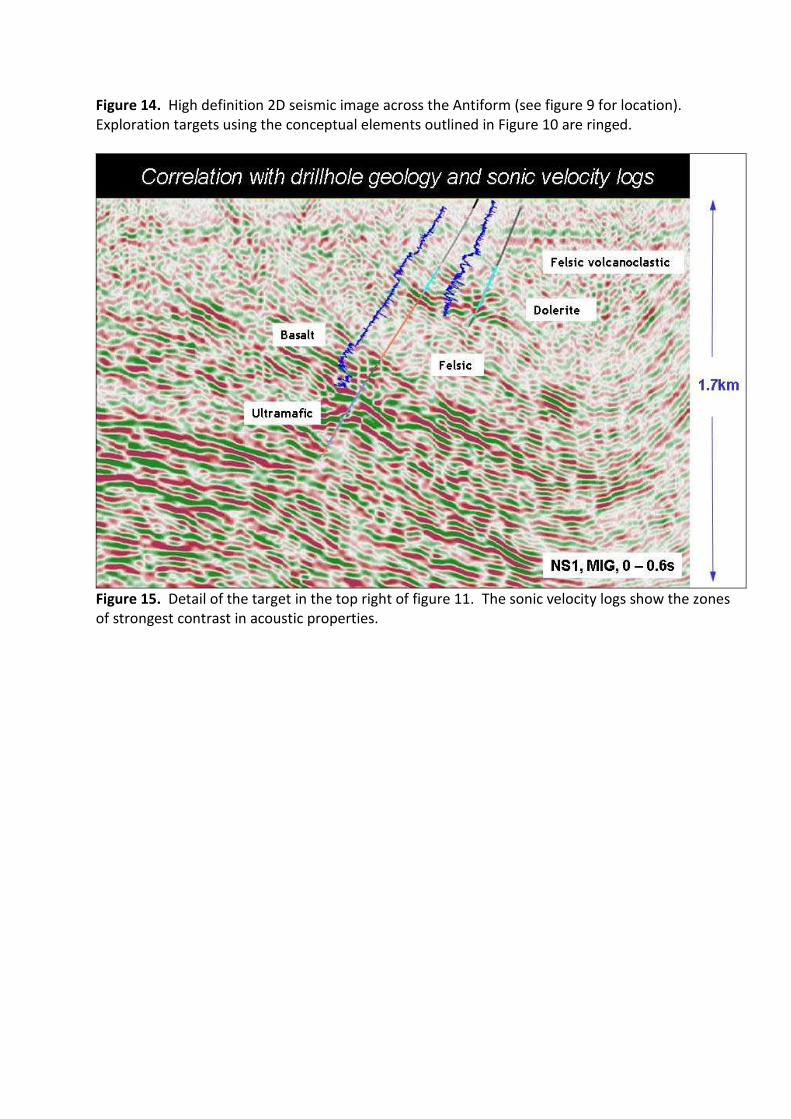
Figure 14. High definition 2D seismic image across the Antiform (see figure 9 for location). Exploration targets using the conceptual elements outlined in Figure 10 are ringed.
Figure 15. Detail of the target in the top right of figure 11. The sonic velocity logs show the zones of strongest contrast in acoustic properties.
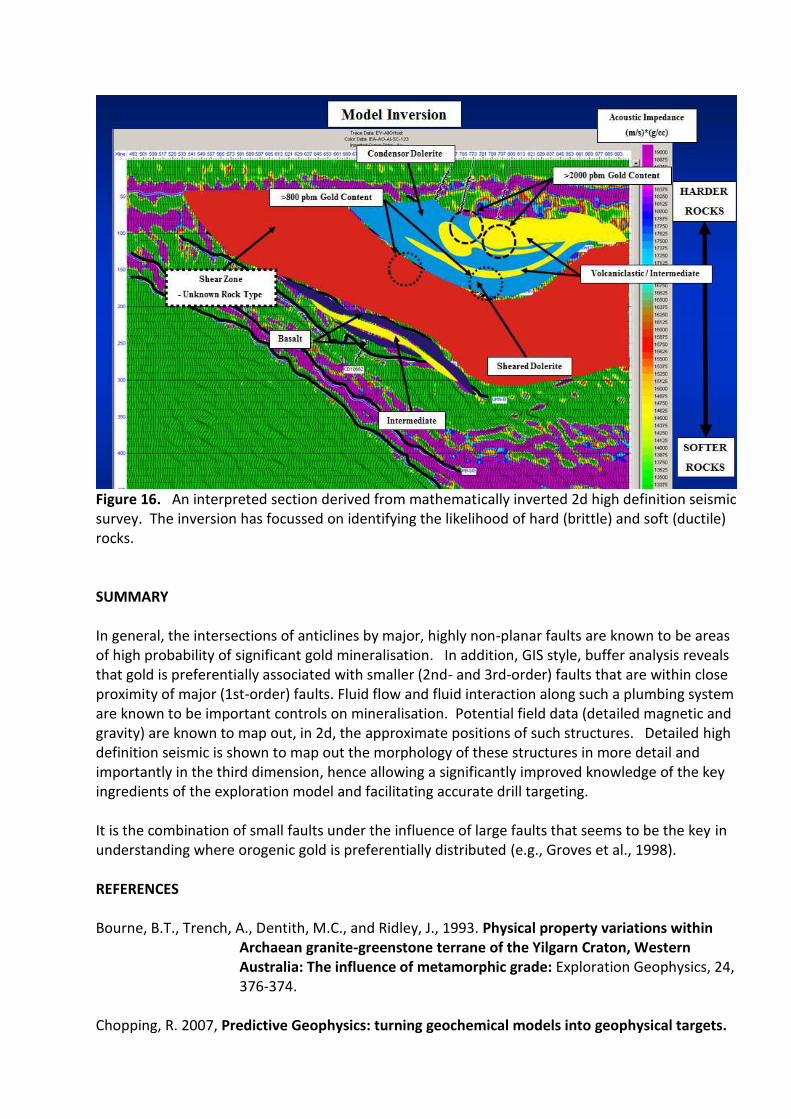
Figure 16. An interpreted section derived from mathematically inverted 2d high definition seismic survey. The inversion has focussed on identifying the likelihood of hard (brittle) and soft (ductile) rocks. SUMMARY In general, the intersections of anticlines by major, highly non-planar faults are known to be areas of high probability of significant gold mineralisation. In addition, GIS style, buffer analysis reveals that gold is preferentially associated with smaller (2nd- and 3rd-order) faults that are within close proximity of major (1st-order) faults. Fluid flow and fluid interaction along such a plumbing system are known to be important controls on mineralisation. Potential field data (detailed magnetic and gravity) are known to map out, in 2d, the approximate positions of such structures. Detailed high definition seismic is shown to map out the morphology of these structures in more detail and importantly in the third dimension, hence allowing a significantly improved knowledge of the key ingredients of the exploration model and facilitating accurate drill targeting. It is the combination of small faults under the influence of large faults that seems to be the key in understanding where orogenic gold is preferentially distributed (e.g., Groves et al., 1998). REFERENCES Bourne, B.T., Trench, A., Dentith, M.C., and Ridley, J., 1993. Physical property variations within
Archaean granite-greenstone terrane of the Yilgarn Craton, Western Australia: The influence of metamorphic grade: Exploration Geophysics, 24, 376-374.
Chopping, R. 2007, Predictive Geophysics: turning geochemical models into geophysical targets.

pmd*CRC Project Report: Project A3, pmd*CRC Melbourne, 63p. Chopping R, Cleverley J S, Herson P A and I G Roy, 2008, Reactive transport modes: from
geochemistry to geophysics to exploration targets, pmd*CRC Project Report: Project Y4, pmd*CRC Melbourne.
Goleby, B.R., Rattenbury, M.S., Swager, C.P., Drummond, B.J., Williams, P.R., Sheraton, J.E., and
Heinrich, C.A., 1993, Archaean crustal structure from seismic reflection profiling, Eastern Goldfields, Western Australia, AGSO Record, 1993/15, 54 pp.
Groves, D.I., Goldfarb, R.J., Gebre-Mariam, M., Hagemann, S.G., Robert, F., 1998, Orogenic gold deposits: A proposed classification in the context of their crustal
distribution and relationship to other gold deposit types: Ore Geology Reviews, 13, 7-27.
Miller J.McL. 2006, Linking structure and alteration in Laverton with specific reference to Sunrise Dam and Wallaby, Predictive Mineral Discovery Cooperative Research
Centre, Extended Abstracts from the April 2006 Conference, Perth, Geoscience Australia Record, 2006/07, p. 62-67.
Miller J McL., Blewett R, Tunjic J and K Conors, in press, The role of early formed structures on the development of the world class St Ives Goldfields, Yilgarn, Western
Australia, Journal of Precambrian Rsearch Nugus, M., Blenkinsop, T., McLellan, 2006. Creation of a world class Archaen lode deposit through
multiple reactivations of geological structures: the Sunrise Dam Gold Mine. The Australian Earth Sciences Convention 2006, Abstracts, 2-6 July 2006, Melbourne, Page 168.
Robert F, Brommecker, Bourne B T, Dobak P J, McEwan C J, Rowe R R and X Zhou, 2007, Models
and Exploration Methods for Major Gold Deposit Types, Proceedings of Exploration 07, Fifth Decennial International Conference of Mineral Exploration, ed B Mikeriet, p 691-711.
Stolz, N., Urosevic, M. & Connors, K. (2004). Reflection seismic surveys at St Ives Gold Mine, WA. 17th Geophysical Conference and Exhibition. Sydney, Australia, Australian
Society of Exploration Geophysicists.
Townsend J, Sampson L and B Bourne, 2010, Recent Advance sin in the Application of Geophysics for Gold Exploration in north-central Great Basin, Nevada; Geological
Survey of Nevada, vol .11, P 149-159 Williams, P K, 1997, Towards a Multidisciplinary Integrated Exploration Process for Gold
Discovery, Proceedings of Exploration 97: Fourth Decennial International Conference on Mineral Exploration” edited by A.G. Gubins, 1997, p. 1015–1028.
Williams, P.K., 1994, Relationships between magnetic anomalism and epigenetic gold

mineralisation in the Victory-Defiance area, Western Australia, in “Geophysical Signatures of Western Australian Mineral Deposits”, Geology and Geophysics Dept., and UWA ext., UWA, Publ. No.s 26, pp 283-295.
HiSeis Pty Ltd CAN 136507429 Suite 4, Enterprise Unit 3, 9 De Laeter Way, Bentley, WA, 6102 Australia Web Address: www.hiseis.com Email: [email protected] Cell: +61 422 593 601