seismic response of post-tensioned cross-laminated …
TRANSCRIPT

PROOF
ONLY
1
2 Seismic Response of Post-Tensioned Cross-Laminated3 Timber Rocking Wall Building1 s4 Alex W. Wilson1; Christopher J. Motter2; Adam R. Phillips3; and J. Daniel Dolan4
5 Abstract: Nonlinear time history analyses were conducted for 5-story and 12-story prototype buildings that used post-tensioned cross-6 laminated timber rocking walls coupled with U-shaped flexural plates (UFPs) as the lateral force resisting system. The building models7 were subjected to 22 far-field and 28 near-fault ground motions, with and without directivity effects, scaled to the3 design earthquake8 and maximum considered earthquake for Seattle, with Site Class D. The buildings were designed to performance objectives that limited9 structural damage to crushing at the wall toes and nonlinear deformation in the UFPs, while ensuring code-based interstory drift requirements
10 were satisfied and the post-tensioned rods remained linear. The walls of the 12-story building had a second rocking joint at midheight to11 reduce flexural demands in the lower stories and interstory drift in the upper stories. The interstory drift, in-plane wall shear and overturning12 moment, UFP deformation, and extent of wall toe crushing is summarized for each building. Near-fault ground motions with directivity effects13 resulted in the largest demands for the 5-story building, while the midheight rocking joint diminished the influence of ground motion directivity14 effects in the 12-story building. Results for both buildings confirmed that UFPs located higher from the base of the walls dissipated more energy15 compared to UFPs closer to the base. DOI: 10.1061/(ASCE)ST.1943-541X.0002673. © 2020 American Society of Civil Engineers.
16 Author keywords: Cross-laminated timber (CLT); Self-centering; Nonlinear response history analysis; Near-field earthquakes;17 Structural wall.
18 Introduction4
19 Structural5 walls are often used in buildings to resist lateral force20 demands from earthquake and wind loads. While the use of con-21 crete and steel structural systems is commonplace, the use of cross-22 laminated timber (CLT) walls may be a viable alternative. Although23 gravity load resisting CLT structural components are included in24 current US building codes and design standards, seismic lateral25 force resisting CLT systems are not. CLT originated in regions of26 central Europe where design-level seismic demands are generally27 less than in the western United States, where the design of lateral28 force resisting systems is often controlled by seismic loading. The29 US building codes allow for inelastic component behavior during30 seismic events, but require this behavior to be ductile and predict-31 ably concentrated at specific locations for control of building re-32 sponse. A self-centering post-tensioned (PT) CLT rocking wall33 lateral system is intended to minimize wall damage during seismic34 events (Pei et al. 2018). During rocking, inelastic deformation is35 limited to the wall toes and the hysteretic coupling devices that
36connect adjacent wall segments, while the PT rods provide a self-37centering restoring force to minimize residual drift.38In prescriptive, code-based building design, inelastic behavior is39typically accounted for by using elastic analysis and seismic re-40sponse factors specific to a lateral force resisting system. Seismic41response factors in ASCE 7 consist of the response modification42coefficient (R), overstrength factor (Ωo), and deflection amplifica-43tion (Cd) factors, which are intended to predict the inelastic re-44sponse of a system from the response of an elastic analysis (ASCE452017). To determine seismic response factors for new systems and46introduce them into the building code, a FEMA P-695 (ATC 2009)47study is typically conducted, but this process is resource-intensive48due to the extent of the nonlinear time-history analyses required.49Therefore, many newly developed structural systems, such as self-50centering PT CLT rocking walls, do not have established seismic51response factors.52As an alternative to code-based design, many jurisdictions in the53US allow performance-based seismic design (PBSD) using nonlin-54ear time history (NLTH) analysis. PBSD involves meeting perfor-55mance objectives based on acceptance criteria that are intended56to meet or exceed building code expectations. Seismic performance57objectives typically target behavior at the design earthquake (DE)58and maximum considered earthquake (MCER) event magnitudes,59where inelastic behavior is expected (PEER 2017). Performance60objectives and acceptance criteria are explicitly assessed through61NLTH analyses, where component behavior is typically modeled62using results from experimental testing. The results of NLTH analy-63sis are highly dependent on the dynamic characteristics of a struc-64ture, as well as the ground motions utilized for assessment (Chopra652012). Depending on the site location, the hazard may consist of66far-field and/or near-fault earthquakes. These two ground motion67types possess different velocity and acceleration trace characteris-68tics, leading to different building responses, which may result in69significantly different demands.70To implement PT CLT rocking wall systems in buildings located71in high seismic regions using PBSD, an understanding of dynamic
1Design Engineer, Magnusson Klemencic Associates, Seattle, WA98101; formerly, Graduate Research Assistant, Dept. of Civil and Environ-mental Engineering, Washington State Univ., Pullman, WA 99164.2 Email:[email protected]
2Assistant Professor, Dept. of Civil and Environmental Engineering,Washington State Univ., Pullman, WA 99164. Email: [email protected]
3Assistant Professor, Dept. of Civil and Environmental Engineering,Washington State Univ., Pullman, WA 99164. ORCID: https://orcid.org/0000-0003-2486-6039. Email: [email protected]
4Professor, Dept. of Civil and Environmental Engineering, WashingtonState Univ., Pullman, WA 99164 (corresponding author). Email: [email protected]
Note. This manuscript was submitted on August 9, 2019; approved onJanuary 25, 2020No Epub Date. Discussion period open until 0, 0;separate discussions must be submitted for individual papers. This paperis part of the Journal of Structural Engineering, © ASCE, ISSN0733-9445.
© ASCE 1 J. Struct. Eng.

PROOF
ONLY
72 and inelastic response under likely ground motion types is neces-73 sary. This paper presents the NLTH analysis and the resulting74 global and local responses of a 5- and 12-story PT CLT rocking75 wall prototype building designed to exhibit inelastic response at76 the wall toes and in the hysteretic damping devices when subjected77 to DE level events, with further inelastic response at MCER level78 events. To investigate the influence of ground motion type, a total79 of 50 records from the Pacific Earthquake Engineering Research80 (PEER) Center NGA-West 2 ground motion database (PEER81 2018), representative of both far-field and near-fault events, were82 utilized for NLTH analysis, with the records scaled to DE and83 MCER intensity levels for a representative high seismic accelera-84 tion region.
85 Background
86 Research on PT rocking walls was initially conducted for precast87 concrete walls (Priestley et al. 1999; Kurama et al. 1999a, b; Perez88 et al. 2013). Studies on the use of supplemental energy dissipation89 in PT precast concrete rocking walls included adjacent walls with90 energy dissipating connectors along the height (Nakaki et al.91 1999), walls connected to adjacent columns by energy dissipaters92 (Sritharan et al. 2015; Twigden et al. 2017), and mild steel bars con-93 necting the wall to the foundation to provide energy dissipation at94 the base (Kurama 2002; Holden et al. 2003; Restrepo and Rahman95 2007; Smith et al. 2011).6 Many of these concepts for PT precast96 concrete rocking walls were extended to PT LVL rocking walls97 (Sarti et al. 2016a, b, c) and PT CLT rocking walls (Ganey et al.98 2017; Akbas et al. 2017).99 PT CLT rocking walls, which were considered in this study, con-
100 sist of vertically oriented CLT panels with unbonded PT rods along101 their center lines. The force couple between the PT rods and com-102 pression at the wall toe provides resistance to the moment created103 by lateral loads at the base of the wall. The initial PT stress com-104 presses the wall panels, preventing rocking from occurring at the105 base until the overturning moment at the base exceeds the decom-106 pression moment. Once the decompression moment is exceeded,107 uplift occurs as the wall rocks about its toe. Rocking leads to an in-108 crease in rod stress due to elongation and may cause inelastic behav-109 ior in compression at the toe. The use of steel U-shaped flexural110 plates (UFPs) located between adjacent wall panels provides addi-111 tional strength and stiffness through coupling and provides enhanced112 energy dissipation through hysteretic damping (Baird et al. 2014).113 Ganey et al. (2017) tested eight full-scale rocking walls under114 quasi-static, reversed-cyclic lateral loading. The walls had different115 initial PT forces, boundary conditions, layups (i.e., arrangement116 of CLT layers), and/or the use of UFPs as coupling devices. It117 was evident from results that uncoupled walls exhibited low over-118 turning moment resistance and energy dissipation compared to119 walls coupled with UFPs. Subsequent shake table tests on a 2-story120 building with coupled PT CLT rocking walls were conducted by121 Pei et al (2018) to evaluate system performance under service level122 earthquake (SLE) (43-year return period), DE, and MCER earth-123 quake demands. At MCER, inelastic response was limited to wall124 toes and UFP coupling devices, while gravity and diaphragm com-125 ponents exhibited no damage and PT rods exhibited minimal stress126 losses.127 A mechanics-based analytical approach that does not require128 numerical modeling to predict the force-deformation response of129 a coupled CLT rocking wall system was developed by Jin et al.130 (2019). The backbone curve of the CLT rocking wall system131 derived using the analytical methods developed by Jin et al.132 (2019) compared well to those computed using nonlinear finite
133element models developed in the program SAP2000 (CSI 2010).134The extent of plasticity at the base of the wall is not assessed in135this approach. Numerical models for PT CLT rocking walls were136developed by Ganey (2015) and Kovacs and Wiebe (2017) in the137structural analysis program OpenSees 7(Mazzoni et al. 2006). These138models consist of distributed springs, characterized with an ideal-139ized, bilinear, elastic-plastic behavior of CLT in compression at the140base of the wall panel that capture the spread of plasticity along the141base of the wall. Ganey (2015) and Kovacs and Wiebe (2017) com-142pared their model results to test results from Ganey (2015) and Sarti143et al (2016a), respectively. Wilson et al. (2019) formulated finite144element models using SAP2000 (CSI 2010) that enabled determi-145nation of the horizontal spread of plasticity along the base of the146wall in addition to the vertical spread of plasticity up the height of147the wall. To address the lack of computational efficiency in using148the finite element model for NLTH analysis, Wilson et al. (2019)149provided a procedure to formulate a lumped plasticity model for a150wall, based on results from a pushover analysis of the more-refined151finite element model. Results from both the finite element and152lumped plasticity models matched reasonably well with experimen-153tal results from Ganey et al. (2017). The lumped plasticity model is154computationally efficient for NLTH analysis and was used in this155study for NLTH analysis.156NLTH analysis investigations of PT CLT rocking wall buildings157have been conducted on midrise, two-dimensional (2D) building158models in OpenSees (Mazzoni et al. 2006) by Ganey (2015) and159Kovacs and Wiebe (2017) using the distributed spring models pre-160viously described. Utilizing a symmetrical, rectangular building161layout, Ganey (2015) considered 8-story and 14-story buildings162subjected to far-field ground motions scaled to represent SLE,163DE, and MCER intensity levels in regions with high seismic accel-164erations under stiff soil conditions (Site Class D). Single rocking165stories were considered at different building elevations, while the166remaining stories utilized CLT walls with hold-down anchorages.167Kovacs and Wiebe (2017) investigated the response of a symmet-168rical, square, 6-story PT CLT rocking wall building with synthetic169far-field and near-fault ground motions representative of low-to-170moderate seismic accelerations in regions with very dense soil171(Site Class C). Walls were located around the exterior and central172core of the building, and the estimated fundamental period was1731.8 s. Both of these studies focused on midrise building(s) without174inclusion of high acceleration, near-fault ground motions. The fo-175cus of this paper is a three-dimensional (3D) NLTH analysis of both176a 5-story and 12-story prototype building assumed to be located in177Seattle, Washington, on a Site Class D location, with the use of both178far-field and near-fault ground motions scaled to DE and MCER179intensity levels.
180Building Design
181This section presents the design methodology for the two prototype182buildings used in this study, while the following section describes183their final design and dynamic characteristics. The low-rise build-184ing, shown in Fig. 1(a), was a 5-story office building with a total185height of 19.8 m and a floor-to-floor height of 4 m, while the mid-186rise building, shown in Fig. 1(b) was a 12-story residential building187with a total height of 45.7 m, and a floor-to-floor height of 3.8 m.188The low-rise building had six and four rocking wall lines in the189North-South (N-S) and East-West (E-W) directions, respectively.190The midrise building had eight wall lines in both directions. Each191wall line consisted of three wall segments coupled with UFPs. Two192UFPs were placed between two wall segments on a given floor,193resulting in four UFPs on a given wall line for a single floor, as
© ASCE 2 J. Struct. Eng.

PROOF
ONLY
194 indicated in Fig. 3. More walls were used in the taller building to195 satisfy the strength and drift demands. Gravity loading was not196 transferred to the walls and was carried8 solely by an independent197 glued-laminated timber (GLT or glulams) framing system. The two198 buildings were classified as Risk Category II (ICC 2018) and were199 assumed to be located at an arbitrary site in Seattle, with Site Class200 D soil conditions. It was assumed that foundations, collectors, and201 diaphragm-to-wall connections remained elastic under all demand202 levels. CLT diaphragm panels were assumed to remain elastic, with203 panel-to-panel connections within the diaphragm assumed to be204 rigid9 against deformation.205 Preliminary gravity design was conducted to approximate206 member sizes and estimate building weight. It was assumed all207 elements were simply supported and beam elements were fully208 braced against lateral torsional buckling. Superimposed dead loads209 were assumed, while live and snow loads were determined in accor-210 dance with ASCE 7-16 (ASCE 2017). Utilizing the gravity loads211 in Table 1 and the Load and Resistance Factor Design (LRFD)
212methodology, the governing member sizes of the floor system213and their associated material specifications, provided in Table 2,214were determined using E-1.8E class glulams and following the de-215sign procedures provided by the American Wood Council (AWC)216(2017), which are similar, if not identical, in how beam and217diaphragm theory is applied in the design standards in most coun-218tries around the world. Diaphragms and walls were designed to219remain elastic, with stiffness methods being used to distribute the220loads to the walls. The mechanical properties used for design are221provided in Tables 2 and 5.222Wind loads were computed in accordance with the directional223procedure in ASCE 7-16 (ASCE 2017) using a wind speed (V) of22497 mph 11for Seattle, directionality factor (Kd) of 0.85, exposure cat-225egory of B, topographic factor (Kzt) of 1.0, gust effect factor (G) of2260.85, and enclosed building envelope. The computed maximum227over turning moment at the base due to wind loading in the N-S228and E-W directions was 8,532 and 4,180 kN · m, respectively,229for the low-rise building and 75,050 and 28,000 kN · m, respec-230tively, for the midrise building. An initial PT force, provided in231Table 3, was selected so that the decompression moment of the232walls was greater than the wind load overturning moment, keeping233the system response linear elastic under the design wind demand.234All UFPs remained elastic under all load levels up to the decom-235pression state, and this was checked with pushover analysis.236Seismic performance objectives for both buildings were estab-237lished for DE and MCER intensity levels. With the exception of the238UFPs and wall toes, all components were designed to remain elastic239at both intensity levels. All wall toes at ground level and UFPs240throughout the building were designed to exhibit inelastic response241at DE intensities. These performance objectives are consistent with242those assumed by Ganey (2015), except for the allowance of wall243toe crushing at DE level events to increase energy dissipation.244Lateral demands were estimated for both buildings using the245response spectrum parameters presented in Table 4 in conjunction246with the equivalent lateral force (ELF) procedure in ASCE 7-16247(ASCE 2017). To conduct the initial ELF procedure to estimate248the required size and number of walls, a value for R of six was249assumed for PT CLT rocking walls, which was consistent with the250value assumed by Ganey (2015) for PT CLT rocking walls and251lower than the value of seven recommended by Sarti et al. (2017)252for PT LVL rocking walls. Low- and midrise building weights were253estimated to be approximately 19,260 and 65,830 kN, respectively.
1 2 3 4 5 6
A
B
C
D
E
F
27.5
m
51.1 m
7.3 m 10.3 m 15.9 m 10.3 m 7.3 m
9.5
m9.
5 m
8.5m
2.5
m
CLT Rocking Wall Line Comprising Three Coupled WallsN
STAIRSELEVATORS
A
B
C
D
1 2 3 4 5 6 7 8 9 10
27 m
66 m
8.25 m
TYP.
11.5
m11
.5 m
4 m
STAIRS
STAIRS
ELEVATORS
(a) (b)
F1:1 Fig. 1. Floor plan for: (a) low-rise building; and (b) midrise building.
-150 -100 -50 0 50 100 150Displacement (mm)
-150
-100
-50
0
50
100
150
)Nk( ecro
F
102 mm
280 mm
12.5 mm
F2:1 Fig. 2.UFP dimensions (not to scale) and associated Ramberg-OsgoodF2:2 computed backbone curve.
© ASCE 3 J. Struct. Eng.

PROOF
ONLY
254 The computed base shear and overturning moment demands for the255 low-rise building were 2,896 kN and 39,996 kN · m, respectively,256 while demands for the midrise building were 5,235 kN and257 164,415 kN · m, respectively.258 Thick, 9-ply CLT wall panels were utilized in the buildings to259 ensure an elastic in-plane shear and flexural response was exhibited260 above the toe crushing region of the wall at DE and MCER inten-261 sities. PT rods were designed to remain elastic up to a first story
262drift magnitude of 5%, which is larger than ASCE 7-16 code263acceptable DE and MCER drift magnitudes of 2% and 4%, respec-264tively. The toe crushing resistance of the wall panels was deter-265mined using expected material properties, rather than allowable266properties. UFPs were designed with a low yield displacement267and force, relative to possible UFP configurations (Baird et al.2682014), to ensure all UFPs throughout the building yielded at DE269and MCER intensities.270The design procedure used to determine the lateral system271parameters of both buildings presented in Table 4 is summarized272in the remainder of this section. The shear resistance of the lateral273system was determined using the cumulative, allowable in-plane274shear strength (341.8 kN=m) of all CLT wall panels, and deter-275mined based on values provided in Structurlam (2016). The inelas-276tic overturning moment resistance was 12determined using the277equation from Ganey (2015)
M ¼Xnw1
ðT þWÞdþXnufp1
VUFPLW ð1Þ
278where M is the total inelastic overturning moment resistance of the279system, considering all walls in a given orthogonal direction at a280given rocking interface (nw) subjected to a prescribed rotation at the281base, T is the tension force exhibited by the PT rods, W is the self-282weight of the wall panels, d is the couple arm between T and the
PIN RESTRAINT
GIRDER FRAME ELEMENT
ROTATIONAL LINK
UFP LINK ELEMENTS
RIGID OFFSET
WALL FRAME ELEMENT
COLUMN FRAME ELEMENT
F3:1 Fig. 3. Elevation profile of low-rise building.
Table 1. Gravity loads for low-rise building and midrise building
T1:1 Loading Location Building Object/value
T1:2 Dead loads Roof LRa MEP/Misc.: 0.5 kPaT1:3 MR MEP/Misc.: 1.0 kPaT1:4 Floors LR, MR MEP/Misc.: 1.0 kPaT1:5 Exterior LR, MR Cladding: 0.75 kPa
T1:6 Live loads Roof LR, MR Live Roof: 1.0 kPaT1:7 Floors LR Offices: 2.4 kPaT1:8 MR Residential: 1.9 kPaT1:9 LR, MR Lobby: 4.8 kPa
T1:10 Snow loads Roof LR, MR 1.2 kPa (min)a
Note: LR = low-rise building; and MR = midrise building.aMinimum snow load for city of Seattle.
Table 2. Material specifications and sizes of gravity system elements
T2:1 Building Component Material description Size/description
T2:2 Low-rise Floor panels SPF, No.2 and Btr., V2M1.1a 5-Ply (175-mm depth)T2:3 Beams DFL, 24F-1.8E 310 × 488 mmT2:4 Girders DFL, 24F-1.8E 310 × 712 mmT2:5 Columns DFL, V3 310 × 338 mm
T2:6 Midrise Floor panels SPF, No. 2 and Btr., V2M1.1a 5-Ply (175-mm depth)T2:7 Beams DFL, 24F-1.8E 310 × 450 mmT2:8 Girders DFL, 24F-1.8E 310 × 875 mmT2:9 Columns (stories 1–4) DFL, V4 310 × 525 mm
T2:10 Columns (stories 5–8) DFL, V4 310 × 375 mmT2:11 Columns (stories 9–12) DFL, V4 225 × 300 mm
Note: SPF = spruce-pine-fir; and DFL = Douglas-fir-larch.aLayup classification corresponding to Structurlam (2016).
© ASCE 4 J. Struct. Eng.

PROOF
ONLY
283 resultant compression force at the toe, nufp is the number of UFPs284 utilized within the system, VUFP is the shear resistance of a UFP,285 and Lw is the length of a wall panel. The dead load does not affect286 the overturning calculation because the connection to transfer the287 lateral loads to the walls is slotted to eliminate any gravity loads288 being transferred to the walls. The gravity loads are resisted289 by an independent beam-column structural system. The cross-290 sectional analysis procedure, modified by and explained in Ganey291 (2015) for PT CLT rocking walls, was used to determine T and d.292 The shear resistance of a single UFP was computed using the equa-293 tion from Baird et al. (2014)
Fy ¼fybut2u2Du
ð2Þ
294 where Fy is the effective yield force of the UFP, fy is the yield295 strength of the steel, bu is the width of the UFP, tu is the thickness296 of the UFP, and Du is the inner diameter of the UFP. The following297 equations from Baird et al. (2014) were used to determine the298 backbone curve of the UFPs:
δ ¼ Fk0
�1þ
�FFy
�r−1�
ð3Þ
k0 ¼16Ebu27π
�tuDu
�3
ð4Þ
r ¼ 7.1ln
�tuDu
�þ 29.5 ð5Þ
299 where δ is the UFP displacement; F is the corresponding force, k0 is300 the initial stiffness of the UFP, and r is the Ramberg-Osgood factor.301 Baird et al. (2014) showed that Eqs. (3)–(5) accurately predict the302 backbone curve of various UFP designs. By iterating for F in303 Eq. (3), the backbone relationship of the UFP used in the buildings
304with bu, tu, and Du dimensions of 279.4, 12.7, and 101.6 mm, re-305spectively, were determined, as illustrated in Fig. 2.306A sufficient number of walls and UFPs were incorporated into307both buildings to meet seismic strength demands. Additional UFPs308were incorporated to stiffen the system and ensure code acceptable309interstory drift magnitudes that did not exceed 2% and 4% for DE310and MCER level events, respectively.311Due to the low flexural stiffness of the PT CLT system, the use312of a single rocking joint at the base of the wall was not sufficient for313the midrise building because the interstory drifts at upper stories314exceeded code acceptable levels. Therefore, a second rocking joint315was incorporated at Level 7 (50% of building height) to reduce316wall flexural demands in the lower stories, resulting in smaller317upper floor displacements to meet interstory drift requirements.318Several previous studies have investigated segmented structural319systems using rocking walls or seismic isolation to reduce flexural320demands along the height of the building and to better account for321higher mode effects on structural response (Chey et al. 2010;322Panagiotou and Restrepo 2009; Wiebe et al. 2013a, b). Particularly323relevant to this study are prior computational studies (Wiebe and324Christopoulos 2010; Li et al. 2017) that investigated the effect325and optimal location of second rocking joints, which were found326to decrease the higher mode effects, reduce interstory drifts, and327reduce flexural demand along the height of the structure. Li et al.328(2017) determined that the optimum location of a second rocking329joint was between 22% and 53% of the height using three prototype330buildings (9-, 20-, and 30-story) and a suite of 20 ground motions.331Wiebe and Christopoulos (2010) concluded that the maximum332flexural demand on the system decreased significantly when a sec-333ond rocking joint was implemented within the lower half of the334building. The authors are not aware of any published studies on335the behavior of segmented PT CLT rocking walls with a second336rocking joint.
337Building Model Characterization
338Building models, constructed in SAP2000 (CSI 2010), included339both the lateral and gravity system, as shown in Fig. 3, to accurately340distribute building mass and capture torsional building response.341Elastic frame elements were used for gravity components and were342characterized with the material properties and section characteris-343tics specified in Table 2. Elastic shell elements, capable of captur-344ing shear deformation, were utilized for the CLT diaphragms345and were characterized with the material properties in Table 2.346Shell elements were rigidly connected, constrained to their adjacent347girder elements, and made rigid out-of-plane to avoid undesirable348modes and the need for supporting beams within the model.349Coupled rocking walls utilized the reduced-order modeling ap-350proach described in Wilson et al. (2019), with the system param-351eters and material properties in Tables 4 and 5, respectively, as well352as the UFP backbone curve shown in Fig. 2 for the inelastic shear353link with a kinematic hardening relationship. Each wall element354was connected to the diaphragms through an elastic shear link355element that transferred lateral loads.356The midheight rocking joint at Level 7 of the midrise building357was modeled as shown in Fig. 4. A rigid frame element rested on358two vertical restraints that allowed horizontal translation and rota-359tion about all three axes. Shear continuity between wall elements360above and below the joint was provided with a shear link element,361while moment demands from the reduced-order model springs362were directly transferred into the rigid girder, resulting in no363moment transfer across the joint.
Table 3. Lateral system parameters for low-rise building and midrisebuilding
T3:1 Parameter Low-rise building Midrise building
T3:2 Wall segment length (m) 2.75 (N-S), 3 (E-W) 3 (N-S, E-W)T3:3 Wall thickness (mm) 315 (9-ply) 315 (9-ply)T3:4 Initial PT force (kN) 530 1,800T3:5 PT bar diameter (mm) 45 45T3:6 Number of PT rods per panel 4 4T3:7 Total number of wall segments 18 (N-S), 12 (E-W) 24 (N-S, E-W)T3:8 Total number of UFPs 120 (N-S), 80 (E-W) 768 (N-S, E-W)
Table 4. Response spectrum parameters
T4:1 Design parameter Parameter value
T4:2 Building location Latitude: 47.622°T4:3 Longitude: −122.336°T4:4 Importance factor (Ie) 1.0T4:5 Mapped spectral Ss: 1.374 gT4:6 Response parameters S1: 0.478 gT4:7 Site class DT4:8 Design spectral SDS: 1.099 gT4:9 Acceleration parameters SD1: 0.581 g
T4:10 Seismic design category D
© ASCE 5 J. Struct. Eng.

PROOF
ONLY
364 Member self-weight, superimposed dead (including that of the365 unincorporated interior beams) and live loads on the diaphragms,366 and cladding line dead loads along the perimeter framing were367 included in the model, with the values used provided in Table 1.368 NLTH analysis included the total dead load and 20% of the live369 load, consistent with ASCE 7-16 (ASCE 2017). For near-fault mo-370 tions, fault-perpendicular orientation was assumed to run parallel371 with the N-S direction of each building. A proportional mass372 and stiffness damping value of 1% of critical was applied to the373 building modes that contributed a total of at least 90% modal mass374 participation in each principle building direction, which were the375 first five and six modes determined from eigenvalue analysis for the376 low- and midrise building, respectively. The modal mass participa-377 tion and period for each of these modes is provided in Table 6.378 Newmark time-stepping integration with constant acceleration379 parameters was utilized for all time-history analyses.
380Nonlinear Time-History Analysis Evaluation
381Ground Motions
382All far-field (FF), near-fault with no pulse (NFNP), and near-fault383with pulse (NFP) ground motions used were described in FEMA384P-695 (ATC 2009) and were obtained from the PEER NGA-West 2385ground motion database. Response spectra for each ground motion386were developed in accordance with ASCE 7-16 (ASCE 2017) for3875% damping. All ground motions of a specific type were scaled to388DE and MCER in accordance with the amplitude scaling procedure389described in Chapter 16 of ASCE 7-16, which specifies scaling390over a range of period values. The mean, scaled, maximum direc-391tion response spectrum for each ground motion type is illustrated in392Fig. 5 for both buildings. Using the analysis results, both buildings393were assessed with respect to wall shear and moment resistance,394interstory drift, crushing at the wall toes, and the vertical deforma-395tion of the UFPs.
396Low-Rise Building Analysis Results
397The maximum in-plane shear resistance exhibited at MCER in the398North-South (N-S) (fault-perpendicular) and East-West (E-W)399(fault-parallel) direction was 454 and 543 kN, respectively.400These values are well below the allowable in-plane shear strength401of 939 and 1,041 kN for the 2.75-m and 3-m wall lengths, respec-402tively, determined based on the strength per unit length of403341.84 kN=m provided by Structurlam (2016). The mean peak404in-plane flexural demands on the rocking wall panels for all ground405motion types at DE and MCER level events are provided in406Figs. 6(a and b) for the N-S and E-W directions, respectively. At407the base of the wall panels, NFP ground motions produced the408highest flexural demands of 1,479 and 2,011 kN · m for DE409and MCER level events, respectively. Above the base in the N-S410direction, FF ground motions resulted in the largest flexural
Table 5. Material characteristics for10 high-order and reduced-order models
T5:1 Material CLT PT Rod UFP
T5:2 Property E1 (MPa) E2 (MPa) E3 (MPa) G1 (MPa) G2 (MPa) G3 (MPa) ν1;2;3 fy (MPa) E (MPa) fy (MPa) fy (MPa)
T5:3 Value 4,215 5,270 937 219 173 443 0.3 37 200,000 882 413
SHEAR LINK ELEMENT
ROTATIONAL LINKELEMENT
STIFF GIRDERFRAME ELEMENT
WALL FRAME ELEMENT
SECOND ROCKINGINTERFACE SUPPORT
WALL FRAME ELEMENT
F4:1 Fig. 4. Midheight rocking joint modeling schematic.
Table 6. Modes summing to at least 90% modal mass participation forlow-rise building and midrise building
T6:1 Building Mode Period (s)Mass
participation (%) Description
T6:2 Low-rise 1 1.06 84 E-W translation mode 1T6:3 2 0.94 82 N-S translation mode 1T6:4 3 0.92 2 Torsion mode 1T6:5 4 0.3 9 E-W translation mode 2T6:6 5 0.27 8 N-S translation mode 2
T6:7 Midrise 1 3.36 2 Torsion mode 1T6:8 2 2.14 86 E-W translation mode 1T6:9 3 2.13 86 N-S translation mode 1
T6:10 4 1.06 2 Torsion mode 2T6:11 5 0.68 6 N-S translation mode 2T6:12 6 0.67 6 E-W translation mode 2
© ASCE 6 J. Struct. Eng.
PROOF
ONLY
411 demands. In the E-W direction, FF and NFNP ground motions pro-412 duced similar results at both intensity levels, with a maximum mo-413 ment of 1,613 kN ·m at the base and 2,164 kN ·m at Level 3 for DE414 and MCER level events, respectively. By utilizing the allowable415 design values in Structurlam (2016), the in-plane flexural strength416 of the 2.75-m and 3-m wall panel was computed to be 3,808 and417 4,701 kN ·m, respectively, which exceeded the demands illustrated418 in Fig. 6, indicating an elastic flexural response of the wall panels419 (excluding nonlinearity at the toe).420 The mean peak interstory drift demands for DE and MCER level421 events in the N-S and E-W direction for the low-rise building are422 illustrated in Figs. 7(a and b), respectively. The interstory drift was423 computed in accordance with ASCE 7-16 (ASCE 2017) using no-424 des located at the building corners on each floor. Ground motion425 types scaled to a specific intensity level (DE or MCER) in the E-W426 direction exhibited more consistent behavior between one another427 relative to the N-S direction. NFP ground motions acting in the N-S428 direction resulted in the largest interstory drift magnitudes of 1.17%429 and 1.95% at DE and MCER level events, respectively. Since the
430fundamental period of the low-rise building fell within the velocity-431sensitive range of the target spectrum, it was expected that NFP432ground motions would produce the highest interstory drifts in433the direction subjected to the characteristic velocity pulse. Consid-434ering both principle directions, the maximum interstory drifts435exhibited at DE and MCER level events were well below the ASCE4367-16 (ASCE 2017) drift limits of 2% and 4%, respectively, indicat-437ing code compliance with respect to drift.438The high-order wall model described by Wilson et al. (2019),439which considered elastic-perfectly plastic behavior of CLT in com-440pression, was used to determine the amount of inelastic (damaged)441area at the toe of the CLT rocking walls. This was accomplished by442subjecting the high-order model to a lateral displacement equal to443that of the reduced-order model used in the NLTH analyses. The444damaged material at the wall corners formed roughly a rectangle445with mean peak width (b) and height (h) provided in Table 7.446For both DE and MCER level events, NFP ground motions pro-447duced the highest inelastic response at the toe in the N-S direction448with an approximated peak in elastic width and height of 40 and
(a)0 1 2 3 4 5
Period (s)
0
0.5
1
1.5
2
2.5
3
SA
(g)
Target SpectrumFF MotionsNFNP MotionsNFP Motions
0 1 2 3 4 5
Period (s)
0
0.5
1
1.5
2
2.5
3
)g( A
S
Target SpectrumFF MotionsNFNP MotionsNFP Motions
(b)
Fundamental Building Period
Fundamental Building Period
F5:1 Fig. 5. Scaled ground motion mean spectra and target spectrum for: (a) low-rise building; and (b) midrise building.
0 500 1000 1500 2000
Mean Peak Wall Moment (kN-m)
L1
L2
L3
L4
L5
Roof
Level
D-FFD-NFNPD-NFPM-FFM-NFNPM-NFP
N-S
0 500 1000 1500 2000
Mean Peak Wall Moment (kN-m)
L1
L2
L3
L4
L5
Roof
Level
D-FFD-NFNPD-NFPM-FFM-NFNPM-NFP
E-W
(a) (b)
F6:1 Fig. 6. Low-rise building mean peak wall moment response for all ground motion types scaled to DE and MCER level intensities in: (a) North-SouthF6:2 (N-S); and (b) East-West (E-W) direction.
© ASCE 7 J. Struct. Eng.

PROOF
ONLY
449 60 mm, respectively, considering all ground motions. In the E-W450 direction, NFNP and NFP ground motions produced the maximum451 in elastic response for DE and MCER level events, respectively.452 Since crushing at the toes is directly related to the moment demand453 at the base, peak crushing deformation in both directions occurred454 for the ground motion that created peak moment demand at the base
455of the wall panels. All ground motion types resulted in inelastic456behavior at the base for DE level events, with greater inelastic457strains and volumes for the MCER level events, consistent with458the performance objectives of this study.459The mean peak vertical deformations exhibited by the UFPs460(Dx) normalized to the yield displacement of the UFPs (Dy) for461both DE and MCER level events are shown for the N-S and462E-W direction in Figs. 8(a and b), respectively. UFPs located higher463from the base of the wall experience larger deformation demand464than those closer to the base of the wall in both directions for465all ground motion types. Since all wall panels were continuous,466i.e., without rocking joints, between floors in the low-rise building,467the wall rotation increased with building height, imposing higher468UFP deformation demand at the upper stories. Furthermore, the469displacement demands imposed on all UFPs were well beyond470yield displacement at DE level events and more so at MCER level471events, consistent with the desired behavior outlined in the perfor-472mance objectives.
0 0.5 1 1.5 2
Mean Peak Inter-Story Drift (%)
S1
S2
S3
S4
S5
Story
DE-FFDE-NFNPDE-NFPMCE-FFMCE-NFNPMCE-NFP
0 0.5 1 1.5 2
Mean Peak Inter-Story Drift (%)
S1
S2
S3
S4
S5
Story
DE-FFDE-NFNPDE-NFPMCE-FFMCE-NFNPMCE-NFP
N-S E-W
(a) (b)
F7:1 Fig. 7. Low-rise building mean peak interstory drift response for all ground motion types scaled to DE andMCER level intensities in: (a) North-SouthF7:2 (N-S); and (b) East-West (E-W) direction.
Table 7. Damaged wall toe dimensions for low-rise13 building
T7:1 N-S E-W
T7:2 FF NFNP NFP FF NFNP NFP
T7:3 Design level (DE) earthquakeT7:4 b (mm) 30 20 40 25 40 30T7:5 h (mm) 40 30 60 35 70 50
T7:6 Maximum considered earthquake (MCER)T7:7 b (mm) 70 45 80 70 80 85T7:8 h (mm) 100 70 140 90 110 135
0 2 4 6 8 10
UFP DX
/ DY
(mm/mm)
L1
L2
L3
L4
L5
Roof
Level
D-FFD-NFNPD-NFPM-FFM-NFNPM-NFP
N-S
0 2 4 6 8 10
UFP DX
/ DY
(mm/mm)
L1
L2
L3
L4
L5
Roof
Level
D-FFD-NFNPD-NFPM-FFM-NFNPM-NFP
E-W
(a) (b)
F8:1 Fig. 8. Low-rise building mean peak UFP deformation response for all ground motion types scaled to DE and MCER level intensities in:F8:2 (a) North-South (N-S); and (b) East-West (E-W) direction.
© ASCE 8 J. Struct. Eng.
PROOF
ONLY
473 Midrise Building Analysis Results
474 The maximum in-plane shear demands exhibited by the midrise475 building for MCER level events in the North-South (N-S) and476 East-West (E-W) directions were 603 and 614 kN, respectively.477 These values were well below the allowable in-plane shear strength478 of 1,041 kN determined based on unit strength values provided by479 Structurlam (2016), indicating an elastic shear response of the wall480 segments in both directions. The mean peak in-plane flexural481 demands exhibited at DE and MCER level events are shown in482 Figs. 9(a and b) in the N-S and E-W direction, respectively. The483 trends in the data in Fig. 9 suggest that the midheight rocking joint484 reduces flexural demands exhibited by walls at both rocking joints.485 In the N-S direction, near-fault with pulse (NFP) ground motions486 resulted in the highest flexural demands at the base rocking joint,487 while far-field (FF) and near-fault with no pulse (NFNP) resulted in488 larger flexural demand sat the midheight rocking joint. Flexural489 demands in walls above the midheight rocking joint were less490 sensitive to NFP ground motions than FF and NFNP ground mo-491 tions. For MCER level events, the maximum in-plane flexural de-492 mands exhibited at the base rocking joint in the N-S and E-W
493directions were 3,857 and 3,610 kN · m, respectively, while walls494attached to the midheight rocking joint exhibited demands of4952,263 and 2,400 kN · m, respectively. The results obtained from496this study are similar to results reported by Wiebe and Christopou-497los (2009 14) in that the implementation of the second rocking joint498reduced the moment demand on walls above and below the second499rocking joint. All demands were well below the allowable in-plane500flexural strength of 4,701 kN · m provided by Structurlam501(2016), indicating an elastic flexural response (with the exception502of the toe).503The mean peak interstory drift demands for the midrise building504at both DE andMCER level events in the N-S and E-W direction are505provided in Figs. 10(a and b), respectively. The interstory drift506demands in stories above the midheight rocking joint were signifi-507cantly lower than the stories below due to the lower flexural508demands on the walls. In the N-S direction, both FF and NFP509ground motions at DE and MCER level intensities generated larger510interstory drift demands than NFNP ground motions for stories be-511low the midheight rocking joint. However, interstory drift demands512for NFP motions decreased for stories above the midheight rocking
0 1000 2000 3000 4000
Mean Peak Wall Moment (kN-m)
L1
L2
L3
L4
L5
L6
L7
L8
L9
L10
L11
L12
Roof
Level
D-FFD-NFNPD-NFPM-FFM-NFNPM-NFP
N-S
0 1000 2000 3000 4000
Mean Peak Wall Moment (kN-m)
L1
L2
L3
L4
L5
L6
L7
L8
L9
L10
L11
L12
Roof
Level
D-FFD-NFNPD-NFPM-FFM-NFNPM-NFP
E-W
(a) (b)
2nd Rocking Point2nd Rocking Point
F9:1 Fig. 9. Midrise building mean peak wall moment response for all ground motion types scaled to DE and MCER level intensities in: (a) North-SouthF9:2 (N-S); and (b) East-West (E-W) direction.
0 0.5 1 1.5 2 2.5 3
Mean Peak Inter-Story Drift (%)
S1
S2
S3
S4
S5
S6
S7
S8
S9
S10
S11
S12
Story
D-FFD-NFNPD-NFPM-FFM-NFNPM-NFP
N-S
0 0.5 1 1.5 2 2.5 3
Mean Peak Inter-Story Drift (%)
S1
S2
S3
S4
S5
S6
S7
S8
S9
S10
S11
S12
Story
D-FFD-NFNPD-NFPM-FFM-NFNPM-NFP
E-W
(a) (b)
2nd Rocking Point2nd Rocking Point
F10:1 Fig. 10.Midrise building mean peak interstory drift response for all ground motion types scaled to DE andMCER level intensities in: (a) North-SouthF10:2 (N-S); and (b) East-West (E-W) direction.
© ASCE 9 J. Struct. Eng.
PROOF
ONLY
513 joint relative to stories below the midheight rocking joint. Consid-514 ering both directions, the maximum interstory drift demands were515 2.04% and 3.08% for DE and MCER level events, respectively, in516 stories below the midheight rocking joint, and 0.82% and 1.17% for517 DE and MCER level events, respectively, in stories above the mid-518 height rocking joint. A total of 20 out of 22 FF ground motions did519 not produce peak story drifts that exceeded 2% at DE level events,520 while no ground motions produced peak story drifts that exceeded521 4% drift for MCER events.522 The mean peak dimensions of timber at the toes that exhibited523 an inelastic response, determined from the high-order model, for all524 ground motion types and for both DE and MCER at both rocking525 joints are given in Table 8. In the N-S direction, NFP ground mo-526 tions led to the greatest amount of inelasticity at the base for both527 DE and MCER level events. In the N-S direction for NFP ground528 motions at DE level events, walls at the base rocking joint expe-529 rienced 65 and 105 mm of inelastic response along the base530 and height of the wall, respectively. Inelastic behavior for DE level531 events did not occur at the midheight rocking joint, while select532 ground motion types caused inelastic response at MCER level533 events. The crushing behavior for walls at the base rocking joint534 were consistent with the performance objectives outlined in535 this study.536 The mean peak UFP deformation demands normalized to the537 yield displacement for DE and MCER level events are provided538 in Figs. 11(a and b) for the N-S and E-W direction, respectively.
539The low flexural demands for walls above the midheight rocking540joint resulted in smaller interstory drift demands, which resulted in541much lower UFP deformations above the midheight rocking joint.542For MCER level events, NFP motions caused the largest UFP de-543formations below the midheight rocking joint in the N-S direction,544while FF events caused the largest deformations above the mid-545height rocking joint for all intensity levels.
546Summary and Conclusions
547Nonlinear time history analyses were conducted for a low-rise,5485-story office building and a midrise, 12-story residential building549that both utilized post-tensioned (PT) cross-laminated timber (CLT)
16 550rocking walls coupled with U-shaped flexural plate (UFP) hyster-551etic damping devices as the sole lateral force resisting system.552Both buildings were designed to meet performance objectives that553limited structural damage to crushing at the wall toes and nonlinear554deformation in the UFPs, while ensuring ASCE 7-16 DE and555MCER interstory drift limits were satisfied and the post-tensioned556rods remained linear for all demands. The 12-story building pos-557sessed a second rocking joint at Level 7 (i.e., midheight) to mitigate558higher mode effects, reduce wall flexural demands, and meet code559acceptable drift levels. The building models incorporated newly560developed modeling methods for PT CLT rocking walls to inves-561tigate in-plane wall shear and flexural demands, interstory drift562demand, crushing at the wall toes, and vertical UFP deformation.563A total of 50 ground motions, consisting of far-field and near-fault564events, with and without pulses, were applied to both building mod-565els at DE and MCER intensities to conduct nonlinear time-history566analyses. The main conclusions resulting from this study are:567• Both the low-rise and midrise buildings were able to meet the568performance objectives, the ASCE 7-16 interstory drift limits,569and the allowable in-plane wall shear and flexural strength570requirements at both DE and MCER intensity levels.571• The response of the low-rise building was more sensitive to572ground motion pulses than the midrise building, resulting in lar-573ger wall moment demand, interstory drift demand, crushing at574the wall toes, and UFP deformation. This sensitivity was attrib-575uted to the velocity-sensitive correlation of the building period576to the target response spectrum. This sensitivity was also attrib-577uted to the midheight rocking joint in the midrise building,
Table 8. Damaged wall toe dimensions for midrise15 building
T8:1 N-S E-W
T8:2 FF NFNP NFP FF NFNP NFP
T8:3 DE base rocking jointT8:4 b (mm) 55 65 65 60 70 50T8:5 h(mm) 75 100 105 110 100 65
T8:6 MCER base rocking jointT8:7 b (mm) 75 90 120 85 100 75T8:8 h (mm) 115 145 160 115 130 125
T8:9 MCER midheight rocking jointT8:10 b (mm) 30 0 0 20 40 0T8:11 h (mm) 50 0 0 30 65 0
0 0.5 1 1.5 2 2.5 3
UFP DX
/ DY
(mm/mm)
L1
L2
L3
L4
L5
L6
L7
L8
L9
L10
L11
L12
Roof
Level
D-FFD-NFNPD-NFPM-FFM-NFNPM-NFP
N-S
0 0.5 1 1.5 2 2.5 3 3.5
UFP DX
/ DY
(mm/mm)
L1
L2
L3
L4
L5
L6
L7
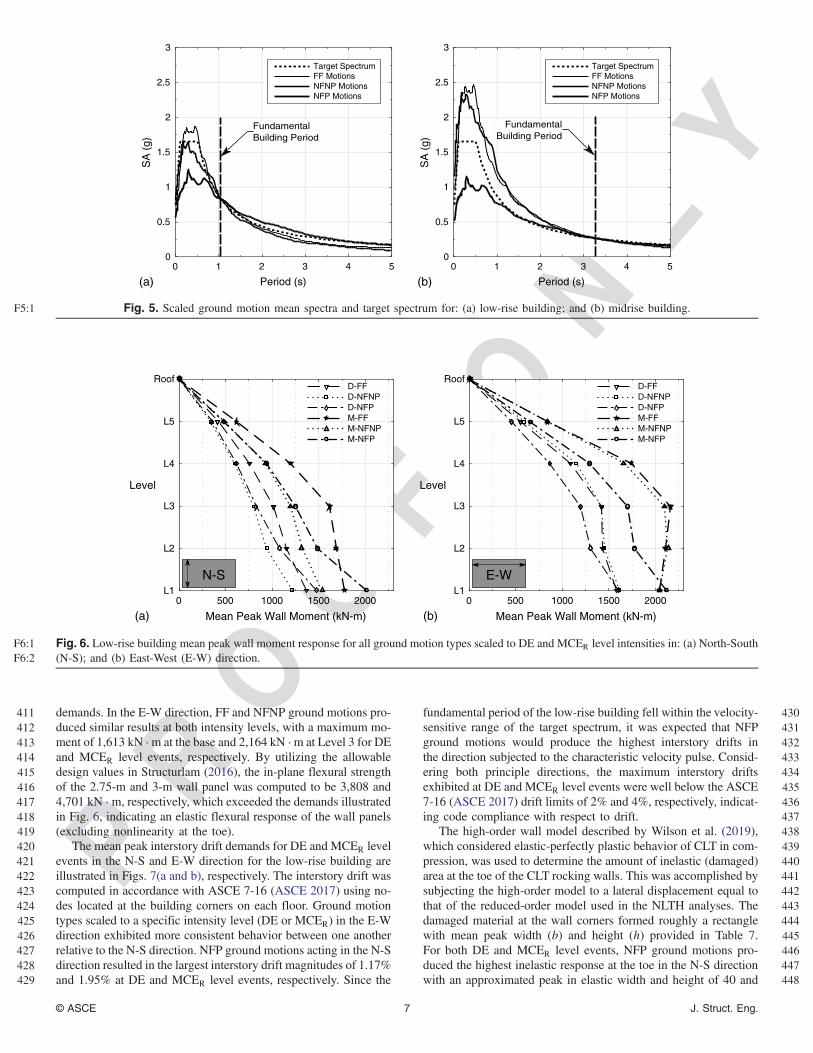
L8
L9
L10
L11
L12
Roof
Level
D-FFD-NFNPD-NFPM-FFM-NFNPM-NFP
E-W
(a) (b)
2nd Rocking Point2nd Rocking Point
F11:1 Fig. 11. Midrise building mean peak UFP deformation response for all ground motion types scaled to DE and MCER level intensities in: (a) North-F11:2 South (N-S); and (b) East-West (E-W) direction.
© ASCE 10 J. Struct. Eng.
PROOF
ONLY
578 which minimized the directivity effects of near-fault motions579 above the midheight rocking joint.580 • Walls in the low-rise building exhibited a maximum plastic re-581 sponse at the toes of 80 and 140 mm along the base and height582 of the wall, respectively, while walls in the midrise building583 exhibited a maximum plastic response at the toes of 120 and584 160 mm along the base and height of the wall, respectively, for585 MCER level events. These values indicate that wall damage is586 limited and localized at the wall toes.587 • Maximum UFP deformation increased as the location increased588 up the height of the low-rise building, resulting in more energy589 dissipation at the upper portions of the wall segments. In the590 midrise building, similar behavior was observed below the mid-591 height rocking joint. Above the midheight rocking joint, a592 significant drop in maximum UFP deformation was observed593 due to decreased flexural demands.
594 Data Availability Statement
595 Some or all data, models, or code generated or used during the596 study are available from the corresponding author, Daniel Dolan,597 upon written request.
598 Acknowledgments
599 This work was supported by the National Science Foundation600 under Grant No. CMMI-1635156. Any opinions, findings, conclu-601 sions, and recommendations presented in this paper are those of the602 authors and do not necessarily reflect the views of the National603 Science Foundation.
604 References
605 Akbas, T., et al. 2017. “Analytical and experimental lateral-load response of606 self-centering posttensioned CLT walls.” J. Struct. Eng. 143 (6):607 04017019. https://doi.org/10.1061/(ASCE)ST.1943-541X.0001733.1718608 ASCE. 2017. Minimum design loads and associated criteria for buildings609 and other structures. ASCE/SEI 7-16. Reston, VA: ASCE.610 ATC (Applied Technology Council). 2009. Quantification of building611 seismic performance factors. Rep. No. P-695. Redwood City, CA: ATC.612 AWC (American Wood Council). 2017. National design specification613 for wood construction with commentary. ANSI/AWC NDS 2018.614 Leesburg, VA: AWC.615 Baird, A., T. Smith, A. Palermo, and S. Pampanin. 2014. “Experimental616 and numerical study of U-shape flexural plate (UFP) dissipators.” In617 Proc., 2014 NZSEE Conf. New Zealand.19618 Chey, M. H., G. Chase, J. B. Mander, and A. J. Carr. 2010. “Semi-active619 tuned mass damper building systems: Application.” Earthquake Eng.620 Struct. Dyn. 39 (1): 69–89.20621 Chopra, A. 2012. Dynamics of structures: Theory and applications to622 earthquake engineering. 4th ed. Englewood Cliffs, NJ: Prentice Hall.623 CSI (Computers and Structures Inc). 2010. CSI analysis reference manual:624 For SAP2000, ETABS, SAFE and CSI Bridge. Berkeley, CA:625 Computers and Structures.626 Ganey, R. 2015. “Seismic design and testing of rocking cross laminated627 timber walls.” M.S. thesis, Univ. of Washington.21628 Ganey, R., J. Berman, T. Akbas, S. Loftus, J. D. Dolan, R. Sause, J. Ricles,629 S. Pei, J. V. D. Lindt, and H.-E. Blomgren. 2017. “Experimental inves-630 tigation of self-centering cross-laminated timber walls.” J. Struct.631 Eng. 143 (10): 04017135. https://doi.org/10.1061/(ASCE)ST.1943632 -541X.0001877.633 Holden, T., J. Restrepo, and J. B. Mander. 2003. “Seismic performance of634 precast reinforced and prestressed concrete walls.” J. Struct. Eng.635 129 (3): 286–296. https://doi.org/10.1061/(ASCE)0733-9445(2003)636 129:3(286).
637ICC (International Code Council). 2018. International building code. IBC6382018. Country Club Hills, IL: ICC.639Jin, Z., S. Pei, H. Blomgren, and J. Powers. 2019. “Simplified mechanistic640model for seismic response prediction of coupled cross-laminated tim-641ber rocking walls.” J. Struct. Eng. 145 (2): 04018253. https://doi.org/10642.1061/(ASCE)ST.1943-541X.0002265.643Kovacs, M., and L. Wiebe. 2017. “Controlled rocking CLTwalls for build-644ings in regions of moderate seismicity: Design procedure and numerical645collapse assessment.” J. Earthquake Eng. 23 (5), https://doi.org/10646.1080/13632469.2017.1326421.647Kurama, Y., S. Pessiki, R. Sause, and L. Lu. 1999a. “Seismic behavior and648design of unbonded post-tensioned precast concrete walls.” PCI J.64944 (3): 72–89. https://doi.org/10.15554/pcij.05011999.72.89. 22650Kurama, Y., R. Sause, S. Pessiki, and L.-W. Lu. 1999b. “Lateral load651behavior and seismic design of unbonded post-tensioned precast652concrete walls.” ACI Struct. J. 96 (4): 622–632. 23653Kurama, Y. C. 2002. “Hybrid post-tensioned precast concrete walls for use654in seismic regions.” PCI J. 47 (5): 36–59. https://doi.org/10.15554/pcij655.09012002.36.59. 24656Li, T., J. W. Berman, and R. Wiebe. 2017. “Parametric study of seismic657performance of structures with multiple rocking joints.” Eng. Struct.658146 (Sep): 75–92. https://doi.org/10.1016/j.engstruct.2017.05.030.659Mazzoni, S., F. McKenna, M. H. Scott, and G. L. Fenves. 2006. OpenSEES660command language manual. Berkeley, CA: Pacific Earthquake661Engineering Research Center.662Nakaki, S. D., J. F. Stanton, and S. Sritharan. 1999. “An overview of the663PRESSS five-story precast test building.” PCI J. 44 (2): 26–39. https://664doi.org/10.15554/pcij.03011999.26.39. 25665Panagiotou, M., and J. I. Restrepo. 2009. “Dual-plastic hinge design con-666cept for reducing higher-mode effects on high-rise cantilever wall build-667ings.” Earthquake Eng. Struct. Dyn. 38 (12): 1359–1380. https://doi.org668/10.1002/eqe.905.669PEER (Pacific Earthquake Engineering Research Center). 2017. Tall build-670ings initiative: Guidelines for performance-based seismic design of tall671buildings. 2.0 ed. Berkeley, CA: PEER.672PEER (Pacific Earthquake Engineering Research Center). 2018. “PEER673ground motion database.” Accessed May 2018. https://ngawest2674.berkeley.edu.675Pei, S., J. Van De Lindt, A. Barbosa, J. Berman, E. McDonnell, J. Dolan, R.676Zimmerman, R. Sause, J. Ricles, and K. Ryan. 2018. “Full-scale shake677table test of mass-timber building with resilient post-tensioned rocking678walls.” In Proc., 2018 World Conf. of Timber Engineering, Korea. 26679Perez, F. J., S. Pessiki, and R. Sause. 2013. “Experimental lateral load re-680sponse of unbonded post tensioned precast concrete walls.” ACI Struct.681J. 110 (6): 1045–1055. 27682Priestley, M. J. N., S. S. Sritharan, J. R. Conley, and S. Pampanin. 1999.683“Preliminary results and conclusions from the PRESSS five-story pre-684cast concrete test building.” PCI J. 44 (6): 42–67. https://doi.org/10685.15554/pcij.11011999.42.67. 28686Restrepo, J. I., and A. Rahman. 2007. “Seismic performance of self-687centering structural walls incorporating energy dissipaters.” J. Struct.688Eng. 133 (11): 1560–1570. https://doi.org/10.1061/(ASCE)0733689-9445(2007)133:11(1560).690Sarti, F., A. Palermo, and S. Pampanin. 2016a. “Development and testing of691an alternative dissipative post-tensioned rocking timber wall with boun-692dary columns.” J. Struct. Eng. 142 (4): E4015011. https://doi.org/10693.1061/(ASCE)ST.1943-541X.0001390.694Sarti, F., A. Palermo, and S. Pampanin. 2016b. “Fuse-type external replace-695able dissipaters: Experimental program and numerical modeling.”696J. Struct. Eng. 142 (12): 04016134. https://doi.org/10.1061/(ASCE)ST697.1943-541X.0001606.698Sarti, F., A. Palermo, and S. Pampanin. 2016c. “Quasi-static cyclic testing699of two-thirds scale unbonded posttensioned rocking dissipative timber700walls.” J. Struct. Eng. 142 (4): E4015005. https://doi.org/10.1061701/(ASCE)ST.1943-541X.0001291.702Sarti, F., A. Palermo, S. Pampanin, and J. Berman. 2017. “Determination of703the seismic performance factors for post-tensioned rocking timber wall704systems.” Earthquake Eng. Struct. Dyn. 46 (2): 181–200. https://doi.org705/10.1002/eqe.2784.
© ASCE 11 J. Struct. Eng.

PROOF
ONLY
706 Smith, B. J., Y. C. Kurama, and M. J. McGinnis. 2011. “Design and mea-707 sured behavior of a hybrid precast concrete wall specimen for seismic708 regions.” J. Struct. Eng. 137 (10): 1052–1062. https://doi.org/10.1061709 /(ASCE)ST.1943-541X.0000327.710 Sritharan, S., S. Aaleti, R. S. Henry, K.-Y. Liu, and K.-C. Tsai. 2015.711 “Precast concrete wall with end columns (PreWEC) for earthquake712 resistant design.” Earthquake Eng. Struct. Dyn. 44 (12): 2075–2092.713 https://doi.org/10.1002/eqe.2576.714 Structurlam. 2016. Crosslam CLT technical design guide. Penticton,715 Canada: Structurlam.716 Twigden, K. M., S. Sritharan, and R. S. Henry. 2017. “Cyclic testing of717 unbonded post-tensioned concrete wall systems with and without sup-718 plemental damping.” Eng. Struct. 140 (Jun): 406–420. https://doi.org719 /10.1016/j.engstruct.2017.02.008.720 Wiebe, L., and C. Christopoulos. 2010. “Characterizing acceleration spikes721 due to stiffness changes in nonlinear systems.” Earthquake Eng. Struct.722 Dyn. 39 (14): 1653–1670. https://doi.org/10.1002/eqe.1009.
723Wiebe, L., C. Christopoulos, R. Tremblay, and M. Leclerc. 2013a. “Mech-724anisms to limit higher mode effects in a controlled rocking steel725frame. 1: Concept, modelling, and low-amplitude shake-table testing.”726Earthquake Eng. Struct. Dyn. 42 (7): 1053–1068. https://doi.org/10727.1002/eqe.2259.728Wiebe, L., C. Christopoulous, R. Tremblay, and M. Leclerc.7292013b. “Mechanisms to limit higher mode effects in a controlled rock-730ing steel frame. 2: Large-amplitude shake table testing.” Earthquake731Eng. Struct. Dyn. 42 (7): 1069–1086. https://doi.org/10.1002/eqe732.2258.733Wilson, A. 2018. “Numerical modeling and seismic performance of post-734tensioned cross-laminated timber rocking wall systems.” M.S. thesis,735Washington State Univ. 29 30736Wilson, A. W., C. J. Motter, A. R. Phillips, and J. D. Dolan. 2019.737“Modeling techniques for post-tensioned cross-laminated timber rocking738walls.” Eng. Struct. 195: 299–308. https://doi.org/10.1016/j.engstruct739.2019.06.011. 31
© ASCE 12 J. Struct. Eng.

PROOF
ONLY
Queries1. Please provide the ASCE Membership Grades for the authors who are members.
2. Please provide street address in 1st affiliation for the author “Alex W. Wilson” in affiliation footnotes.
3. In the text “design earthquake and maximum considered earthquake for Seattle, with Site Class D”Please clarify use of “SiteClass D”–there are four instances used in the article; the first two have no clarification, then the third reference refers to “location”and the fourth refers to “soil conditions.”
4. Please check the hierarchy of section heading levels.
5. ASCE Open Access: Authors may choose to publish their papers through ASCE Open Access, making the paper freely availableto all readers via the ASCE Library website. ASCE Open Access papers will be published under the Creative Commons-Attribution Only (CC-BY) License. The fee for this service is $2000, and must be paid prior to publication. If you indicateYes, you will receive a follow-up message with payment instructions. If you indicate No, your paper will be published inthe typical subscribed-access section of the Journal.
6. In the text “Many of these concepts for PT precast concrete rocking walls were extended to PT LVL rocking walls”Please defineat first instance “LVL” Do you mean “laminated veneer lumber (LVL)”
7. Please provide version number for "OpenSees" software.
8. Regarding “glulams”:does the edit in the text retain the intended meaning: “solely by an independent glued-laminated timber(GLT or glulams) framing system.”Please see text in following paragraph: “provided in Table 2, were determined using E-1.8Eclass glulams and following the design procedures”
9. Please check all figures, figure citations, and figure captions to ensure they match and are in the correct order.
10. Please check and confirm that whether we can change the variables italics in the table header for Table 5.
11. As per ASCE style only SI units are allowed, so please change "mph" into a appropriate unit (like "km/h").
12. ASCE style for math is to set all mathematical variables in italic font. Please check all math variables throughout the paper, both inequations and throughout the text, to ensure all conform to ASCE style.
13. Please provide column heading for Table 7.
14. The citation (Wiebe and Christopoulos 2009) mentioned in this sentence is not present in the References list. Please provide thefull details and we will insert it in the References list and link it to this citation.
15. Please provide column heading for Table 8.
16. Does the edit in the text retain the intended meaning: “rocking walls coupled with U-shaped Flexural Plate (UFP) hystereticdamping devices”
17. Please check and confirm if updated year of publication for Akbas et al. (2017).
18. As per style, the first-author name should be followed by "et al." only if the reference has more than ten authors. Please provide allthe author names instead of "et al." for reference (Akbas 2017).
19. Please provide the publisher or sponsor name and location (not the conference location) for Baird et al. (2014).
20. This query was generated by an automatic reference checking system. This reference could not be located in the databases usedby the system. While the reference may be correct, we ask that you check it so we can provide as many links to the referencedarticles as possible.
21. Please provide department name for Ganey (2015).
© ASCE 13 J. Struct. Eng.

PROOF
ONLY
22. Please check URL–server errorsee: https://www.pci.org/PCI/Publications/PCI_Journal/Issues/1999/May-June/Seismic_Beha-vior_and_Design_of_Unbonded_Post-Tensioned_Precast_Concrete_Walls.aspx?WebsiteKey=5a7b2064-98c2-4c8e-9b4b-18c80973da1e )
23. This query was generated by an automatic reference checking system. This reference could not be located in the databases usedby the system. While the reference may be correct, we ask that you check it so we can provide as many links to the referencedarticles as possible.
24. Please check URL–server errorsee:https://www.pci.org/PCI_Docs/Design_Resources/Guides_and_manuals/references/PRESSS/Hybrid%20Post-Tensioned%20Precast%20Concrete%20Walls%20for%20Use%20in%20Seismic%20Regions.pdf
25. Please check URL: server errorSee:https://www.researchgate.net/publication/280765031_Overview_of_the_PRESSS_five-story_precast_test_building
26. Please provide the publisher or sponsor name and location (not the conference location) for Pei et al. (2018).
27. This query was generated by an automatic reference checking system. This reference could not be located in the databases usedby the system. While the reference may be correct, we ask that you check it so we can provide as many links to the referencedarticles as possible.
28. Please check URL: server errorSee:https://www.pci.org/PCI_Docs/Publications/PCI%20Journal/1999/Nov-Dec/Preliminary%20Results%20and%20Conclusions%20From%20the%20PRESSS%20Five-Story%20Precast%20Concrete%20Test%20Build-ing.pdf
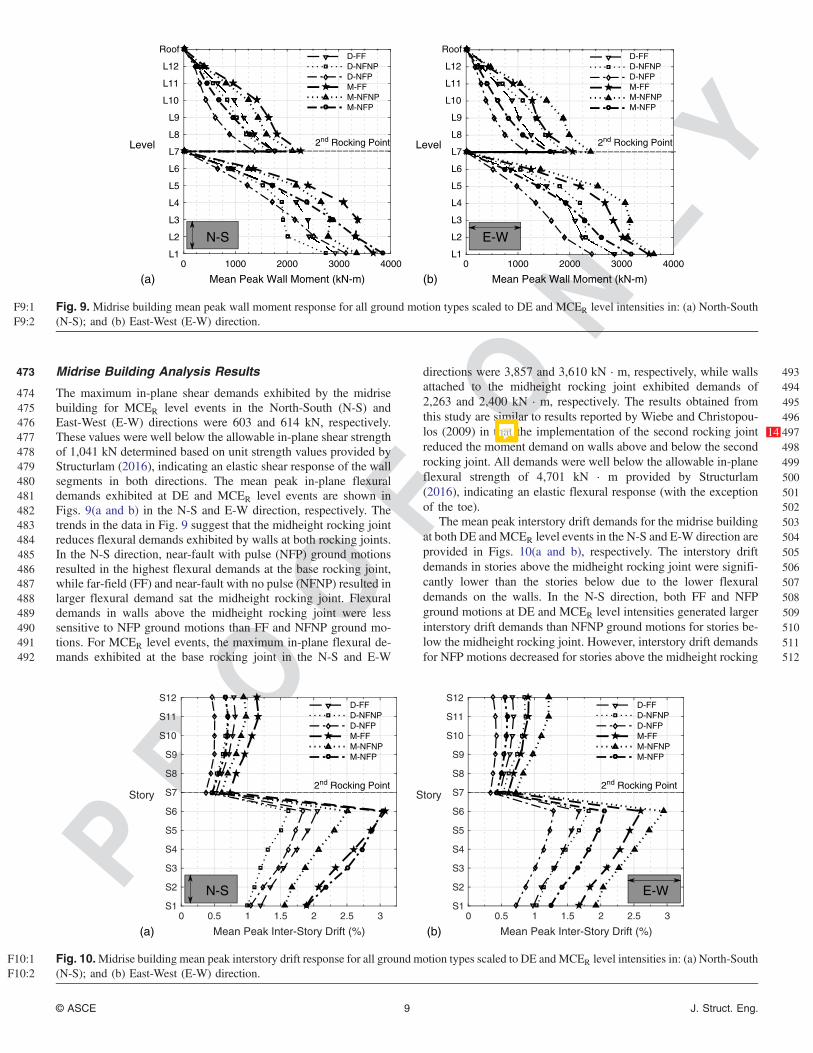
29. Please provide department name for Wilson (2018).
30. This reference Wilson (2018) is not mentioned anywhere in the text. ASCE style requires that entries in the References list mustbe cited at least once within the paper. Please indicate a place in the text, tables, or figures where we may insert a citation orindicate if the entry should be deleted from the References list.
31. Pleas e provide issue number for Wilson et al. (2018).
© ASCE 14 J. Struct. Eng.