seismic site response (site amplification)
TRANSCRIPT
_____________________________________________________________Course notes: Ahmed Elgamal, Universidad Nacional de San Juan, Argentina, April, 2014
Seismic Site Response (Site Amplification)
An Introduction to Shear Beam Analysis(Part II)
Ahmed Elgamal
(Initial version prepared in 2006 in collaboration with Drs. Liangcai He and Zhaohui Yang)
_____________________________________________________________Course notes: Ahmed Elgamal, Universidad Nacional de San Juan, Argentina, April, 2014
Equivalent Linear Site Response
2

_____________________________________________________________Course notes: Ahmed Elgamal, Universidad Nacional de San Juan, Argentina, April, 2014
SHAKE / SHAKE 91A. Elgamal and T. Lai (notes; original version)
References
P. B. Schnabel, J. Lysmer, and H. B. Seed, Shake: A Computer Program For Earthquake Response Analysis of Horizontally Layered Sites, Report No. EERC 72-12, University of California at Berkeley, December 1972.
I. M. Idriss, and J. I. Sun, Shake 91: A Computer Program for Conducting Equivalent Linear Seismic Response Analyses of Horizontally Layered Soil Deposits, Modified based on Original Program Shake, University of California, Davis, August 1992.
T. Iwasaki, F. Tatsuoka, and Y. Takagi, “Shear Moduli of Sands Under Cyclic Torsional Shear Loading,” SoilsAnd Foundations, JSSMFE, Vol. 18, No. 1, pp. 39-56.
P. W. Mayne and G. J. Rix (1993), “Gmax-qc Relationships for Clays, “Geotechnical Testing Journal, ASTM, Vol. 16, No. 1, pp. 54-60.
H. B. Seed, R. T. Wong, I. M. Idriss, and K. Tokimatsu, “Moduli and Damping Factors for Dynamic Analyses of Cohesionless Soils, Report No. UCB/EERC-84/14, Earthquake Engineering Research Center,University of California, Berkeley, Ca, 1984.
M. Jamiolkowski, S. Leroueil, and D. C. F. Lo Presti (1991), “Theme Lecture: Design Parameters from Theory to Practice, Proc. Geo-Coast ’91, Yokohama, Japan, pp. 1-41.
3
_____________________________________________________________Course notes: Ahmed Elgamal, Universidad Nacional de San Juan, Argentina, April, 2014
T. Imai and K. Tonouchi, Correlation of N-Value with S-Wave Velocity and Shear Modulus,” Proc. 2nd European Symposium on Penetration Testing, Amsterdam, The Netherlands, pp. 67-72.
E. Kavazanjian, Jr., N. Matasovic, T. Hadj-Hamou, and P. J. Sabatini, Geotechnical Engineering Circular No. 3 – Design Guidance: Geotechnical Earthquake Engineering for Highways, Design Principles, Volume 1, SA-97-076 (NTIS # PB98-11560)
E. Kavazanjian, Jr., N. Matasovic, T. Hadj-Hamou, and P. J. Sabatini, Geotechnical Engineering Circular No. 3 – Design Guidance: Geotechnical Earthquake Engineering for Highways, Design Examples, Volume 2, SA-97-077 (NTIS # PB98-11578)
NRC 2000, Seeing into the Earth, Committee for Noninvasive Characterization of the Shallow Subsurface for Environmental and Engineering Applications, P. R. Roming, Chair, 129 pp.
M. Vucetic and Ricardo Dobry, “Effect of Soil Plasticity on Cyclic Response,” Journal of Geotechnical Engineering, ASCE, Vol. 117, No. 1, January 1991.
H. B. Seed and I. M. Idriss, “Soil Moduli and Damping Factors for Dynamic Response Analyses,” Report No. EERC 70-10, Earthquake Engineering Research Center, University of California, Berkeley, CA, 1970.
H. B. Seed, Robert T. Wong, I. M. Idriss and K. Tokimatsu, “Moduli and Damping Factors for Dynamic Analyses of Cohesionless Soils, Journal of Geotechnical Engineering, ASCE, Vol. 112, No. 11, November, 1986.
4
_____________________________________________________________Course notes: Ahmed Elgamal, Universidad Nacional de San Juan, Argentina, April, 2014
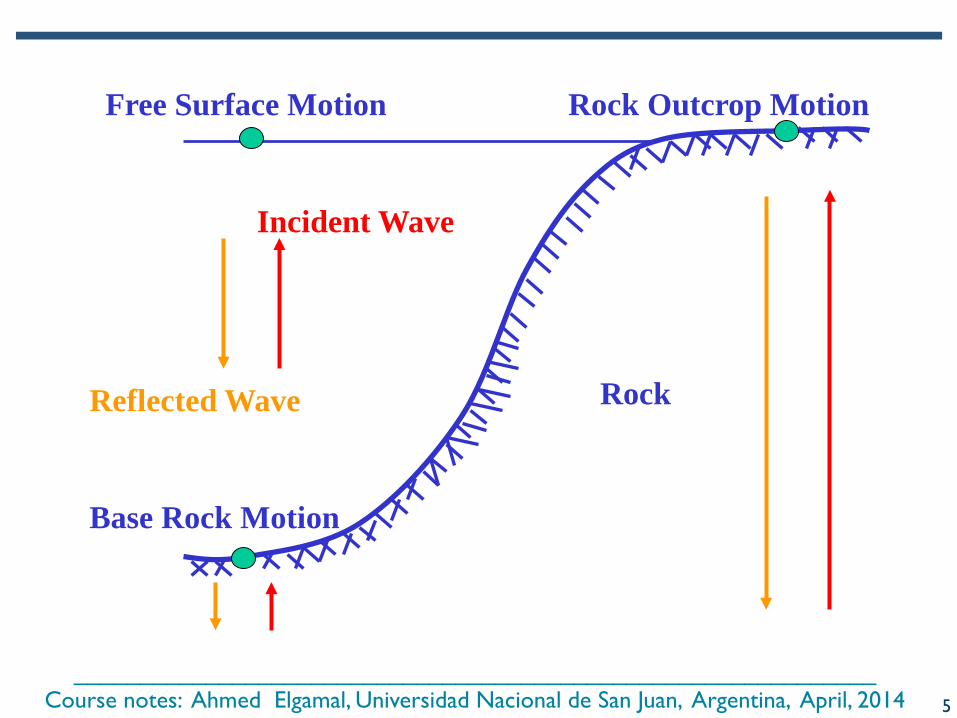
Base Rock Motion
Free Surface Motion Rock Outcrop Motion
Incident Wave
Reflected Wave Rock
5
_____________________________________________________________Course notes: Ahmed Elgamal, Universidad Nacional de San Juan, Argentina, April, 2014
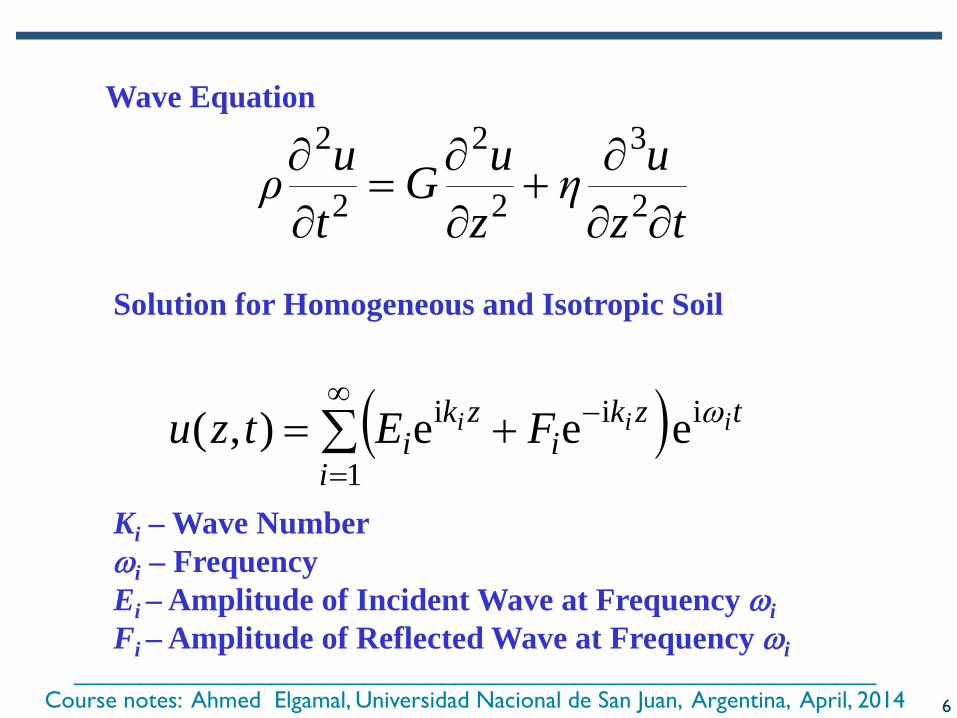
Wave Equation
Solution for Homogeneous and Isotropic Soil
tzuη
zuG
tuρ
∂∂∂+
∂∂=
∂∂
2
3
2
2
2
2
( ) t
i
zki
zki
iii FEtzu ωi
1
ii e ee),( ∑∞
=
−+=
Ki – Wave Numberωi – FrequencyEi – Amplitude of Incident Wave at Frequency ωiFi – Amplitude of Reflected Wave at Frequency ωi
6
_____________________________________________________________Course notes: Ahmed Elgamal, Universidad Nacional de San Juan, Argentina, April, 2014
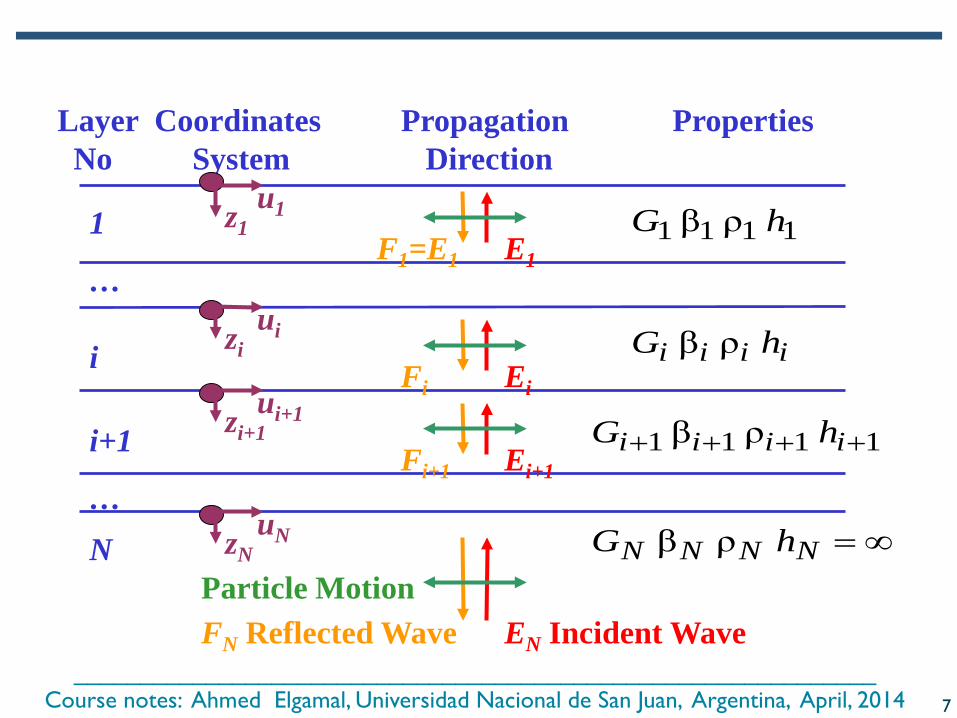
Layer Coordinates Propagation PropertiesNo System Direction
EN Incident WaveFN Reflected WaveParticle Motion
1111 ρ β hG1
…
i
i+1
N…
Ei+1Fi+1
EiFi
E1F1=E1
iiii hG ρ β
1111 ρ β ++++ iiii hG
∞=NNNN hG ρ β
u1z1
uizi
ui+1zi+1
uNzN
7

_____________________________________________________________Course notes: Ahmed Elgamal, Universidad Nacional de San Juan, Argentina, April, 2014
Properties G, β, ρ, h are known (shear modulus, damping ratio, mass density, and layer height)
• Unknown in system: 2N (Ei, Fi)
• Boundary Conditions:Displacement continuity at all interfaces: N-1Stress continuity at all interfaces: N-1Zero stress at free surface: 1
Given motion at any one layer: 1
+
• Motions at any layer are determined
⇓
8
_____________________________________________________________Course notes: Ahmed Elgamal, Universidad Nacional de San Juan, Argentina, April, 2014
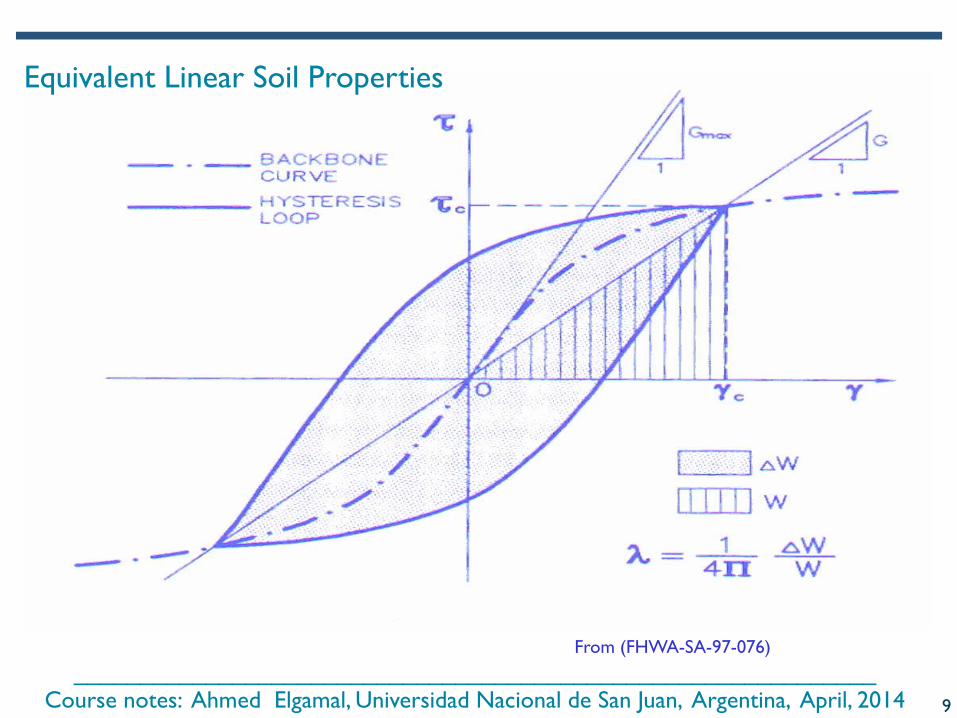
Equivalent Linear Soil Properties
From (FHWA-SA-97-076)
9
_____________________________________________________________Course notes: Ahmed Elgamal, Universidad Nacional de San Juan, Argentina, April, 2014
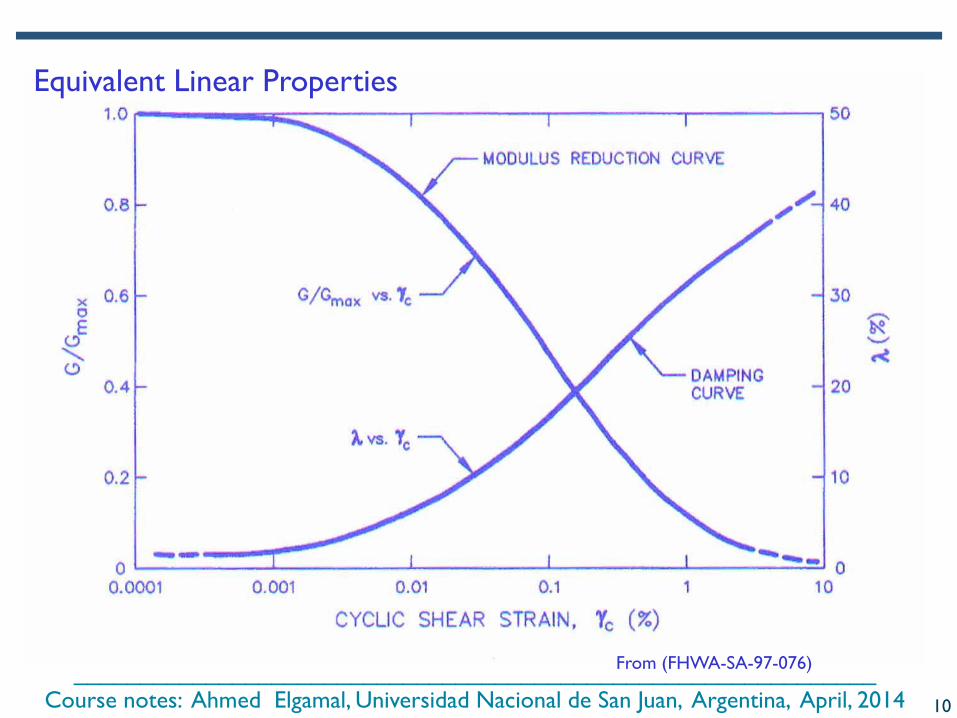
Equivalent Linear Properties
From (FHWA-SA-97-076)
10
_____________________________________________________________Course notes: Ahmed Elgamal, Universidad Nacional de San Juan, Argentina, April, 2014
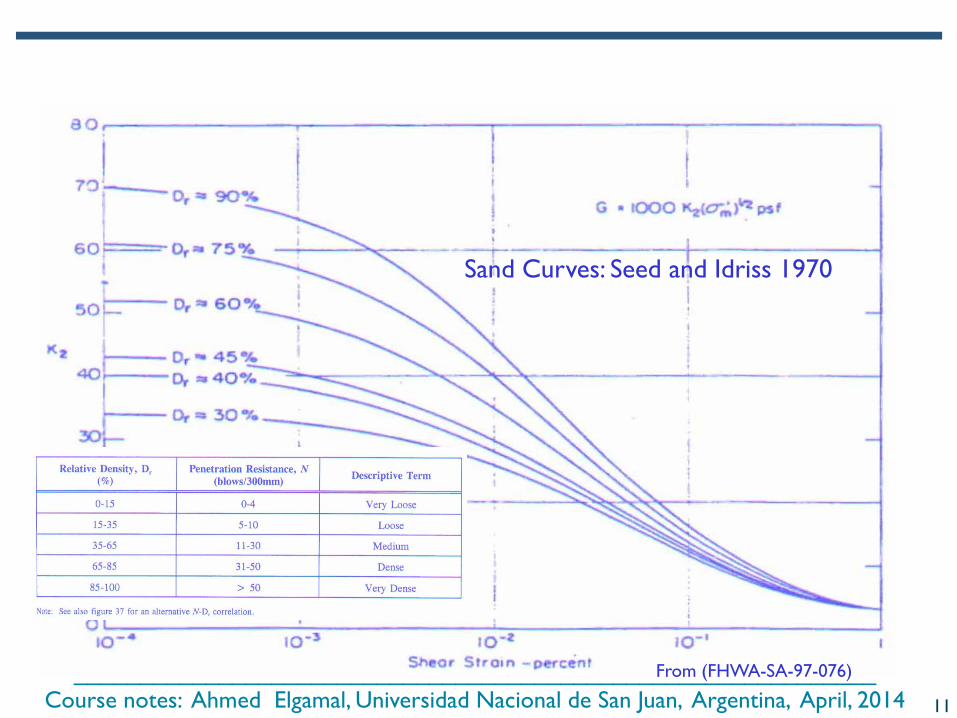
From (FHWA-SA-97-076)
Sand Curves: Seed and Idriss 1970
11
_____________________________________________________________Course notes: Ahmed Elgamal, Universidad Nacional de San Juan, Argentina, April, 2014
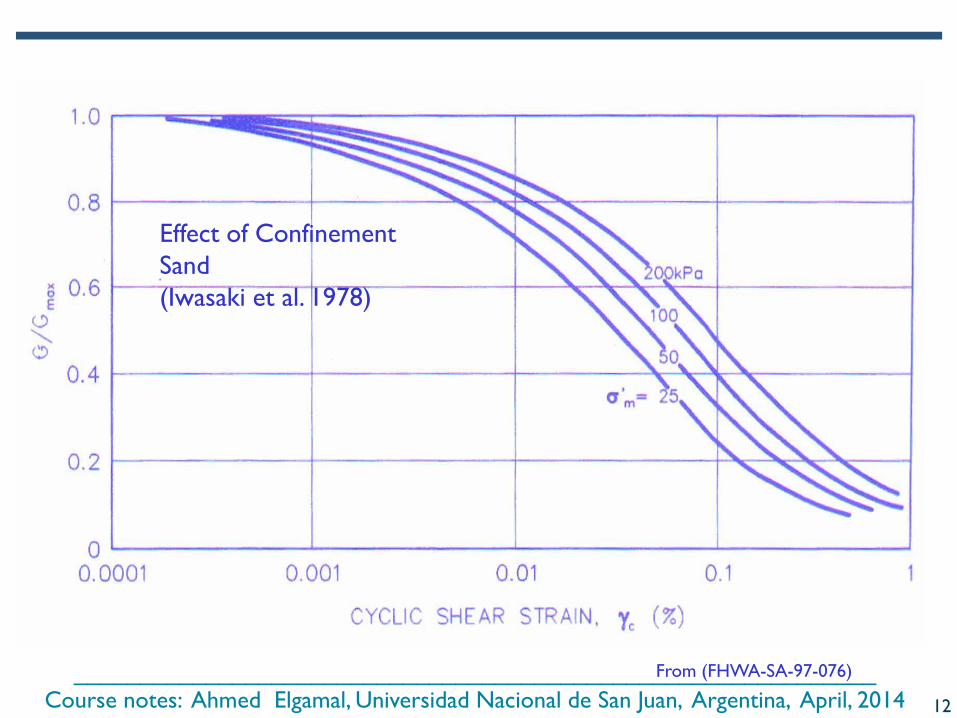
Effect of ConfinementSand(Iwasaki et al. 1978)
From (FHWA-SA-97-076)
12
_____________________________________________________________Course notes: Ahmed Elgamal, Universidad Nacional de San Juan, Argentina, April, 2014
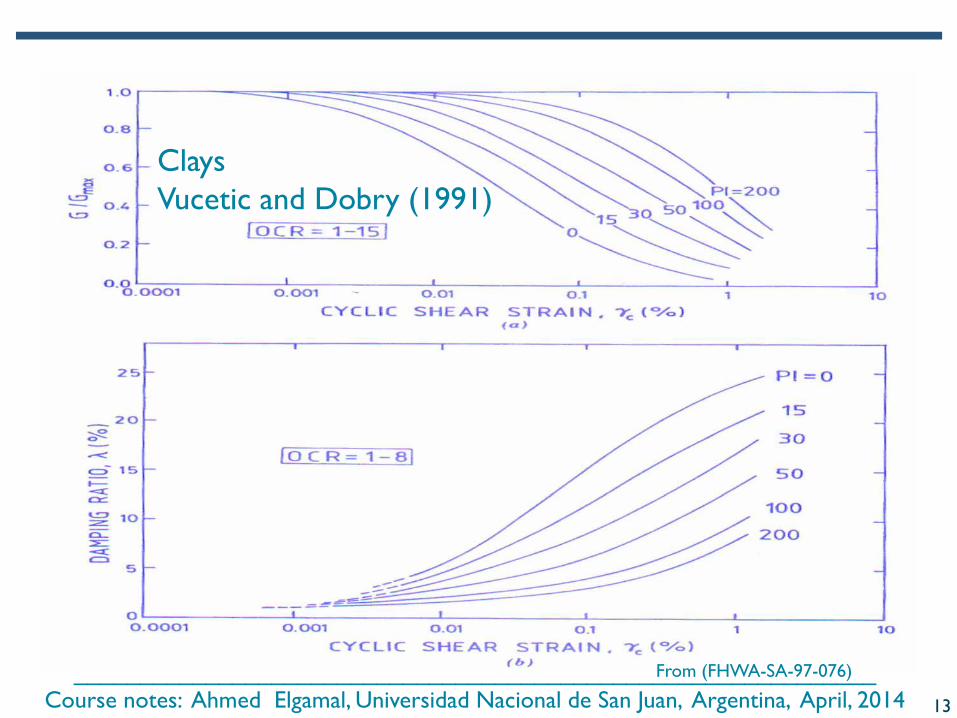
From (FHWA-SA-97-076)
ClaysVucetic and Dobry (1991)
13
_____________________________________________________________Course notes: Ahmed Elgamal, Universidad Nacional de San Juan, Argentina, April, 2014
See also:
Darendeli, M. B. (2001). “Development of a new family of normalized modulus reduction and material damping curves.” PhD dissertation, Univ. of Texas at Austin, Austin, Texas.
Darendeli, M.B., and K. H. Stokoe, II (2001). Development of a new family of normalized modulus reduction and material damping curves, Geotech. Engrg. Rpt. GD01-1, University of Texas, Austin, Texas.
Menq, F.-Y. (2003). Dynamic Properties of Sandy and Gravelly Soils. PhD Dissertation (supervisor: Prof. Kenneth H. Stokoe), Department of Civil Engineering, The University of Texas at Austin, May.
14
_____________________________________________________________Course notes: Ahmed Elgamal, Universidad Nacional de San Juan, Argentina, April, 2014
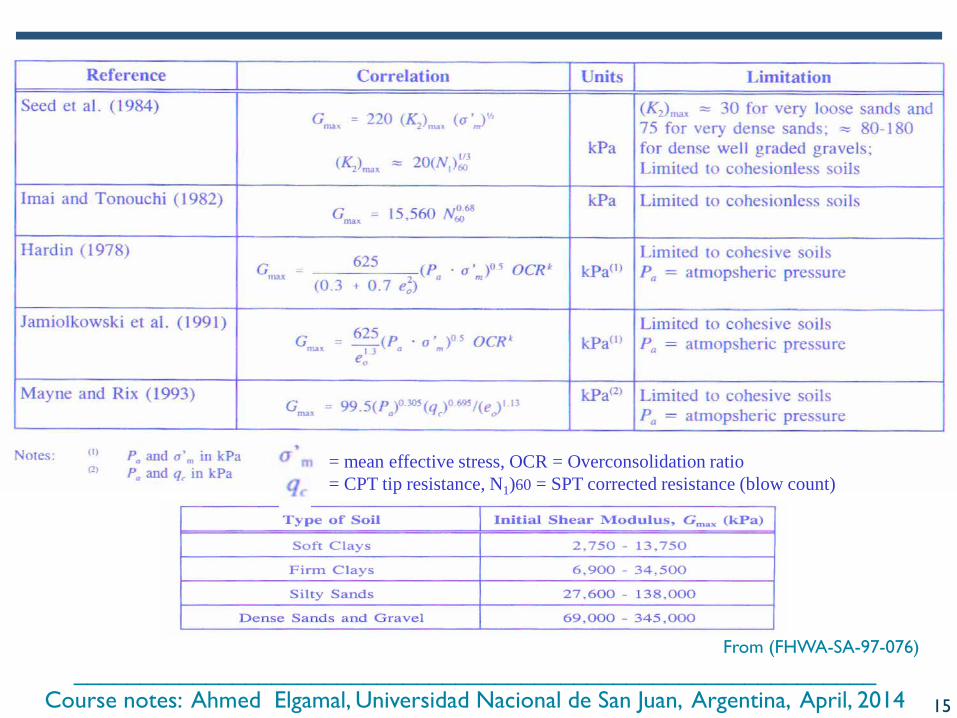
From (FHWA-SA-97-076)
= mean effective stress, OCR = Overconsolidation ratio= CPT tip resistance, N1)60 = SPT corrected resistance (blow count)
15

_____________________________________________________________Course notes: Ahmed Elgamal, Universidad Nacional de San Juan, Argentina, April, 2014
What SHAKE can do?• Free Surface Motion Prediction
When motions at depth are known (either rock outcrop (incident) or total motion
• DeconvolutionWhen motions at surface are known
(does not work well for nonlinear cases)
Properties G, β, ρ, h are known
16

_____________________________________________________________Course notes: Ahmed Elgamal, Universidad Nacional de San Juan, Argentina, April, 2014
• Input motion as outcrop motion (changed to incident motion) • Input motion as inlayer motion (Total
motion)• Layer height definition•Units
Caution when using SHAKE
17
_____________________________________________________________Course notes: Ahmed Elgamal, Universidad Nacional de San Juan, Argentina, April, 2014
SHAKE Output
•Acceleration Time History• Strain and Stress History• Response Spectrum• Fourier Spectrum•Amplification Spectrum• Strain Compatible Soil Properties(Equivalent Linear Option)
18
_____________________________________________________________Course notes: Ahmed Elgamal, Universidad Nacional de San Juan, Argentina, April, 2014
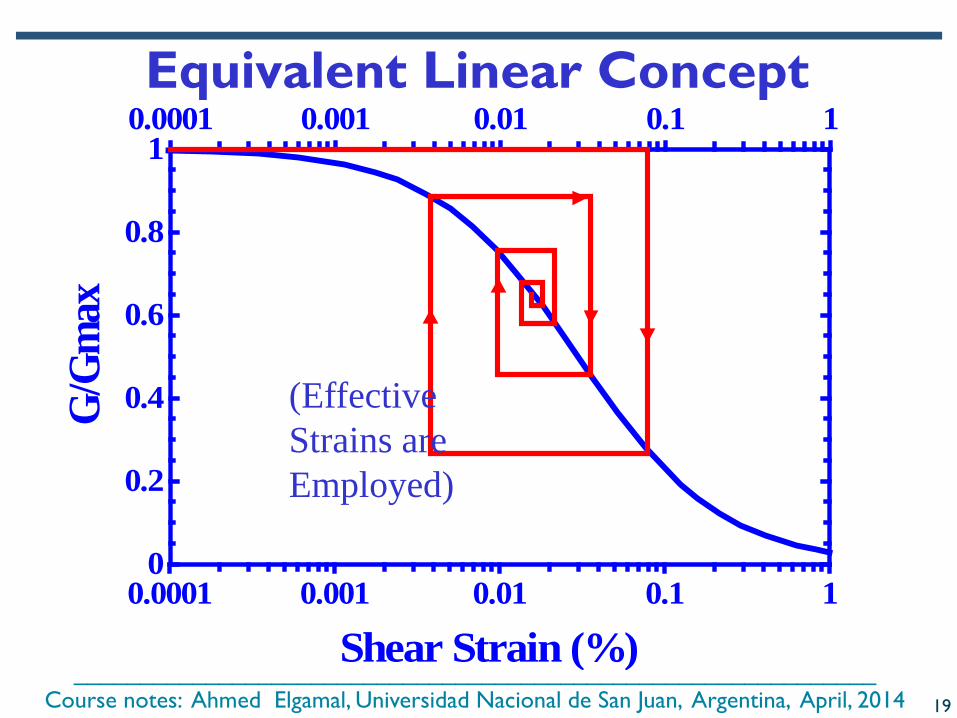
0.0001 0.001 0.01 0.1 1
Shear Strain (%)
0
0.2
0.4
0.6
0.8
1
G/Gm
ax0.0001 0.001 0.01 0.1 1Equivalent Linear Concept
(EffectiveStrains areEmployed)
19
_____________________________________________________________Course notes: Ahmed Elgamal, Universidad Nacional de San Juan, Argentina, April, 2014
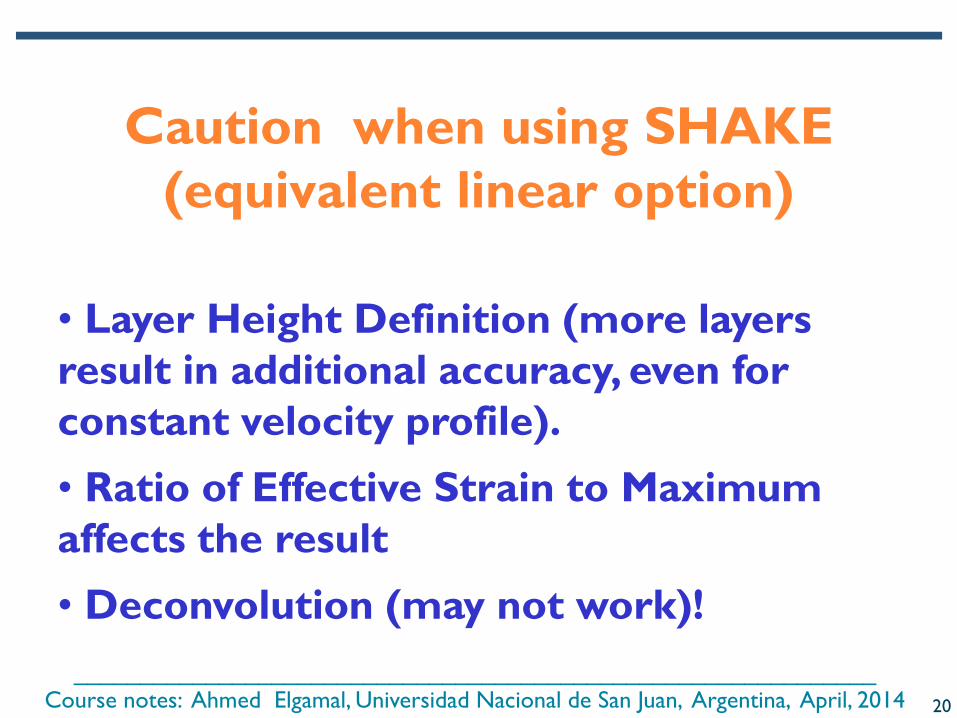
Caution when using SHAKE (equivalent linear option)
• Layer Height Definition (more layers result in additional accuracy, even for constant velocity profile).• Ratio of Effective Strain to Maximum affects the result• Deconvolution (may not work)!
20
_____________________________________________________________Course notes: Ahmed Elgamal, Universidad Nacional de San Juan, Argentina, April, 2014
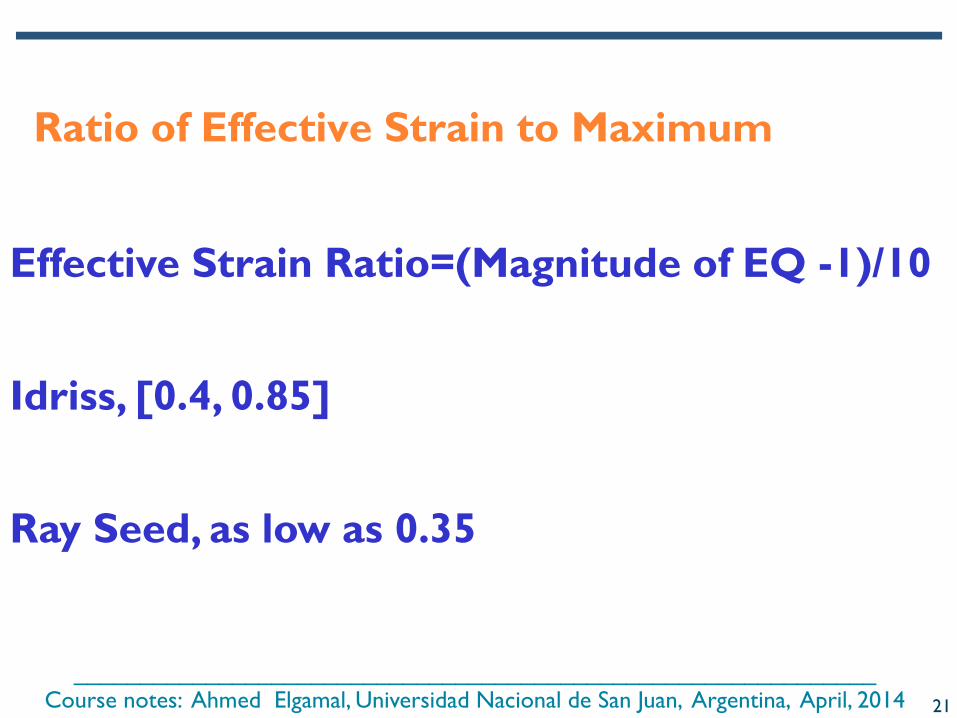
Ratio of Effective Strain to Maximum
Effective Strain Ratio=(Magnitude of EQ -1)/10
Idriss, [0.4, 0.85]
Ray Seed, as low as 0.35
21
_____________________________________________________________Course notes: Ahmed Elgamal, Universidad Nacional de San Juan, Argentina, April, 2014
What can SHAKE do?
See also (General Refs.):
Use of Exact Solutions of Wave Propagation Problems to Guide Implementation of Nonlinear Seismic Ground Response Analysis Procedures, Annie O. L. Kwok, Jonathan P. Stewart, Youssef M. A. Hashash, Neven Matasovic, Robert Pyke, Zhiliang Wang, and Zhaohui Yang, Journal of Geotechnical and Geoenvironmental Engineering, Vol. 133, No. 11, November 1, 2007.
ProShake: Ground Response Analysis Program, Version 1.1User’s Manual, EduPro Civil Systems, Inc. Redmond, Washington .
22

_____________________________________________________________Course notes: Ahmed Elgamal, Universidad Nacional de San Juan, Argentina, April, 2014
More recent research into G/Gmax and D (Darendeli 2001, Menq 2003)
see page 1 of Excel spreadsheet for actual G/Gmax and D values23
_____________________________________________________________Course notes: Ahmed Elgamal, Universidad Nacional de San Juan, Argentina, April, 2014
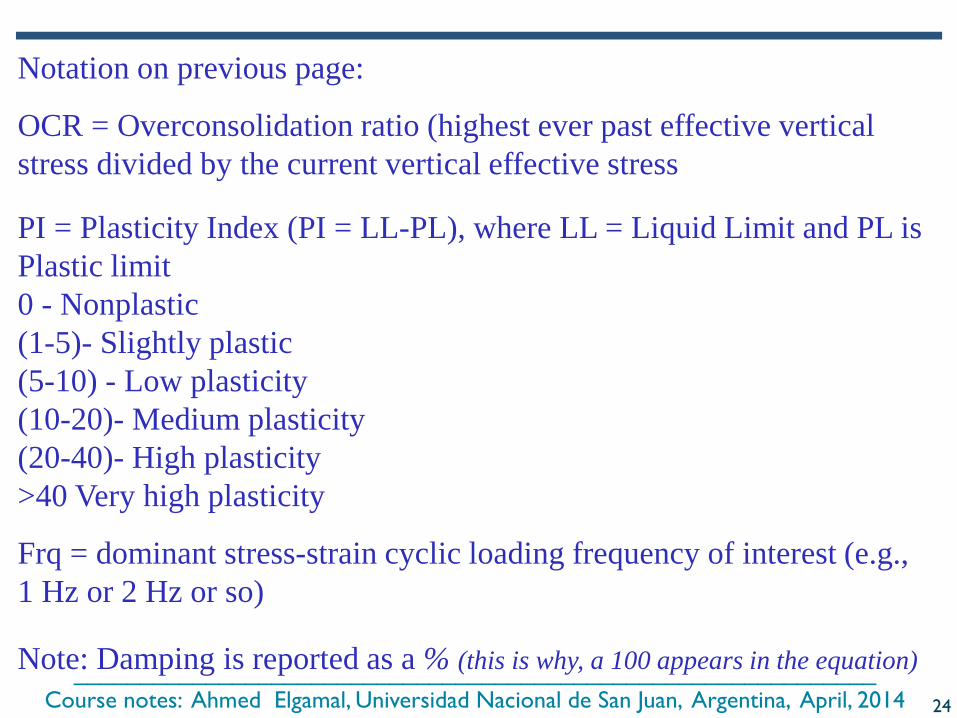
Notation on previous page:
OCR = Overconsolidation ratio (highest ever past effective vertical stress divided by the current vertical effective stress
PI = Plasticity Index (PI = LL-PL), where LL = Liquid Limit and PL is Plastic limit0 - Nonplastic(1-5)- Slightly plastic(5-10) - Low plasticity(10-20)- Medium plasticity(20-40)- High plasticity>40 Very high plasticity
Frq = dominant stress-strain cyclic loading frequency of interest (e.g., 1 Hz or 2 Hz or so)
Note: Damping is reported as a % (this is why, a 100 appears in the equation)24

_____________________________________________________________Course notes: Ahmed Elgamal, Universidad Nacional de San Juan, Argentina, April, 2014
650
4
)5/(3.1
32
max
'1P
Pu
PD
CP
a
oPu
ePCP
G+
⋅
×
=
σ
Coefficients Suggested by Menq, 2003
P1 (ksf) 1400
P2 -0.2
P3 0.48
P4 0.09
P5 20
P6 0.75
Menq’s Equations (Sands and Gravels, developed in 2003)
Note: This equation will over-estimate Gmax for particles with D50 greater than 10mm (or more generally, particles greater than 1 in in diameter (range of what Dr. Menq tested so far, personal communication)
Note:e = void ratioCoefficient of Uniformity:Cu = D60/D10where, D60 is the grain diameter at 60% passing, and D10 is the grain diameter at 10% passing (by weight)
25
_____________________________________________________________Course notes: Ahmed Elgamal, Universidad Nacional de San Juan, Argentina, April, 2014
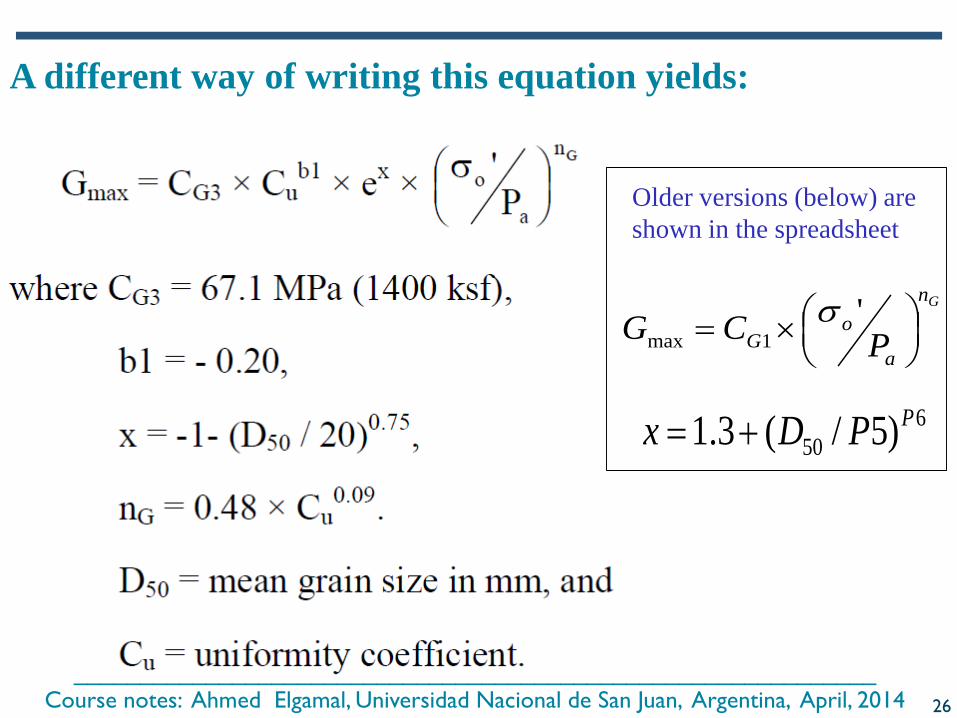
A different way of writing this equation yields:
Gn
a
oG PCG
×= '
1maxσ
650 )5/(3.1 PPDx +=
Older versions (below) are shown in the spreadsheet
26
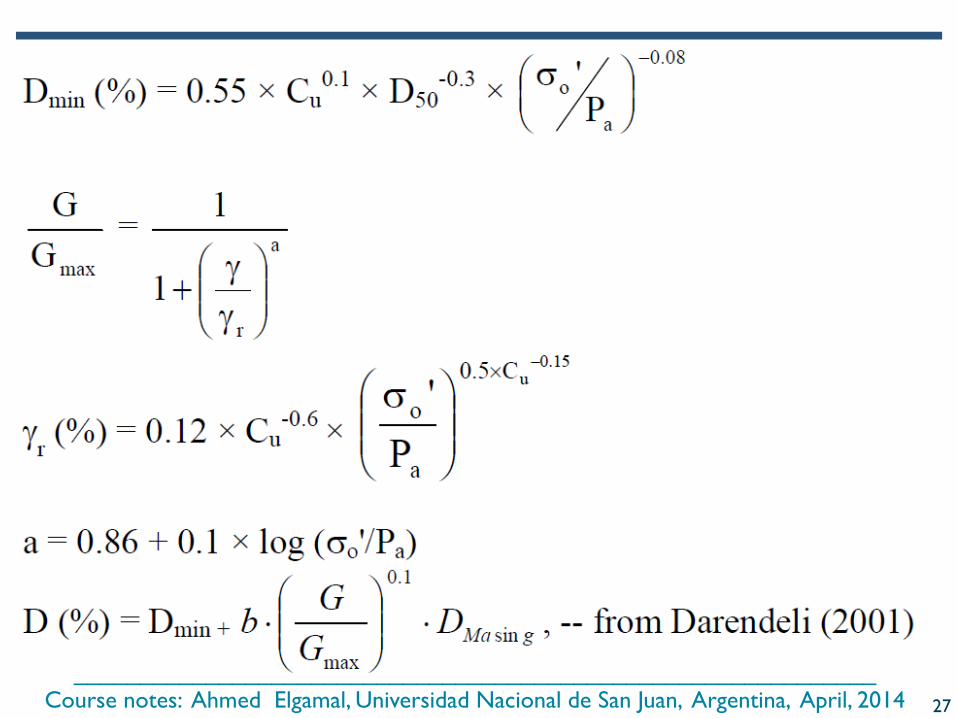
_____________________________________________________________Course notes: Ahmed Elgamal, Universidad Nacional de San Juan, Argentina, April, 2014 27
_____________________________________________________________Course notes: Ahmed Elgamal, Universidad Nacional de San Juan, Argentina, April, 2014
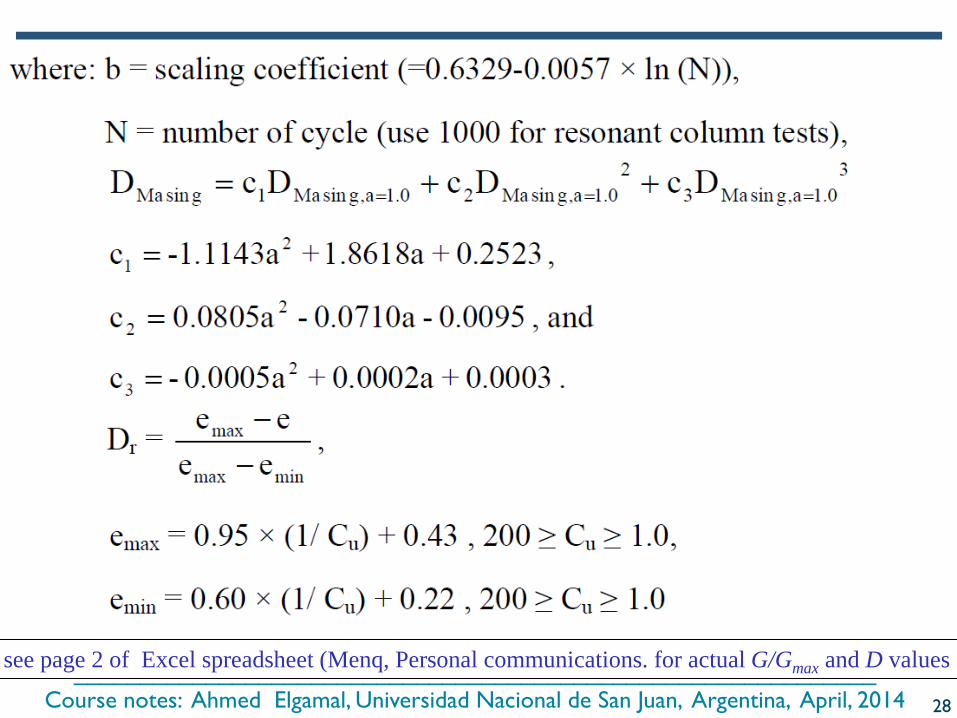
see page 2 of Excel spreadsheet (Menq, Personal communications. for actual G/Gmax and D values
28

_____________________________________________________________Course notes: Ahmed Elgamal, Universidad Nacional de San Juan, Argentina, April, 2014
Related to the Excel Spreadsheet (from: Menq, Farn-Yuh, Ph. D.):Note: Please consider using Darendeli’s model if PI is greater than 0, and Menq’smodel if PI = 0.The first page of the spreadsheet is for Darendeli’s model (2001). You can input the following values to obtain G/Gmax and Damping curves:frq(Hz)PIOCRσo' (atm)
The second page of spreadsheet is the equation of the Menq model (2003). G/Gmax and Damping curves for different soils with different Cu is presented in the following 4 spreadsheets.Note: Cu is the Uniformity Coefficient (measure of the particle size range)Cu is also known as the Hazen CoefficientCu = D60/D10Cu < 5 ----- Very UniformCu = 5 ----- Medium UniformityCu > 5 ----- Non-uniform
Note: On the Menq (2003) page, if you change the the Cu =2 to Cu = 30 for instance, you will find the corresponding values of G/Gmax and D% in the page of Cu=2. For instance if you change the Cu =2 to Cu = 30, in the G/Gmax or D summary pages, you will see the Cu=2 now falls on the Cu = 30 curve.Also note that some values in the Menq (2003) page only affect Gmax itself such as the void ratio eSee also: http://repositories.lib.utexas.edu/handle/2152/779 (link to Dr. Menq’s PhD Thesis)
29
_____________________________________________________________Course notes: Ahmed Elgamal, Universidad Nacional de San Juan, Argentina, April, 2014
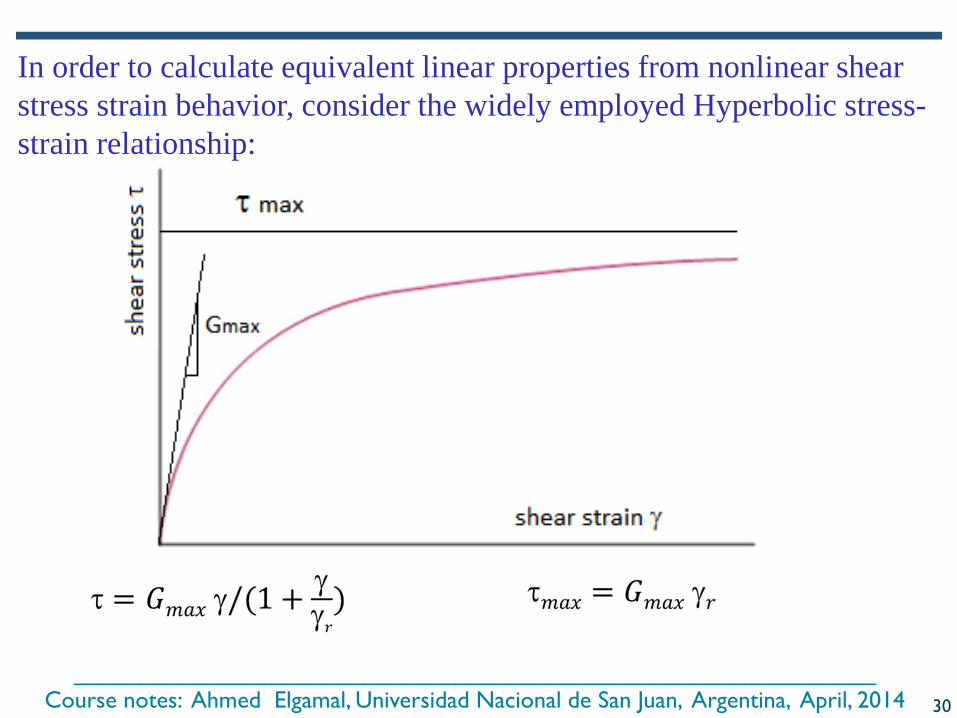
In order to calculate equivalent linear properties from nonlinear shear stress strain behavior, consider the widely employed Hyperbolic stress-strain relationship:
30
_____________________________________________________________Course notes: Ahmed Elgamal, Universidad Nacional de San Juan, Argentina, April, 2014
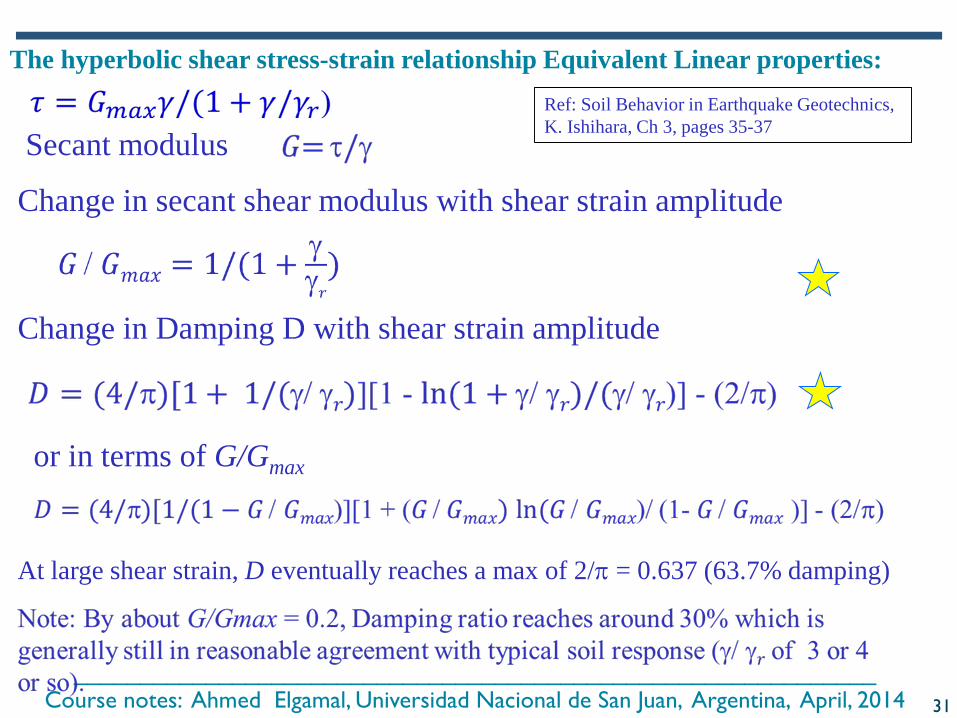
Secant modulus
Change in secant shear modulus with shear strain amplitude
The hyperbolic shear stress-strain relationship Equivalent Linear properties:
Change in Damping D with shear strain amplitude
or in terms of G/Gmax
At large shear strain, D eventually reaches a max of 2/π = 0.637 (63.7% damping)
Ref: Soil Behavior in Earthquake Geotechnics, K. Ishihara, Ch 3, pages 35-37
31
_____________________________________________________________Course notes: Ahmed Elgamal, Universidad Nacional de San Juan, Argentina, April, 2014
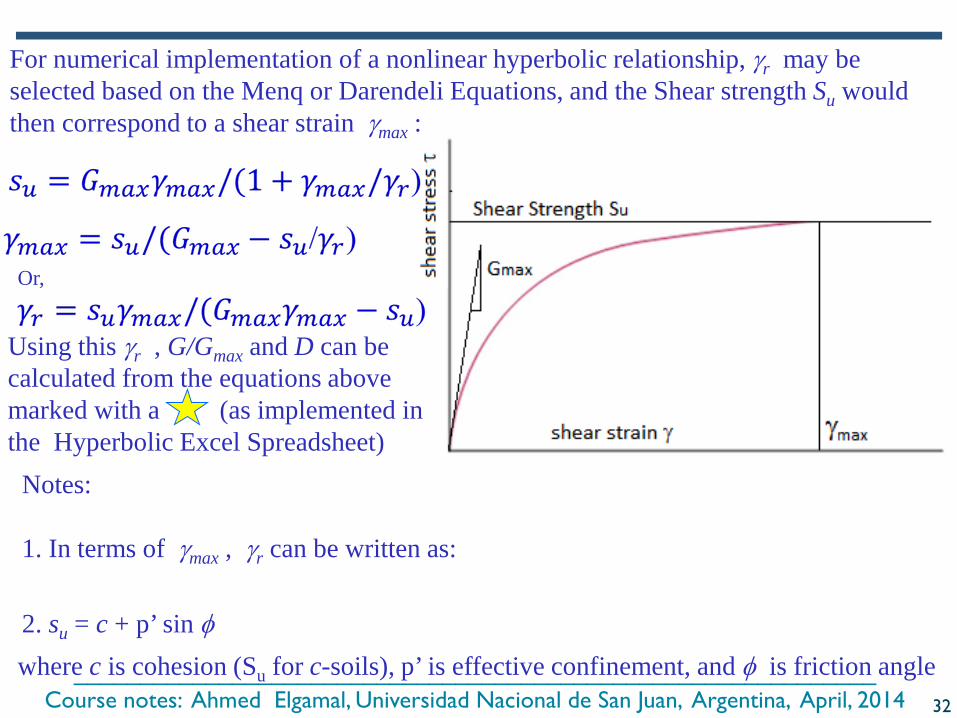
For numerical implementation of a nonlinear hyperbolic relationship, γr may be selected based on the Menq or Darendeli Equations, and the Shear strength Su would then correspond to a shear strain γmax :
Notes:
1. In terms of γmax , γr can be written as:
Using this γr , G/Gmax and D can be calculated from the equations above marked with a (as implemented in the Hyperbolic Excel Spreadsheet)
2. su = c + p’ sin φwhere c is cohesion (Su for c-soils), p’ is effective confinement, and φ is friction angle
Or,
32

_____________________________________________________________Course notes: Ahmed Elgamal, Universidad Nacional de San Juan, Argentina, April, 2014
Examples of User-friendly Computer Programs
33

_____________________________________________________________Course notes: Ahmed Elgamal, Universidad Nacional de San Juan, Argentina, April, 2014
DEEPSOIL (For XP and Windows 7)www.illinois.edu/~deepsoil
This slide contributed by Professor Youssef Hashash
34

_____________________________________________________________Course notes: Ahmed Elgamal, Universidad Nacional de San Juan, Argentina, April, 2014
DEEPSOIL SUMMARYwww.illinois.edu/~deepsoilNon-linear analysis
Hyperbolic hysteretic pressure dependent soil model Flexible sub-incrementation scheme to allow for accurate & efficient analysis Advanced damping formulations to reduce numerically introduced artificial damping
Equivalent Linear Analysis (a.k.a. SHAKE method)
Unlimited number of soil layers of varying material properties Unlimited number of input motion data points Two types of complex shear modulus Improved numerical accuracy
This slide contributed by Professor Youssef Hashash
35
_____________________________________________________________Course notes: Ahmed Elgamal, Universidad Nacional de San Juan, Argentina, April, 2014
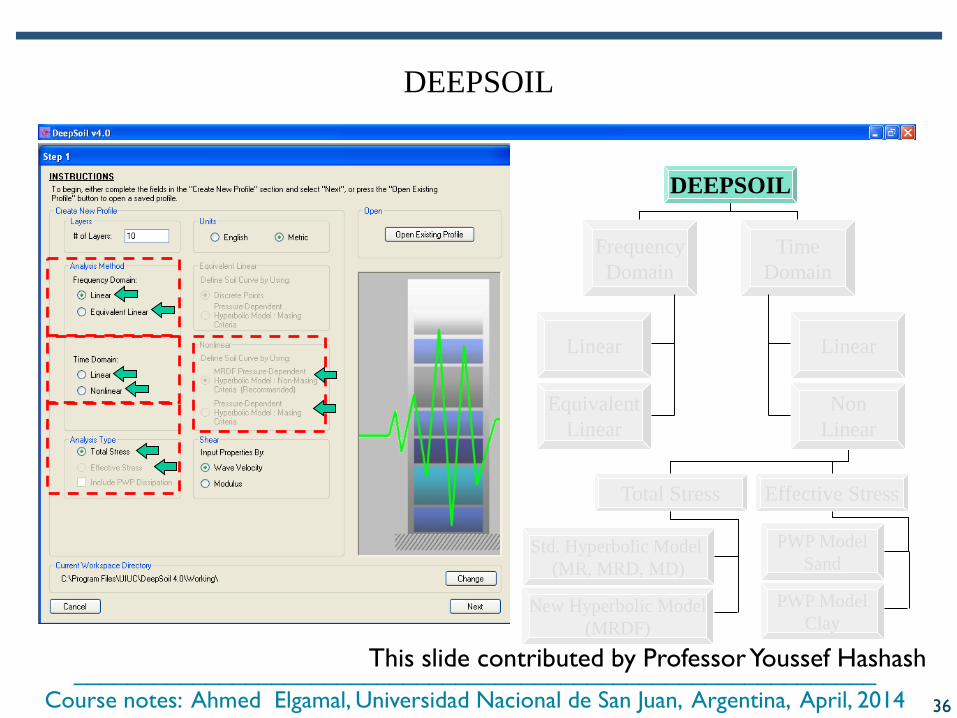
DEEPSOIL
FrequencyDomain
Time Domain
Linear
Equivalent Linear
Total Stress Effective Stress
Std. Hyperbolic Model (MR, MRD, MD)
New Hyperbolic Model(MRDF)
PWP ModelSand
PWP ModelClay
Linear
Non Linear
DEEPSOIL
This slide contributed by Professor Youssef Hashash
36
_____________________________________________________________Course notes: Ahmed Elgamal, Universidad Nacional de San Juan, Argentina, April, 2014
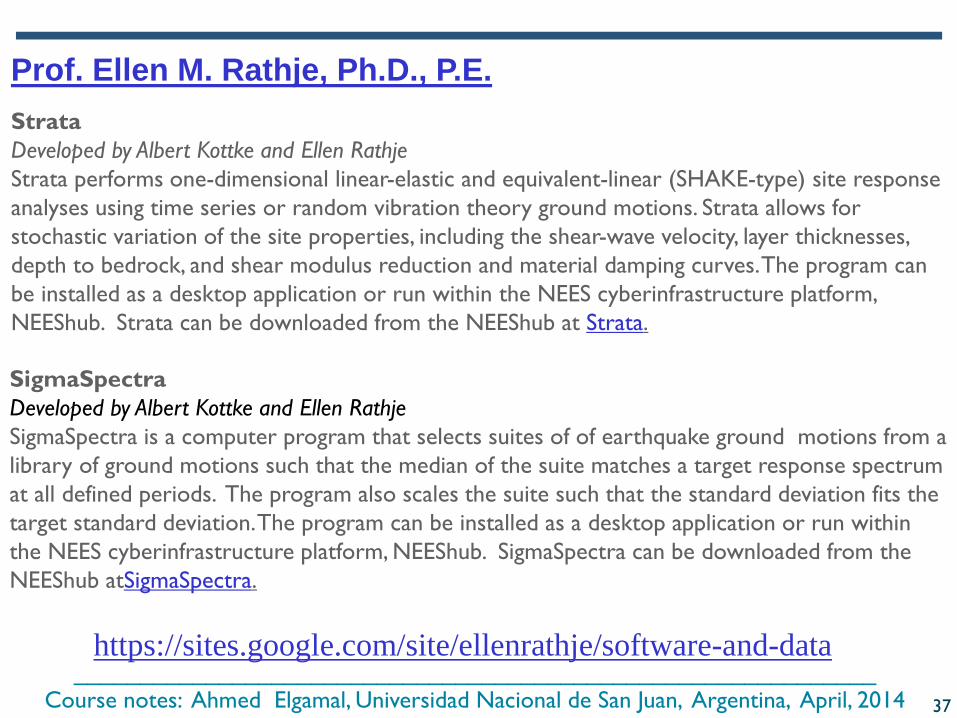
StrataDeveloped by Albert Kottke and Ellen RathjeStrata performs one-dimensional linear-elastic and equivalent-linear (SHAKE-type) site response analyses using time series or random vibration theory ground motions. Strata allows for stochastic variation of the site properties, including the shear-wave velocity, layer thicknesses, depth to bedrock, and shear modulus reduction and material damping curves.The program can be installed as a desktop application or run within the NEES cyberinfrastructure platform, NEEShub. Strata can be downloaded from the NEEShub at Strata.
SigmaSpectraDeveloped by Albert Kottke and Ellen RathjeSigmaSpectra is a computer program that selects suites of of earthquake ground motions from a library of ground motions such that the median of the suite matches a target response spectrum at all defined periods. The program also scales the suite such that the standard deviation fits the target standard deviation.The program can be installed as a desktop application or run within the NEES cyberinfrastructure platform, NEEShub. SigmaSpectra can be downloaded from the NEEShub atSigmaSpectra.
Prof. Ellen M. Rathje, Ph.D., P.E.
https://sites.google.com/site/ellenrathje/software-and-data
37
_____________________________________________________________Course notes: Ahmed Elgamal, Universidad Nacional de San Juan, Argentina, April, 2014
SLAMMERDeveloped by Randall Jibson, Ellen Rathje, Matthew Jibson, and Yong-Woo LeeSLAMMER performs a variety of sliding-block analyses to evaluate seismic slope performance. Functionalities include both rigorous and simplified analyses of rigid sliding blocks (i.e. Newmark analysis) and flexible sliding blocks (i.e. decoupled and fully coupled approaches). Rigorous analyses calculate displacement based on user-specified ground motions, while simplified analyses use empirical regression relationships to predict displacement based on ground motion parameters (e.g., peak ground acceleration). The nonlinear response of the soil within the flexible sliding blocks can be taken account through the equivalent-linear approximation. A large database of recorded ground motions from the PEER Ground Motion Database are included with the program or users can import their own ground motion for analysis. The program can be installed as a desktop application or run within the NEES cyberinfrastructure platform, NEEShub. Slammer can be downloaded from the USGS at SLAMMER (download) or accessed on the NEEShub at SLAMMER (NEEShub).
https://sites.google.com/site/ellenrathje/software-and-data
38
_____________________________________________________________Course notes: Ahmed Elgamal, Universidad Nacional de San Juan, Argentina, April, 2014
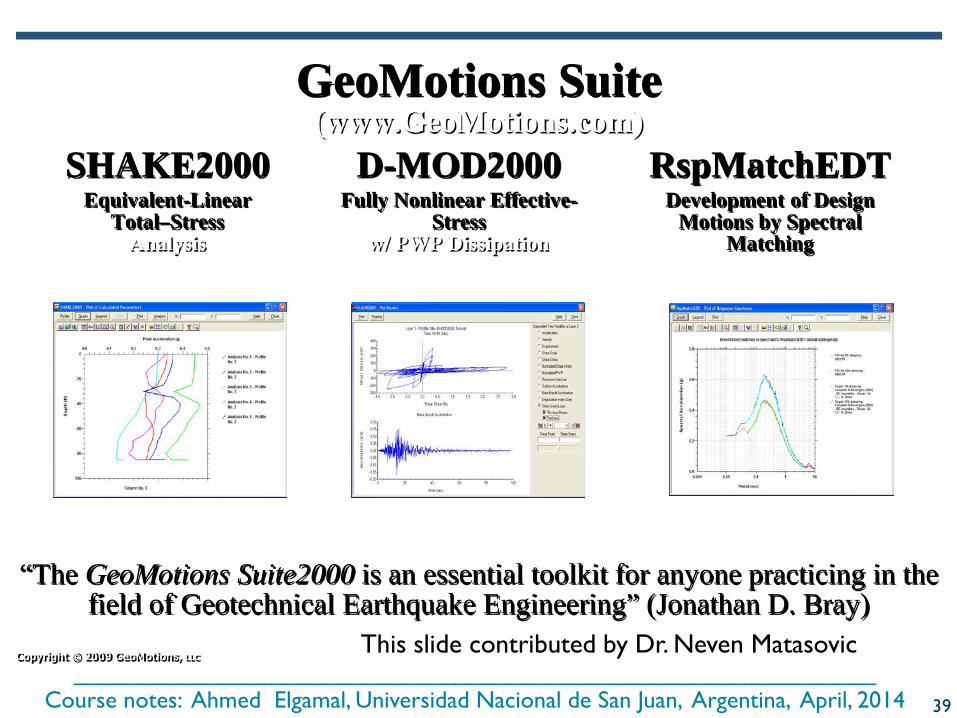
“The GeoMotions Suite2000 is an essential toolkit for anyone practicing in the field of Geotechnical Earthquake Engineering” (Jonathan D. Bray)
GeoMotions Suite(www.GeoMotions.com)
SHAKE2000 D-MOD2000 RspMatchEDTEquivalent-Linear
Total–StressAnalysis
Fully Nonlinear Effective-Stress
w/ PWP Dissipation
Development of Design Motions by Spectral
Matching
Copyright © 2009 GeoMotions, LLCThis slide contributed by Dr. Neven Matasovic
39

_____________________________________________________________Course notes: Ahmed Elgamal, Universidad Nacional de San Juan, Argentina, April, 2014
Pre-Processing(Target Spectra, Design Motions, Soil Profile, …)
Copyright © 2009 GeoMotions, LLCThis slide contributed by Dr. Neven Matasovic
40
_____________________________________________________________Course notes: Ahmed Elgamal, Universidad Nacional de San Juan, Argentina, April, 2014
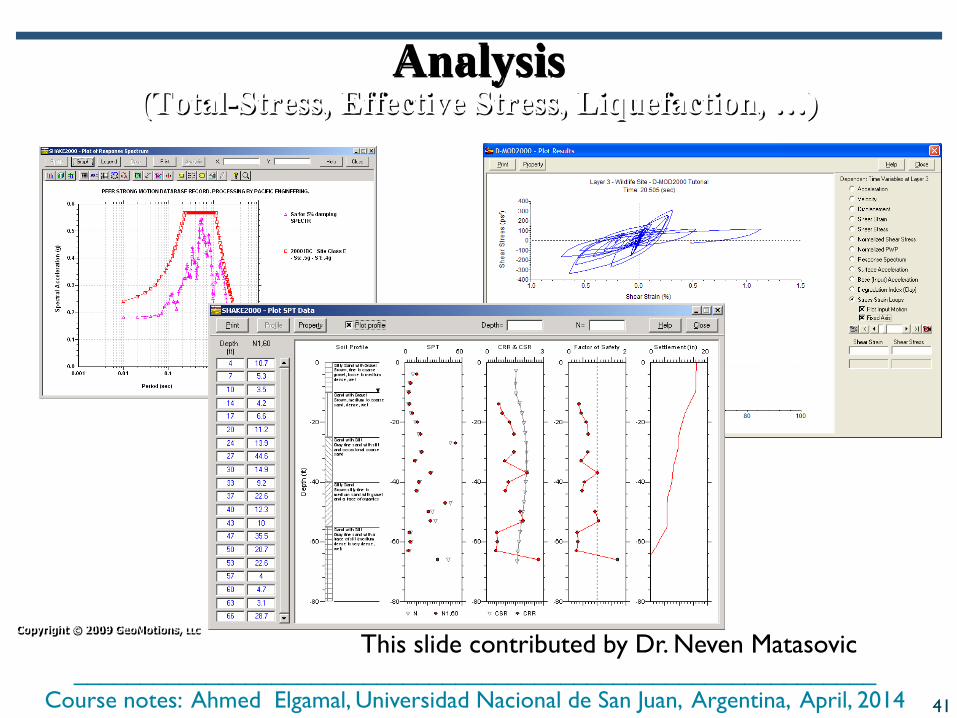
Analysis(Total-Stress, Effective Stress, Liquefaction, …)
Copyright © 2009 GeoMotions, LLC
This slide contributed by Dr. Neven Matasovic
41
_____________________________________________________________Course notes: Ahmed Elgamal, Universidad Nacional de San Juan, Argentina, April, 2014
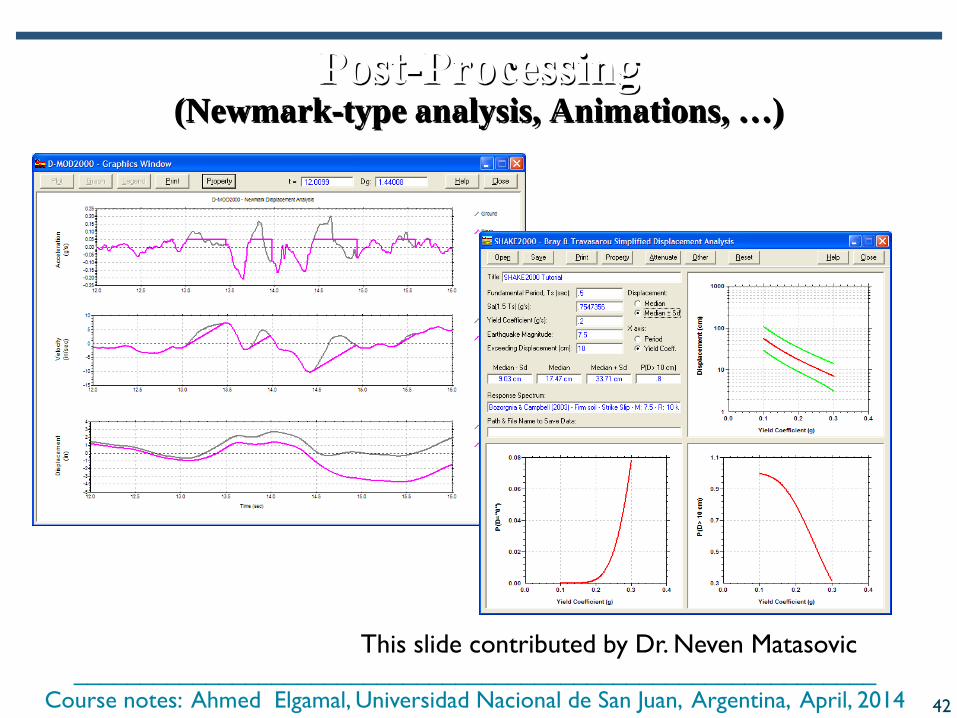
Post-Processing(Newmark-type analysis, Animations, …)
This slide contributed by Dr. Neven Matasovic
42

_____________________________________________________________Course notes: Ahmed Elgamal, Universidad Nacional de San Juan, Argentina, April, 2014
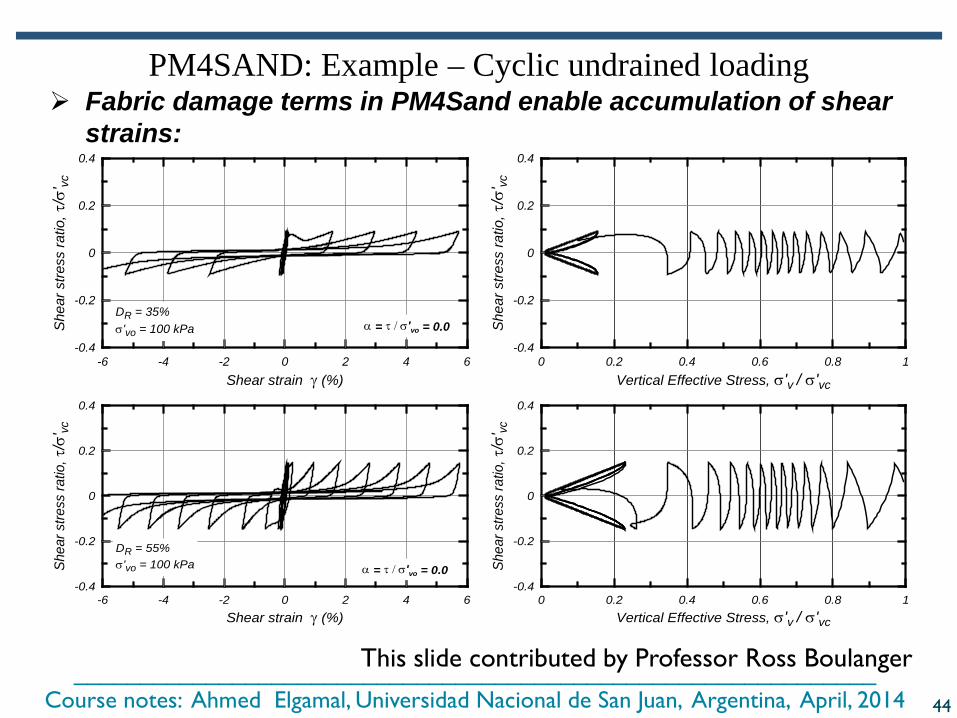
PM4Sand Stress-Strain Model• PM4Sand (Boulanger 2010, Boulanger & Ziotopoulou 2012) builds on the Dafalias &
Manzari (2004) model.• Modified & calibrated at equation level to improve consistency with body of experimental
data & design correlations
– Added fabric history, including cumulative fabric term– Plastic modulus (Kp), elastic modulus (G), and dilatancy
(D) depend on fabric and fabric history– D constrained by Bolton's (1986) dilatancy relationship– Recast in terms of relative state parameter index (ξR)– Modified logic for updating initial back-stress ratio– Neglects Lode Angle dependence
• Implemented as a user-defined material model in FLAC (Itasca 2011) and posted on-line.This slide contributed by Professor Ross Boulanger
43
_____________________________________________________________Course notes: Ahmed Elgamal, Universidad Nacional de San Juan, Argentina, April, 2014
-6 -4 -2 0 2 4 6Shear strain γ (%)
-0.4
-0.2
0
0.2
0.4
She
ar s
tress
ratio
, τ/σ
' vc
DR = 35%σ'vo = 100 kPa
0 0.2 0.4 0.6 0.8 1Vertical Effective Stress, σ'v / σ'vc
-0.4
-0.2
0
0.2
0.4
She
ar s
tress
ratio
, τ/σ
' vc
α = τ / σ'vo = 0.0
-6 -4 -2 0 2 4 6Shear strain γ (%)
-0.4
-0.2
0
0.2
0.4
Shea
r stre
ss ra
tio, τ
/σ' vc
DR = 55%σ'vo = 100 kPa
0 0.2 0.4 0.6 0.8 1Vertical Effective Stress, σ'v / σ'vc
-0.4
-0.2
0
0.2
0.4
Shea
r stre
ss ra
tio, τ
/σ' vc
α = τ / σ'vo = 0.0
Fabric damage terms in PM4Sand enable accumulation of shear strains:
PM4SAND: Example – Cyclic undrained loading
This slide contributed by Professor Ross Boulanger
44

_____________________________________________________________Course notes: Ahmed Elgamal, Universidad Nacional de San Juan, Argentina, April, 2014
Manual and documentation Element responses
illustrated for: DR = 35, 55, 75% σ′v of ¼, 1, 4, 16, & 64 atm Drained & undrained Simple shear & plane-
strain loading Monotonic, cyclic, and
post-cyclic. Purpose: know what you
model can, and cannot, do well.
PM4SAND
This slide contributed by Professor Ross Boulanger
45
_____________________________________________________________Course notes: Ahmed Elgamal, Universidad Nacional de San Juan, Argentina, April, 2014
OpenSees at UC Berkeley
46
_____________________________________________________________Course notes: Ahmed Elgamal, Universidad Nacional de San Juan, Argentina, April, 2014
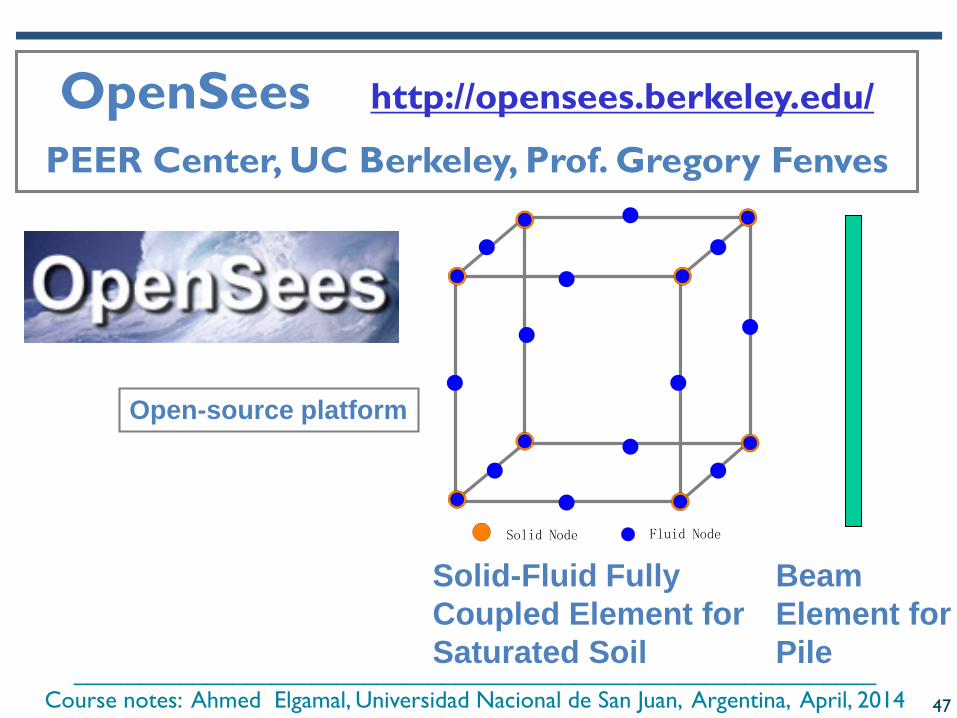
OpenSees http://opensees.berkeley.edu/
PEER Center, UC Berkeley, Prof. Gregory Fenves
Open-source platform
Solid Node Fluid Node
Beam Element for Pile
Solid-Fluid Fully Coupled Element for Saturated Soil
47
_____________________________________________________________Course notes: Ahmed Elgamal, Universidad Nacional de San Juan, Argentina, April, 2014
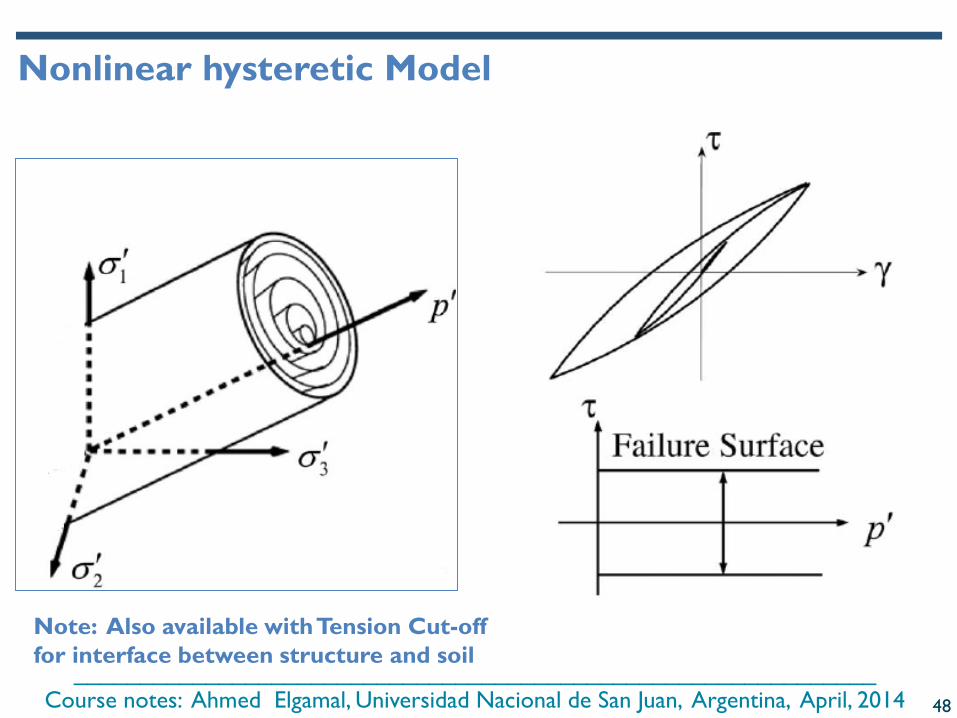
Nonlinear hysteretic Model
Note: Also available with Tension Cut-off for interface between structure and soil
48

_____________________________________________________________Course notes: Ahmed Elgamal, Universidad Nacional de San Juan, Argentina, April, 2014
Soil Constitutive Model Multi-yield surface plasticity model (based on Prevost 1985) Incorporating dilatancy and cyclic mobility effects
Conical yield surfaces for granularsoils (Prevost 1985; Elgamal et al.2003; Yang and Elgamal 2008)
Shear stress-strain and effectivestress path under undrained shearloading condition (Parra 1996, Yang2000, Yang and Elgamal 2002)
49
_____________________________________________________________Course notes: Ahmed Elgamal, Universidad Nacional de San Juan, Argentina, April, 2014
1 23 σ ′
2 23 σ ′ 3
23 σ ′
1σ ′
2σ ′3σ ′
0p′
p′
Principal effective stress space
Deviatoric plane
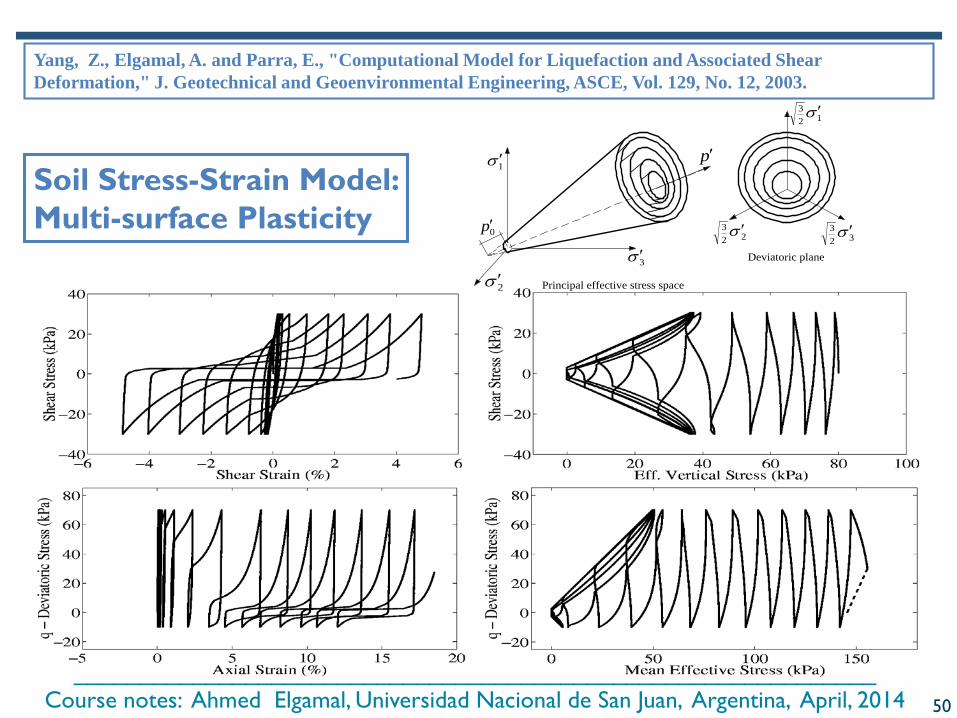
Soil Stress-Strain Model: Multi-surface Plasticity
Yang, Z., Elgamal, A. and Parra, E., "Computational Model for Liquefaction and Associated Shear Deformation," J. Geotechnical and Geoenvironmental Engineering, ASCE, Vol. 129, No. 12, 2003.
50
_____________________________________________________________Course notes: Ahmed Elgamal, Universidad Nacional de San Juan, Argentina, April, 2014
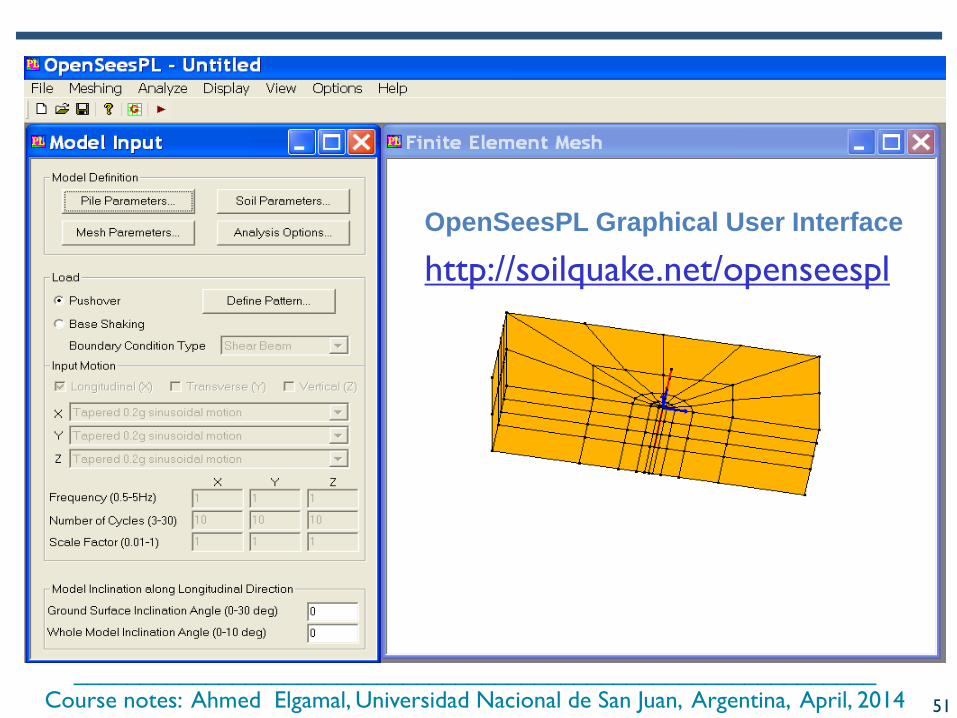
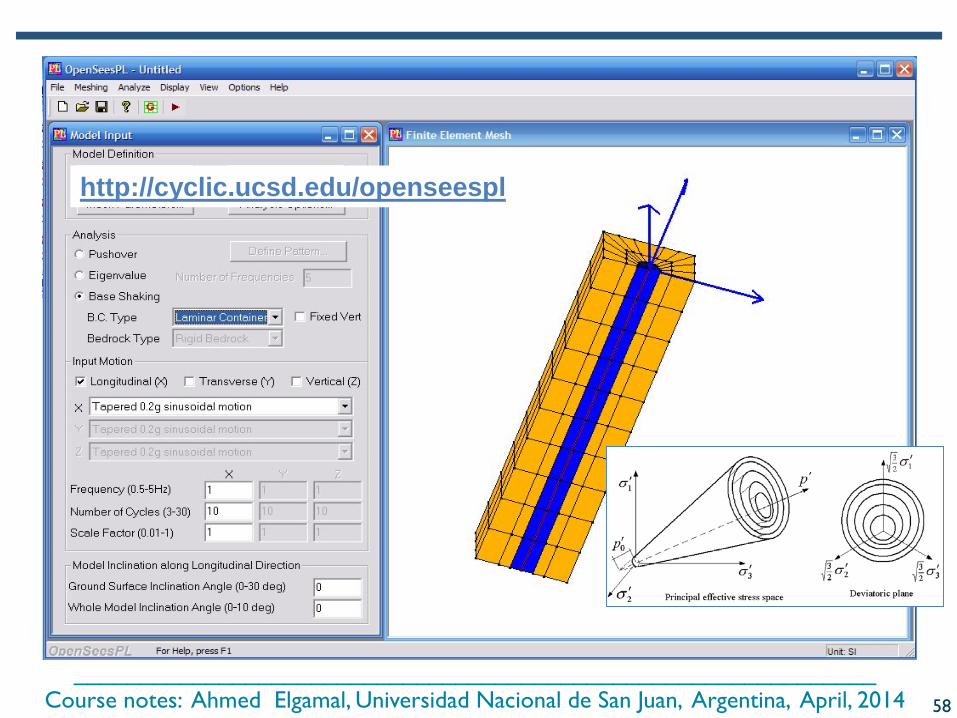
http://soilquake.net/openseesplOpenSeesPL Graphical User Interface
51
_____________________________________________________________Course notes: Ahmed Elgamal, Universidad Nacional de San Juan, Argentina, April, 2014
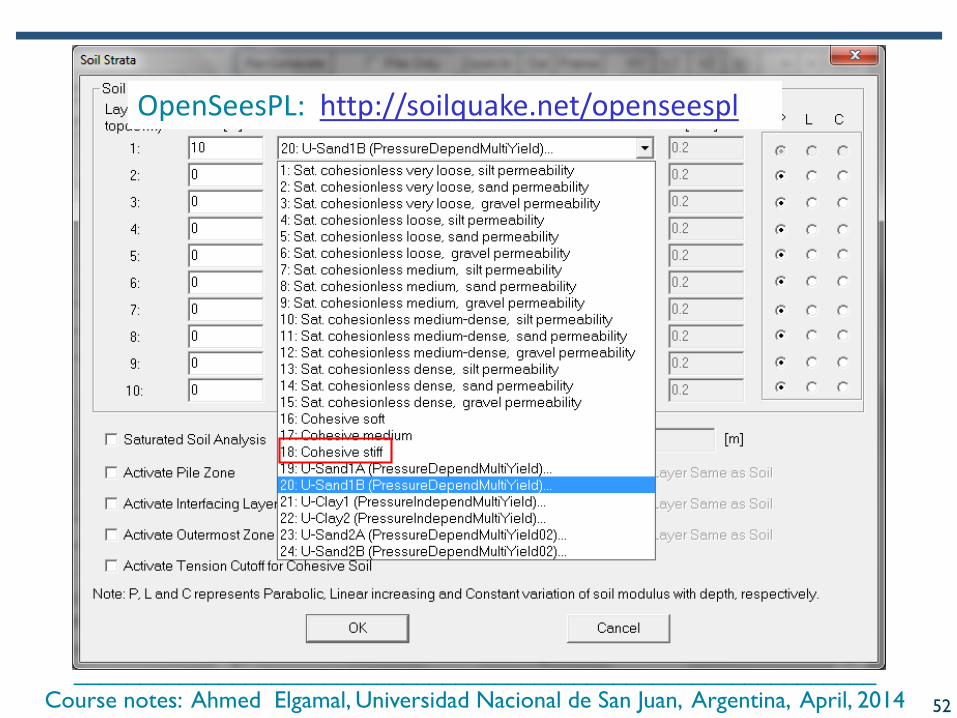
OpenSeesPL: http://soilquake.net/openseespl
52

_____________________________________________________________Course notes: Ahmed Elgamal, Universidad Nacional de San Juan, Argentina, April, 2014
OpenSeesPL: http://soilquake.net/openseespl
53
_____________________________________________________________Course notes: Ahmed Elgamal, Universidad Nacional de San Juan, Argentina, April, 2014
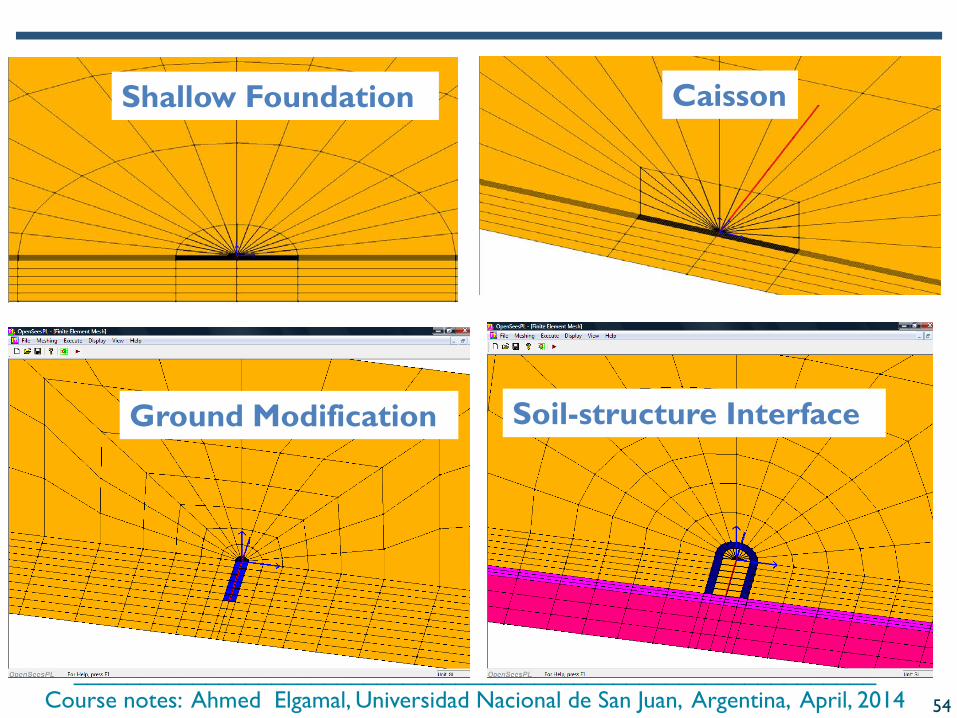
Shallow Foundation Caisson
Ground Modification Soil-structure Interface
54
_____________________________________________________________Course notes: Ahmed Elgamal, Universidad Nacional de San Juan, Argentina, April, 2014
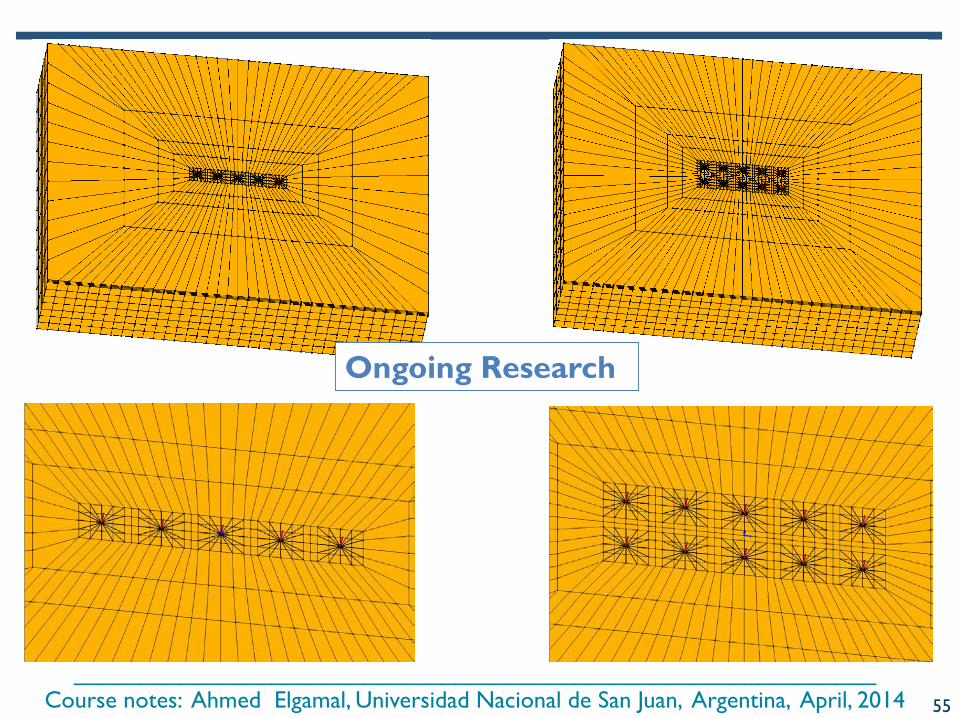
Ongoing Research
55
_____________________________________________________________Course notes: Ahmed Elgamal, Universidad Nacional de San Juan, Argentina, April, 2014
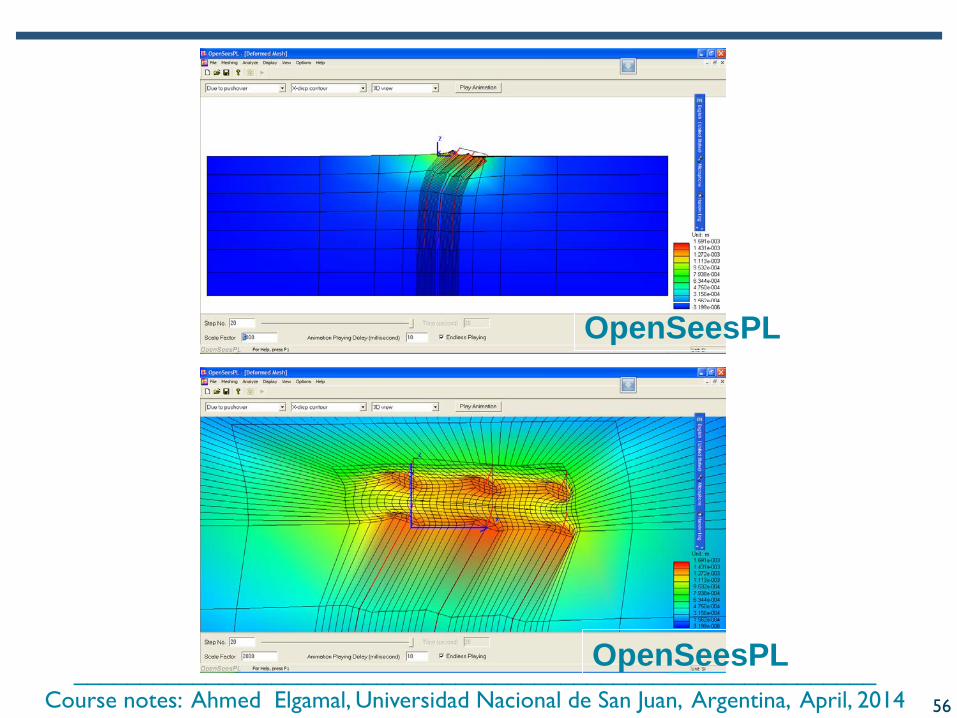
OpenSeesPL
OpenSeesPL56

_____________________________________________________________Course notes: Ahmed Elgamal, Universidad Nacional de San Juan, Argentina, April, 2014
Ground Modification- Gravel Drain/Stone column- Pile Pinning
Schematic view of stone column or pile-pinning layout
10 m depthSand Layer(or Silt Layer)
Mild Infinite Slope (4 degrees)57
_____________________________________________________________Course notes: Ahmed Elgamal, Universidad Nacional de San Juan, Argentina, April, 2014
http://cyclic.ucsd.edu/openseespl
58

_____________________________________________________________Course notes: Ahmed Elgamal, Universidad Nacional de San Juan, Argentina, April, 2014
BridgePBEE: PBEE Analysis Framework ForBridge-Abutment-Ground Systems (2-Span Bridge)
Ahmed Elgamal and Jinchi LuUniversity of California, San Diego
Kevin MackieUniversity of Central Florida
59

_____________________________________________________________Course notes: Ahmed Elgamal, Universidad Nacional de San Juan, Argentina, April, 2014
BridgePBEE: PBEE Analysis Framework ForBridge-Abutment-Ground Systems (2-Span Bridge)
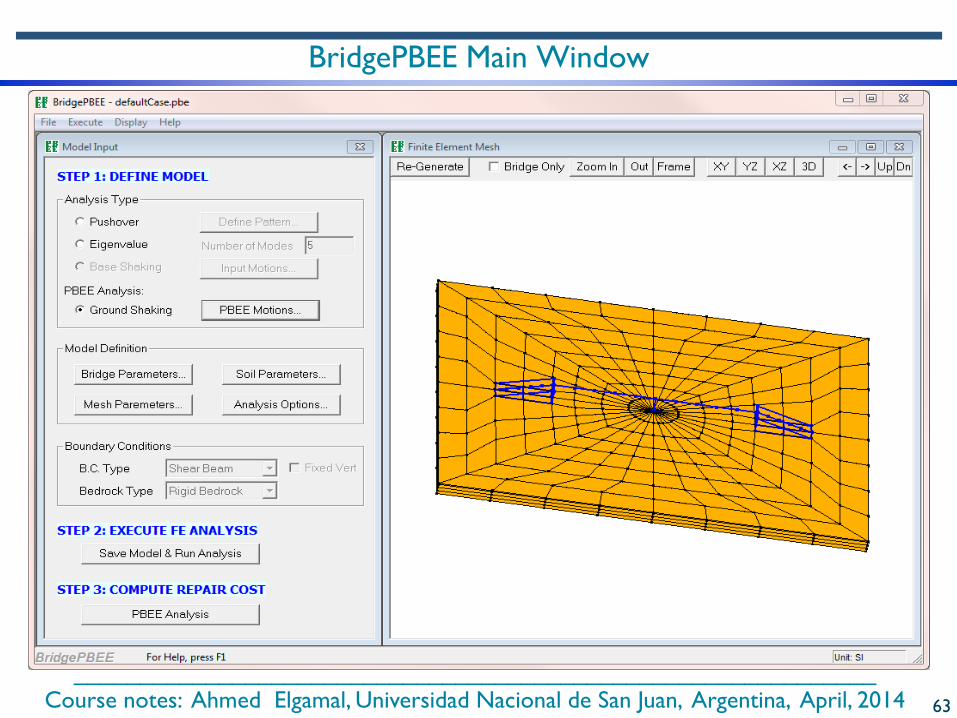
What is BridgePBEE
BridgePBEE* (http://peer.berkeley.edu/bridgepbee/)
BridgePBEE is a PC-based graphical pre- and post-processor (user-interface) for conducting Performance-Based Earthquake Engineering (PBEE) studies for bridge-ground systems (2-span single column).
The three-dimensional (3D) finite element computations are conducted using OpenSeesdeveloped by the Pacific Earthquake Engineering Research Center (PEER).
The analysis options available in BridgePBEE include (SI units in current version): 1) Pushover Analysis, 2) Base Input Acceleration Analysis, and 3) Full Performance-Based Earthquake Engineering (PBEE) Analysis.
*Lu, J., Mackie, K.R., and Elgamal, A. (2011). BridgePBEE: OpenSees 3D Pushover and Earthquake Analysis of Single-Column 2-span Bridges, User Manual, Beta 1.0.
60
_____________________________________________________________Course notes: Ahmed Elgamal, Universidad Nacional de San Juan, Argentina, April, 2014
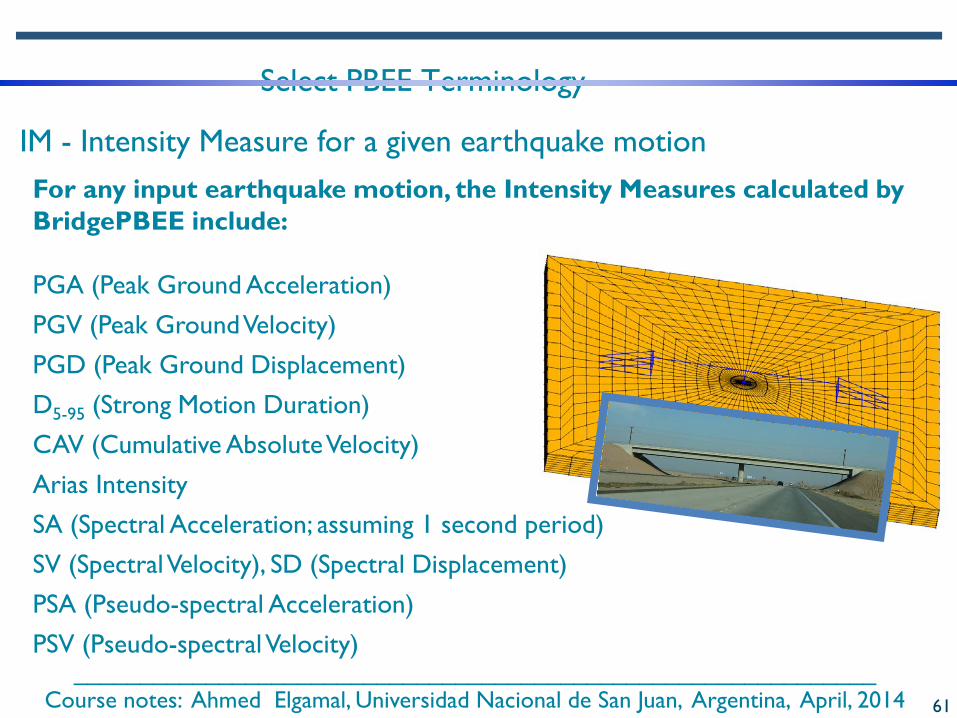
Select PBEE Terminology
IM - Intensity Measure for a given earthquake motionFor any input earthquake motion, the Intensity Measures calculated by BridgePBEE include:
PGA (Peak Ground Acceleration)PGV (Peak Ground Velocity)PGD (Peak Ground Displacement)D5-95 (Strong Motion Duration)CAV (Cumulative Absolute Velocity)Arias IntensitySA (Spectral Acceleration; assuming 1 second period)SV (Spectral Velocity), SD (Spectral Displacement)PSA (Pseudo-spectral Acceleration)PSV (Pseudo-spectral Velocity)
61
_____________________________________________________________Course notes: Ahmed Elgamal, Universidad Nacional de San Juan, Argentina, April, 2014
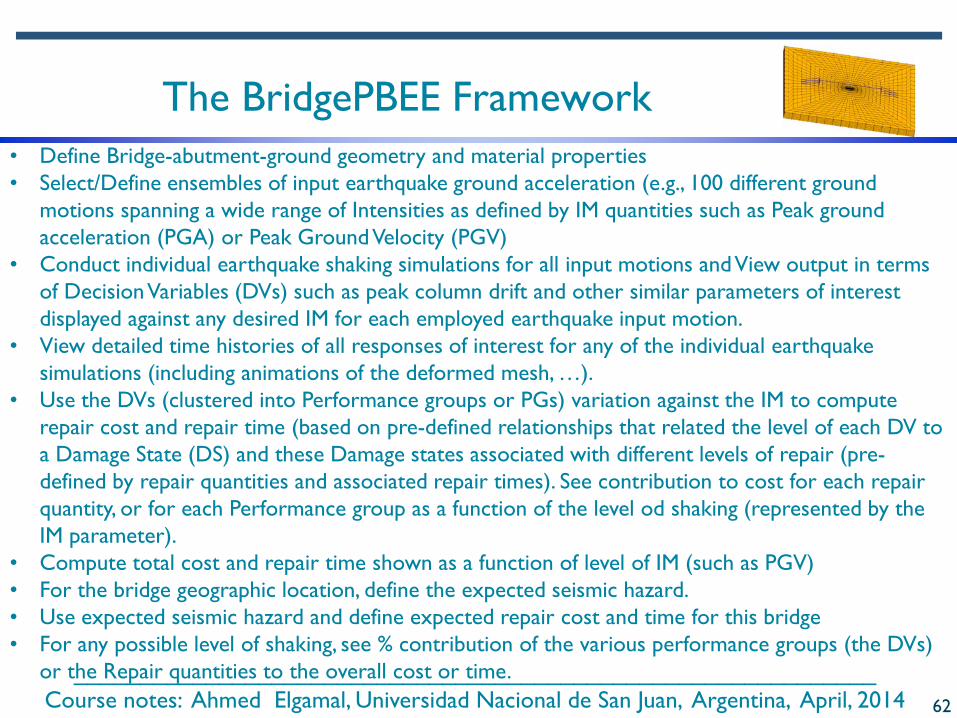
The BridgePBEE Framework• Define Bridge-abutment-ground geometry and material properties• Select/Define ensembles of input earthquake ground acceleration (e.g., 100 different ground
motions spanning a wide range of Intensities as defined by IM quantities such as Peak ground acceleration (PGA) or Peak Ground Velocity (PGV)
• Conduct individual earthquake shaking simulations for all input motions and View output in terms of Decision Variables (DVs) such as peak column drift and other similar parameters of interest displayed against any desired IM for each employed earthquake input motion.
• View detailed time histories of all responses of interest for any of the individual earthquake simulations (including animations of the deformed mesh, …).
• Use the DVs (clustered into Performance groups or PGs) variation against the IM to compute repair cost and repair time (based on pre-defined relationships that related the level of each DV to a Damage State (DS) and these Damage states associated with different levels of repair (pre-defined by repair quantities and associated repair times). See contribution to cost for each repair quantity, or for each Performance group as a function of the level od shaking (represented by the IM parameter).
• Compute total cost and repair time shown as a function of level of IM (such as PGV)• For the bridge geographic location, define the expected seismic hazard.• Use expected seismic hazard and define expected repair cost and time for this bridge• For any possible level of shaking, see % contribution of the various performance groups (the DVs)
or the Repair quantities to the overall cost or time.62
_____________________________________________________________Course notes: Ahmed Elgamal, Universidad Nacional de San Juan, Argentina, April, 2014
BridgePBEE Main Window
63

_____________________________________________________________Course notes: Ahmed Elgamal, Universidad Nacional de San Juan, Argentina, April, 2014
Appendix: Illustrative Examples of Large Scale Numerical Analyses
64
_____________________________________________________________Course notes: Ahmed Elgamal, Universidad Nacional de San Juan, Argentina, April, 2014
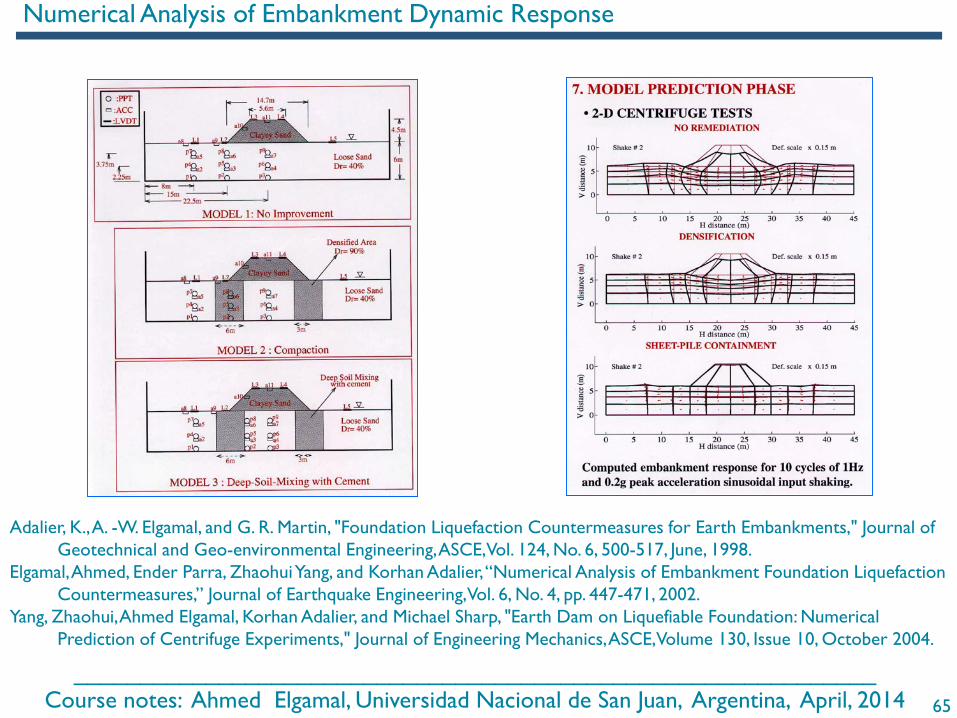
Numerical Analysis of Embankment Dynamic Response
Adalier, K., A. -W. Elgamal, and G. R. Martin, "Foundation Liquefaction Countermeasures for Earth Embankments," Journal of Geotechnical and Geo-environmental Engineering, ASCE, Vol. 124, No. 6, 500-517, June, 1998.
Elgamal, Ahmed, Ender Parra, Zhaohui Yang, and Korhan Adalier, “Numerical Analysis of Embankment Foundation Liquefaction Countermeasures,” Journal of Earthquake Engineering, Vol. 6, No. 4, pp. 447-471, 2002.
Yang, Zhaohui, Ahmed Elgamal, Korhan Adalier, and Michael Sharp, "Earth Dam on Liquefiable Foundation: Numerical Prediction of Centrifuge Experiments," Journal of Engineering Mechanics, ASCE, Volume 130, Issue 10, October 2004.
65

_____________________________________________________________Course notes: Ahmed Elgamal, Universidad Nacional de San Juan, Argentina, April, 2014
OpenSees 3D FE Model • 30,237 nodes• 1,140/280 linear/nonlinear beam-column elements• 81 linear shell elements• 23,556 solid brick elements• 1,806 zero-length elements
Transverse and Longitudinal Response3D Spatial ConfigurationAbutmentsPile FoundationsGround
Three-Dimensional Seismic Response of Humboldt BayBridge-Foundation-Ground System, A. Elgamal; L. Yan; Z. Yang; and J. P. Conte, Journal ofStructural Engineering, Vol. 134, No. 7, July 1, 2008.
66

_____________________________________________________________Course notes: Ahmed Elgamal, Universidad Nacional de San Juan, Argentina, April, 2014
Three-Dimensional Seismic Response of Humboldt Bay Bridge-Foundation-Ground System, A. Elgamal; L. Yan; Z. Yang; and J. P. Conte, Journal of Structural Engineering, Vol. 134, No. 7, July 1, 2008.
67
_____________________________________________________________Course notes: Ahmed Elgamal, Universidad Nacional de San Juan, Argentina, April, 2014
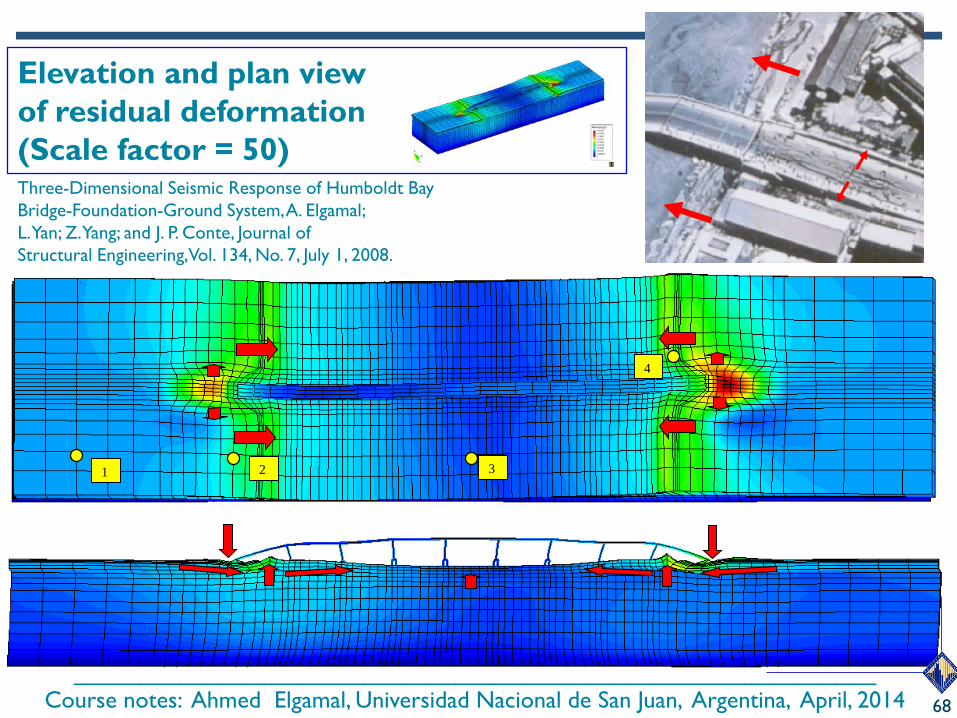
1 2 3
4
Elevation and plan view of residual deformation (Scale factor = 50)Three-Dimensional Seismic Response of Humboldt BayBridge-Foundation-Ground System, A. Elgamal; L. Yan; Z. Yang; and J. P. Conte, Journal ofStructural Engineering, Vol. 134, No. 7, July 1, 2008.
68
_____________________________________________________________Course notes: Ahmed Elgamal, Universidad Nacional de San Juan, Argentina, April, 2014
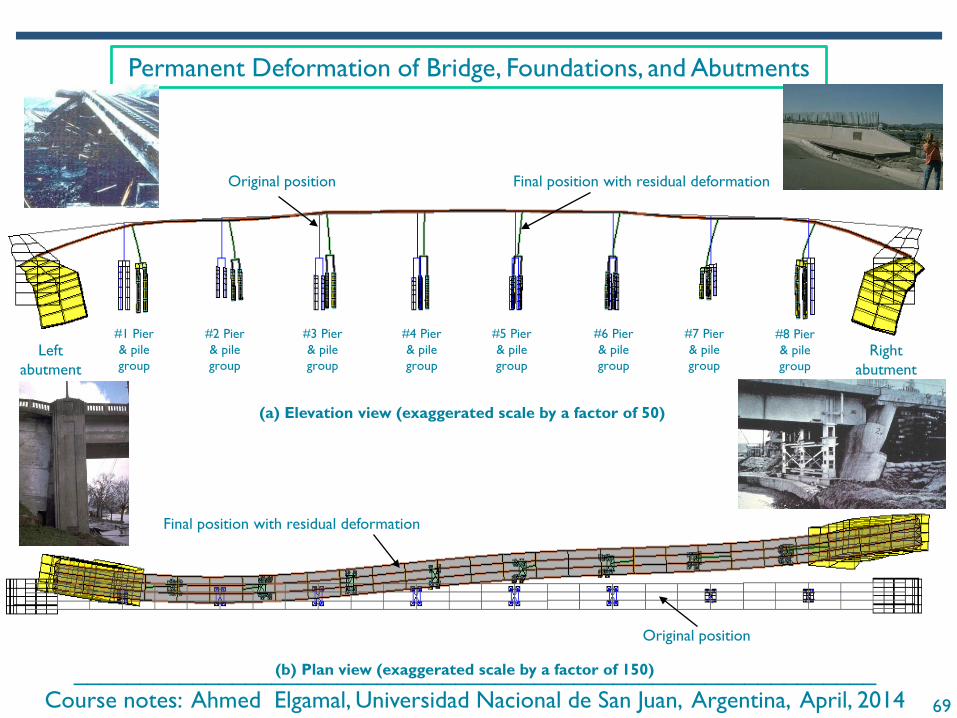
Permanent Deformation of Bridge, Foundations, and Abutments
Original position Final position with residual deformation
#1 Pier & pile group
#2 Pier & pile group
#3 Pier & pile group
#4 Pier & pile group
#5 Pier & pile group
#6 Pier & pile group
#7 Pier & pile group
#8 Pier & pile group
Leftabutment
Rightabutment
Original position
Final position with residual deformation
(a) Elevation view (exaggerated scale by a factor of 50)
(b) Plan view (exaggerated scale by a factor of 150)
69

_____________________________________________________________Course notes: Ahmed Elgamal, Universidad Nacional de San Juan, Argentina, April, 2014
(factor of 30)Contour lines show the longitudinal displacement in meters
Close-up of Final Deformed Mesh
Work by Elgamal and Lu
Case W3N-F
3D Slice of Wharf supported on pile foundation
70