seismic wave velocity as a means of in-place density
TRANSCRIPT

.r'
:ii I
fi ~-
t::;.:--=--·-·---··
TAl roBp··
581-S .J?ii;i,~~
ENGINEERING
RESEARCH INSTITUTE
IOWA STATE
UNIVERSITY
AMES, IOWA
. .\
(
l
;''
~' '
.; If
'" '·!
" ... .t! .•• t
., ......
11 ~1 r-·1
! ' _;:,:·;.,\\ ! !: q !'i u \>~i ..
f (:~~! : 1-- I
l \. ___ , !.. -~. •
; .. ·:1::-:::~~~A
~~.~.::zi'P
.·.·.
,,
'.
-The opinion's, findings and conclusions expressed in this publication are those of the authors and not necessarily those· of the Iowa State Highway Commission nor the Bureau of Public Ro1:1ds. ERi - 479 . Proje_ct - 581 - S
E~~G- B_ N' ~CC[?J~_J~~Gr~. !lh .P.b~~'\~h11 .
RE EARCH ENGINEER~NG RE EARC~~
--
f~NAl REPORT - PART 2 Of 2 - - .
SEIS~~~c w~ \IE V_ElOCrfY AS A MEA~S Of ~N-?lACE DE~S~il. MEASUREMENT . '
Project HR -114 of the
Iowa Highway Research Board
condui;:ted by Engineering Research Institute,
Iowa State University ·fur ~
Iowa State Highway Commission
in cooperation with Federal Highway
Administration Bureau of Pub I ic Roads
Co-Project Dfrectors J.M. Hoover, Associate Professor of Civil Engineering
R.L. Handy, Professor of Ci vi I Engineering
Contribution No. 68 - 8b of the Soil Research Laboratory.
RESEARCH !NSTIH.llE
IOWA STATE UNIVERSHV AMES

..
SEISMIC WAVE VELOCITY AS A MEANS OF IN-PLACE DENSITY MEASUREMENT
J. M. Hoover and R. L. Handy
INTRODUCTION
As noted in Part 1 of this report, the objective of the investigation
was to apply principles of first-arrival seismic refraction to the
problem of more quickly determining in-place dry density in highway
materials. Part 1 of the report indicated the following generalized con
clusions based on laboratory and limited field tests:
1. Seismic velocity versus moisture content curves for laboratory
compacted soil specimens were similar in shape to dry density
versus moisture content curves but peaked out at a lower
moisture content.
2. ·The method did not appear usable for measurements of density
when the moisture content greatly exceeded the optimum for
compaction.
3. Seismic tests should be conducted immediately after compaction
or the results may be meaningless due to an apparent gradual
absorption of pore water into expandable interlayer regions of
the clays, thus flattening the velocity versus moisture con
tent curve.
Part 2 of the report, contained herein, presents the results of both
additional laboratory development of test techniques, plus extenstve field
test data. For the benefit of the reader and to avoid unnecessary
repetition of information, all figures,· tables and refe'):ences are numbered
in a sequence continuing from Part 1.
2
EQUIPMENT MODIFICATION
As noted in Part 1, modifications to the first timing system used
in the project (Model MD-3 Refraction Timing Unit, Fig. 1) consisted
·primarily of changing the impact s,ource, the energy coupling with the
soil,. and the timing circuitry, in an attempt to accomplish the follow
ing:
a. Utilize the timer with laboratory specimens with a maximum
travel distance of 4-1/3 in.
b. Improve reproducibility of results.
Use of a miniature drop hanuner gave some improvement, but most of the
modifications failed to alleviate the problems. A major difficulty
. was in adapting the geophone to detect reliable first-arrival waves
through a laboratory Proctor specimen.
The second refraction system, a Model 217 Micro-Seismic Timer,
Figs. 2, 3, and 4 employed a stable oscillator measuring time in
microseconds and a crystal phonograph cartridge and needle as the detector.
This gave much more reproducible results when a flathead 'W'ire pin was
driven flush into the soil and the needle pickup was placed in direct
contact with the head of the pin.
During the initial portion of the field tests presented later in
this report, it was noted that the impact source and the use of pins or
no pins at the pick.up had a definite effect on reproducibility of results.
It was therefore decided to develop a more constant energy input to
maintain a more constant initial amplitud.e ·at the impact source, so the
3
amplitude received by the needle would trigg·er the threshold of the
timer at the same instant of energy pulse.
13 Mereu et al., using steel spheres both as couplers and falling
impact weights, proposed a relationship between the amplitude of the
seismic wave and the velocity attained by the embedded coupler after
impact:
A = K V c
where
A = runplitude of seismic wave
K = a proportionality constant
V maximllln speed of the embedded coupler. c
Using simple collision theory the above expression becomes
A = K(l + e) m u M+m
where
e = coefficient of restitution between coupler and impact device
m = mass of impact device
M mass of coupler
u = speed of falling weight at time of impact.
Using ·the principles noted above, but employing an impact device consist~·
ing of a rotating instrument rather than a falling weight, the expression
becomes
A = K(l m + e) (aw) M(.§:.)2 + m
r

where
4
a == distance from point of gyration to point of impact
r == radius of gyration with respect to the axis of gyration
w == angular velocity.
A rotating harrnner was constructed, utilizing much the same drop action
princip_le as a liquid limit device, except that the cup was replaced
by a steel bar, the tip of which dropped on a steel sphere embedded
in the soil.
A series of tests was conducted using a beam sample of soil, an
oscilloscope, the rotating hammer, several sizes of spherical couplers,
and the Micro-Seismic Timer pickup unit, Fig. 3. Wave shapes were
repeatable for each combination of coupler and same relative position
of impact source and pickup unit.
Since an oscillosc6pe is not the most desirable apparatus for field
testing purposes, a similar study was conducted in cooperation with the
ERI Electronics Shop, substituting the timer for the oscilloscope. It
was determined that the. threshold level of the timer was too wide to
provide the amplitude discrimination required to accomplish fully con,-
s istent timer readings.
Consequently, the rotating hammer was found unsuitable for use in the
field test'program then underway, and was abandoned in favor of continued
field use of the small brass hammer.

..
5
FIELD TESTS
In cooperation with Iowa State Highway Commission and various County
Engineer personnel, twenty-six field tests were conducted throughout
the state. Table 3 presents a summary of the general location, pavement
structure, tests conducted, and classification of materials involved. Note
that the soils encountered ranged from A-1-a to muck classifications, and
included asphalt-treated base materials.
The concept of this portion of the project was to establish, as
realistically as possible, the conditions of test encountered by field
inspectors. The following procedures were adopted.
1. Seismic test. Conducted with the Model 217 Micro-Se.ismic Timer,
using the hand-held brass hammer as impact source on a 3/4-in.
diam. steel ball coupler. Contact between pickup needle and soil
was a flathead pin. Triggering of the timer unit was created
by completion of electrical circuitry at the instant of impact
between hammer and coupler as shown in Fig. 2 ~ith the
exception that the aluminum foil was eliminated, one side of the
circuit being connected directly to the ball. The ball was
initially forced one-half its diameter into the material to ,.
be tested. A series of 10 to 15 blows and observed times, in
microseconds, were recorded for each. 3.00-in. distance up to 2.00
ft from impact source to pickup unit. The pickup unit was main-
tained in one position, while the coupler was moved the required
distances.~·(
1(It was evident early in the field tests that considerable time was requ:Lred to move and adjust the pickup unit so that its needle was in proper contact with each pin.
Table 3c Field test sites, materials, and classifications.
No. of .No. of Sam,.-ole Pavement Generalized Material eeismic in-place density AAS HO
no. Location otructure ra.aterial additives tests tests L.L.(%) P.!(%) Classification ..
l Carroll C.O. Base Soil-agg. Asphalt emulsion 2 2 N.D. (b) N.D. (b) N.D. (b)
2 Story Co. Sub grade Till 7 5 20.6 6.2 A-4(2) I-35
3 WTight Co. Subgratle Soil-peat-agg. 9 5 62.2 32.3 A-7-6(13) 4 Polk Co. Base Soil-agg. Primed 6 2 24.3 9.9 A-4(1) 5 Polk Co. Base· Soil-agg. Primed 6 3 30.5 12.2 A-6(2)
6 Cerro Gordo Subgrade Soil-agg. 6 3 ·N.P. A-1-a 7 Cerro GOrdo Base Soil-agg. 4 2 31.0 10.2 A-4(1) 8 Ho-aard Co. Sub-base Soil-agg. 6 3 36.8 14.7 A-6(7) 9 Fayette Co. Base Soil-agg. 6 3 32.3(b) 14.lf(b) A-2-~~p
10 Fayette C-0. Base Rot-'.!tlx Asph!!J,lt 15 lO(a) N.D. N.D. N.D.
11 Polk-D.!1. Freeway Ba:;ie Soil-agg. 9 7 N.P. A-1..:a
12 Cherokee Co. Base Soil-agg. Primed 10 4 37.8 15.6 A-6(2) CJ°\
13 Cherokee Co. Base Soil-agg. 30 20 (a} 31.3(b) 11.3 (b) A-2-6(0)
14 Plymouth Co. Base Cold-mix Asphalt 6 3-3(a) N.D. N.D. N.D. (b) 15 Siou..'l: Co. Sub-base Soil-agg. 4 3 39.1 16.6 A-6(4)
16 Hamilton Co. Base Soil-agg. l;(c) 4-S(a) 22.6(b) 6.~(b) A-2-4
17 Louisa Co. Levee Organic clay(c) N.D. N.D. N.D. (b) 18 Mahaaka Co. Sub-base Clayey silt Pri.m£d 6(d) 3 46.9 (b) 20,S(b) A-7-6(4) 19 Mahaska Co, Base Hot-mix Asphalt 5 N.D. N.D. N.D. (b)
20 Clark Co. EmbanJ,:ment Clay 4 3 41.2 21. 7 A-7-6(7) Ia. 34
21 Adair Co. Sub-base Clayey sand 5 1 27.3(b) 12 .1 (b) A-2-6(0) 22 Adair Co. Base Hot-mix Allphalt 5 s(a)
N.D. (b) N.D. (b) N.D. ~g~ . 23 Adair Co. Bwe Soil-agg. Primed 3 2 N.D. N.D. N.D. 24 Milla Co. Emb=lm::ent Loe as 7 7 33.4 13.6 A-6(9) 25 Potta-»attamie Embanl\lllEnt Loess 3 3 36.0 12.3 . A-6(9)
Co. I-29 2·6 Harrison Shoulder Sand 10 10 N.P. A-1-b
I-2Q ba::Je
~a~Obtained from inspector - all other in-place tests by rubber balloon. (~' N.D. "" Not dete.7.'l!!ined due to additive content. d'Muck. No test completed.
( )No in-place denaity data available. Velocities m·2a.:a1.1red ruJ 5391, 5736, 5935, 6048 and 4926 fps.

...
7
2. For most sample locations, in-place density tests were conducted
3 .
. using a Rainhart Volumeter rubber balloon device. Duplicate
moisture content determinations were made on the materials dug
from each hole. Densities of most of the asphalt-treated
materials were obtained from county inspectors.
With the exception of the asphalt-treated materials, enough
additional material was removed from each seismic test location
to run a standard Proctor (AASHO T-99) moisture-density curve on
site. The Proctor mold was mounted on a concrete block and the
standard hammer was hand-held. Two 1-gal. containers of each
material were also obtained and returned to A'lles for additional
tests.
4. All ·tests were conducted immediately following compaction with
the exception of location number 24.
A small mobile lab van was utilized as a field laboratary and pro
vided transportation for the two-man field crew throughout the state.
Results of those field tests considered of any value are summarized
in Figs. 23 through 45. Part (a) '(the left half) of each figure presents
the field lab moisture-density and moisture-velocity curves for each
material noted, whereas part (b) of each figure presents the in-place
moisture-density and moisture-velocity data.
At each sample location the above test procedures were utilized as
closely as possible. As will be noted in the figures however, occasional
variations were made.

,"\
..
8
® TRANSVERSE TO Cf..
"' ..E- 2000 .. >-!-
u 0 -I
~
.... v a. ..
>-!-VI z w 0
>-~ Q
.z, "
1000
Q.__~_._~__..~~.,__~__._~__.~__,
130,--~~~~~~~~~~~~----..
120 -
1101
100
90L 10 11 12 13 14 15 16 10
MOISTURE CONTENT /1 %
(a)
VP!CK-UP, MOVING
\ l \ ~ux~COUPLER ~=~ MOVING
I I I I I
l l 12 13 14 15
MOISTURE CONTENT, %
(b) '
Fig. 23. Field test results, sample location number 2.
16

Vl
..E- 2000 .. "I >-
I-
u 0 .....l LU
> 1000
110
100
..._ u 0..
... >-I-
90r VI
z 1.!.J
. Cl
>-fY. Cl
+ 70
16 18 20 22
PINS IN SPECIMEN
24 26 MOISTURE CONTE NT, %
{a)
9
--
-
-
-
-
28 16
X PARALLEL TO ct. ® TRANSVERSE TO £
I I I
@
®
® @
©
I I I
18 20 22 24 , MOISTURE <:;ONT ENT;
(b)
Fig.· 2!;. Field test results, sample location number 3.
I
I
26 28 %
10
•n
.£-·2000 ...
>-1-
u 0 __, w
1 n
> 1000 fi ~ ~SPECIMEN
~
0 a..
.,, >-;-
Vl
z I.LI 0
>-QC
0
Q ON SIDE ~
Q ~ """ O'--~-'-~~~~-L--~-'-~---'~---'
140..--~--~~~~~~~~~~---.
'l 30
120
110
100~~~~~~~~~~~~~~
-
6 8 10 12 14 16 18 2 MOISTURE CONTENT, %
(a)
l
3
®TRANSVERSE TO <f.
4
' \ \ PRIMED \ BASE \ ~ ~
@->=~,
\ PRIMED \ BASE \
&
I I
5 6 I 7
MOISTURE CONTENT 1 %
(b)
Figo 25. Field test results, sample location number 4.
8
.,, .E- 2000
... >-1-
u 0 ...J
PINS IN SPECIMEN
~ 10001 NO PINS IN SPECIMEN
11
I \~ o~.,,.......- \ .,.. .......
..... u 0.. ..
>-1-
130
120
V'I 110 7 w 0
>-0.:: 0
100
90 6 8 10 12 14 16
MOISTURE CONTENT, %
(a)
X PARALLEL TO l @ TRANSVERSE TO <t
PRIMED BASE
I I 18 3 4 5 6· 7 8
MOISTURE CONTENT, 1?1o
Fig. 26. Field test results, sample location number 5.
l
9
VJ 2000 .£-
... >-1-
u 0 -' > 1000
SPECIMENS VERY UNSTABLE, NEAR UNABLE TO HANDLE
Qi--~~~~~~~~~~~~~
«--u CL
... >-I-V'l
z LU Cl
>-~
0
16Q,.--~~~~~~~~~~~~~
150
140
130
MOISTURE CONTE NT 1 %
(a)
12
X PARALLEL TO l ~ TRANSVERSE TO l
2
' \ / ' I \/
3 5 6
MOISTURE CONTENT, %
. (b)
Fig. 27. Field test results, sample location number 6.
7

13
3000
X PARALLEL TO t. ® TRANSVERSE TO ~
VI
..£- 2000 '""" .. -: >-
I-
u );<"
0 ~ ...J l· w !!.'!' > 'II ,_.
0 ! I I I I
130
@
N
I -~
._,_ I u a. I ..
>- ~ I-V')
I z w
i 0
>- u 0.:::: 0 j
100 ,__ ~ ~ ~
90 I !, I I I
5 10 15 20 5 10 15 20
MOISTURE CONTENT / % MOISTURE CONTENT u C/o
(o) (b)
Fig. 28. field test results, sample location number 7.

14
NO PINS
7 lN SPEC!MEN
t/)
.E- 2000 .. >-1-
·~ --'
~ 1000
..... u 0.. ..
>-. !.::
Vl
·Z w 0
>-CJ::: 0
O.__~_._~_,_~~..__~~~_..~__,
. 120.--~~~~~~~~~~~~--.
110
100
90
80J I I 5 10 15 20
MOISTUR~ CONTENT, %
(a)
-
-
10
X PARALLEL TO Cf.. ©TRANSVERSE TO <t
~~ \,
' ' ' ' ' ' ' I I I I
\,
15 20 I
MOISTURE CONTENT, %
(b)
Fig. 29. Field. test results, sample location number 8.
25
15
X PARALLEL TO 'E ® TRANVERSE TO 'E
«>
..e, 2000 .. ' >-
1-
u 0 ....I
>
..,_ ~ ..
>-!:: VI
z w 0
. >-~
0
1000
,,JJ \
~PECIMENS FAILE~ r WITH HANDLING ·. o~~~~~~~---~----~~~__.
130
120
no~ I I .
100L I
J 5
l . ! 1 10 15
MOISTURE CONTENT f %
(a)
._.._.__.___'---! __,I. J 20 4 5 6 7 8 9 10
MOISTURE CONTENT, % (b)
Fig. 30. Field test results, sample location number 9.

.. ~ a ....... .. ">-I-
v 0 -1 w >
'#. ... V'I Cl
0 > ~
<(
•
16
6000
X PARALLEL TO l ® WRANSVERSE TO t x
® 5000 - x
@ x
~ 4000 -
@
©
3000 PC x :-
x
2000.__~~~-'-1 ~~~~~1'--~~~x_._,~~~~~ 14.--~~~~~~~~~~~~~~~~~~
12-
10 ,_
8-NOTE: DENSITY AND % AIR VOIDS
FROM COUNTY !NSPECTORo
6.__~~~-1-l~~~~~I~~~~-'-'~~~~~ 136 138 140 142 144
DENSITY, pcf
Fig. 31. Field test results, sample location number 10.
17
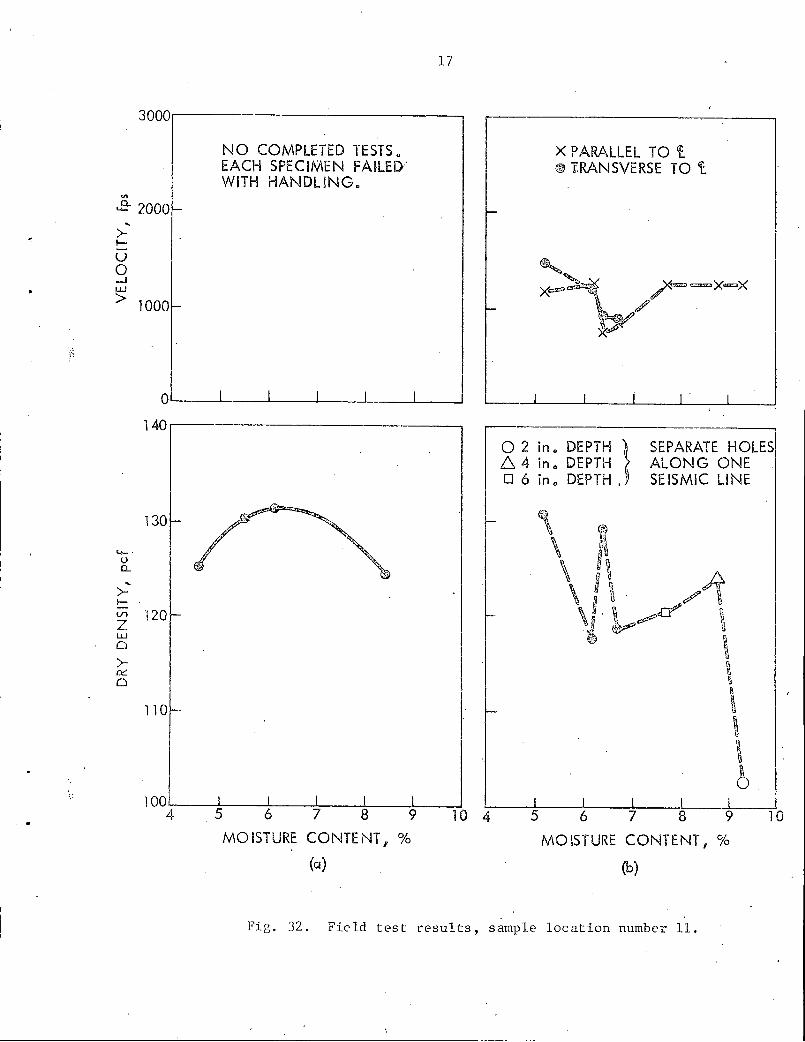
3000
NO COMPLETED TESTS o X PARALLEL TO Cf. EACH SPECIMEN FAILED' ®TRANSVERSE TO 'E WITH HANDLING.
V)
.E- 2000 ,.._
.. >-I-
u
' 0 .....! x=~ /==~X=X W-1
> 1000 / ' ,.._
~ * ':,( f:
0 I I I I I I I I I . I
140
0 2 ;n. DEPTH } SEPARATE HOLES 6. 4 in .. DEPTH ALONG ONE D 6 ino DEPTH, SEISMIC LINE
' ~; 130
I «-' \ qi u \ ,, Q_ .. I 1 >- \ I~. / , I-
\~·~~if \ VI 120 z LU ~ ~ 0 \ >- 5 Cl!'. \ 0
110 \ \ ·~ ;
6 ...
100 4 5 6 7 8 9 10 4 5 6 7 8 9 10
MOISTURE CONTE NT / % MOISTURE CONTENT, %
(a) (b)
Fig. 32. Field test results, sample location number 11.

18
2000-
... >-!::: 1500,_ x PARALLEL TO t. u 0 -'
:s:
...
1000 ,__
® TRANSVERSE TO t o .450 LEFT OF 'l D 45° RIGHT OF <f..
PRIMED BASE
500'--~~~-'-1 ~~~~~1 ~~~~~'~~~~~
140i--~~~~~~~~~~~~~-~~~~-
130
>!::: V'I 120 z !J..l c >~ 0
PRIMED BASE 110
MOISTURE CONTENT, %
Fig. 33. Field test results, sample location number 12.
19
@
2500 - x ®
x ~
"' x .E- x ..
x~ >-2000
1$ . I- ~
~© @X
u x 0 ~ ®?( x .....!
> x ·~
x x x
1500 ...... X PARALLEL TO t 0 TRANSVERSE TO l
x
1000 I . I I
140
® @J
®@ ®
@ @) 130 - @ ~
@
~ @ ~ ..... ®
f.) CL @ .. ®
>- Q I- 120 - @ Vl
z LU 0
>-0.::: 0 NOTE: MOISTURE-DENSITY DATA
110 ,_ FROM COUNTY INSPECTOR o
I I
6 8 10 12
MOISTURE CONTENT, %
Fig. 34. Field test results, sample location number 13.
20
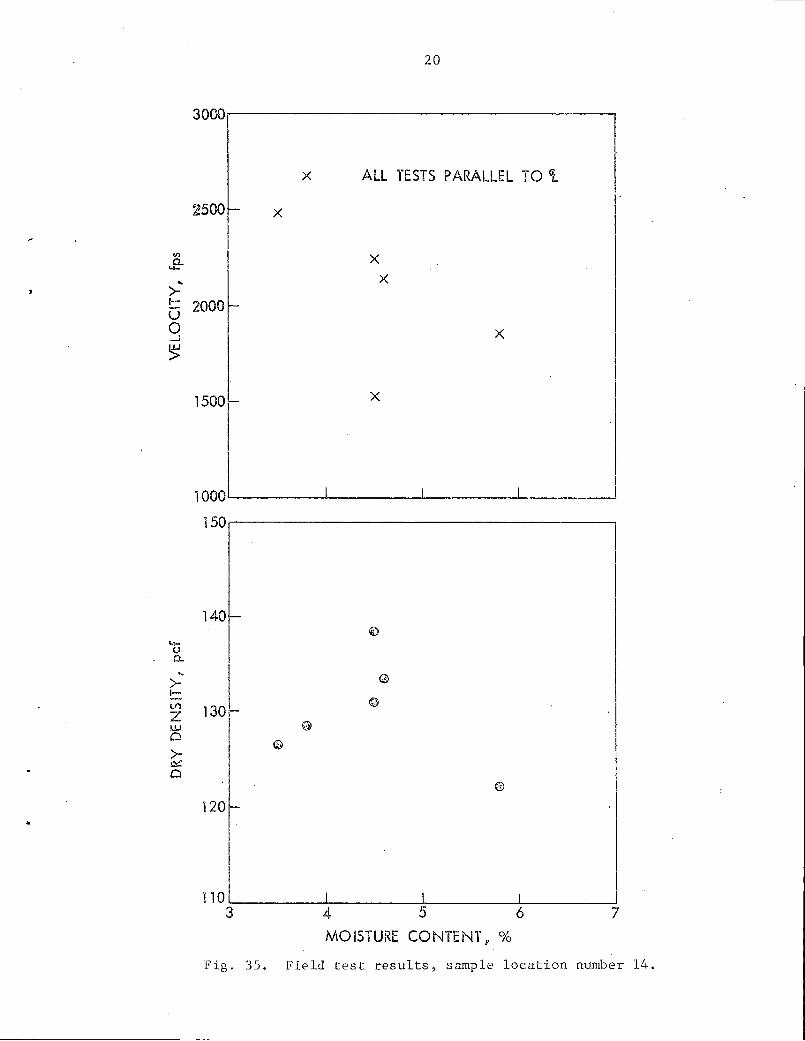
x ALL TESTS PARALLEL TO tt
2500 x
Vl x 0.. ..,_ .. x
>-t- 2000 u 0 x _!
~
1500 x
1000'--~~~---''--~~~--'-~~~~-'-~~~~--'
1501
140 @ .. ,_
(.1 0... ..
Qi) >-I-V')
130 @
z -~1.J @ Ci
G >-a::: Cl
@
1201-
MOISTURE CONTENT, %
Fig. 35. Field test results, sample location number 14.
V>
.£- 2000--...
>!-
u 0 ....J
> 1000--
120 I
"- I I)
JJ 0... ..
>-!:: V'I
z w Ci
>-~
0
100
21
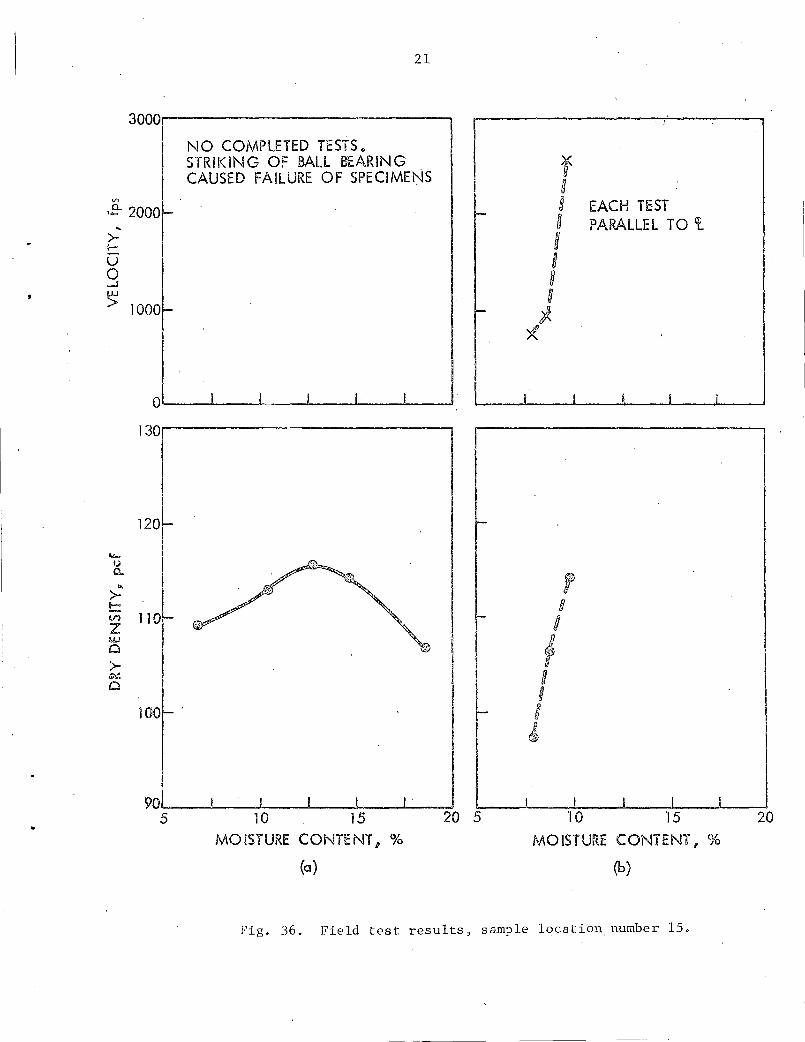
NO COMPLETED TESTSQ STRIKING OF BALL BEARING CAUSED FAILURE OF SPECIMENS
MOISTURE CONTE NT, %
(a)
-
-
-
-
-
I
r 0 g EACH TEST 8 PARALLEL TO Cf_
I n 0 0
" >(
I
, fl
I fl f H 3 I
It
i I I
I I I I l 10 15
MOISTURE CONTENT f %
(b)
Fig. 36. Field test results, sample location, number 15.
20
22
J. 2000 .. ~ v 0 ...J
NO PINS IN SPECIMEN
NO TEST o
> 1000
BALL BEARING I SUNK IN
PINS IN SPECJM~
-~ .. >-!.:: Vll z MJ c >-(.31!: 0
@---SPECIMEN ~ I o.__~---~~~~..._~--~---~__,
140.--~~~~~~~~~~~~---...
130
120
110
100.__~_,_~~~~~~~~_...~___, 4 6 8 10 12 14 16 4
MOISTURE CONTE NT /1 %
-(o)
6
x X PARALLEL TO t @ TRANSVERSE TO 'E.
x x
x
I I
@
~ ©
Ql) © -
©
I I 8 iO 12 14
MOISTURE CONiENT ,· %
(b)
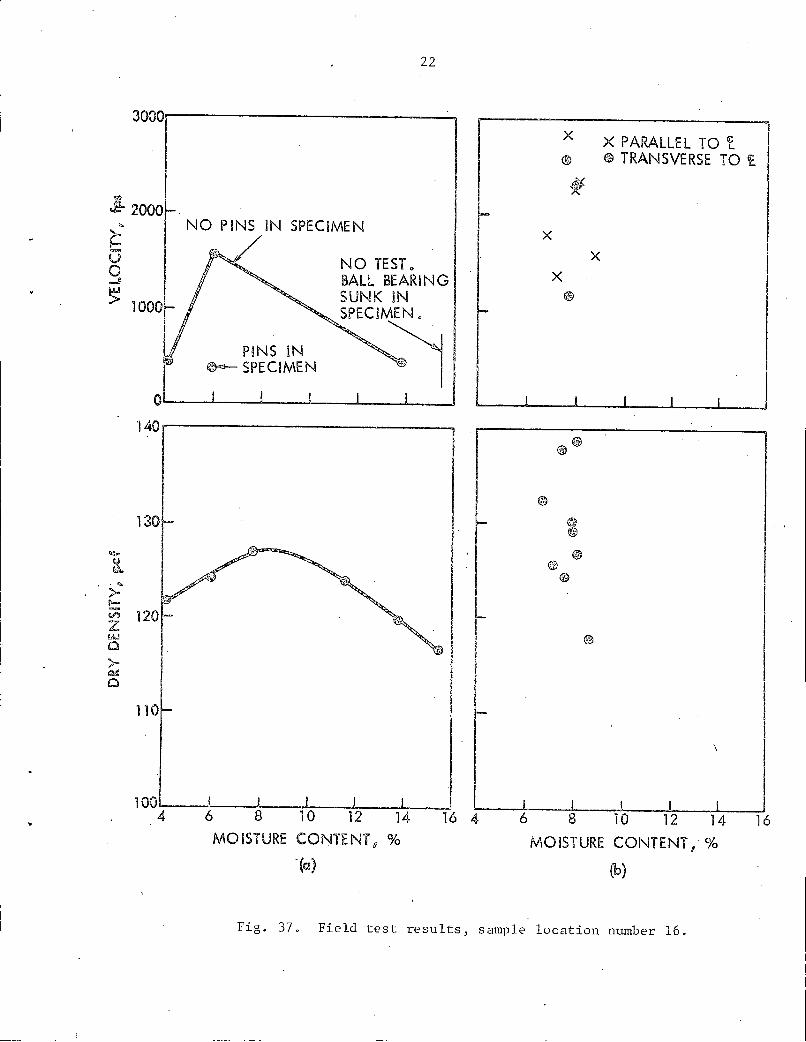
Fig. 370 Field test results, sample location number 16.
16

23
3000 ·-----'-------------..
Vl
..£- 7000 .. >-1-
u 0 _J
w >
..... u a..
... >-r-VI
z UJ 0
>-0::: 0
1 AND 2 - PINS IN SPECIMEN o
3, 4; AND 5 - NO PINS IN SPECIMEN o
O·~-_,._ _ _._ _ ___. __ _._ __ _._ _ __,
130.----------------,
120
100
-
I 10 . 20 5
MOISTURE CONTE NT, %
(a)
I
6
X PARALLEL TO 'l @TRANSVERSE TO t
'
PRIMED BASE
I I
1 I r
I I
I
I
I ''J PRIMED
7 8 9
BASE
I
MOISTURE CONTENT, %
(b)
·Fig. 38. Field test results, s·ample location number 18.
11

24
4000- -
3000 - X PARALLEL TO (t'i:..
© TRANSVERSE TO 't.
VI
~ .. >-
2000 I- -u 0 -l
~ ? /
1000 ~SPECIMEN /
(-~~x ON SIDE
QL-~-L-~---'~~-'-~--l.~~-'-~--' I I I I I
© no - d
I I
._.... I u
0.... .. I >- 100 !::: I Vi
z I w Cl
>- I Qt: Cl
90 J .
80 . I I I I I
5 10 15 20 8 9 10 11 12 13 14
MOISTURE CON.TENT F % MOISTURE CONT~NT i' %
(Cl) (b)
Fig. 39. Field test results, sample location number 20.

"' .E- 1000 ..
>t--
u 0 .....II LU
> 500
130
120
VI 110L z LLJ 0
8 100~
25
-
901.___._ _..__...____.__.._. I I I I 4 6 8 10 12 14 16 4
MOISTURE CONTE NT u %
(a)
t.ll'2
NUMBERS INDICATE COMBINED PASSES OF TAMPING FOOT . AND RUBBER TIRE ROLLERS o
I I I I I
I I I I I 6 8 10 12 14
MOISTURE CONTENT, %
(b)
·Fig. 40. Field test results, sample location number 21.
I
16
•
4500-
..B- 4000 ..
>!= u 0 _J
> 3500
3000
'250013()°
26
X PARALLEL TO t
132 134 136 138
DE NS !TY I pcf
' Fig. 41. Field test results, sample location number 22.
140
....... u
1000
27
X PARALLEL TO l ®TRANSVERSE TO t.
PRIMED BASE
500'--~~~---'---,--~~~--'--~~~~--'-~~~__J
130.--~~~~~~~~~~~~~~~~~~---,
PRIMED BJ\SE
0.. 120 I-...
>t= V'l z ~ >- 110>-~
Cl
1006~~~~~1~~~~__._~~~~~-.L--l~~~----!8
MOISTURE CONTENT, %
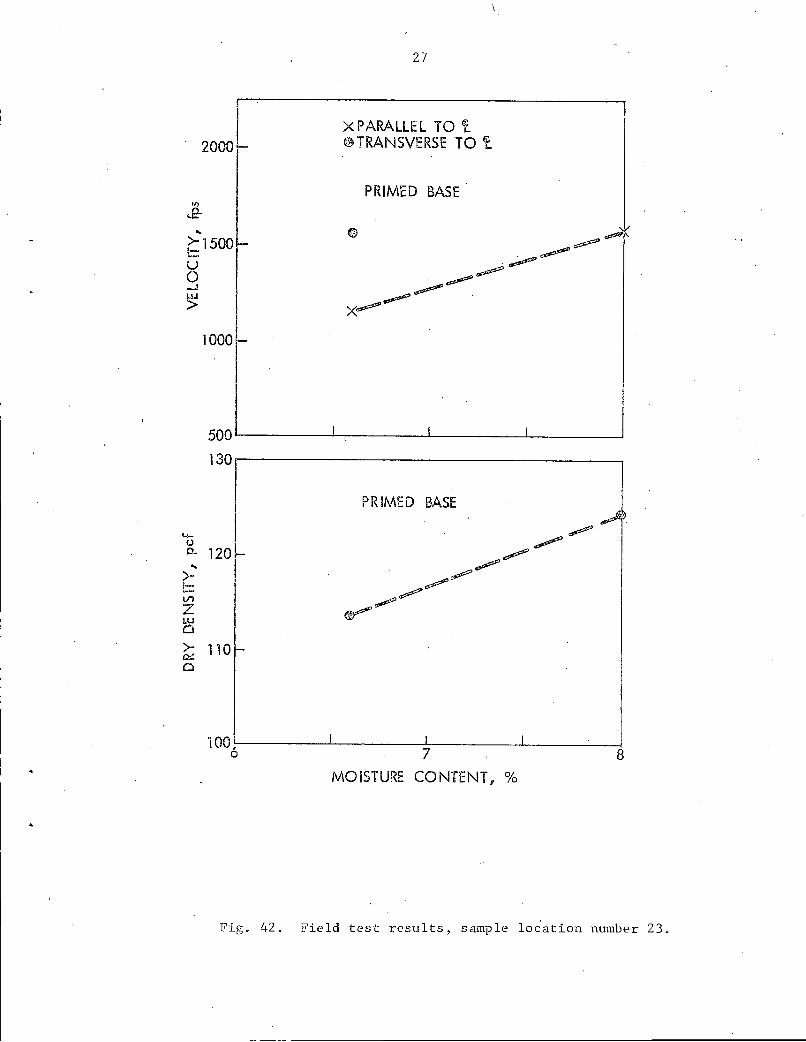
Fig. 42. Field test results, sample location number 23.
4000
.£- 3000 ....
>!=: u 0 _.! LU
> 2000
1000-
0
110~
100 '--!-l'! 0.. ..
>-r-Vl
z 90 !.LI
Cl
>-er:. Cl
801
I
700 5 10 15 20 25 MOISTURE CONTENTY %
(o)
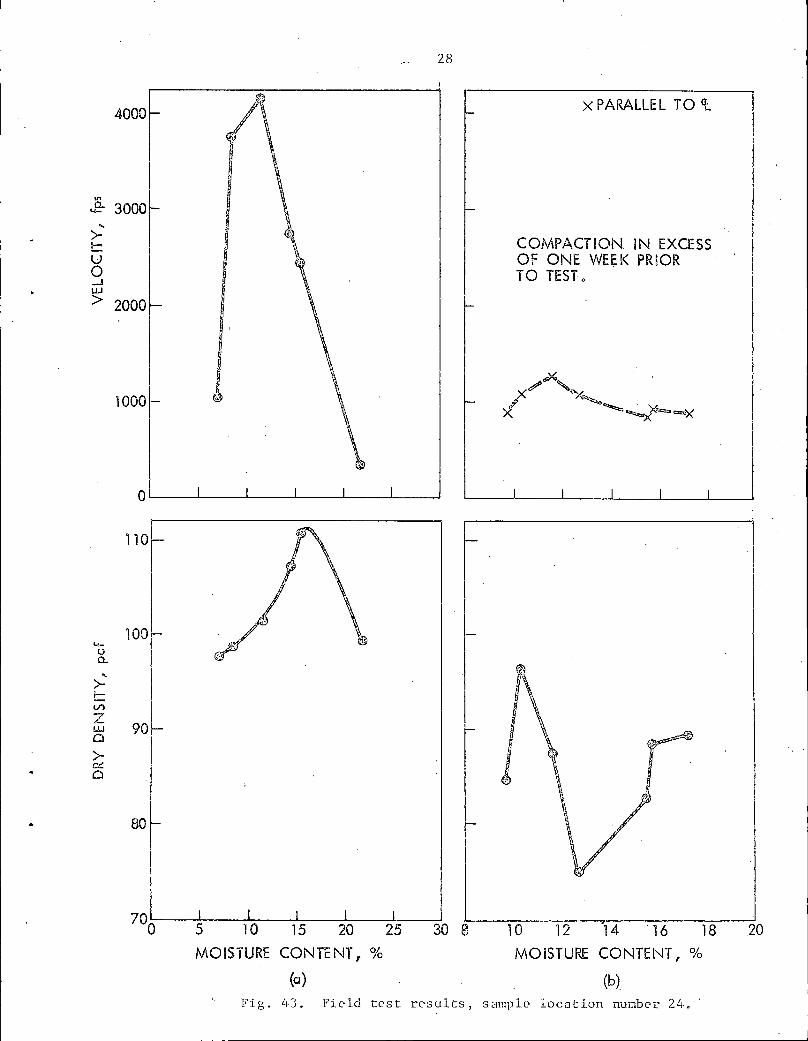
Fig. 43. Field test
28
~.
30 8
>CPARALLEL TO <t
COMPACTION. IN EXCESS OF ONE WE~K PRIOR TO TEST.
I I I I I
10 12 14 . 16 18
MOISTURE CONTEl'-IT, %
(b)
results, sample location number 2~ ..
I
20

V>
.£-...
>-I-
u 0 ,_!
~
~-() 0..
.... '>-I-V')
z L.!.J 0
>-~ 0
4000
3000
2000
1000
a..__ _ _._ _ ____. __ ~-~--~-~
110.---------~-----~
100 -
90
80.__ _ _._ _ ____. __ _._ _ __.. __ _._ _ _,
29
-
0 5 1 0 15 20 25 30 13
MOISTURE CONTENT, %
(a)
XPARALLEL TO 'E
~x ,,,?'~
x-===X
I I I I
I
14 15 16 17
MOISTURE CONTENT, %
(b)
Fig. 44. ·Field test r<:'sults, sample location number 25.
I
I 18 19

1500
'" .£-...
>-I- 1000 -u 0 -l l.W
>
500
I t
ol 1301
I
I I
120 -Lo-u Cl.
... ! >-t- !
I I.I')
1101-z ~
I
I >- I Cl!'.: Cl I
100~ I
I· I I
90 1
0 I I 2 4 6 8 10
MOISTURE CONTENT, %
(a)
30
-
-
I
I
12 4 5
XPARALLEL TO <t
I I I
I ! I I 6 7 8 9
MO !ST URE CONTENT; %
(b)
Fig. Lf5. Field test results, sample location number 26.
10
31
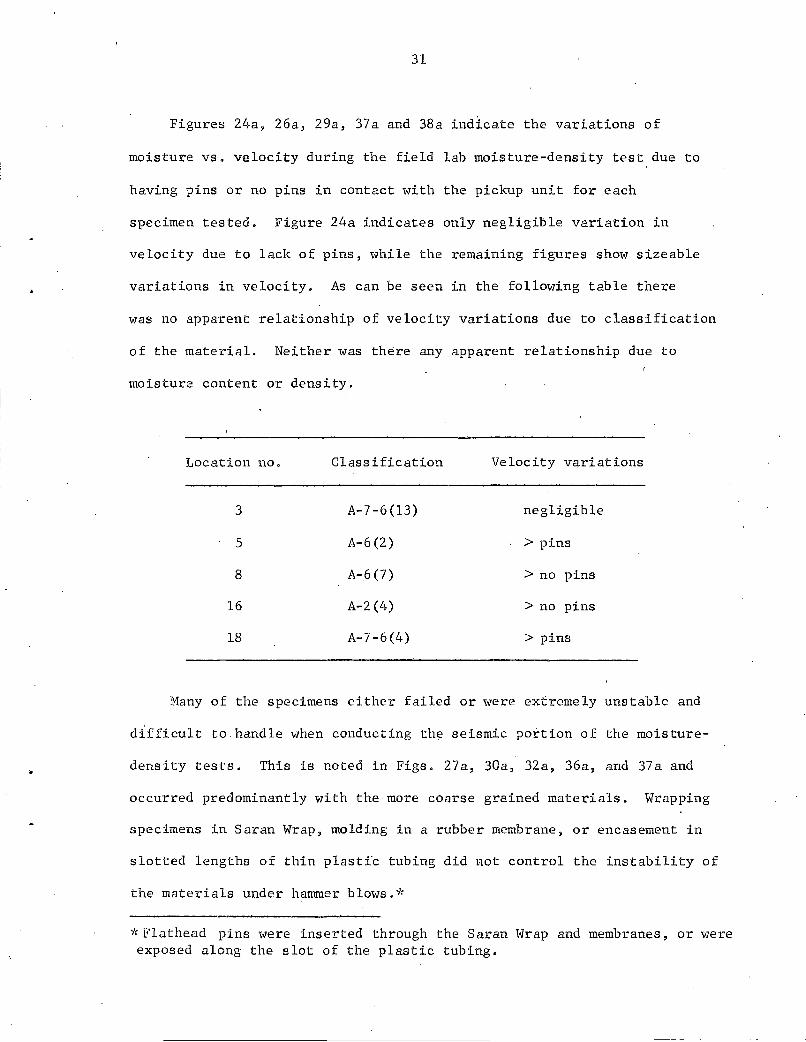
Figures 24a, 26a, 29a, 37a and 38a indicate the variations of
moisture vs. velocity during the field lab moisture-density test due to
having pins or no pins in contact with the pickup unit for each
specimen tested. Figure 24a indicates only negligible variation in
velocity due to lack of pins, while the remaining figures show sizeable
variations in velocity. As can be seen in the following table there
was no apparent relationship of velocity variations due to classification
of the material. Neither was there any apparent relationship due to
moisture content or density.
Location no. Classification Velocity variations
3 A-7-6(13) negligible
5 A-6(2) >pins
8 A-6 (7) >no pins
16 A-2(4) >no pins
18 A-7-6(4) >pins
Many of the specimens either failed or were extremely unstable and
difficult to.handle when conducting the seismic portion of the moisture-
density tests. This is noted in Figs. 27a, 30a, 32a, 36a, and 37a and
occurred predominantly with the more coarse grained materials. Wrapping
specimens in Saran Wrap, molding in a rubber membrane, or encasement in
slotted lengths of thin plastic tubing did Bot control the instability of
the materials under hannner blows,~'<
~·,Flathead pins were inserted through the Saran Wrap and membranes, or were exposed along the slot of the plastic tubing.

32
After the "standard" moisture-density-velocity test at two of the
locations, each specimen was arbitrarily laid on its side and veiocities
were determined in a horizontal rather than vertical direction. Figures
25a and 39a show an extreme lowering of velocities due to this deviation
in procedure. Since the travel path through the specimen is unchanged, it
would appear that laying the specimens on their sides allowed opening of
compaction planes. Nevertheless with the specimens on their sides, Fig.
40a shows an excellent correlation between the moisture-density and
moisture-velocity curves.
At one site velocity was related to number of passes of compaction
equipment, Fig. 40. The in-place moisture content-density determination
was made following the fifth pass. Note that the velocities reduced with
increasing number of passes. No formal conclusion can be reached on the
basis of only one "growth" test. However, it is necessary to relate the
in-place velocities to Eq. (1), Part 1 of this report, where it was shown
that the velocity of a longitudinal (compression) wave is inversely
proportional to density; i.e., if number of passes of compaction equipment
are assumed to increase density, then compression velocities should be
reduced. Alternately the velocity may have been progressively reduced
by formation.of shear planes during compaction.
Two seismic lines were usually used for each point, one parallel to
the centerline of the roadway, and the second transverse thereto, inter
secting at about the one-third point of the roadway. The volumeter hole
was dug near the intersection of the lines following the s~ismic t~sts.
This orientation of s.eismic line with respect to the centerline of the
roadway must not be misconstrued as differentiating between longitudinal
(compression) or transverse (shear) waves since th~ pickup unit was oriented
longitudinally to each seismic line.

33
The orientation of seismic lines is indicated in Figs. 23 through
45: It is evident that orientation had a definite effect on measured
velocities at identical in-place moisture contents and/or densities. It
may be hypothesized that the variation in velocities is due to particle
orientation or shear planes created by the action of various compaction
equipment used during construction. However, neither. orientation gave
consistently highe·r or lower velocities in similar materials at similar
densities and moisture contents. This is particularly true of those
materials showing the shotgun pattern of in-place velocities versus moisture
content or density.
When determining velocities with a seismic timer, the slope of a time
versus distance curve is the velocity of the first arrival wave. Occasionally,
two or more slopes are evident on the plot, indicating that the wave has
refracted through an equivalent number of layers, possibly of varying degrees
.of densification. When such a plot occurs, it is possible to determine
the thickness of the first layer by the following equation:14
where
Dl thickness of layer in ft
vl = velocity in the first layer in fps
v2 velocity in the second layer in fps
xl = distance, in ft' from the origin to the intersection of v1 and v- on the time-distance plot.
2
I
34
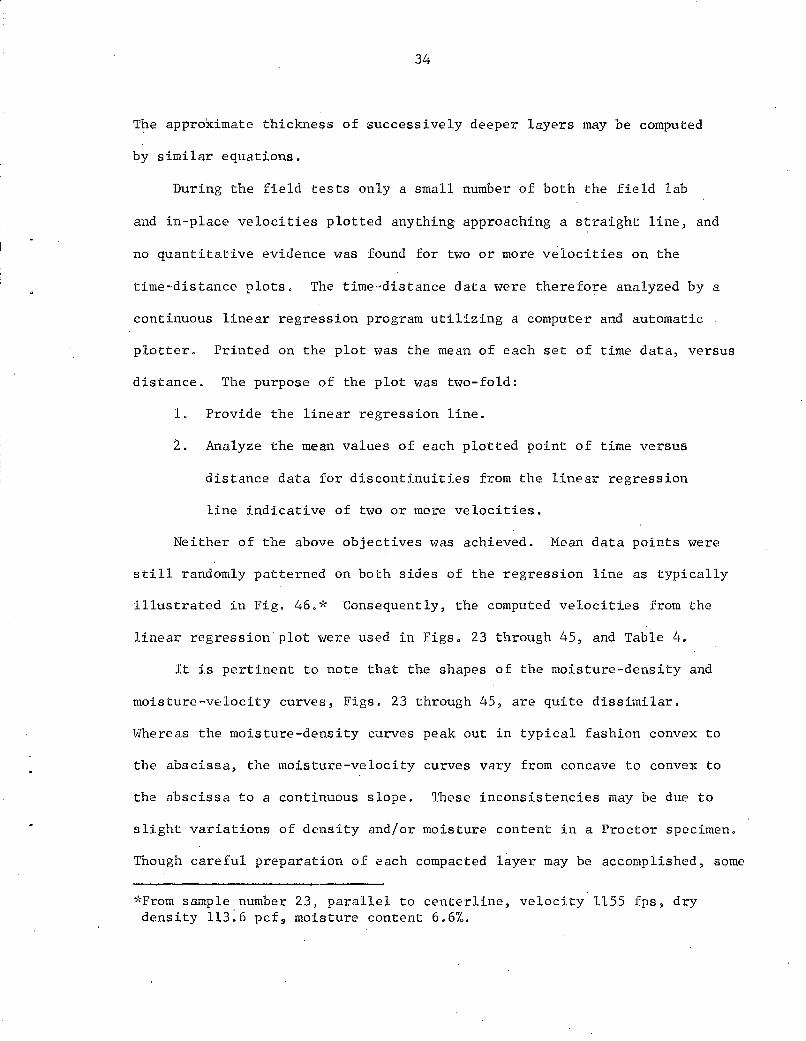
The approximate thickness of successively deeper layers may be computed
by similar equations.
During the field tests only a small number of both the field lab
and in-place velocities plotted anything approaching a straight line, and
no quantitative evidence was found for two or more velocities on the
time-distance plots. The time-distance data were therefore analyzed by a
continuous linear regression program utilizing a computer and automatic
plotter. Printed on the plot was the mean of each set of time data, versus
distance. The purpose of the plot was two-fold:
1. Provide the linear regression line.
2. Analyze the mean values of each plotted point of time versus
distance data for discontinuities from the linear regression
line indicative of two or more velocities.
Neither of the above objectives was achieved. Mean data points were
still randomly patterned on both sides of the regression line as typically
illustrated in Fig, 46,,'( Consequently, the computed velocities from the
linear regression.plot were used in Figs. 23 through 45, and Table 4.
It is pertinent to note that the shapes of the moisture-density and
moisture-velocity curves, Figs. 23 through 45, are quite dissimilar.
Whereas the moisture-density curves peak out in typical fashion convex to
the abscissa, the moisture-velocity curves vary from concave to convex to
the abscissa to a. continuous slope. These inconsistencies may be due to
slight variations of density and/or moisture content in a Proctor specimen.
Though careful preparation of each compacted layer may be accomplished, some
'>'<From sample number 23, parallel to centerline, velocity 1155 fps, dry density 113:6 pcf~ moisture content 6.6%.

35
24.00
2LOO
18.00
15.00
12.00
u I ~ ::i 9 .OOr
... w ::;:;,: ;:: 6 .00
0
3.00
0.25 0.50 0.75 l.00 1.25 1.50 L75 2.00
DISTANCE, ft
Fig. 46. In-place time versus distance data, plus linear regression plot for sample location number 23.

Table 4. Summary of field test results.
Field ·Lab Tes ts
S=ple no.
2
3
4
6
8
9
10
11
12
13
14
15
16
18
20
21
2.2
23
-24
26
AAS HO classification
A-4(2)
A-7-6 (13)
A-4(1)
A-6(2)
A-1-a
A-4(1)
A-6(7)
A-2-6(1)
A-I-a
A-6(2)
A-2-6(0)
A-6(4)
A-2-4
A-7-6(4)
A-7~6(7)
A-2-6(0)
,A-6(9)
A-6(9)
A-1-b
Dry density Ha:.: 1"'lra at
dry deru:ity .=i.!rum (pcf) velocity(pcf)
120.0
98. l
122 .2
122. 7
151.4
123.0
114.0
124.2
N.D. (c) ·
131.2
N.D.(c)
·N.D. (I')
N.D. (c)
115.5
127.4
117.5
115.8,
122.6
!l.D. (c)
ll.D. (c)
111.0
105. 7
126.5
120.0
97 .2
118.5
122. 7
151.4
119.5
109.8
123.6
.. N.D. (c)
N.D. (c)
N.D. (c)
N.D. (c)
N.D. (c)
N.D. (c)
114.0
108.3
121.6
N.D. (c)
N.D. (c)
101. 5
99.5
121. s
(a) (b) Velocity ~eru:ured transv~rae to centerline. (c)Veloc!~y ~eaaured parallel to centerline.
Optimum moiature content.
('Z)
13.0
23.0
12:5
11.5
5.2
9.5
14.0
10. l
N.D. (c)
6.4
N.D. (c)
N.D. (c)
N.D. (c)
12. 7
8.4
13.0
U.5
11.0
. ·N,D. (c)
N.D. (c)
16.0
17 .o
8.5
Hi:iisttrre content at
maxiDum. velocity
(%)
13.0
25.2.
9.0
11.5
5.2
5.5
10.6
11.2
11.D. (c)
N.D. (c)
N.D. (c)
N.D. (c)
N.D. (c)
N.D. (c)
6.0
9.4
9.8
9.8
N.D. (c)
11.D. (c)
11.4
5.0
(d)Not deternll.nable - see appropriate figure. (e)Specio:erui very unstable, nearly impossible to handle. (f)Percent air voida - not co1oture content.
See appropriate figure. Testa uidely scattered, with no correlation.
Maxi= velocity
(fpa)
1520
-1550
2510
2240
960(d)
1330
2160
2910
N.D. (c)
H.D. (c)
H.D. (c)
N.D. (c)
N.D. (c)
· N.D. (c)
1580
2800
4400
1000
N.D. (c)
N.D. (c)
4170
. 3770
1650
Velocity at maxi= dry density and
opti= moisture content (fps)
1520
1210
1050
2240
960(d)
370
1230
2050
H.D. (c)
N.D. (c)
N.D. (c)
N.D. (c)
N.D. (c)
N.D. (c)
1200
. 2410
4000
980
li.D. (~)
N.D. (c)
2300
2400
575
·Maximum velocity
(fps)
1890(a)
l090(b)
2220(a)
g1o(b)
253,/b)
1560(b)
1350 (a)
Moisture content at
ClaXillltllll
velocity' ('%.)
10. 7
22.4
4.4
8.8
2.8
11.0
20.7
1570(a) 7.6
5580(b) 8.6<•>
1450 (a)' . 5.2
2500(a) 8.5
- (f) - (f)
- (f) - (£)
2540(b)
2830(b)
1500.(b)
1450 (a)
1440(•)
4450(b)
1580(b)
1250 (b)
1150(b)
1290(b)
9. 7
7.5
8.5
11.8
9.2
N.D. (c)
s.o
11.6
16.8
5.0
In-Place Tests
D,ry density at
maximw:i velocity(pcf)
105.5
84.6
132. 3
121.4
133.3
124. 7
·82.8
121.0
143.5
131.0
121.0
114.3
137 .6
121.5
111.2
120.5
134.8
124.0
87.3
97.5
112.0
(f}
(f}
Maximum velocity
at optimum moisture
content(fps)
llBO(a)
- 1050(a)
N.D. (c)
N.D. (c)
900(b)
1000
l230(b)
N.D. (c)
N.D. (c)
910<•)
N.D. (c)
N.D. (~)
N.D. (c)
N.D. (c)
:-. 1700(b)
H.D. (c)
N.D. (c)
N.D. (c)
N.D. (c)
N.D. (c)
9io(b)
N.D. (c)
- llOO(b)
Dry density at optimum
coisture content
(pcf)
106.9
- 93.0
N.D. (c)
N.D. (c)
138.3
- 90.0
98.9
N.D. (c)
N.D. (c)
129.J
N.D. (c)
N.D. (c)
N.D. (c)
N.D. (c)
- 121.0
li.D. (c)
N.D. (c)
N.D. (c)
N.D. (c)
N.D. (c)
88.5
N.D. (c)
93.0
37
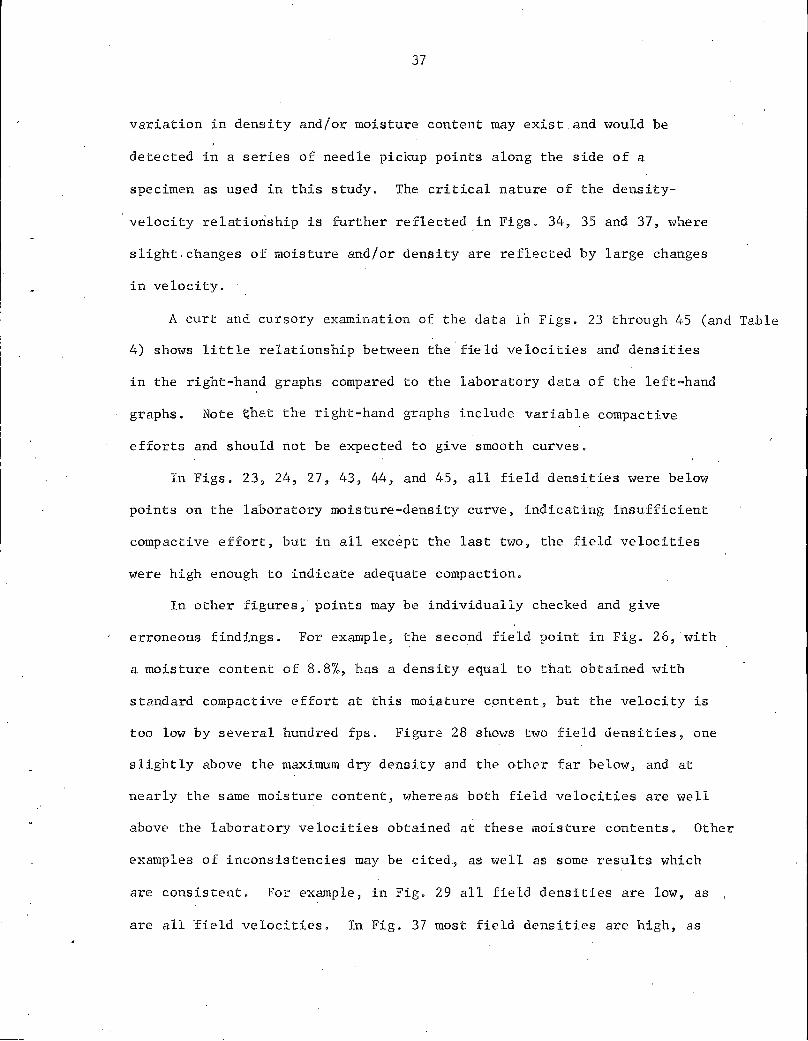
variation in density and/or moisture content may exist and would be
detected in a series of needle pickup points along the side of a
specimen as used in this study. The critical nature of the density
velocity relationship is further reflected in Figs. 34-, 35 and 37, where
slight-changes of moisture and/or density are reflected by large changes
in velocity.
A curt and cursory examination of the data in Figs. 23 through 45 (and Table
4) shows little relationship between the field velocities and densities
in the right-hand graphs compared to the laboratory data of the left-hand
graphs. Note ~hat the right-hand graphs include variable compactive
efforts and should rtot be expected to give smooth curves.
In Figs. 23, 24, 27, 43, 4-4, and 45, all field densities were below
points on the laboratory moisture-density curve, indicating insufficient
compactive effort, but in all except the last two, the field velocities
were high enough to indicate adequate compaction.
In other figures,· points may be individually checked and give
erroneous findings. For example, the second field point in Fig. 26, with
a moisture content of 8.8%, has a density equal to that obtained with
standard compactive effort at this moisture content, but the velocity is
too low by several hundred fps. Figure 28 shows two field densities, one
slightly above the maximum dry density and the other far below, and at
nearly the same moisture content, whereas both field velocities are well
above the laboratory velocities obtained at these moisture contents. Other
examples of inconsistencies may be cited., as well. as some results which
a.re consistent. For example, in Fig. 29 all field densities are low, as
are all £ield velocities. In Fig. 37 most field densities are high, as

38
are most field velocities. Nevertheless the inconsistencies indicate that
the results are erratic, and the method as used is highly unreliable. In.
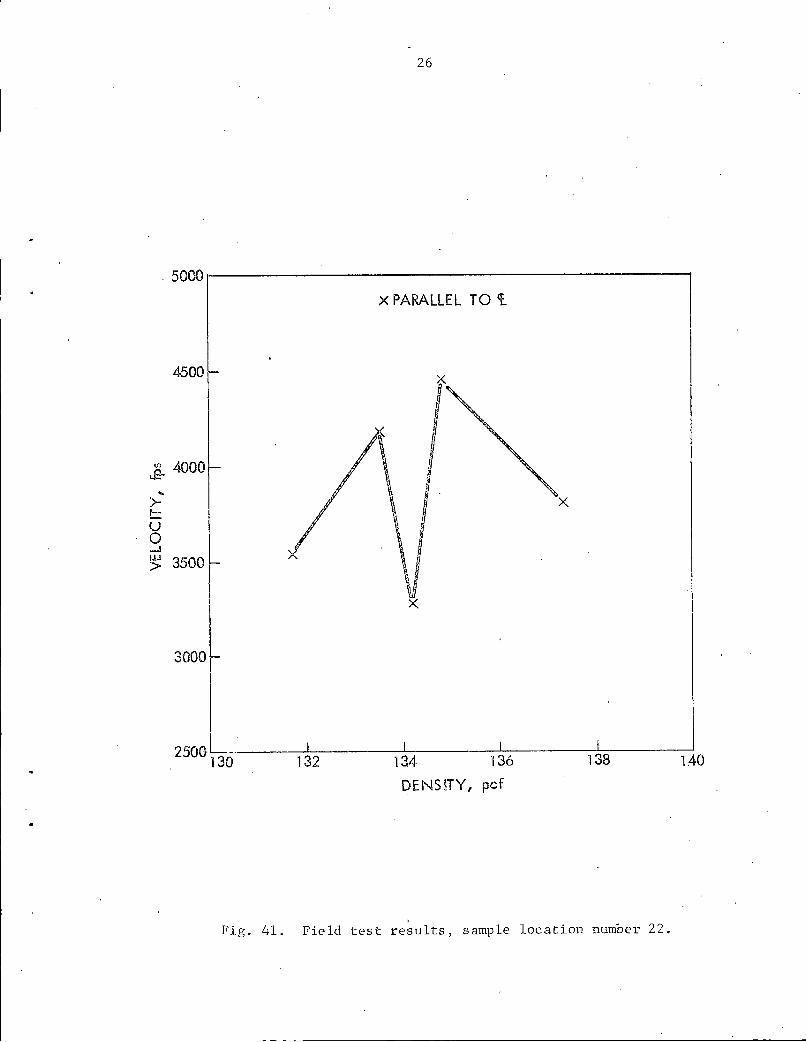
Figs. 25, 31, 32, 33, 34, 35, 36, 41, and 42, data were insufficient for
comparison, either because laboratory tests were not performed or did not
) include a wide enough variation in moisture content.
CONCLUSIONS FROM FIELD INVESTIGATION
The above procedures for determining seismic velocity are unsuitable
as a rapid means of determination' of in-place density. Problems include the
following:
1. While the method for in-place seismic tests is reasonably rapid,
that used for field lab control curves is extremely time-consum-
ing and requires considerable patience and dexterity on the
part of one or more technicians. In addition, results of seismic
tests from either proctor specimens or in-place materials are
highly dependent on measurement of travel distance of wave between
energy source and pickup. Variations in reported results may in
part be due to extremely small errors of distance measurE;ment.
2. The Model 217 Micro-Seismic timer gives good reproducibility of
measured times so long as the pickup unit is very carefully
adjusted for proper contact with a pin or nail head embedded in
the material to be tested. Being a phonograph needle, the pickup
unit is thus sensitive to contact pressure. Too much pressure
dampens the sensitivity while too small a pressure does not fully
u~ilize the sensitivity; i.e., quality of wave reproduction is

39
varied. The variation in reported velocities during the field
tests is probably in part due to improper contact pressure.
Where ,no pins were used on the field lab specimens, the problem
of needle contact pressure may have been further compounded due
to possible contact with a single loosely held surface grain.
3. A specimen fails when it is attempted to produce shock waves by
hammering on a ball embedded in a molded and extruded specimen
of coarse grained low plasticity materials. Failure also
occurred when hammering on finer grained material specimens that
were on the extreme dry or wet side of optimum moisture content.
4. Orientation of the in-place seismic line with respect tQ the
roadway centerline produced definite vari'ations in measured
velocities at identical moisture contents and densities and may
have been due to particle orientation or non-homogeneities of \
the materials during compaction,
In summary, it may be said that neither the laboratory nor the field
procedure for determination of seismic velocities was satisfactory under
conditions of tests normally encountered by 1
field inspectors. A decision
was made to spend the remaining time in the project trying to devise and
perfect a different; laboratory procedure,
ADDITIONAL LABORATORY TESTS
The preceding tests were dependent on a pickup unit (transducr=-r)
utilizing an extremely fine pointed needle, and thus covering a nearly
infinitesimally small contact area. It was hypothesized that if the

40
transducer contact area could be increased to at least several square
inches without loss of close reproducibility of seismic times, many of the
irregularities in velocities possibly due to insertion of pins, variations
in moisture-density, and/or loose surface particles could be eliminated.
Geophones would increase contact area but required insertion of a larger
point, which would cause disruption of a material, particularly in a
Proctor specimen.
In addition, a method was needed which was less time consuming,
required less precision and dexterity on the part of a technician,
eliminated the need for hammering on a specimen, would work regardless of
contact pressure of pickup to specimen and would measure velocity over
full length of specimen, for average velocity, not velocity dependent on
interior specimen irregularities •.
In their study of pulse velocities in compacted soils, Sheeran, Baker,
and Krizek15
showed that the curves of peak velocities and dry densities
were approximately parallel and were within+ 0.5% moisture content of
each other, using a V-Scope.-J< In addition, the V-Scope source and re-
ceiver ·transducers each had a contact area of several square inches.
A V-Scope was rented for one month 'to conduct a limited velocity-
moisture-density laboratory study on the bulk of the materials obtained I
1'
from the field tests noted in the previous section of this report.
The V-Scope, Fig. 47a, combines an oscilloscope, pulse generator,
source a'nd receiver transducers in one unit, The transducers are Rochelle
~'<James Electronics, Inc., 4050 North Rockwell St., Chicago, Illinois 60618.

B.
41
A.
c. Fig. 47
A. James Electronics, Inc., V-Scope with source and receiver transducers.
B. Transducers mounted on in-mold specimen.
C. Transducers mounted on extruded specimen.

42
salt crystals in an aluminum enclosure, and capped under an oil filled
rubber membrane which protrudes about 1/8 in. from the case. ·k~'( Sweep of
the oscilloscope is matched to the sonic frequency emitted from the
source transducer, and a stationary trace is displayed on the oscilloscope.
A short calibration process cancels all time delays associated with the
instrument, cables and transducers. The time control on the face of the
V-Scope is turned until the point at which the trace leaves the horizontal
is directly lined up with a vertical reference line as shown in Fig. 48.
The time, in microseconds, is then read directly from a counter. Distance
divided by time is the velocity in fps.
Since the distance used in the laboratory study was ~onstant (length
of a Proctor specimen) a chart was made of time in micro-second.s, versus
velocity in fps. Velocities were. then read from the average of three or
more time readings. The total time to determine velocity over a Proctor
specimen was five minutes or less, and eliminated the need for plotting time
versus distance, or reducing data with a computer.
Two series of velocity tests were conducted on each Proctor specimen;
i.e., prior to and following removal from the steel mold. Fig~re 47b and
47c photographically illustrate the two test series, with the source
transducer lightly hand held on top of the specimens. The in-mold tests
were a means of overcoming the instability ·of some extended specimens.
Results of the V-Scope velocity-moisture-density tests are shown in
Figs. l;9 through 59 and summarized in Table 5.
'>'dcTh~ membrane protrudes from the case under pressure so that during. the test the specimen is not in contact with the case.
43
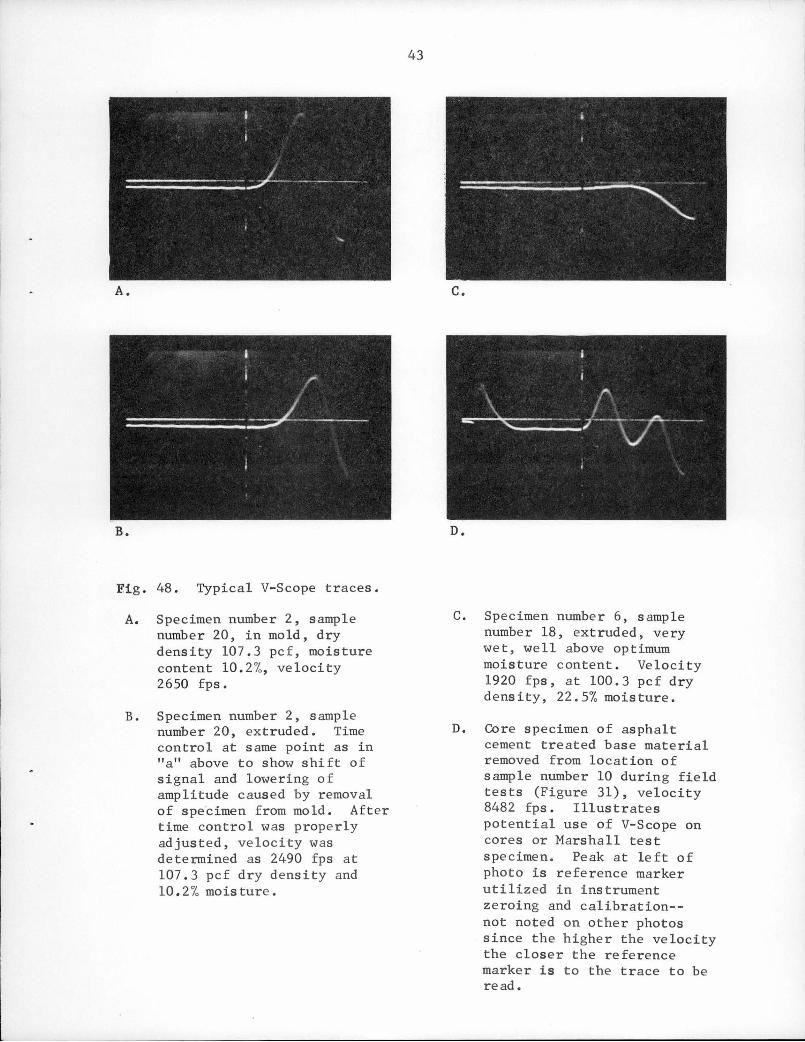
A. C.
B. D.
Fig. 48. Typical V-Scope traces.
A. Specimen number 2, sample number 20, in mold, dry density 107.3 pcf, moisture content 10.2%, velocity 2650 fps.
B. Specimen number 2, sample number 20, extruded. Time control at same point as in "a" above to show shift of signal and lowering of amplitude caused by removal of specimen from mold. After time control was properly adjusted, velocity was determined as 2490 fps at 107.3 pcf dry density and 10. 2% mo is tu re.
C. Specimen number 6, sample number 18, extruded, very wet, well above optimum moisture content. Velocity 1920 fps, at 100.3 pcf dry density, 22.5% moisture.
D. Core specimen of asphalt cement treated base material removed from location of sample number 10 during field tests (Figure 31), velocity 8482 fps. Illustrates potential use of V-Scope on cores or Marshall test specimen. Peak at left of photo is reference marker utilized in instrument zeroing and calibration--not noted on other photos since the higher the velocity the closer the reference marker is to the trace to be read.

3000
.. >-!:::: 2500 u 0 ~
~
2000-
®IN MOLD . X EXTRUDED
44
2000
1500
.. 1500....__ _ _._ _ ___. __ _.__ _ __._ __ ....__1 ooo--_.__ _ __.....__ _ _.__ _ _..._, __ _,.,_ _ __.
I
...... u 0.. ..
>-~ VI z !.W ·o >-tX 0
135 130.------~--------.
' 130
125
120
(
'7 8 9
MOISTURE CONTENT, % SAMPLE NO. 1
125
120
115
10
MOISTURE CONTENT, % SAMPLE NO. 2
Fig. 49. Laboratory moisture-density-V-Scope velocity results, sample numbe~s 1 and 2.
I
'!
VI 2500-..e-
... >!= u 0 __. w 2000 >
@IN MOLD XEXTRUDED
45
2500
1500"--~~~~~~~~~~,.--~~2000'--~--'-~_J_~~--1._~-L~~--1._~_J
..,_ u a.. .. >-!::: V>
z u.J CJ
>-0::: Cl
100 ·120,.--~~~~~~~~~-'-~---.
95
90
85
MOISTURE CONTENT, % SAMPLE NO. 3
115
105
I
MOISTURE CONTENT, % SAMPLE NO. 4
Fig. 50. Laboratory moisture-density-V-Scope velocity results, sample numbers 3 and 4.
4000
.. c 3500 u 0
g 3000~
@ IN MOLD X EXTRUDED
VELOCITY REDUCES TO NEAR ZERO
46
2500
2000
'1500
I 2500'--~-'-~----'---~-'-~~~~-'--~1000'--~_._~____..~~_._~~~~-'-~---'
120 140..--------------1
I 115 . 135
...... I u Q_
"' >-!-
V'l 110 130 z
L.U
I 0
>-~ I 0
.1osL 125 I
100 201203 5 10 15 4 5, 6 7 8 9
MOISTURE CONTENT, % MOISTURE CONTENT r %
SAMPLE NO. 5 .SAMPLE NO. 6
Fig. 51. Lnboratory moisture-dens i ty-V-S cope velocity results, sample numbers 5 and 60
... >-!-
47
3000
©IN ·MOLD X EXTRUDED
'u 2500 'o
....J LU
>
2000 x
1500'-----L...------1---'--------L--....I----' 120,__--------~----- 110------------------.
...... u 0.. 115 - l 05 ... I >-
!= VI z l..U CJ
>-0-:::
110 100 Q
10541----L----1'----J----'--~-_,951~---L...---l---'---------1----L----i 6 8 1 0 12 14 16 5 l 0 l 5 20
\
MOISTURE CONTENT, % MOISTURE COi'\ITENT I % SAMPLE NOD 7 SAMPLE NO o 8
Fig. 52. L;1boratory moisturc'-donsity-V-Scope velocity results, sample numbers 7 and 8.

VI ' 0... ......
... >t::
·U 0 .....! LU
>
..... I.)
0.. .. >-!::::: Vl z w Cl
>-Ci-:: Cl
48
3500..----~~~~~~~~~~~~~3000,--~~~~~~~~~~~~~-..
2000
1500
125
115
ll06 ... 7
'®IN MOLD X EXTRUDED
8 ' 9
,,_=
10 11
MOISTURE CONTENT, % SAMPLE NOo 9
I
~
12 2 3 4 5 6 7 8 . .
MOISTURE ·CONTENT 1 % SAMPLE NO. 11
Fig. 53. Lcibor;citory moisturc-density-V-Scope velocity results, sample numbers 9 and 11.
3000
Ill
.E-..
>- 2500 I- -u 0 ...J
>. 2000
1500
125
120 -...... u CL .
... >-I-I./") 115 z J.J.J 0
>-a:: 0
110
49
NOTE: SPECIMEN 4 DRIED BACK TO PRODUCE ADDED M/D POINT. SEE AFFECT ON VELOCITY ABOVE.
4
MOISTURE CONTENT., % SAMPLE NO .12
4000
3500
2500
130
120
115
® IN MOLD X EXTRUDED
VELOCITY· REDUCES TO NEAR
• ZERO
MOISTURE CONTENT,% SAMPLE NO o l'3
Fig. 54. taborntory rnoisturp-density-V-Scope velocity results, sample numbers 12 and 13.
' \.

• ,J
3000
~ 2500
.. >-I-
u .o ......! LU 2000 >
1500
125
120
....... u a.
... >-r-1.1'1 115 z LI.I Q
>-. Ct:: 0
110
SPECIMENS COLLAPSED WHEN EXTRUDED.
©IN MOLD X EXTRUDED
MOISTURE CONTENT, % SAMPLE NO o 14
so
3500
3000
2500
2000
115
110
105
100
Ix \ x VE~QCFrY REDUCES TO NEAR ZERO o
MOISTURE CONTENT, % SAMPLE NO. 15
~
Fig. 55. L;1boratory moisturc-dcnsity-V-Scope velocity results, sample numbers 14 and 15.

3500
3000
"' ..B-...
>-!:: 2500 u 0
. _J
~
2000
1500
130
125 ..,_ u 0.. ..
>-!-V")
120 z w Cl
>-~ c
115
® IN MOLD X EXTRUDED
x
I x
6 8 10 12
MOISTURE CONTENT v % SAMPLE NO. 16
51
14
J 105
100 -
95
90
10 15 20 • MOISTURE CONTENT 7 %
.SAMPJ.,~ N_Qo .18. _ 1•'ig. 56. L1boratory moisture-density-V-Scope velocity results, sample numbers 16 and 18.

Vl
..& ...
>-!= u 0 -' .~
..._ IJ 0...
... >-I-Vl z l.J..I 0
>-0::: 0
52
3500.---------------· ·4-000.----------------~
3000
2500
2000 x
VELOCITY REDUCES Tb NEAR ZERO
1500
1151
110
105
100
3500
3000
2500
120
195
i I
@.)IN MOLD XEXTRUDED
I x x/
VELOCITY REDUCES TO NEAR ZERO.
955'---l----'---'-----L--~- 100.___-:----'~-~---'---L---_J 10 15 20 6 8 10 12 14 16 18
MOISTURE CONTENT, % SAMPLE NO. 20
MOISTURE CONTENT, % SAMPLE l'-JO. 21
Fi./!,., 57. Laboratory moistun'-density-V-Scope velo~ity results, sample numbers 20 .:md 21.
VI
,£-. ... 2000
>-1-
u 0 --' !J.J
> 1500
VELOCITY REDUCES TO NEAR ZERO
53
@ IN MOLD X EXTRUDED .
1000'--~-'-'--~--L~~...L-~---L-~----L~----l
110,
105 ...,_ ()
0... .. >-I-(./') '
100 z w a >-~
0
95
10 20 30
MOISTURE CONTENT, %
SAMPLE NO. 24
VELOCITY REDUCES TO NEAR ZERO.
10 15 20
MOISTURE CONTENT, %
SAMPLE N 0. 25
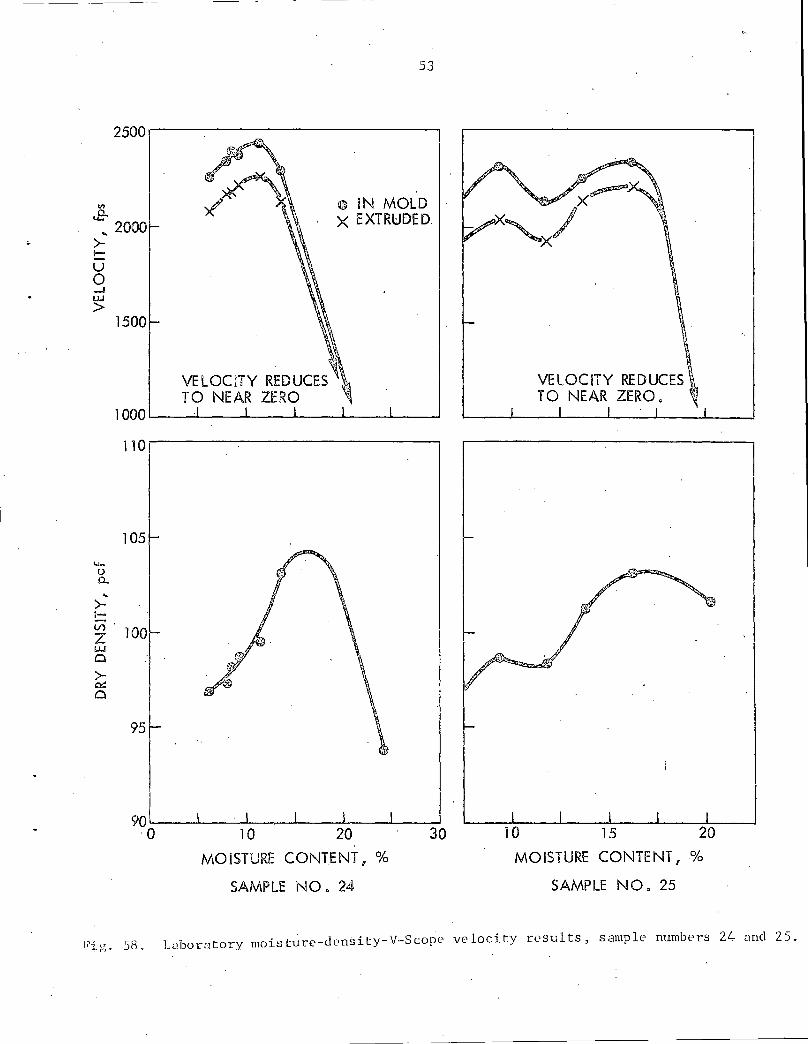
li'ig. 58. L<.ibor;itory moist~re-dc•nsity-V-Scope velocity results, sample numbers 24 and 25.
"
'-
"' 2000 .E-...
>-I-
u 0 -' w
1500 >
120
..... 0 0.. ..
>-I-
Vl 115 z w 0
>-0::: 0
110 -
54
.?" /
/ /
// /
',
2 4 6 8 10
MO iSTURE CONTE NT, % SAMPLE N 0. 26
12
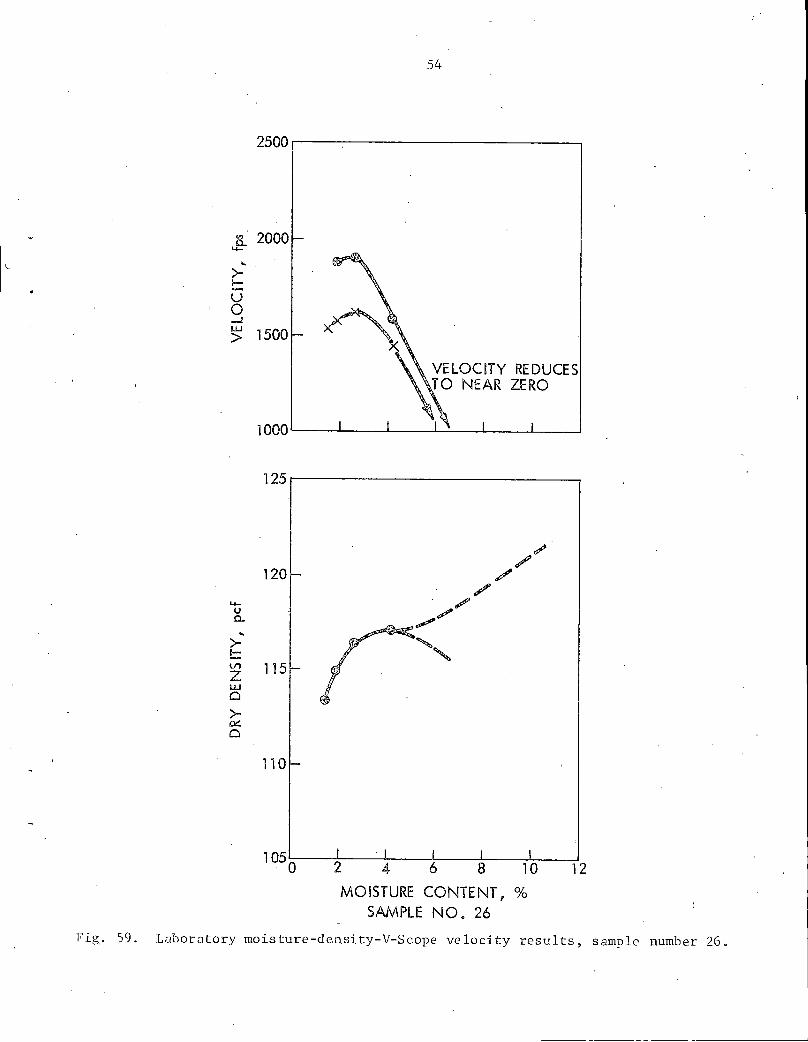
Fig .. 59. Laboratory rnoisture-density-V-Scope velocity results, sample number 26.

Table s. Summary of laboratory moisture~density-V-Scope velocity results.
Moisture Velocity at Dry density content at maximum dry
Maximum at maximum Optilw:m maximum Maximum density-optimum dry velocity =is ture velocity velocity !I\Ois ture content
Sample Ali.SllO de~ity {Ecf} content {%} { f!!S 2 ~f12s} no, classification (pcf) In mold Extruded (/.) In mold Extruded In mold Extruded In mold Extruded
1 129.2 127.0 7.1 6.0 2420 2300 2250 2 A-4(2) 121.0 120.5 120.5 10.2 9.3 9.3 2700 2600 2670 2590 3 A-7-6(13) 91.0 91.0 90.8 23.0 23.0 21.8 2500 2380 2500 2350 4 A-4(1) 118.0 117.8 117 .8 10.5 10.0 10.0 3400 3200 3380 3190 5 A-6-(2) 116.0 115.5 115.5 12.7 11.3 11.3 3610 3480 3020 2730
6 A-1-a 136.9 128.6 - 130. 1 7.1 5.7 5.9 2600 2470 1490 1630 7 A-4(1) 119.8 118.4 118.4 11. 7 8.7 8.7 3350 3170 2470 2120 8 A-6(7) 108. 5. 108.5 108.5 15.5 15.5 15.5 3060 2990 3060 2990 9 A-2-6(1) 122.9 121.8 121.8 11.2 8.7 8.7 3050 2880 2120 2300 lJ1
11 A-1-a 125.0 117.7 117. 7 7.0 3.8 3.8 2000 1750 1300 near 0 Vl
12 --·A-6(2)- -- 117 0 7 116.7 117.2 . 11.1 10.4 . 10.6 3250 3150 3210 3130 13 A-2-6(0) 127.0 12l~. 9 124.9 9.0 7.9 7.9 3650 3380 3230 2900 14 119.9 111.3 8.6 3.5 2540 2130 15 A-6(4) 112.B 112.0 112. 7 12. 7 12.0 12.5 3200 3100 3190 . 3100 16 A-2-4 125,7 124.0 124.0 9.4 7.6 7.6 3300 3050 2370 2130
18 A-7-6(4) 103.2 103.l 103,l 19.2 18.7 18.7 3200 3020 3190 3000 20 A-7-6(7) 111. 7 110.7 110.5 16.3 14.2 13.6 3050 3010 2800 2680 21 A-2-6 (0) 118.5 115.8 115.3 13.0 10.4 10.0 3550 3390 2760 2510 24 A-6(9) 104.2 99.6 100.0 13.0 10.5 10.7 2430 2250 1880 1760 25 A-6(9) 103.1 102.9 103.0 17 .o 15.8 16.0 2330 2200 2290 2170
26 A-1-b 117.0 115.9 116.4 4.0 2.4 2.8 1910 1620 1640 1500
"
56
Shapes of the moisture-density and moisture~velocity curves were
comparable for about two-thirds of the twenty-one materials tested.
With the exc,eption of sample number one in mold, moisture-velocity
curves peaked at some maximum velocity. This is not fully consistent
with the results of Sheeran, Baker and Krizek.15
As noted in Table 5, the moisture contents at maximum dry density
were not within±- 0.5% of those for maximum velocity, as presented
by Sheeran, et al. 15
Instead, moisture contents at a maximum velocity
were from 0 to about 3% less than those at maximum dry density, with the
exception of sample number 14 which was 5.1% less. These variations are
8 more consistent with the results presented by Manke and Galloway, who
demonstrated that maximum velocities occurred on the dry side of optimum
moisture content for a natural clay and silty clay. Results presented
in Part 1 of this report also noted similar reduction in moisture con-
tent from maximum dry density to maximum velocity.
Moisture contents at maximum velocity in-mold varied from 1.4%
greater to 0.5% less than those extruded, and were generally equal, one
to the other. However, maximum velocities in-mold we.re from 40 to 290
fps higher than those extruded. Velo.cities at maximum dry density and
optimum moisture content in-mold were from 180 fps less than, to 350 fps
higher than, those extruded (disre0
garding sample number 11). Most of
the variation in velocities in-mold to those extruded were probably due
to
1. A shortened time of sonic wave movement by refraction through
the steel mold.
57
2. A release of compactive energy following extrusion, decreasing
the magnitude of particle to particle contact within the
specimen.
In-mold velocities at optimum moisture content and maximum dry
density were from 0 to 1110 fps less than in-mold maximum velocities,
though over half were only 0 to 300 fps less. Disregarding sample number
11, extruded velocities at optimum moisture and maximum dry density
were from 0 to 1050 fps less than in-mold maximum velocities, with
slightly less than half only 0 to 300 fps less.
Though not conclusive, it is interesting to compare average in-mold
and extruded velocities at optimum moisture content and maximum dry
density with their respective broad AASHO classifications as noted in
the following table.
AAS HO In-mold Extruded classification velocity(fps) velocity (fps)
A-1 1477 1043
A-2 2620 2460
A-4 2840 2633
A-6 (without loess 3120 2988 samples 24 and 35)
'
A-6 (with loess 2775 2647 samples 24 and 25)
A-7 2830 2677
58
Disregarding the loess samples, numbers 24 and 25, there is an apparent
peak-out of velocities in the A-6 group, possibly indicating the maximum
potential of particle to particle contact of specimen grains. Includ-
ing the loess samples, there is a striking similarity of average
velocities from the A-2 through the A-7 classifications. The latter
point tends to substantiate a portion of the theory presented in Part 1
of the report; i.e., seismic velocity is not a direct measure of soil
density, and any correlation between density and velocity is empirical.
No in-place field tests were conducted with the V-Scope due to
termination of project. However, Table 6 presents a comparison of
selected V-Scope laboratory data with in-place field results using th~
Micro-Seismic Timer. The mutually connnon data point for comparison of
results at each sample number was the optimum moisture content obtained
during the V-Scope study. It is obvious from Table 6 that no correlation
existed; the field velocities in every cage being lower.
It is interesting to compare the magnitude of velocities obtained
using the Micro-Seismic Timer and the V-Scope as noted in Tables 4, 5 and
6. In general, maximum velocities with the Timer are less than those
with V-Scope, while maximum V-Scope velocities more closely follow the
range of velocities of seismic waves in near surface soils presented by
16 Leet and sununarized in the following table:
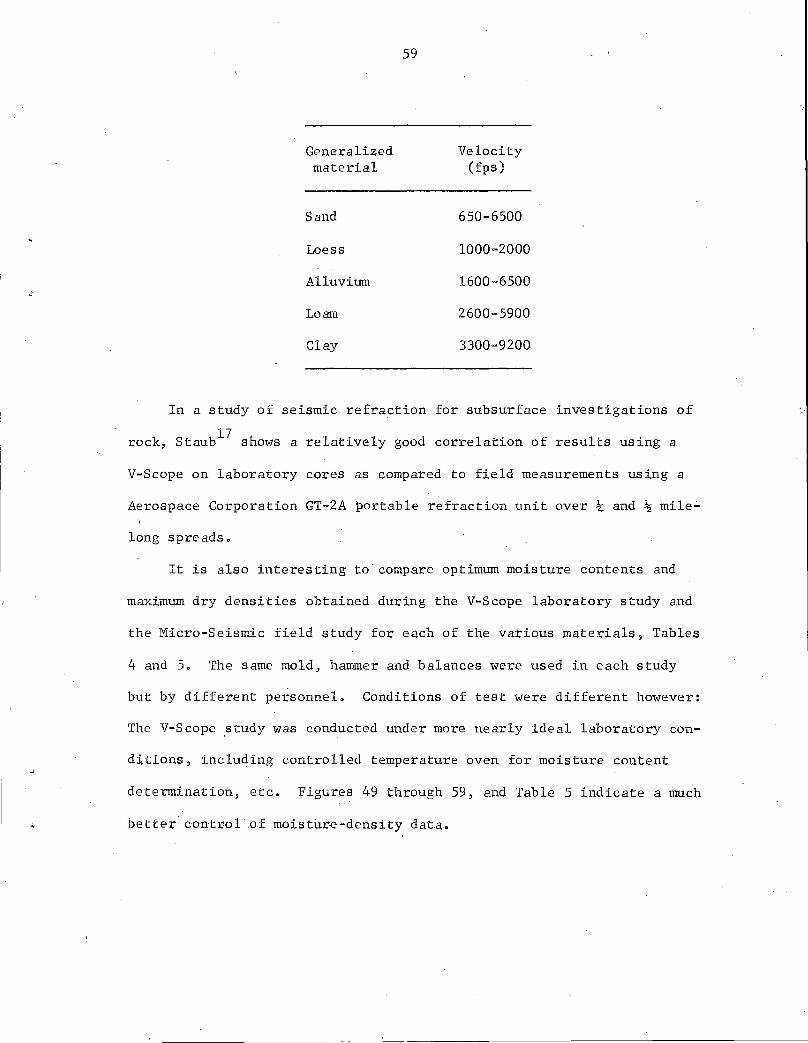
59
Generalized Velocity material (fps)
Sand 650-6500
Loess 1000-2000
Alluvium 1600-6500
Loam 2600-5900
Clay 3300-9200
In a study of seismic refraction for subsurface investigations of
17 rock, Staub shows a relatively good correlation of results using a
V-Scope on laboratory cores as compared to field measurements using a
Aerospace Corporation GT-2A portable refraction unit over ~ and ~ mile.:.
long spreads.
It is also interesting to compare optimum moisture contents and
maximum dry densities obtained during the V-Scope laboratory study and
the Micro-Seismic field study for each of the various materials, Tables
4 and 5. The same mold, hammer and balances were used in each study
but by different personnel. Conditions of test were different however:
The V-Scope .study was conducted under more nearly ideal laboratory con-
dLtions, inclu4ing controlled temperature oven for moisture content
determination, etc. Figures ti.9 through 59, and Table 5 indicate a much
better control .of moisture-density data.

J
60.
Table 6. Comparison of V-Scope laboratory results with micro-seismic Timer field results.
V-ScoEe {Laboratory~ Micro-Seismic Timer {Field~ Velocity at Maximum maximum dry ·velocity Dry density
Optimum deneity-optimum at optimum at optimum Maximum moisture moio tu re con1:ent moisture moiature
Sample AAsHO dry density content {f12s) content content no. classification (pcf) (%) In mold E1ttruded "(fps) (pcf)
3 A-7-6(13) 91.0 23.0 2500 2350 1050 (a) 93.0
8 A-6(7) 108.5 15.5 3060 2990 1250 (a) 97.0
.11 A-1-a 125.0 7.0 1300 near 0 930(b) 119.0
12 A-6(2) 117. 7 11. l 3210 3130 1550 (b) 115. 7
13 A-2-6(0) 127.0 9.0 3230 2900 2150 (b) 134.6
24 A-6(9) 104.2 13.0 1880 1760 1040(b) 76.0
25 A-6(9) 103.1 17.0 2290 2170 1070 (b) 99.0
26 A-1-b 117 .o 4.0 1640 1500 990(b) 110.0
~~~Velocity measured tranaverae to centerline. Veloc~tY meaaured. parallel to centerline. ·
61
CONCLUSIONS AND ~ECOMMENDATIONS
Following is a sunn:nary of conclusions and recommendations from
laboratory te~ts utilizing the V-Scope for determination of first
arrival seismic wave velocities.
1. The V-S cope appears to be more reliable and much less time
.1 consuming _than a seismic timer for determination of velocities.
..
2. The equipment appears suitable for use with all types of
materials compacted to a Proctor specimen size.
3. Shapes of moisture-density and moisture-velocity curves were
comparable for about two-thirds of the materials tested. All
but one of the remainder of the materials showed a peak point
moisture-velocity curve.
4. Moisture contents at maximum velocity were equal to or less
than moisture contents at maximum dry density which is con
sistent with previously reported data.
5. Velocities in-mold were generally higher than those obtained
on extruded specimens of the same material. Field studies are
needed to see which velocity is the most acceptable.
6. The V-Scope is adaptable to field use and can be fitted with
other specific shapes or frequencies of transducers than those
used in this laboratory study. Additional lab and field studies
with this equipment are definitely recommended •
ACKNOWLEDGMENTS
The studies presented in Parts 1 and .2 of this report were sponsored
by the Iowa Highway Research Board, Iowa State Highway Conuniss ion, and

62
Bureau of Public Roads, US Department of Transportation. Sincere
appreciation is extended to all of the above organizations for their
support, assistance, and counseling during the conduct of the pro
ject.
A particular note of thanks is extended ·to the County Engineers
of those counties noted in Tabl.e 3, who so generously cooperated with
project personnel during the field tests. Unfortunately they are too
numerous to name.
A special thanks to the following personnel of the Engineering
Research Institute, Soil Research Laboratory, for their valuable con
tribution to the -project: Messers .J. M. Hogan and A. J. Gonzalez,
research assistants; and Messers Jerry Spicer, Dan Nuebel, Brad Moses,
Tom Leuschen, Jack Morgan, Milo Eckles, Chuck Powell, Mike Lindebak, and
Danvin Fox, laboratory technicians·.
\
·•
,)
63
REFERENCES
l~ Dobrin, Milton B., Introduction to Geophysical Prospecting, 2nd ed. New York, N.Y., McGraw-H~ll Book Co., Inc. 1960.
2o Barkan, D. D., Dynamics of Bases and Foundations, New York, N.Y., McGraw-Hill Book Co., Inc. 1962.
3. Jones, R. and Whiffin, A. C., A Survey of.Dynamic Methods of Testing Roads and Runways, Highway Research Board Bulletin 277: 1-7. 1960.
4. Goetz, W. H., "Sonic Testing of Bituminous Mixtures," Association of Asphalt Paving Technologists Proceedings 24: 332-355. 1955.
5. Whitehurst, E. A., Evaluation of Concrete Properties from Soni.c Tests, Am. Ceram. Inst./Iowa State University Press. 1966. 94 pp.
6. Whitehurst, E. A., "Pulse Velocity Techniques and Equipmen,t for Tes ting Concrete," Highway Research Board Proceedings 1954: 226-242. 1954.
7. Leslie, J. R., "Pulse Techniques Applied to Dynamic Testing," American Society for Testing Materials Proceedings 50: 1314-1323. 1950.
8. Manke, P. G. and Galla.way, B. M., "Pulse Velocities in Flexible Pavement Construction Materials," Highway Research Record 131: 128-153. 1966.
9. Moore, R. W., "Summary of Results of Current Seismic Wave Velocity Versus Density Tests Performed for Sub-Task Group on .Nondestructive Testing-Quality Control," Unpublished mimeographed paper. Washington, D.C., Office of Research and Development Materials Research Divisionq Bureau of Public Roads. US Department of Commerce. ca. 1965.
10. Illinois Institute of Technology Research Institute. (Part G. Seismic Tests). Unpublished mimeographed paper. Chicago, Illinois, author. 1966.
11. American Society for Tes ting Materials. 1965 Book of ASTM Standards. Part 11. Philadelphia, Pa., author. 1965.
12. Seed, H. and Chan, C. K., "Structure and Strength Characteristics of Compacted Clays, 11 ASCE Jour. 85:SM5 :Pto 1:1:87-120. 1959.
13. Mereu, R. F. s Uffen, R. J., Beck, A. E., "The· Use of a Coupler in the Conversion of Impact Energy into Seismic Energy," Geophysics, Volume XXVIII No. 4, pp. 531-546, August 1963.

64
14. Geophysical Specialities Division, Minnetech L,aboratories, Inc., "Instruction Manual, Engineering Seismograph," 1964.
' 15. Sheeran, D. E., Baker, W. H. and Krizek, R. V., "Experimental
Studies of Pulse Velocities in Compacted Soils," Highway Research ,R~cord 177: 226-238. 1967.
16. · Leet, L. D., Earth Waves, Harvard University Press and John Wiley and Sons, Inc., New York. 1950. (Original not. available for examination; cited in Bowles, E., Foundation Analysis and Design, McGraw-Hill, Inc., New York, 1968.)
17. Staub, W. S., "Seismic Refraction, a Technique for Subsurface Investigation in Iowa, 11 Unpublished PhD Thesis, Ames, Iowa, Library, Iowa State University of Science and Technology. 1969.