seismicity from february 2006 to september 2007 at the … · rift in the west and the kenya rift...
TRANSCRIPT

Solid Earth, 3, 251–264, 2012www.solid-earth.net/3/251/2012/doi:10.5194/se-3-251-2012© Author(s) 2012. CC Attribution 3.0 License.
Solid Earth
Seismicity from February 2006 to September 2007 at the RwenzoriMountains, East African Rift: earthquake distribution,magnitudes and source mechanisms
M. Lindenfeld 1, G. Rumpker1, A. Batte2, and A. Schumann1
1Institute of Geosciences, Goethe-University, Frankfurt am Main, Germany2Department of Geology, Makerere University, Kampala, Uganda
Correspondence to:M. Lindenfeld ([email protected])
Received: 14 March 2012 – Published in Solid Earth Discuss.: 8 May 2012Revised: 12 July 2012 – Accepted: 26 July 2012 – Published: 21 August 2012
Abstract. We have analysed the microseismic activity withinthe Rwenzori Mountains area in the western branch of theEast African Rift. Seismogram recordings from a temporaryarray of up to 27 stations reveal approximately 800 events permonth with local magnitudes ranging from –0.5 to 5.1. Theearthquake distribution is highly heterogeneous. The major-ity of located events lie within faults zones to the east andwest of the Rwenzoris with the highest seismic activity ob-served in the northeastern area, where the mountains are incontact with the rift shoulders. The hypocentral depth distri-bution exhibits a pronounced peak of seismic energy releaseat 15 km depth. The maximum extent of seismicity rangesfrom 20 to 32 km and correlates well with Moho depths thatwere derived from teleseismic receiver functions. We observetwo general features: (i) beneath the rift shoulders, seismic-ity extends from the surface down to ca. 30 km depth; (ii) be-neath the rift valley, seismicity is confined to depths greaterthan 10 km. From the observations there is no indication fora crustal root beneath the Rwenzori Mountains. The magni-tude frequency distribution reveals ab-value of 1.1, which isconsistent with the hypothesis that part of the seismicity iscaused by magmatic processes within the crust. Fault planesolutions of 304 events were derived from P-polarities andSV/P amplitude ratios. More than 70 % of the source mecha-nisms exhibit pure or predominantly normal faulting. T-axistrends are highly uniform and oriented WNW–ESE, whichis perpendicular to the rift axis and in good agreement withkinematic rift models. At the northernmost part of the region
we observe a rotation of the T-axis trends to NEN–SWS,which may be indicative of a local perturbation of the re-gional stress field.
1 Introduction
The East African Rift System (EARS) separates the Nu-bian and the Somalian plates and represents one of theworld’s largest continental rift structures (Bendick et al.,2006; Chorowicz, 2005; Ebinger, 1989). Starting at the Afartriple junction in the north, it extends approximately in N–Sdirection through East Africa, consisting of a series of con-necting rifts segments (Fig. 1). South of the Main EthiopianRift, the system splits up into two branches: the AlbertineRift in the west and the Kenya Rift in the east. They enclosethe Tanzania Craton which is surrounded by Proterozoic mo-bile belts (Nyblade and Brazier, 2002). Further south the sys-tem continues as the Malawi Rift and terminates at the coastof southern Mozambique.
Globally recorded earthquakes (Fig. 1) as well as compi-lations on regional and local earthquake studies have shownthat the western branch of the EARS exhibits significantlyhigher seismic activity than the eastern branch (Midzi etal., 1999; Twesigomwe, 1997). Numerous publications fo-cus on the hypocentral depth distribution, which turns outto extend down to the crustal base – in contrast to otherseismically active continental regions where earthquakes are
Published by Copernicus Publications on behalf of the European Geosciences Union.

252 M. Lindenfeld et al.: Seismicity at the Rwenzori Mountains
Fig. 1. The East African Rift System. Red dots: global seismic-ity; 1973–2008, withM ≥ 4.5 (NEIC catalogue). The small blacksquare within the Albertine Rift marks the Rwenzori area (Fig. 2).
restricted to the upper crust (e.g. Albaric et al., 2009; Camel-beek and Iranga, 1996; Foster and Jackson, 1998; Nybladeand Langston, 1995; Shudofsky et al., 1987; Young et al.,1991).
The 5000 m high Rwenzori Mountains are situated withinthe Albertine rift, in an area with the highest seismic activ-ity of the whole rift system. They represent a non-volcanicbasement block whose origin and relation to the evolutionof the EARS are the focus of the RiftLink project (www.riftlink.org). Despite of the high activity, there is only lit-tle knowledge on the local seismicity in the Rwenzori re-gion. An early microearthquake survey in the Rwenzori area(Maasha, 1975) was based on four portable seismic sta-tions. They were operated at 28 different sites during Juneto September 1973, moving the instruments after a periodof 4 to 20 days to new locations. An average of 5 to 20events per day was recorded in the area with magnitude es-timates between –2 and 4 and focal depth reaching down to25 to 40 km. However, these depth estimates exhibit largeuncertainties because of the limited number of stations. Asmall number of composite fault plane solutions indicatednormal faulting in the Rwenzori area. A more recent studyby Tugume and Nyblade (2009) was restricted to the north-
Fig. 2. The Rwenzori region with seismic station network (trian-gles) and recorded local seismicity (red circles) from February 2006to September 2007. The dashed line in the NE marks the southernend of the Toro-Bunyoro fault; the dotted ellipse in the centre cov-ers the area of increased seismicity within the Rwenzori block (seeSect. 3.1 in text).
ern end of the Rwenzori Mountains. The authors present theseismic activity between March and June 2006 based on anetwork of eight stations and they investigate the hypocen-tral depth extent and its implication on the heat flow in thearea. The observed focal depth distribution exhibits a maxi-mum number of earthquakes at 16 km and falls off sharply at22 km extending down to 31 km. In all of the above investiga-tions the depth extent of seismicity is restricted to the crust.However, Lindenfeld and Rumpker (2011) have reported thedetection of mantle earthquakes to the northeast of the Rwen-zori Mountains, which are likely related to magmatic intru-sions in relation to lithospheric break up.
In the present paper we provide a comprehensive charac-terization of the seismic activity within the whole Rwenzoriregion, covering a substantially larger area and time periodthan previous investigations. For the first time we presentmagnitude distributions and reliable source mechanisms of alarge set of earthquakes, together with a detailed discussionof the complex hypocentral depth distribution. These data areessential for a better understanding of the rifting processes inthis part of the EARS and will improve our general insightinto the mechanisms of active rifts.
2 Seismic network and data analysis
The data we present in this study were recorded from Febru-ary 2006 to September 2007 by a temporary network of 29seismic stations covering an area of 140× 80 km2 in the
Solid Earth, 3, 251–264, 2012 www.solid-earth.net/3/251/2012/

M. Lindenfeld et al.: Seismicity at the Rwenzori Mountains 253
Rwenzori Mountains region. The instruments were installedin the framework of the RiftLink Project, however, somedata were also provided by the BGR/GSMD GEOTHERM-Subprogram (German Geological Survey, BGR, Geologi-cal Survey and Mines Department, GSMD, Uganda). Un-til April 2006, a small network of nine 3-component short-period instruments was running in the northern part of thearea equipped with Reftek data loggers sampling the dataat 100 Hz in triggered mode. Starting in May 2006, the netwas expanded by 20 stations equipped with EDL data log-gers recording continuously at a sample rate of 100 km.Seven of these stations were equipped with broadband instru-ments (Guralp CMG-3T), the remainder with short-periodseismometers (Mark L-4C3-D). Occasionally, some instru-ments were moved to new places so that the network in totalconsisted of 35 station locations (Fig. 2).
2.1 Hypocentre location
In order to detect and extract the numerous local events weapplied a STA/LTA trigger algorithm to the continuous datastreams. Prior to this procedure, the data were filtered with aButterworth high pass at 1 Hz. Tests were performed to de-termine the optimum set of trigger parameters, i.e. to identifya maximum number of earthquakes without too much falsetrigger events. Time windows for short- and long-term aver-age (STA, LTA) were set to 3 s and 30 s respectively, a ratioof STA/LTA = 3.0 was chosen to trigger an event. The routinedata analysis was done with the SEISAN software package(Havskov and Ottemoller, 1999), including an implementa-tion of HYPOCENTER, a location algorithm by Lienert andHavskov (1995). Arrival times were manually picked on theunfiltered seismograms to avoid phase shift effects, P waveson the vertical component and S on one of the horizontalcomponents. For earthquake location we used the velocitymodel UVI-N74 of Bram (1975) with a fixed vp/vs ratio of1.74 (Table 1). The Bram model was derived from local andregional Pn phases travelling predominantly parallel to theAlbertine rift. To test the limits of such a relatively simple1-D velocity model, we relocated the hypocentres using asynthetic 3-D model with several crustal velocity anomaliesbetween –7 % and +7 % (Jakovlev, 2010). The average devi-ation of the relocated hypocentres compared to the 1-D loca-tions was about 1.30 km, which is smaller than the estimated1-D location error (<3 km, see below). Furthermore, 3-D ve-locity anomalies from travel-time tomography are only wellconstrained in the centre of the seismic station network withrelatively poor vertical resolution (Jakovlev et al., 2011). Forthese reasons we think that the use of a 3-D velocity modelwould not improve the location precision of the Bram model.
To give an impression of the data quality, we present seis-mograms of two earthquakes (Fig. 3). The first event (toprow) was relatively weak (ML = 0.9). The plotted seismo-grams were recorded at stations KARU (1 = 12.9 km) andKISA (1 = 49.2 km). Both stations show clear P- and S-
Table 1. Velocity model UVI-N74 of Bram (1975) used for earth-quake location. S-velocities were calculated with a constantvP /vS
ratio of 1.74 as derived by Bram.
depth [km] vP [km s−1] vS [km s−1]
0 6.00 3.4516 6.75 3.8832 8.05 4.6360 7.75 4.45125 8.20 4.71
onsets with good signal-to-noise ratios that enable reliablearrival time pickings (dashed lines). The second event (bot-tom row) was relatively strong (ML = 3.8). Records are fromstations KASS (1 = 2.8 km) and KISA (1 = 49.3 km).
In general it was possible to determine P-arrival times witha precision of± 0.05 s. We assume a slightly reduced accu-racy for S-wave arrivals of± 0.1 s. This is due to the lowerfrequency content of the S-phases and because in many casesthe true S-onset is blurred by the P-wave coda. During the lo-cation process the SEISAN software provides estimates oflocation errors based on travel time residuals and the sta-tion network geometry. The RMS residuals range between0.1 s and 0.2 s in most cases. In the following analysis weuse only events with location errors≤ 5 km which is 76 %of all located events. The average location errors for theseevents are 1.7 km (horizontally) and 2.4 km (vertically), re-spectively. The number of stations used to locate an earth-quake increases with the magnitude. Typically, the smallestevents (ML < 1.0) are located with 4–5 stations. Events withmagnitudes from 1.0–2.0 are located by up to 13 stations.For the strongest events, we used up to 20 stations. In somecases recordings of the complete network (27 stations) wereavailable.
2.2 Magnitude determination
Local magnitudes were determined using the formula of Hut-ton and Boore (1987):
ML = a ∗ log(amp) + b ∗ log(dist) + c ∗ dist+ d,
where amp is the maximum horizontal ground amplitude(zero-peak) in nm of a Wood-Anderson simulation of therecorded seismogram, and dist is the hypocentral distancein km. So far, there are no calibration parameters (a, b, c,d) available for the Rwenzori region. We use the presets ofthe SEISAN software package:
a = 1.0,b = 0.91,c = 0.00087,andd = 1.67,
which were derived by Alsaker et al. (1991) (Ottemoller,2010, personal communication). Figure 4 presents the mag-nitude of an event calculated at twelve different stations asa function of epicentral distance (circles). The average of all
www.solid-earth.net/3/251/2012/ Solid Earth, 3, 251–264, 2012

254 M. Lindenfeld et al.: Seismicity at the Rwenzori Mountains
Fig. 3. Seismogram examples of two events, each recorded at two different epicentral distances. Top row(a, b): Relatively week event 1(ML = 0.9), recorded at stations KARU (1 = 12.9 km, left) and KISA (1 = 49.2 km, right). Bottom row(c, d): Strong event 2 (ML = 3.8)recorded at stations KASS (1 = 2.8 km, left) and KISA (1 = 49.3 km, right). Seismometer channels Z, N, and E are plotted from top tobottom of each record. Amplitudes are plotted in digital counts. Picked P- and S-phases are marked by dashed lines.
stations isML = 2.3 with a standard deviation of± 0.3. Ob-viously, there is no systematic distance dependence of thecalculated magnitudes. This suggests that the calibration pa-rameters of Alsaker et al. (1991) give an appropriate descrip-tion of the attenuation in the Rwenzori area. For comparisonwe re-calculated the magnitudes using calibration parame-ters that were derived for Tanzania (Langston et al., 1998)and the original values for Southern California (Hutton andBoore, 1987). The results are also plotted in Fig. 4 and showno significant deviation from the magnitudes calculated withthe default parameters of SEISAN.
2.3 Temporal variations of seismic activity
The analysis of the recorded data revealed high microseis-mic activity in the Rwenzori region. Figure 5 presents themonthly numbers of located earthquakes which correlatesfairly well with the number of operating stations. Startingin February 2006, the number of events increases until Julywhen the expansion of the station network was finished. Be-tween August 2006 and September 2007, when the networkwas running in a more or less steady state, we located on av-
erage 766 events per month, 613 of them with errors≤ 5 km(light and dark bars, respectively). We are not able to identifyany clear seasonal variations of the seismicity rate. However,we observe a distinct dependence on the time of day (Fig.6).There is an apparent breakdown in seismic activity between04:00 and 17:00 UT which corresponds to 07:00–21:00 LT.The number of located events decreases to less than 25 %of the night time values. We associate this observation withan increased noise level during day time. During this periodthe sensitivity of the seismometer network is considerablyreduced as a result of human activity, such as field work andtraffic, which starts shortly after sunrise (ca. 06:00) and endsa few hours after sunset (ca. 18:00). However, this affectsonly events with magnitudes smaller than 1.5, whereas thenumber of larger earthquakes is more or less constant overthe whole day.
Solid Earth, 3, 251–264, 2012 www.solid-earth.net/3/251/2012/

M. Lindenfeld et al.: Seismicity at the Rwenzori Mountains 255
Fig. 4.Magnitude of an event calculated at twelve different stationswith epicentral distances between 44 km and 152 km. In this studywe used the default calibration functions of the SEISAN software(circles) based on Alsaker et al. (1991). The average of all stationscomes toML = 2.3 (horizontal line) with a standard deviation of± 0.3 (grey area). For comparison we have also computed magni-tudes using the calibration parameters of Langston et al. (1998) forTanzania (plus-signs) and the calibration parameters for S. Califor-nia derived by Hutton and Boore (1987).
Fig. 5.Monthly numbers of located events. Light grey bars indicateall located earthquakes; dark grey bars indicate events that could belocated with errors≤ 5 km. The number of operating stations at thebeginning and middle of each month is marked by black symbols.
3 Results and discussion
3.1 Hypocentre distribution
In total we located almost 14 000 earthquakes from Febru-ary 2006 to September 2007 in the Rwenzori area. The seis-micity map (Fig. 2) includes ca. 10 600 events with locationerrors≤ 5 km. Only few earthquakes are located within theRwenzori block. The majority of the epicentres lie withinfault zones to the east and west of the mountain range. Thismay possibly indicate that the mountains can be consideredas a decoupled rigid block that is surrounded by two rift seg-ments and resistant to seismogenic deformations as proposedby Koehn et al. (2008, 2010). However, between 0.5◦ and0.6◦ latitude, we detected a narrow band of seismicity, sepa-rating the main Rwenzori block in the south from its northern
Fig. 6.Number of located events as function of daytime. There is anobvious diurnal variation for earthquakes with magnitudes smallerthan 1.5 caused by human activity which reduces the sensitivity ofthe station network during daytime.
ridge, see dotted ellipse in Fig. 2. This is probably an indi-cation of stresses and relative movements acting between thetwo mountain segments. The highest seismic activity is ob-served within a region east of the Rwenzoris between LakeAlbert and Lake George, where the mountains are connectedto the eastern rift flank. The majority of these events aregrouped in clusters rather than in planar structures. Only infew cases it is possible to associate the epicentre distribu-tion with known faults. At the northeastern tip of the moun-tains, between 0.8◦–1.0◦ latitude and 30.2◦–30.5◦ longitude,we recorded high seismicity aligned with the N–E trendingeastern rift flank. These events are probably located at thesouthern segment of the Toro-Bunyoro fault (Fig. 2), whichruns in NE direction along the eastern side of the Lake AlbertBasin (e.g. Ring, 2008). However, at about 1.0◦ N seismic ac-tivity on the fault ends abruptly and continues more diffuseinto the Lake Albert Rift. In the southwestern parts of theRwenzori region we observed only weak seismic activity. Aswill be shown in Sect. 3.3., this is probably an artefact dueto the absence of stations in that area, which decreases thesensitivity of the station network and enables the detectionof only the stronger events. Currently we are operating a newnetwork that covers the whole Rwenzori region including thewestern and southwestern parts situated in the DemocraticRepublic of Congo. The analysis of the data will answer thequestion if seismic activity in this region is actually weak orhas a similar high level, as observed in the northeastern partsof the Rwenzori area.
3.2 Depth distribution
In Fig. 7 we present a histogram of the general hypocentraldepth distribution in the Rwenzori area. Seismicity extendsfrom the surface down to a depth of 32 km with a clear max-imum of activity at 15 km. However, the velocity model ofBram (1975) which was used for location has a discontinu-ity at 16 km depth (see inset of Fig. 7 and Table 1). Such avelocity jump may induce earthquake concentrations at the
www.solid-earth.net/3/251/2012/ Solid Earth, 3, 251–264, 2012

256 M. Lindenfeld et al.: Seismicity at the Rwenzori Mountains
Fig. 7. Hypocentral depth distribution derived by using the BRAM(1975) velocity model (grey bars). See inset and Table 1. The redoutlines illustrate the depth distribution of the same events, lo-cated with varying start depth and constant velocity within the crust(dashed red line in the inset).
corresponding depth, especially in regions with spare stationcoverage. For this reason we have checked the stability ofour locations by relocating the events with a simple constantvelocity model (dashed red line in the inset of Fig. 7). Thestarting depth of the location iteration was systematically in-creased from 5 km to 25 km with an increment of 5 km andthe solutions with minimum RMS residual times were finallyselected. The resulting hypocentral depth distribution con-firms the previous locations (Fig. 7, red bars). The maximumof seismicity still occurs at 14–16 km depth, although a smallpart of the hypocentres has been shifted to greater depths. Forthis reason we are convinced that the hypocentral depths arereliable, at least in the central region of the network.
The derived depth distribution agrees well with earlierobservations leading to the conclusion that in East Africa,earthquakes occur throughout the crust, but not deeper thanthe Mohorovicic discontinuity (Albaric et al., 2009; Bra-zier et al., 2005; Foster and Jackson, 1998). While in mostother continental regions seismicity is restricted to the uppercrust, similar focal depth distributions throughout the com-plete crust are also reported for the Baikal Rift (Chen andMolnar, 1983; Emmerson et al., 2006; Jackson et al., 2008;Maggi et al., 2000). Deverchere et al. (2001) find a seismo-
Fig. 8. Position of the vertical sections presented in the next Fig. 9.Four profiles (A–D) cross the Rwenzori area approximately per-pendicular to the rift axis. One profile (E) runs in SSW–NNE direc-tion parallel to the rift axis and penetrates the Lake George rift seg-ment which extends northward from Lake Edward to Lake George.Coloured symbols denote events which are projected onto the re-spective vertical plane. Moho depths at different stations (white tri-angles) were derived by Wolbern et al. (2010) using teleseismic re-ceiver functions. The numbers beside the station labels are Mohodepths in km.
genic lower crust with significant earthquake activity down to35–40 km and only few earthquakes below the Moho in theBaikal Rift system, very similar to our results. From mod-elling of the brittle-ductile transition in the crust they infer aquartz rheology at 0–10 km depth and a diabase rheology at10–45 km depth.
For a more detailed analysis of the hypocentral depth dis-tribution we compiled several vertical sections of seismicitytransecting the area in different places and directions (Fig. 8).Four profiles (A–D) are oriented more or less perpendicularto the rift axis, whereas profile E runs parallel to the rift fromNNE to SSW. Black dots in Fig. 8 mark the background seis-micity; coloured symbols represent hypocentres that wereprojected onto the respective planes. The vertical sectionsare presented in Fig. 9. In addition to the hypocentres, wehave marked the Moho depths determined at several stationsby teleseismic receiver functions (Wolbern et al., 2010). Thelocations of these stations are also indicated in Fig. 8. In con-trast to the overall depth distribution of Fig. 7, we now ob-serve a highly complex and individual picture at the differentvertical sections. The approximate horizontal positions of riftshoulder and rift valley along the profiles are marked in Fig. 9by dark and light shaded areas, respectively, for better orien-tation.
Solid Earth, 3, 251–264, 2012 www.solid-earth.net/3/251/2012/

M. Lindenfeld et al.: Seismicity at the Rwenzori Mountains 257
Fig. 9. Hypocentre depth sections A–E. The position of the profiles is plotted in Fig. 8. Heavy black bars indicate Moho depths as derivedfrom teleseismic receiver functions at different seismic stations (Wolbern et al., 2010). The dashed circle in section B marks the position ofseven mantle earthquakes which were detected in 53–60 km depth (Lindenfeld and Rumpker, 2011). The approximate horizontal position ofrift shoulder (or Rwenzori horst) and rift valley is marked by dark and light shaded areas, respectively. The S-velocity model in the lowermostrow was derived by receiver-function inversion at MWEY. It shows a distinct low velocity zone (LVZ) that is traced by two seismicity layersin profile E.
Profile A: This profile crosses the Albertine Rift northof the Rwenzori mountains and ends up at the rift shoul-der to the east. Beneath the shoulder (35–45 km on thehorizontal profile axis) seismicity is concentrated along avertical oriented plane reaching from the surface down to30 km. In this area the Moho depth was determined at 34 km(station KABE) indicating that all events occur within thecrust. On the western side however (5–30 km), beneath the
rift valley, hypocentres are restricted between 10 km and25 km depth. The Moho is also raised up to 25 km depth atSEML. (Moho depth at SEML was originally published with34 km. Wolbern (2011, personal communication) modifiedthe Moho depth at this site after reinterpretation of the re-ceiver functions on the basis of additional data). We observethis pattern of hypocentral depth distribution in all profiles.There are two general features. (1) Beneath the rift shoulders
www.solid-earth.net/3/251/2012/ Solid Earth, 3, 251–264, 2012

258 M. Lindenfeld et al.: Seismicity at the Rwenzori Mountains
or in areas where the Rwenzoris are connected to the shoul-ders, seismicity extends from the surface down to ca. 30 kmdepth. (2) Beneath the rift valley, we observe no seismicactivity within the uppermost 10 km together with reduceddepth extension. The absence of shallow seismicity beneaththe rift graben is also observed at Lake Bogoria (Young etal., 1991) and Lake Magadi (Ibs-von Seht et al., 2001), bothlocated at the southern end of the Kenya rift. They attributedthe activity deeper than 10 km to faults in the basement be-neath the rift. Similar observations are reported by Kato etal. (2009) in the eastern margin of the Japan Sea back-arcbasin, where they imaged a Miocene rift system buried be-neath thick sedimentary layers. Ductile creeping of uncon-solidated rocks may be the reason for the aseismic behaviour.
Profile B: This section is crossing the northern part ofthe Rwenzoris. Again, there is a distinct difference in thehypocentral depth distribution: west of the mountains (to-wards the rift valley, 5–25 km) focal depths range from 10to 20 km. On the eastern side (40–55 km), where the Rwen-zori Mountains are connected to the rift shoulder, seismicityextends from the surface down to 30 km depth. In betweenwe observe only weak seismic activity which is typical forthe Rwenzori block. Moho depths show the same charac-teristics. In the rift valley they range from 21 km to 27 km(BURO, SEMP, ITOJ, KARU) and beneath the rift shoulderfrom 29 km to 33 km (KMTW, KAGO, MIRA). A remark-able feature is the detection of mantle earthquakes in thisarea. A small group of seven earthquakes is located at depthsbetween 53 km and 60 km (dashed circle) which is clearlybelow the Moho. These events occurred during a period of14 days with local magnitudes between 1.4 and 2.4. We arenot aware of similarly deep earthquakes in other regions ofthe EARS. A detailed study of these events can be found inLindenfeld and Rumpker (2011).
Profile C: This profile traverses the Rwenzoris in an areawhere the main block is connected with the northern ridge.Here we observe a strip of seismicity crossing the moun-tains in E–W direction (30–40 km on horizontal profile axis)with hypocentres between 10 km and 20 km depth. On theeastern side seismicity again extends from the surface downto 25 km. Moho depths at NGIT and KASS are 25 km and24 km, respectively.
Profile D: This depth section starts beneath the centralpeaks of the Rwenzori block and crosses the Edward rift to-wards the eastern rift shoulder. Again, there is no seismic ac-tivity in the uppermost 10 km beneath the rift graben – sim-ilar as already observed beneath the Albert rift in profilesA–C. Moho depths close to the mountain (KILE, RUBO) areapproximately 22 km which is about 5 km deeper than themaximum depth of seismicity in this area. Further to the eastseismicity deepens systematically down to more than 25 km.At the end of the profile, beneath the eastern rift shoulderthe Moho discontinuity is located at 32 km depth (NYAN,RWEB).
Fig. 10. Histogram of S-P travel-time differences observed at sta-tions with epicentral distances between 20 and 25 km. The hypocen-tres are located at the southern part of vertical section E1-E2(Fig. 9). The bimodal distribution oftS − tP confirms the observedseismic activity in 15 and 20–25 km depth, respectively.
Profile E:This profile runs east of the Rwenzoris, roughlyin N–S direction, parallel to the northward penetrating Ed-ward rift. Again, there is no seismic activity within the up-permost 10 km beneath the rift valley. At its northern end(E2), where the profile leaves the tip of the rift, seismicityextends from the surface down to about 25 km depth. Furthersouth the hypocentres concentrate at 15 km depth. Then theseismic activity splits up into two horizontal levels at 15 kmand 25 km depth, respectively.
However, profile E is situated in the southern region withlow station density and therefore the observed seismicity pat-tern may be an artefact due to the discontinuity of the veloc-ity model at 15 km depth, as discussed in the introductionof Sect. 3.2. A histogram of travel-time differences betweenS- and P-waves is a simple means to verify the supposed bi-modal depth distribution. For this purpose we selected a sub-set of events located at the southern part of profile E, werewe observe a clear separation of seismic activity in 15 km and20–25 km depth. Travel-time differences (tS−tP ) were calcu-lated for epicentral distances between 20 km and 25 km. Thefrequency distribution (Fig. 10) clearly indicates two max-ima: a large one attS − tP = 3.4 s, corresponding to eventsin about 15 km depth and a smaller one attS − tP = 4.0 s,corresponding to the deeper events. A rough estimate for anepicentral distance of 23 km yieldstS − tP = 3.4 s for a focaldepth of 15 km, andtS − tP = 4.0 s for focal depth of 23 km,assuming vp = 6.0 km s−1 and vp/vs = 1.74. This estimateagrees well with the two peaks of the observedtS − tP his-togram and supports the thesis that seismic activity concen-trates in two different depth levels in the southern part ofprofile E.
Furthermore, there is a remarkable coincidence betweenMoho depth and hypocentral depth extension, both increas-ing towards the south, although seismicity fades out and hasa more diffusive character at the southern profile end. This
Solid Earth, 3, 251–264, 2012 www.solid-earth.net/3/251/2012/

M. Lindenfeld et al.: Seismicity at the Rwenzori Mountains 259
Fig. 11.Spatial distribution of the computed magnitudes. Colouredsymbols represent different magnitude classes, see legend. Whitetriangles indicate the station locations. Small events (green and bluesymbols) could only be located in areas with high station density.This illustration is a clear indication that the apparent decrease ofseismicity southwest of the Rwenzoris (cf. Fig. 2) is probably dueto the lack of stations in this region. Two rectangles mark the ar-eas where the magnitude-frequency relations presented in Fig. 12were calculated. The yellow star marks the epicentre of the largestevent that was recorded during the observation period (29 May 200615:30,ML = 5.1).
is certainly due to the fact that we have to expect less loca-tion accuracy for events at the border of the station network.The seismicity seems to trace the upper and lower edge ofa low velocity zone (LVZ) that was identified by receiverfunction inversion at station MWEY below 15 km depth andcan be seen also beneath KASE and NYAN at similar depthbut less pronounced (Wolbern et al., 2010). From modellingthe authors derive a strong velocity decrease which is un-likely caused by compositional changes of the crustal rock(see S-velocity graph in Fig. 9). Wolbern et al. (2010) in-terpret this channel as a possible zone of partial melt withinthe crust related to local volcanic fields in the area. Reducedbrittleness of the lower crust caused by increased tempera-ture could explain the observed decrease of seismic activitybetween 15 km and 25 km depth in this area.
3.3 Magnitude distribution
Local magnitudes were calculated as specified in Sect. 2.2.The results for the complete data catalogue range fromML =
−0.5 up to ML = 5.1 with a magnitude of completenessMC = 1.3 and ab-value of≈ 1.1, as derived from the cu-mulative magnitude-frequency distribution by a linear leastsquares fit. However, the map in Fig. 11 presents a highly het-
Fig. 12. Cumulative magnitude-frequency distribution for area 1(circles) and area 2 (triangles), see Fig. 11. There is no significantdifference between the slopes (b-values) of the two distributions.Both areas exhibit ab-value slightly above 1, but they show differ-ent magnitudes of completeness (MC).
erogeneous spatial distribution of the calculated magnitudes,which is obviously the result of the unevenly spaced sta-tion network. The smallest events with magnitudesML ≤ 1.5(green and blue symbols) could only be located in the north-eastern area where the network has its highest density. In con-trast, events withML > 1.5 are located more evenly over thewhole region. This implies that the apparently reduced seis-mic activity southwest of the Rwenzoris is probably due tothe lack of stations in this area. The data of a recently de-ployed seismic network west of the mountains will prove ifthere is indeed similar high activity here as in the northeast-ern region. The largest event (ML = 5.1) that was recordedduring the observation period is marked in Fig. 11 with a yel-low star.
The heterogeneous spacing of the station network impliesalso that the completeness of the recorded data set stronglydepends on the respective region. Figure 11 presents the cu-mulative magnitude-frequency relations calculated for twodifferent locations. Area 1 is situated in a region north ofthe Rwenzoris with high station density and the magnitude-frequency relation (circles) suggests a magnitude of com-pleteness ofMC = 0.8. The second area lies southeast of themountains within the Edward rift. Here, the inter-station dis-tances are relatively large andMC is approximately 1.5 (tri-angles). Theb-value for both magnitude distributions is 1.1which is slightly larger than the values published by Kebedeand Kulhanek (1994) for the western branch of the EastAfrican Rift (0.9–1.0). According to Mogi (1967),b-valuesbetween 0.5 and 1.0 are indicative of tectonic processes innon-volcanic intraplate areas. Relatively largeb-values (1.0–2.5) are usually observed in regions with active volcanismwhere seismicity is associated with eruptions and magma
www.solid-earth.net/3/251/2012/ Solid Earth, 3, 251–264, 2012
260 M. Lindenfeld et al.: Seismicity at the Rwenzori Mountains
movements (e.g. Karpin and Thurber, 1987). However, thederived value ofb ≈ 1.1 is not significantly larger than theone for tectonic earthquakes. Hence, it does not allow to dis-criminate between magmatic and tectonic processes.
3.4 Source mechanisms
Fault plane solutions were derived from P-wave polaritiesand SV/P amplitude ratios. To achieve good data coveragewe processed only events that were recorded by at least 12stations. In total we analysed 304 events located in the Rwen-zori area. P wave polarities were manually picked on the rawseismograms. Then we used a grid search algorithm to deter-mine the orientation of the nodal planes (FOCMEC by Snokeet al., 1984). In general we were able to derive solutions with-out admitting P polarity errors. However, in many cases thenodal planes covered large angle ranges and it was impossi-ble to derive a unique solution for the respective event. WithP-polarities alone, we were able to determine reliable sourcemechanisms for only 40 % of the selected earthquakes. Tofurther constrain the nodal planes, we integrated also SV/Pamplitude ratios into the grid search. In order to minimisethe effects of different sensor bandwidths and local receiverconditions on the recorded amplitudes, we pre-processed thesignals with a Butterworth band pass in the 0.1–5.0 km fre-quency range. Amplitudes were then picked on the verti-cal seismogram component. The combination of P-polaritieswith SV/P ratios enabled us to derive more reliable faultplane solutions than with P-polarities alone.
Figure 13 presents two applications of the procedure. Inmany cases it is not possible to derive unique solutions fromP-polarities alone. The results of the grid search are ambigu-ous (Fig. 13a). In this example the nodal planes are consistentwith two different normal-faulting mechanisms of nearly-perpendicular strike directions, such that it is not possible toidentify a single mechanism for this event. Performing a gridsearch with P-polarities together with SV/P amplitude-ratiosrestricts the possible source mechanism to normal faultingwith NNE–SSW strike direction (Fig. 13b). The mechanismof the second event (Fig. 13c) is also not well constrainedby P-polarities. The pattern of the nodal planes indicatesnormal faulting, and the red line represents an average ori-entation, however the variation is too large to specify re-liable source parameters. The inclusion of amplitude ratios(Fig. 13d) yields the same fault-plane solution, but with im-proved significance. With this method we substantially in-creased the number of reliable solutions to almost 70 % of theanalysed events, compared to 40 % using only P-polarities.Furthermore, in many cases we were able to improve thequality and significance of the P-polarity solutions.
A classification of the derived fault plane solutions on thebasis of P- and T-axis plunge angles is presented in Fig. 14.Data points that are close to the three vertices of the graphrepresent pure normal faulting (red symbols), strike-slip(blue symbols), and reverse faulting (green symbols). Addi-
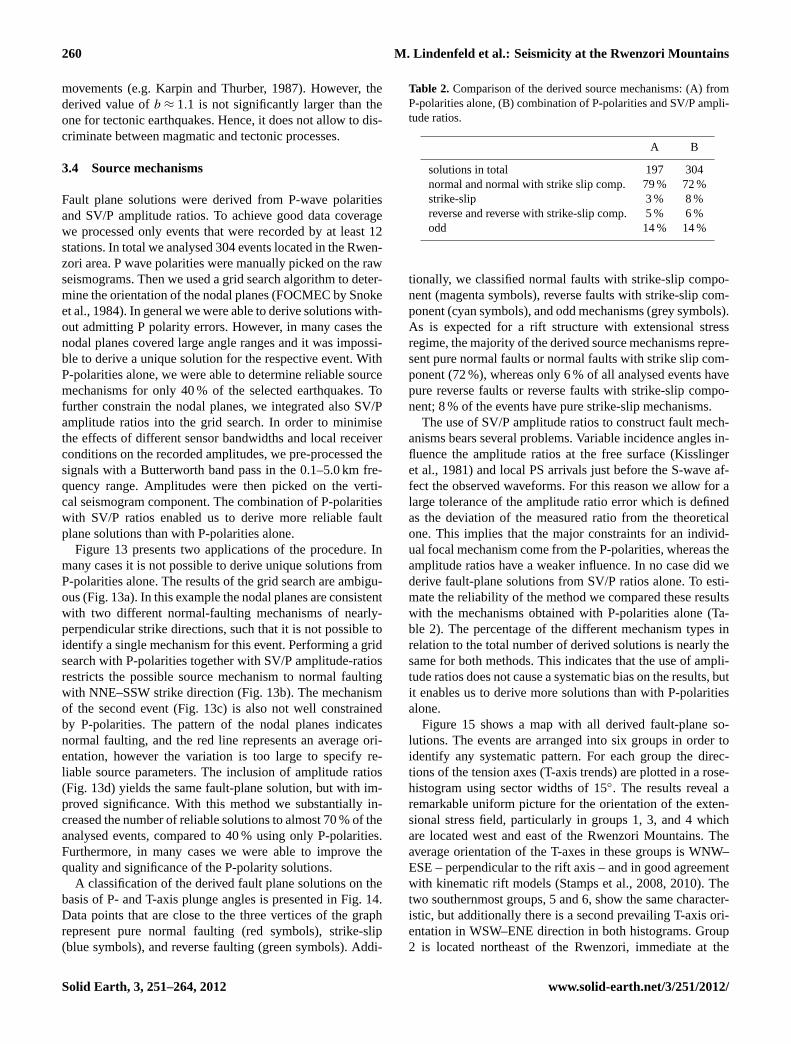
Table 2. Comparison of the derived source mechanisms: (A) fromP-polarities alone, (B) combination of P-polarities and SV/P ampli-tude ratios.
A B
solutions in total 197 304normal and normal with strike slip comp. 79 % 72 %strike-slip 3 % 8 %reverse and reverse with strike-slip comp. 5 % 6 %odd 14 % 14 %
tionally, we classified normal faults with strike-slip compo-nent (magenta symbols), reverse faults with strike-slip com-ponent (cyan symbols), and odd mechanisms (grey symbols).As is expected for a rift structure with extensional stressregime, the majority of the derived source mechanisms repre-sent pure normal faults or normal faults with strike slip com-ponent (72 %), whereas only 6 % of all analysed events havepure reverse faults or reverse faults with strike-slip compo-nent; 8 % of the events have pure strike-slip mechanisms.
The use of SV/P amplitude ratios to construct fault mech-anisms bears several problems. Variable incidence angles in-fluence the amplitude ratios at the free surface (Kisslingeret al., 1981) and local PS arrivals just before the S-wave af-fect the observed waveforms. For this reason we allow for alarge tolerance of the amplitude ratio error which is definedas the deviation of the measured ratio from the theoreticalone. This implies that the major constraints for an individ-ual focal mechanism come from the P-polarities, whereas theamplitude ratios have a weaker influence. In no case did wederive fault-plane solutions from SV/P ratios alone. To esti-mate the reliability of the method we compared these resultswith the mechanisms obtained with P-polarities alone (Ta-ble 2). The percentage of the different mechanism types inrelation to the total number of derived solutions is nearly thesame for both methods. This indicates that the use of ampli-tude ratios does not cause a systematic bias on the results, butit enables us to derive more solutions than with P-polaritiesalone.
Figure 15 shows a map with all derived fault-plane so-lutions. The events are arranged into six groups in order toidentify any systematic pattern. For each group the direc-tions of the tension axes (T-axis trends) are plotted in a rose-histogram using sector widths of 15◦. The results reveal aremarkable uniform picture for the orientation of the exten-sional stress field, particularly in groups 1, 3, and 4 whichare located west and east of the Rwenzori Mountains. Theaverage orientation of the T-axes in these groups is WNW–ESE – perpendicular to the rift axis – and in good agreementwith kinematic rift models (Stamps et al., 2008, 2010). Thetwo southernmost groups, 5 and 6, show the same character-istic, but additionally there is a second prevailing T-axis ori-entation in WSW–ENE direction in both histograms. Group2 is located northeast of the Rwenzori, immediate at the
Solid Earth, 3, 251–264, 2012 www.solid-earth.net/3/251/2012/

M. Lindenfeld et al.: Seismicity at the Rwenzori Mountains 261
Fig. 13. Determination of fault plane solutions of two different events (upper and lower row).(a) Event I: Result of a grid search usingonly P-polarities. Open and closed symbols represent dilations and compressions, respectively. It is not possible to discern a unique sourcemechanism.(b) Event I: Grid search with the combination of P-polarities and SV/P ratios leads to a distinct solution. The red nodal linerepresents the mechanism that was finally assigned to this event. Pressure and Tension axis are marked with P and T respectively.(c) EventII: The result from P-polarities alone indicates normal faulting, however, the scatter of possible solutions is large.(d) Event II: Inclusion ofamplitude ratios yields the same mechanism, but with improved significance.
eastern rift boundary fault, and reveals a completely differentbehaviour. T-axis trends are predominantly oriented NEN–SWS, which is more or less vertical to the T-axis orienta-tion of all other groups. This might be an indication that thestress field in this area is controlled by local disturbances.Figure 15 presents also the CMT solution for theML = 5.1event from 29 May 2006. At that time only 7 stations ofthe network were running – not enough to calculate a sta-ble fault plane solution from local recordings. The CMT waspicked from the Global Centroid Moment Tensor database(www.globalcmt.org) and indicates normal faulting that fitswell with the pattern of the locally analysed source mecha-nisms.
4 Conclusions
From February 2006 until September 2007 we have mon-itored the local seismicity in the Rwenzori Region with anetwork of 29 seismic stations. During this period a total of13 964 events were located with local magnitudes rangingfrom –0.5 up to 5.1. Magnitude-frequency relations show ab-value of 1.1 which is slightly above the values reportedby other authors for the western rift. The magnitude of com-pleteness,MC , was derived for several subregions and ex-hibits a significant dependence on station density.MC = 1.5in the southern parts of the area andMC = 0.8 in the northernparts where the average inter-station distance is considerablysmaller.
www.solid-earth.net/3/251/2012/ Solid Earth, 3, 251–264, 2012

262 M. Lindenfeld et al.: Seismicity at the Rwenzori Mountains
Fig. 14.Classification and frequency of all derived fault plane solu-tions (304 events) on the basis of P- and T-axis plunge angles. Red:pure normal faults (49 %). Magenta: normal faults with strike slipcomponent (23 %). Blue: pure strike-slip mechanisms (8 %). Green:pure reverse faults (2 %). Cyan: reverse faults with strike-slip com-ponent (4 %). Grey: odd mechanisms (14 %).
The general focal-depth distribution shows that there isconsiderable seismic energy release down to 32 km depthwith a pronounced peak of activity at 15 km. Typically, thereis no seismicity within the uppermost 10 km beneath the riftvalley, whereas beneath the rift shoulders seismicity extendsclose to the surface. Vertical sections indicate that the max-imum focal depths vary significantly within the Rwenzoriarea. However, they correlate fairly well with Moho depthsthat were derived by teleseismic receiver functions and rangebetween 21 km and 34 km. This confirms that the observedseismicity is restricted to the crustal part of the lithosphere,with the exception of seven events at a depth between 53and 60 km as reported by Lindenfeld and Rumpker (2011).There is no indication for a crustal root beneath the Rwen-zori Mountains, neither from receiver functions nor from fo-cal depth distribution. This observation may be meaningful inview of the origin of the Rwenzoris. Usually, the buoyancyof thick crustal roots is thought to provide support for moun-tain topography. A missing root may be related to a relativelyrapid uplift of the Rwenzoris.
Fault plane solutions were derived for 304 events usingP-polarities and SV/P-amplitude ratios. The majority of thesource mechanisms are normal faults, only 2 % of the anal-ysed events are pure thrust faults. The T-axis trends give auniform picture for the pattern of the extensional stress field.They are aligned in WNW–ESE direction, more or less ver-tical to the rift axis which is in good agreement with the ex-pected rift process and also with kinematic rift models. Seis-
Fig. 15. Map of all fault-plane solutions. The events are arrangedinto six groups. The rose-histograms show the orientation of the T-axes in each group. The blue symbol represents the source mecha-nism of theML = 5.1 event from 29 May 2006, as published by theGlobal Centroid Moment Tensor database (www.globalcmt.org),formerly the Harvard CMT catalogue (the symbol size of this eventis not scaled by its magnitude).
micity southeast of the Rwenzoris is less resolved due to theinhomogeneous station distribution. Essential information onmicroseismic activity will be provided in the future by a re-cently deployed seismic network which covers also the areawest and southwest of the Rwenzori Mountains.
Acknowledgements.Funding for this study was provided by theDeutsche Forschungsgemeinschaft (DFG) in the framework ofthe RiftLink research group (www.riftlink.org). We thank theGeophysical Instrumentation Pool Potsdam (GIPP) for providingthe seismological equipment and GEOFON for archiving the data.The support of the Ugandan National Council for Science andTechnology and of the Ugandan Wildlife Authority is greatlyappreciated. Data processing and visualization was done withSEISAN and GMT software.
Edited by: T. Iwasaki
Solid Earth, 3, 251–264, 2012 www.solid-earth.net/3/251/2012/

M. Lindenfeld et al.: Seismicity at the Rwenzori Mountains 263
References
Albaric, J., Deverchere, J., Petit, C., Perrot, J., and Le Gall, B.:Crustal rheology and depth distribution of earthquakes: Insightsfrom the central and southern East African Rift System, Tectono-physics 468, 28–41, 2009.
Alsaker, A., Kvamme, L. B., Hansen, R. A., and Dahle, A.: TheML
scale in Norway, Bull. Seismol. Soc. Am. 81, 379–398, 1991.Bendick, R., McClusky, S., Bilham, R., Asfaw, L., and Klemperer,
S.: Distributed Nubia-Somalia relative motion and dike intrusionin the main Ethiopian rift, Geophys. J. Int. 165, 303–310, 2006.
Brazier, R., Nyblade, A. A., and Florentin, J.: Focal mechanismsand the stress regime in NE and SW Tanzania, East Africa. Geo-phys, Res. Lett. 32, L14315,doi:10.1029/2005GL023156, 2005.
Bram, K.: Zum Aufbau der Kruste und des oberen Mantels im Bere-ich des westlichen Grabens des ostafrikanischen Grabensystemsund im ostlichen Zaire-Becken. Ergebnisse einer Untersuchungder Raumwellen von Nah-Erdbeben, Ph.D. thesis, Freie Univer-sitat Berlin, published by Dietrich Reimer Verlag Berlin, 1975.
Camelbeeck, T. and Iranga, M. D.: Deep crustal earthquakes andactive faults along the Rukwa trough, eastern Africa, J. Geophys.Res. 124, 612–630, 1996.
Chen, W.-P. and Molnar, P.: Focal depths of intracontinental andintraplate earthquakes and their implications for the thermal andmechanical properties of the lithosphere, J. Geophys. Res. 88,4183–4214, 1983.
Chorowicz, J.: The East African Rift System, J. Afr. Earth Sci. 43,379–410, 2005.
Deverchere, J., Petit, C., Gileva, N., Radziminovitch, N., Mel-nikova, V., and San’kov, V.: Depth distribution of earthquakesin the Baikal rift system and its implications for the rheology ofthe lithosphere, Geophys. J. Int. 146, 714–730, 2001.
Ebinger, C. J.: Tectonic development and the western branch of theEast African rift system, Geol. Soc. of Am. Bull. 101, 885–903,1989.
Emmerson, B., Jackson, J., McKenzie, D., and Priestley, K.: Seis-micity, structure and rheology of the lithosphere in the LakeBaikal region, Geophys. J. Int. 167, 1233–1272, 2006.
Foster, A. and Jackson, J. A.: Source parameters of large Africanearthquakes: implications for crustal rheology and regional kine-matics, Geophys. J. Int. 134, 422–448, 1998.
Havskov, J. and Ottemoller, L.: Electronic Seismologist. SeisAnEarthquake Analysis Software, Seismol. Res. Lett. 70, 532–534,1999.
Hutton, L. K. and Boore, D. M.: TheML scale in southern Califor-nia, Bull. Seismol. Soc. Am. 77, 2074–2094, 1987.
Ibs-von Seht, M., Blumenstein, S., Wagner, R., Hollnack, D., andWohlenberg, J.: Seismicity, seismotectonics and crustal structureof the southern Kenya Rift – new data from the Lake Magadiarea, Geophys. J. Int. 146, 439–453, 2001.
Jackson, J., McKenzie, D., Priestley, K., and Emmerson, B.: Newviews on the structure and rheology of the lithosphere, J. Geol.Soc. 165, 453–465, 2008.
Jakovlev, A.: The crustal and upper mantle isotropic and anisotropicvelocity structure beneath the Rwenzori Mountains from travel-time tomography, Ph.D. thesis, Goethe Universitat Frankfurt amMain, 2010.
Jakovlev, A., Rumpker, G., Lindenfeld, M., Koulakov, I., Schu-mann, A., and Ochmann, N.: Crustal Seismic Velocities of theRwenzori Region, East African Rift, from Local Travel-Time
Tomography: Evidence for Low-Velocity Anomalies beneath theMountain Range, Bull. Seismol. Soc. Am. 101, 848–858, 2011.
Karpin, T. L. and Thurber, C. H.: The relationship between earth-quake swarms and magma transport: Kilauea Volcano, Hawaii,Pure Appl. Geophys. 125, 971–991, 1987.
Kato, A., Kurashimo, E., Igarashi, T., Sakai, Sh., Iidaka, T., Shi-nohara, M., Kanazawa, T., Yamada, T., Hirata, N., and Iwasaki,T.: Reactivation of ancient rift systems triggers devastating in-traplate earthquakes, Geophys. Res. Lett. 36, L05301, 1–5,doi:10.1029/2008GL036450, 2009.
Kebede, F. and Kulhanek, O.: Spatial and temporal variations of b-values along the East African rift system and the southern RedSea, Phys. Earth Planet. Inter. 83, 249–264, 1994.
Kisslinger, C., Bowman, J. R., and Koch, K.: Procedures for com-puting focal mechanisms from local (SV/P) ratios, Bull. Seismol.Soc. Am. 71, 1718–1729, 1981.
Koehn, D., Aanyu, K., Haines, S., and Sachau, T.: Rift nucleation,rift propagation and the creation of basement micro-plates withinactive rifts, Tectonophsics 458, 105–116, 2008.
Koehn, D., Lindenfeld, M., Rumpker, G., Aanyu, K., Haines, S.,Passchier, C. W., and Sachau, T.: Active transsection faults in rifttransfer zones: evidence for complex stress fields and implica-tions for crustal fragmentation processes in the western branchof the East African Rift, Int. J. Earth Sci. (Geol Rundschau) 99,1633–1642, 2010.
Langston, C. A., Brazier, R., Nyblade, A. A., and Owens, T. J.:Local Magnitude Scale and Seismicity Rate for Tanzania, EastAfrica, Bull. Seismol. Soc. Am. 88, 712–721, 1998.
Lienert, B. R. E. and Havskov, J.: A computer program for locatingearthquakes both locally and globally, Seismol. Res. Lett. 66, 26–36, 1995.
Lindenfeld, M. and Rumpker, G.: Detection of mantle earth-quakes beneath the East African Rift, Geophys. J. Int. 186, 1–5,doi:10.1111/j.1365-246X.2011.05048.x, 2011.
Maasha, N.: The seismicity of the Rwenzori region in Uganda, J.Geophys. Res. 80, 1485–1496, 1975.
Maggi, A., Jackson, J. A., McKenzie, D., and Priestley, K.: Earth-quake focal depths, effective elastic thickness, and the strengthof the continental lithosphere, Geology 28, 495–498, 2000.
Midzi, V., Hlatywayo, D., Chapola, L. S., Kebede, F., Atakens, K.,Lombe, D. K., Turyomugyendo, G., and Tugume, F. A.: Seismicharzard assessment in Eastern and Southern Africa, Ann. di Ge-ofisica 42, 1067–1083, 1999.
Mogi, K.: Earthquakes and fractures, Tectonophysics 5, 35–55,1967.
Nyblade, A. A. and Brazier, R. A.: Precambrian lithosphere controlson the development of the East African rift system, Geology 30,755–758, 2002.
Nyblade, A. A. and Langston, C. A.: East African earthquakes be-low 20 km depth and their implications for crustal structure, Geo-phys. J. Int. 121, 49–62, 1995.
Ring, U.: Extreme uplift of the Rwenzori Mountains inthe East African Rift, Uganda: Structural frameworkand possible role of glaciations, Tectonics, 27, TC4018,doi:10.1029/2007TC002176, 2008.
Shudofsky, G., Cloetingh, S., Stein, S., and Wortel, R.: Unusu-ally deep earthquakes in East Africa: constraints on the thermo-mechanical structure of a continental rift system, Geophys. Res.Lett. 14, 741–744, 1987.
www.solid-earth.net/3/251/2012/ Solid Earth, 3, 251–264, 2012

264 M. Lindenfeld et al.: Seismicity at the Rwenzori Mountains
Snoke, J. A., Munsey, J. W., Teague, A. C., and Bollinger, G. A.: Aprogram for focal mechanism determination by combined use ofpolarity and SV-P amplitude ratio data, Earthquake Notes 55, 51,1984.
Stamps, D. S., Calais, E., Saria, E., Hartnady, Ch., Nocquet, J.M., Ebinger, C. J., and Fernandes, R. M.: A kinematic modelfor the East African Rift, Geophys. Res. Lett. 35, L05304,doi:10.1029/2007GL032781, 2008.
Stamps, D. S., Flesch, L. M., and Calais, E.: Lithospheric buoy-ancy forces in Africa from a thin sheet approach, Int. J. EarthSci. (Geol Rundschau) 99, 1525–1533,doi:10.1007/s00531-010-0533-2, 2010.
Tugume, F. A. and Nyblade, A. A.: The depth distribution of seis-micity at the northern end of the Rwenzori mountains: implica-tions for heat flow in the western branch of the East African RiftSystem in Uganda, South Afr. J. Geol. 112, 261–271, 2009.
Twesigomwe, E. M.: Seismic hazards in Uganda, J. Afr. Earth Sci.24, 183–195, 1997.
Wolbern, I., Rumpker, G., Schumann, A., and Muwanga, A.:Crustal thinning beneath the Rwenzori region, Albertine rift,Uganda, from receiver-function analysis, Int. J. Earth Sci. (GeolRundschau) 99, 1545–1557, 2010.
Young, P. A. V., Maguire, P. K. H., d’A. Laffoley, N., and Evans,J. R.: Implications of the distmribution of seismicity near LakeBogoria in the Kenya Rift, Geophys. J. Int. 105, 665–674, 1991.
Solid Earth, 3, 251–264, 2012 www.solid-earth.net/3/251/2012/