seisworks/3d tutorial - ntnu basemap to see the progress of your interpretation. ... seisworks/3d...
TRANSCRIPT

SeisWorks/3D Tutorial© 2001-2004 Landmark Graphics Corporation
R2003.12.1 September 2004
Landmark SeisWorks/3D Introduction
R2003.12.1 Contents 3
Contents
SeisWorks/3D Tutorial
Introduction . . . . . . . . . . . . . . . . . . . . . . . . . . . . . . . . . . . . . . . . . . . . . . . . . 7
Overview . . . . . . . . . . . . . . . . . . . . . . . . . . . . . . . . . . . . . . . . . . . . . . . . . . . . . . . 7
Who Should Use this Manual . . . . . . . . . . . . . . . . . . . . . . . . . . . . . . . . . . . . 8
Before You Begin. . . . . . . . . . . . . . . . . . . . . . . . . . . . . . . . . . . . . . . . . . . . . . 8
Space Required for SeisWorks/3D Tutorial Data . . . . . . . . . . . . . . . . . . . . 8
Continue to the Next Chapter . . . . . . . . . . . . . . . . . . . . . . . . . . . . . . . . . . . . 9
Tutorial Preparation . . . . . . . . . . . . . . . . . . . . . . . . . . . . . . . . . . . . . . . 11
Restore the OpenWorks Tutorial Project . . . . . . . . . . . . . . . . . . . . . . . . . . . . 12
Grant Project Access . . . . . . . . . . . . . . . . . . . . . . . . . . . . . . . . . . . . . . . . . . . . 18
Set the OpenWorks Project & Interpreter . . . . . . . . . . . . . . . . . . . . . . . . . . . . 21
Create the 3D Survey . . . . . . . . . . . . . . . . . . . . . . . . . . . . . . . . . . . . . . . . . . . . 24
Define the Grid and Navigation Coordinates . . . . . . . . . . . . . . . . . . . . . . . . . 26
Specify the Grid Coordinates . . . . . . . . . . . . . . . . . . . . . . . . . . . . . . . . . . . 26
Specify the Navigation Coordinates . . . . . . . . . . . . . . . . . . . . . . . . . . . . . 28
Create the Tutorial Seismic Project. . . . . . . . . . . . . . . . . . . . . . . . . . . . . . . . . 30
Copy Seismic Data into a Project Directory . . . . . . . . . . . . . . . . . . . . . . . . . . 33
Continue to the Next Chapter . . . . . . . . . . . . . . . . . . . . . . . . . . . . . . . . . . . 34
Starting the Tutorial Session. . . . . . . . . . . . . . . . . . . . . . . . . . . . . 35
Start OpenWorks. . . . . . . . . . . . . . . . . . . . . . . . . . . . . . . . . . . . . . . . . . . . . . . . 36
Start SeisWorks/3D . . . . . . . . . . . . . . . . . . . . . . . . . . . . . . . . . . . . . . . . . . . . . . 37
Select a Seismic Project. . . . . . . . . . . . . . . . . . . . . . . . . . . . . . . . . . . . . . . . . . 39

Landmark SeisWorks/3D Tutorial
R2003.12.1 Contents 4
Start and Name the Session. . . . . . . . . . . . . . . . . . . . . . . . . . . . . . . . . . . . . . . 40
Continue to the Next Chapter . . . . . . . . . . . . . . . . . . . . . . . . . . . . . . . . . . . 41
Displaying a Basemap. . . . . . . . . . . . . . . . . . . . . . . . . . . . . . . . . . . . 43
Open a Map View Window . . . . . . . . . . . . . . . . . . . . . . . . . . . . . . . . . . . . . . . . 44
Set Map View Contents. . . . . . . . . . . . . . . . . . . . . . . . . . . . . . . . . . . . . . . . . . . 46
Use Show Position in Map View . . . . . . . . . . . . . . . . . . . . . . . . . . . . . . . . . . . 48
Continue to the Next Chapter . . . . . . . . . . . . . . . . . . . . . . . . . . . . . . . . . . . 49
Generating a Seismic View . . . . . . . . . . . . . . . . . . . . . . . . . . . . . . 51
Opening a Seismic View Window . . . . . . . . . . . . . . . . . . . . . . . . . . . . . . . . . . 52
Choose a Seismic Data File . . . . . . . . . . . . . . . . . . . . . . . . . . . . . . . . . . . . . . . 54
Display Seismic Section Using the Midpoint Option. . . . . . . . . . . . . . . . . . . 56
Use Show Position in Seismic View . . . . . . . . . . . . . . . . . . . . . . . . . . . . . . . . 62
Alter the Seismic Display . . . . . . . . . . . . . . . . . . . . . . . . . . . . . . . . . . . . . . . . . 63
Change Seismic Display Scales. . . . . . . . . . . . . . . . . . . . . . . . . . . . . . . . . 63
Use Color Control . . . . . . . . . . . . . . . . . . . . . . . . . . . . . . . . . . . . . . . . . . . . . . . 66
Use Frame Control . . . . . . . . . . . . . . . . . . . . . . . . . . . . . . . . . . . . . . . . . . . . . . 71
Zoom the Display . . . . . . . . . . . . . . . . . . . . . . . . . . . . . . . . . . . . . . . . . . . . . . . 74
Magnify the Display . . . . . . . . . . . . . . . . . . . . . . . . . . . . . . . . . . . . . . . . . . . . . 77
Continue to the Next Chapter . . . . . . . . . . . . . . . . . . . . . . . . . . . . . . . . . . . 78
Interpreting Horizons and Faults . . . . . . . . . . . . . . . . . . . . . . . . 79
Interpret Horizons . . . . . . . . . . . . . . . . . . . . . . . . . . . . . . . . . . . . . . . . . . . . . . . 80
Create a Horizon . . . . . . . . . . . . . . . . . . . . . . . . . . . . . . . . . . . . . . . . . . . . . 81
Turn on Horizon in Map View . . . . . . . . . . . . . . . . . . . . . . . . . . . . . . . . . . . 83
Pick the Horizon. . . . . . . . . . . . . . . . . . . . . . . . . . . . . . . . . . . . . . . . . . . . . . 84
Deleting a Horizon . . . . . . . . . . . . . . . . . . . . . . . . . . . . . . . . . . . . . . . . . . . . 87
Landmark SeisWorks/3D Tutorial
R2003.12.1 Contents 5
Using Auto Tracking . . . . . . . . . . . . . . . . . . . . . . . . . . . . . . . . . . . . . . . . . . 88
Interpret Faults . . . . . . . . . . . . . . . . . . . . . . . . . . . . . . . . . . . . . . . . . . . . . . . . . 90
Open a Perspective View Window . . . . . . . . . . . . . . . . . . . . . . . . . . . . . . . 90
Pick Fault Segments . . . . . . . . . . . . . . . . . . . . . . . . . . . . . . . . . . . . . . . . . . 91
Interpret a New Horizon . . . . . . . . . . . . . . . . . . . . . . . . . . . . . . . . . . . . . . . . . . 98
Calculate Fault Heaves in Map View . . . . . . . . . . . . . . . . . . . . . . . . . . . . . . . . 99
Interpret New Seismic Sections. . . . . . . . . . . . . . . . . . . . . . . . . . . . . . . . . . . 102
Open a New Seismic View Window . . . . . . . . . . . . . . . . . . . . . . . . . . . . . 102
Interpret Additional Sections . . . . . . . . . . . . . . . . . . . . . . . . . . . . . . . . . . 105
Use Bookmarks . . . . . . . . . . . . . . . . . . . . . . . . . . . . . . . . . . . . . . . . . . . . . . . . 110
Continue to the Next Chapter . . . . . . . . . . . . . . . . . . . . . . . . . . . . . . . . . . 117
Performing Contouring . . . . . . . . . . . . . . . . . . . . . . . . . . . . . . . . . . 119
Create Computed Contours . . . . . . . . . . . . . . . . . . . . . . . . . . . . . . . . . . . . . . 120
Create the Mapping File . . . . . . . . . . . . . . . . . . . . . . . . . . . . . . . . . . . . . . 122
Define Input Horizon and Sampling Parameters . . . . . . . . . . . . . . . . . . 123
Choose Surface Model Type and Set Grid Parameters . . . . . . . . . . . . . 125
Specify the Fault Mode and Contour Parameters. . . . . . . . . . . . . . . . . . 127
Compute and Display Contours . . . . . . . . . . . . . . . . . . . . . . . . . . . . . . . . . . 129
Change the Contour Interval . . . . . . . . . . . . . . . . . . . . . . . . . . . . . . . . . . . . . 131
Zoom the Display. . . . . . . . . . . . . . . . . . . . . . . . . . . . . . . . . . . . . . . . . . . . 131
Edit the Fault Polygons . . . . . . . . . . . . . . . . . . . . . . . . . . . . . . . . . . . . . . . . . 132
Regrid the Data . . . . . . . . . . . . . . . . . . . . . . . . . . . . . . . . . . . . . . . . . . . . . . . . 134
Convert Computed Contours to Manual & Annotate Manual Contours . . 136
Continue to the Next Chapter . . . . . . . . . . . . . . . . . . . . . . . . . . . . . . . . . . 138
Making a Scaled Hardcopy Plot File. . . . . . . . . . . . . . . . . . . 139
Creating a .CGM Output File . . . . . . . . . . . . . . . . . . . . . . . . . . . . . . . . . . . . . 140

Landmark SeisWorks/3D Tutorial
R2003.12.1 Starting the Tutorial Session 35
Starting the Tutorial Session
Introduction
In this chapter, you will learn to do the following things:
• Start OpenWorks (page 36).
• Start SeisWorks/3D from the OpenWorks Applications menu (page 37).
• Select a seismic project (page 39).
• Start and name the session (page 40).
• Save your new session file (page 40).
Landmark SeisWorks/3D Tutorial
R2003.12.1 Starting the Tutorial Session: Start OpenWorks 36
Start OpenWorks
To start SeisWorks/3D, you must have OpenWorks running with the command menu visible. If OpenWorks is not running, you can start it by typing the following command in an xterm window:
startow
Once you start OpenWorks, a trademark window appears in the middle of your screen. To remove this window, move the cursor inside the window, and press Button 1 or Button 3.
For this tutorial, you do not want to have any other applications running. Your screen should contain the OpenWorks Command Menu, as shown in the illustration below.

Landmark SeisWorks/3D Tutorial
R2003.12.1 Starting the Tutorial Session: Start SeisWorks/3D 37
Start SeisWorks/3D
To start SeisWorks/3D:
1. Select Applications ➛ SeisWorks ➛ 3D from the OpenWorks Command Menu.
A message appears, informing you that the application is being loaded.
2. Another box appears, asking you to move your cursor to the desired screen and press Mouse Button 1 to select it.
You can start SeisWorks on a screen other than 0. In addition, the application supports the use of up to four screens.
SeisWorks requires that Screen:0 be set to 24-bit TrueColor. This is because SeisWorks runs only in 24-bit TrueColor and no longer supports 8-bit.
For instance, if you are using four monitors and want to run SeisWorks at the same time as you run a third-party 8-bit application, you cannot place the 8-bit application on Screen:0. If you do, SeisWorks will not display in 24-bit on that screen or any subsequent screens. Likewise, if you start SeisWorks on Screen 0, and the 8-bit application on Screen 1, SeisWorks will not run on Screen 2 and 3. To display SeisWorks on Screens:0, 1, and 2, the 8-bit application must be started on the last screen.
If you are working on a system that has one virtual screen, you will not see the message box.
3. When you make your choice, the SeisWorks/3D main menu appears. Only three options on the menu are available until you start a session. If no project has been set, the Project Selection dialog box also opens, as shown in the example below.
Landmark SeisWorks/3D Tutorial
R2003.12.1 Starting the Tutorial Session: Start SeisWorks/3D 38
SeisWorks

Landmark SeisWorks/3D Tutorial
R2003.12.1 Starting the Tutorial Session: Select a Seismic Project 39
Select a Seismic Project
To begin working in SeisWorks, you must choose a seismic project from the Project Selection dialog box. For this tutorial, you will be working with the salnor project.
1. Select salnor from the list of available projects.
The name of the project that you selected appears in the Selected Project text field near the bottom of the dialog box, as shown below.
2. Click on OK.
The Project Selection dialog box closes, and the salnor project name now appears as the 3D Seismic Project in the SeisWorks menu.
You are ready to start the session.
Landmark SeisWorks/3D Tutorial
R2003.12.1 Starting the Tutorial Session: Start and Name the Session 40
Start and Name the Session
Now that you have selected a project to work with, you are ready to start a session. Usually, you would start a new session when you begin work on a project.
To start a session:
1. Select Session ➛ New (Time) from the SeisWorks main menu.
The SeisWorks Startup Selection dialog box open.
2. Select your initials in the Interpreter text field of the dialog box.
3. Select No Wells and No Faults in the Well List and Fault Set text fields, respectively, because there are no wells or faults in this dataset.
4. Click on OK.
The SeisWorks Startup Selection dialog box closes.
5. Select Session ➛ Save As in the SeisWorks main menu.

Landmark SeisWorks/3D Tutorial
R2003.12.1 Starting the Tutorial Session: Start and Name the Session 41
The Session Save As dialog box opens with a list of previously saved sessions.
6. Enter <your name> (or initials) in the New Session File text field, and click on OK.
All work in this session will be saved to this file. Note that the name you gave the session appears in the SeisWorks title bar.
Continue to the Next Chapter
Now that you have started and named a session, you are ready to display a basemap. For instructions, proceed to the next chapter on page 43.
Landmark SeisWorks/3D Tutorial
R2003.12.1 Displaying a Basemap 43
Displaying a Basemap
Introduction
In this chapter you will learn to do the following things:
• Open a Map View window (page 44).
• Select the contents of your basemap display (page 46).
• Use Show Position so that you can see the positions of faults and horizons in Map View as you track them with the cursor in Seismic View (page 48).

Landmark SeisWorks/3D Tutorial
R2003.12.1 Displaying a Basemap: Open a Map View Window 44
Open a Map View Window
When you first begin to work on a project, you can use a basemap to select the seismic sections you want to view, or you can use the basemap to see the progress of your interpretation.
As you begin to interpret horizons in the Seismic View window, you can turn horizons on in the Map View to see them as you interpret. The Map View window is dynamically updated while you are interpreting horizons.
After you have interpreted faults and horizons, you can calculate fault heaves and display them in the Map View window. Finally, you can perform mapping operations in the Map View to produce your presentation map.
To display a basemap in SeisWorks:
1. Select Interpret ➛ Map from the SeisWorks/3D main menu.
A message appears asking you to choose on which screen you want the Map View window to appear. In this tutorial, place all map views on Screen:1 screen and all seismic views on Screen:0 screen.
2. Press Button 1 on Screen:1.
Depending on how your system is set up, either the Map View window or an outline of it appears.
If the window outline appears, move it anywhere on the screen. Then press Button 1 when the cursor is on the title bar to place the window. The Map View window opens.
Landmark SeisWorks/3D Tutorial
R2003.12.1 Displaying a Basemap: Open a Map View Window 45
menu bar
line annotation
trace annotation
When the Map View window first appears, no data is displayed. The map grid annotation is shown on all four sides. The white circles represent grid increments and are for viewing purposes.

Landmark SeisWorks/3D Tutorial
R2003.12.1 Displaying a Basemap: Set Map View Contents 46
Set Map View Contents
You can use the Map View Contents dialog box to highlight in Map View the seismic section that you are looking at in Seismic View.
1. Click on the Contents icon, or select View ➛ Contents... to open the Map View Contents dialog box.
Landmark SeisWorks/3D Tutorial
R2003.12.1 Displaying a Basemap: Set Map View Contents 47
The Map View Contents dialog box allows you to control the contents of the Map View window. Until you select them, all content items are turned off except for those shown on the graphic.
Later, after you have interpreted horizons and faults, you will select the horizon and fault options using this dialog box. The data will be displayed in the Map View window.
2. Click on Basemap Parameters... in the upper-right corner.
The Basemap Parameters dialog box opens.
3. Select Symbols if it is not already selected.
4. Enter the following values in the text fields to the right of Increment:
• 10 for Line• 20 for Trace
5. Make sure the Postpone Redraw radio button is toggled off. Then click on Apply to activate the changes.
The symbols are now displayed closer together, giving you more detail about the location of lines and traces in Map View.
6. Click on OK to close the Basemap Parameters dialog box.
7. In the Map View Contents dialog box, select Displayed Seismic Panels if it is not already selected.
When you select the Displayed Seismic Panels option, the Map View window will display lines, or markers, to indicate which seismic panels are currently visible in Seismic Views
8. Click on OK in the Map View Contents dialog box to close the box.

Landmark SeisWorks/3D Tutorial
R2003.12.1 Displaying a Basemap: Use Show Position in Map View 48
Use Show Position in Map View
The Show Position option lets you see the positions of faults and horizons in Map View as you track them with the cursor in Seismic View. You can also see changes in line and trace location by moving the cursor in Map View.
Show Position is turned on by default. If it does not happen to be selected, choose View ➛ Show Position from the Map View window.
Then move the cursor in the Map View window.
As you move the cursor in Map View, its position is displayed at the bottom of the window. When you generate a Seismic View in the next section, the cursor position in Seismic View will show up as a cross-hair on the seismic panel in Map View, as shown in the illustration on this page.
The position of the cursor in the Seismic View window is reflected in the message area of the Seismic View, along with any other Seismic Views you open.
cursor position (when cursor is in Map View)
The cursor changes to a cross-hair in Map View when it is on a seismic section in Seismic View (and Show Position is turned on in that view as well).
Landmark SeisWorks/3D Tutorial
R2003.12.1 Displaying a Basemap: Use Show Position in Map View 49
Continue to the Next Chapter
Now that you have learned the basics about Map Views, the tutorial will teach you about Seismic Views and various ways to work with seismic displays. Proceed to the next chapter on page 51.

Landmark SeisWorks/3D Tutorial
R2003.12.1 Generating a Seismic View 51
Generating a Seismic View
Introduction
In the following chapter you will learn to do the following:
• Open a Seismic View window (page 52).
• Choose a seismic data file (page 54).
• Display a seismic section using the Midpoint option (page 56).
• Use Show Position in the Seismic View to see the position of your faults and horizons in Map View as you move the cursor position in Seismic View (page 62).
• Alter the seismic display by changing the value of scale factors (page 63).
• Experiment with Color Control and colormap options (page 66).
• Use Frame Control to display successive parallel views of seismic data at specified increments (page 71).
• Zoom and magnify a seismic display (page 74).
Landmark SeisWorks/3D Tutorial
R2003.12.1 Generating a Seismic View: Opening a Seismic View Window 52
Opening a Seismic View Window
The Seismic View window is where seismic sections are displayed and where you will do your horizon and fault interpretations. In this tutorial, you will open more than one Seismic View as your interpretation progresses.
You can open a Seismic View window from any active SeisWorks/3D window. For this exercise, you will open the window from the Map View window.
To open a Seismic View window and display a seismic section:
1. Select File ➛ New Task ➛ Seismic in the Map View window.
A message appears asking you to choose on which screen to place the window.
2. Move the cursor to Screen:0, and click Button 1 to open the Seismic View in that screen.

Landmark SeisWorks/3D Tutorial
R2003.12.1 Generating a Seismic View: Opening a Seismic View Window 53
The Seismic View window appears.
The Seismic View window is empty when it first opens in a session. In addition, only the first three menu items (and the Help menu) are available until you display a seismic section.
Landmark SeisWorks/3D Tutorial
R2003.12.1 Generating a Seismic View: Choose a Seismic Data File 54
Choose a Seismic Data File
Your seismic trace data is stored in files on your workstation system. You can have several different files for the same project. For this reason, when you open a new session, you must select the data file you want to view.
To select a seismic data file:
1. Click on the Seismic Parameters icon, or go to the Seismic View menu bar and select Seismic ➛ Parameters....
The Seismic Display Parameters dialog box appears.
Landmark SeisWorks/3D Tutorial
R2003.12.1 Generating a Seismic View: Choose a Seismic Data File 55
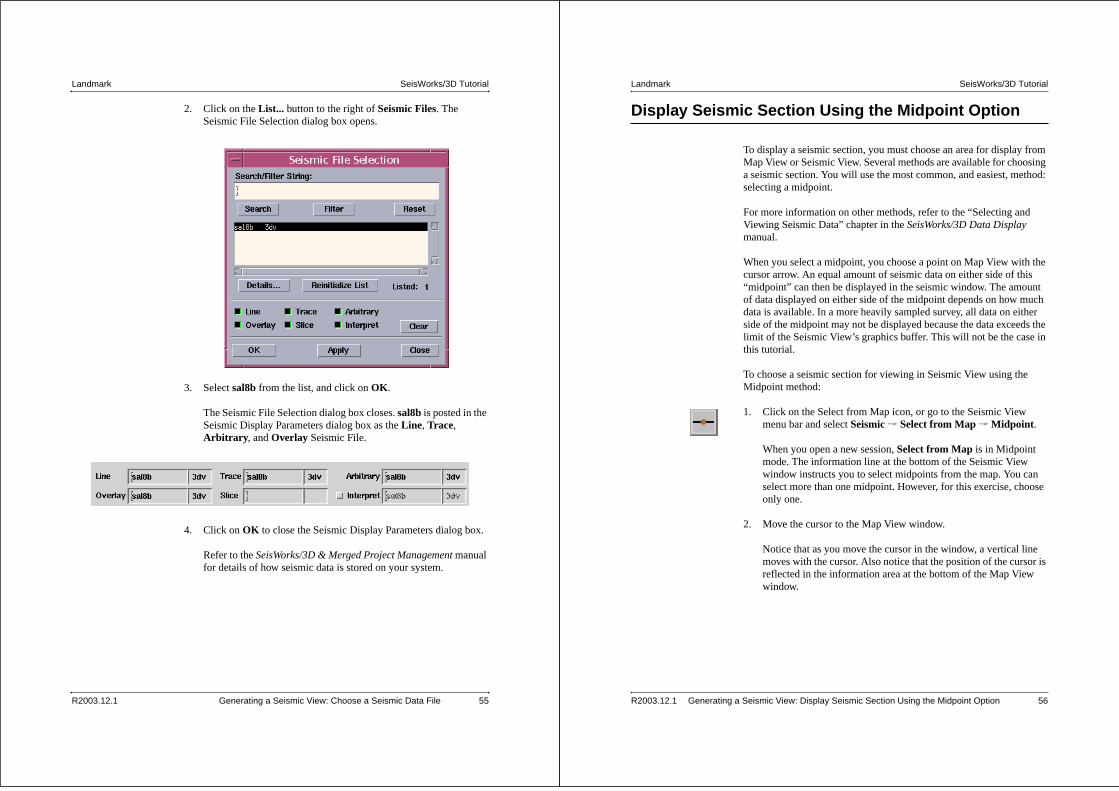
2. Click on the List... button to the right of Seismic Files. The Seismic File Selection dialog box opens.
3. Select sal8b from the list, and click on OK.
The Seismic File Selection dialog box closes. sal8b is posted in the Seismic Display Parameters dialog box as the Line, Trace,Arbitrary, and Overlay Seismic File.
4. Click on OK to close the Seismic Display Parameters dialog box.
Refer to the SeisWorks/3D & Merged Project Management manual for details of how seismic data is stored on your system.
Landmark SeisWorks/3D Tutorial
R2003.12.1 Generating a Seismic View: Display Seismic Section Using the Midpoint Option 56
Display Seismic Section Using the Midpoint Option
To display a seismic section, you must choose an area for display from Map View or Seismic View. Several methods are available for choosing a seismic section. You will use the most common, and easiest, method: selecting a midpoint.
For more information on other methods, refer to the “Selecting and Viewing Seismic Data” chapter in the SeisWorks/3D Data Display manual.
When you select a midpoint, you choose a point on Map View with the cursor arrow. An equal amount of seismic data on either side of this “midpoint” can then be displayed in the seismic window. The amount of data displayed on either side of the midpoint depends on how much data is available. In a more heavily sampled survey, all data on either side of the midpoint may not be displayed because the data exceeds the limit of the Seismic View’s graphics buffer. This will not be the case in this tutorial.
To choose a seismic section for viewing in Seismic View using the Midpoint method:
1. Click on the Select from Map icon, or go to the Seismic View menu bar and select Seismic ➛ Select from Map ➛ Midpoint.
When you open a new session, Select from Map is in Midpoint mode. The information line at the bottom of the Seismic View window instructs you to select midpoints from the map. You can select more than one midpoint. However, for this exercise, choose only one.
2. Move the cursor to the Map View window.
Notice that as you move the cursor in the window, a vertical line moves with the cursor. Also notice that the position of the cursor is reflected in the information area at the bottom of the Map View window.

Landmark SeisWorks/3D Tutorial
R2003.12.1 Generating a Seismic View: Display Seismic Section Using the Midpoint Option 57
3. Press and hold down Button 3 on the mouse to get the MidPoint popup menu, shown below.
Notice that the Lines option radio button is on. This indicates that the Midpoint selection option is in Lines mode, which is the default. For this exercise, you will use the Traces mode.
4. Continue to press down on Button 3 while moving the cursor over the Traces option. Release Button 3.
The Traces option is now selected.
5. Move the cursor up and down in the window.
Notice that a horizontal line appears in the window as you move the cursor, and the message area at the bottom of the Map View window displays the trace number where the cursor is.
Landmark SeisWorks/3D Tutorial
R2003.12.1 Generating a Seismic View: Display Seismic Section Using the Midpoint Option 58
6. Position the cursor over trace 45, and press Button 1. The horizontal line becomes a fixed yellow line indicating that this trace has been chosen for seismic display.
You are able to see this yellow line in the Map View window because Displayed Seismic Panels has been turned on in the Map View Contents dialog box.
Notice the percentage in the message area of the Map View window. This value reflects the percentage of the seismic graphics buffer that has been filled. Since a small percentage of the buffer is filled, all data for the selected trace will be displayed in the Seismic View window.
Yellow line indicates this crossline (trace 45) has been chosen for seismic display
message area

Landmark SeisWorks/3D Tutorial
R2003.12.1 Generating a Seismic View: Display Seismic Section Using the Midpoint Option 59
7. To display the selected seismic panel in the Seismic View window, press and hold down Button 3 in the Map View window to get the MidPoint popup menu.
Move the cursor (still holding down Button 3) to the Begin Display option. Then release Button 3.
Alternately, press <d> in the Map View window.
Since this is the first time during this session that you have displayed a seismic section, the Seismic Time Selection dialog box appears (shown on the next page). Using this dialog box, you can set the time interval you want to work with by setting the Starttime and the Interval. Time is calibrated in milliseconds.
If the Seismic Time Selection dialog box does not appear...
If you have been “experimenting” with SeisWorks and the Seismic Time Selection dialog box has displayed earlier, it will not open now. You need to open it by selecting Seismic ➛ Reselect Time... from the Seismic View menu bar.
Landmark SeisWorks/3D Tutorial
R2003.12.1 Generating a Seismic View: Display Seismic Section Using the Midpoint Option 60
6. Keep the Start time at 700. (The minimum time indicated corresponds to the minimum time loaded for the survey.) Set the Interval at 1300.
All subsequent seismic lines will display using this start time and interval. If you wish to change the time interval, you can select Seismic ➛ Reselect Time... from the Seismic View. This same dialog box will open.
7. Click on OK.
The Seismic Time Selection dialog box closes, and the seismic line is displayed in the Seismic View window shown on the following page.
Since you selected a trace for display, the trace number appears at the top of the Seismic View window. Corresponding lines are shown at the top of the displayed trace. The trace number also
slider
To set a sliding scale
1. Place the cursor over the slider, and press and hold downButton 1.
2. While still holding down Button 1, move the cursor up or down to set the value.

Landmark SeisWorks/3D Tutorial
R2003.12.1 Generating a Seismic View: Display Seismic Section Using the Midpoint Option 61
appears in the annotation at the bottom of the window.
time(milliseconds)
scroll bar
trace selected
line annotation
Once the seismic section is displayed in the window, the three menu items that were dimmed are now available. If necessary, use the scroll bar at the right of the window to display more seismic data.
Landmark SeisWorks/3D Tutorial
R2003.12.1 Generating a Seismic View: Use Show Position in Seismic View 62
Use Show Position in Seismic View
The Seismic View window opens with Show Position turned on by default. When Show Position is on, you can see the position of your faults and horizons in Map View as you move the cursor position in Seismic View.
You can also see the amplitude value at the bottom of the Seismic View window, as well as the position of the cursor by line and trace on both Map View and Seismic View.
If Show Position is not turned on, use the following procedure:
1. Select View ➛ Show Position ➛ Seismic from the Seismic View window.
2. Move the cursor in the Seismic View window.
Notice that the position of the cursor is reflected as a cross-hair on the seismic panel in the Map View window on page 48. Notice also that the position of the cursor in the Seismic View window is reflected in the message area at the bottom of the Seismic View as shown below.
If the Show Position default remains on, you will see coordinates of the cursor position in any other window you open.
message area

Landmark SeisWorks/3D Tutorial
R2003.12.1 Generating a Seismic View: Alter the Seismic Display 63
Alter the Seismic Display
Once you have the seismic section displayed, many options for altering the display are made available. A few of these options are detailed below.
Change Seismic Display Scales
When a seismic section is first displayed in the Seismic View window, no interpolation of the data has taken place. You can change the value of three scale factors —line, trace, and time scale—to interpolate the data, making it easier for you to perform your interpretation.
To change the display scales of the current seismic section:
1. Click on the Seismic Parameters icon from the Seismic View tool bar, or select Seismic ➛ Parameters... from the Seismic View menu.
The Seismic Display Parameters dialog box opens. This dialog box contains several parameter fields. For now, you will adjust only the interpolation factors in the Seismic Display Scales section on the left side of the panel shown below.
2. Change the value for the Line interpolation factor to 1, and change the Trace interpolation factor to 3. To do this:
• Place the cursor on the slider bar. Press and hold down Button 1.
• Slide the mouse a brief increment to the right. The value above the slider bar reflects the movement. Move the slider bar until the number reflects what you want.
Landmark SeisWorks/3D Tutorial
R2003.12.1 Generating a Seismic View: Alter the Seismic Display 64
You can also click on the arrows to the right and left of the slider bars to change the values. If the values are small, it may be quicker to use this method.
Leave the Time interpolation factor at 0.
3. Click on OK when you have changed the interpolation factors.
The seismic section is redrawn with the new interpolation factors and should look something like the one on the following page. One trace has been inserted between every real trace in the line direction, and three traces have been inserted between every real trace in the trace direction.
About interpolation factors
Interpolation factors let you increase or reduce the scale of the seismic display by specifying positive or negative interpolation factors.
Time Inches/Second specifies the number of time samples to be created and inserted between every real time sample. The value shown is the current scale setting.
Line Traces/Inch specifies the number of line traces to be created and inserted between every real line. The value shown is the current setting.
Trace Lines/Inch specifies the number of vertical traces to be created and inserted between every real trace. The value shown is the current setting.

Landmark SeisWorks/3D Tutorial
R2003.12.1 Generating a Seismic View: Alter the Seismic Display 65
Landmark SeisWorks/3D Tutorial
R2003.12.1 Generating a Seismic View: Use Color Control 66
Use Color Control
In SeisWorks/3D, you automatically get dual color bars when you start the application. The Map Color Bar provides the colors for Map Views, Horizon Image Maps, and Perspective Views, and the Seismic Color Bar provides an optional color map for use with all Seismic Views. You can have two color bars per screen.
In this exercise, you will open a color bar in Map View and a color bar in Seismic View, and you will experiment with some of the colormap options.
To open the color bar:
1. From the Map View, click on the Color Control icon, or select View ➛ Color Control... from the menu.
The Map Color Bar opens as shown on the next page. This color bar will be used for your Map Views on Screen:1. In addition, the Color Control icon adds an arrow, as shown at left, to indicate the view from which you invoked the color bar.
SeisWorks running on 24-bit color only.
Beginning with Release 2003.12, SeisWorks switched to 24-bit color. It no longer supports 8-bit.
The change helps to eliminate color flashing in Unix and to provide more color capability as you work.
For more information about color in SeisWorks, see the section “Using Color” in the SeisWorks/3D Display Data manual.

Landmark SeisWorks/3D Tutorial
R2003.12.1 Generating a Seismic View: Use Color Control 67
2. Select File ➛ Open... from the Map Color Bar.
The Open Color File browser opens as shown on the next page. The box contains a list of colormaps that are available for all projects.
seismicamplitudes
end time
affects map units
start time
menu bar
map units(two-way travel time)
Map Color Bar
Default update forces redraw of each affected color cell
Landmark SeisWorks/3D Tutorial
R2003.12.1 Generating a Seismic View: Use Color Control 68
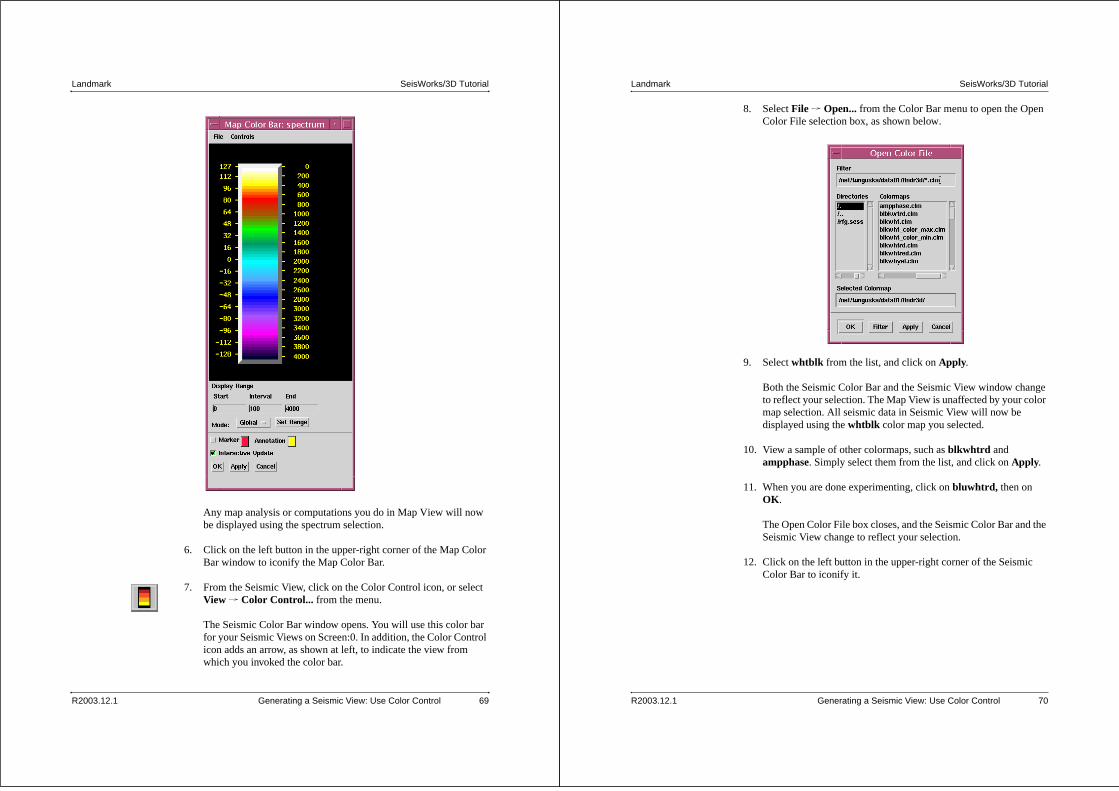
3. Scroll down the Colormaps list, and select spectrum.
Your selection appears in the Selected Colormap text field.
4. Click on Apply.
Map Color Bar: spectrum appears at the top of the Map Color Bar window to indicate your selection, and the bar displays a spectrum of color, as shown on the following page.
5. Click on OK to close the Open Color File dialog box.
Landmark SeisWorks/3D Tutorial
R2003.12.1 Generating a Seismic View: Use Color Control 69
Any map analysis or computations you do in Map View will now be displayed using the spectrum selection.
6. Click on the left button in the upper-right corner of the Map Color Bar window to iconify the Map Color Bar.
7. From the Seismic View, click on the Color Control icon, or select View ➛ Color Control... from the menu.
The Seismic Color Bar window opens. You will use this color bar for your Seismic Views on Screen:0. In addition, the Color Control icon adds an arrow, as shown at left, to indicate the view from which you invoked the color bar.
Landmark SeisWorks/3D Tutorial
R2003.12.1 Generating a Seismic View: Use Color Control 70
8. Select File ➛ Open... from the Color Bar menu to open the Open Color File selection box, as shown below.
9. Select whtblk from the list, and click on Apply.
Both the Seismic Color Bar and the Seismic View window change to reflect your selection. The Map View is unaffected by your color map selection. All seismic data in Seismic View will now be displayed using the whtblk color map you selected.
10. View a sample of other colormaps, such as blkwhtrd and ampphase. Simply select them from the list, and click on Apply.
11. When you are done experimenting, click on bluwhtrd, then on OK.
The Open Color File box closes, and the Seismic Color Bar and the Seismic View change to reflect your selection.
12. Click on the left button in the upper-right corner of the Seismic Color Bar to iconify it.

Landmark SeisWorks/3D Tutorial
R2003.12.1 Generating a Seismic View: Use Frame Control 71
Use Frame Control
The Frame Control option allows you to display successive parallel views of seismic data at specified increments without selecting the seismic data for each view from the Map View.
The currently displayed seismic section must be one of the following types: line, trace, single panel point to point, time slice, or chair display. Frame Control always displays the type of seismic panel that is currently visible in the Seismic View. Since you currently have a trace displayed, you can use Frame Control.
Note: The latest version of Frame Control contains functions not included with previous versions. For this tutorial, you will be using only the frame selection functions. For a comprehensive description of the other functions, please see the SeisWorks/3D Data Display manual.
To see successive parallel seismic panels without selecting them from the Map View window:
1. Click on the Frame Control icon in the Seismic View window.
The Frame Control dialog box opens.
This dialog box provides several options for selecting frames. These options are described briefly below.
• Animate Backward. This option sets the Frame Control in the backward animation mode. The display software cycles continuously through the seismic data in descending order. When it reaches the minimum value in the display series, it “bounces” in the opposite direction and begins to display the seismic sections in ascending order. Animation continues until you reverse directions or click on the Stop button.
Landmark SeisWorks/3D Tutorial
R2003.12.1 Generating a Seismic View: Use Frame Control 72
• Backward. This option displays the next panel at the specified increment (see next page) in descending order. You can also use the expert keys <-.
• Stop. This control ends animation in the current display.
• Forward. This option displays the next seismic section at the specified increment in ascending order. You can also use the expert key ->.
• Animate Forward.This option sets the Frame Control in the forward animation mode. The display software cycles continuously through the seismic data in ascending order. When it reaches the maximum value in the display series, it “bounces” in the opposite direction and begins to display the seismic sections in descending order. Animation continues until you reverse directions or click on the Stop button.
• Increment: Multiplier. This control multiplies the movement of the seismic sections that are displayed when the Backwardand Forward options are used. The multiplier value is linked to the values selected in the Increment Parameters dialog box. (See Parameters below.)
• Parameters. This control opens the Increment Parameters dialog box. Different values for Lines and Traces can be set in this box, and the values are linked to the Increment Multiplier control described above. For example, if you set the Tracesvalue to 2 in the dialog box, and you set the Increment: Multiplier at 10, the seismic display moves 20 panels in ascending or descending order, respectively, when you click on Forward or Backward.
For a more complete description of the functions of the Increment: Multiplier and Parameters controls, see the SeisWorks/3D Data Display manual.
• Go To. This option allows you to display frames by frame number. Generally, the frame number coincides with the line or trace number, or with some time value. You enter the frame number in the number field next to the Go To pushbutton. After entering the frame number, click on Go To to display the section in the Seismic View window.
• ReadNext Off or ReadNext On. When this option is turned on, it speeds up displays by anticipating the next seismic section you might wish to see.

Landmark SeisWorks/3D Tutorial
R2003.12.1 Generating a Seismic View: Use Frame Control 73
• Home. This option redisplays the last seismic panel that you selected using the Seismic View’s Seismic ➛ Select from Map, Intersection from Seismic, Fold from Seismic, orSelect from List options.
2. Now, click on the Forward control with the Increment: Multiplier set at 1.
The next trace is displayed in the Seismic View, and the yellow trace line in Map View shifts upward.
3. Change the Increment: Multiplier to 20, and click the Forwardcontrol.
Notice that the trace displayed in Seismic View is now 20 traces to the left of the previous trace, while the yellow trace line in Map View moves farther upward.
4. Next, experiment with the Go To option. Change the number of the section in the number field, and click on the Go To control.
The section that was displayed in the Seismic View window is replaced by the specified section.
5. Use the different Frame Control selection options to display different seismic panels.
6. When you are finished experimenting, key in 45 next to the Go Tocontrol, and click it.
7. Click on Close to close the Frame Control dialog box.
The next topics in this tutorial are zooming and magnifying the displays.
Use your spacebar to scroll through views in Frame Control.
You can click on your spacebar instead of Button 1 to scroll through a Seismic View when you are in Frame Control. Simply position the mouse cursor over one of the Frame Control buttons: Animate Backward , Backward ,Forward , or Animate Forward . Then press the spacebar on your keyboard. The Seismic View display will advance or decline by the increments you specify in Increment: Multiplier in the Frame Control dialog box.
To end this manner of Frame Control scrolling, position your mouse cursor over the Stop control and press Button 1.
Landmark SeisWorks/3D Tutorial
R2003.12.1 Generating a Seismic View: Zoom the Display 74
Zoom the Display
You can zoom in on (or enlarge) a portion of the seismic display shown in the Seismic View window using the Zoom option. The Zoom option changes the interpolation factors for the line, trace, and time dimensions of the selected area of data. For more information on the Zoom option, refer to the “Selecting and Viewing Seismic Data” chapter of the SeisWorks/3D Data Display manual.
To zoom in on a portion of your seismic display:
1. Click on the maximize button in the upper-right corner of the Seismic View window, and expand the window to fill the screen.
2. Click on the Zoom icon in the Seismic View window. (Or, press the <z> key.)
This toggles on the Zoom mode. (You can also activate the zoom mode by selecting View ➛ Zoom from the Seismic View menu bar.)
3. To see the zoom rectangle, place the cursor in the window, and press the <+> key on your keyboard or numeric keypad.

Landmark SeisWorks/3D Tutorial
R2003.12.1 Generating a Seismic View: Zoom the Display 75
4. Move the cursor around in the window to see the zoom rectangle.
The zoom rectangle appears in the color in which the annotations appear. To change the color, bring up the Seismic Color Bar, click on the Annotation square, and choose a color from the Select Annotation Color box.
5. Press the <+> once more to reduce the size of the zoom area.
Reducing the zoom area has the effect of “zooming in” on the data. The smaller the zoom area is, the greater the amount of zoom that occurs. If you have reduced the size of the zoom area too much, press the <-> key to enlarge the size of the zoom area. Enlarging the zoom area has the effect of “zooming out” from the seismic data.
6. Press Button 1 to perform the zoom.
The Seismic View is redrawn at the scale that you specified with your zoom setting. Less seismic data is displayed, but at a greater resolution than the seismic data in the original Seismic View.
7. Press the <r> key to restore the Seismic View to its original resolution.
Zoom Rectangle
(Only the data within this rectangle is zoomed.)
Landmark SeisWorks/3D Tutorial
R2003.12.1 Generating a Seismic View: Zoom the Display 76
You can also perform zoom functions using the Zoom popup menu shown below. Press Button 3 to access this menu.
Continue pressing on Button 3, and drag to the function you wish to use. Then, release Button 3. Press Button 1 to perform the zoom.
8. To exit from the Zoom mode, press the <z> key. You can also press Button 3 and drag to Exit Zoom.
9. Click on the Unzoom icon to restore the view to the original scale.
For a complete listing of all the icons available in SeisWorks/3D, refer to Appendix A in the SeisWorks/3D Introduction manual. All SeisWorks/3D expert keys are listed in Help ➛ Expert Keys in the SeisWorks main launcher and in Appendix B of the SeisWorks/3D Introduction manual.
In addition, you can assign any available function to the key of your choice. For more information on programmable keys, see the “SeisWorks Basics” chapter in the SeisWorks/3D Introductionmanual.

Landmark SeisWorks/3D Tutorial
R2003.12.1 Generating a Seismic View: Magnify the Display 77
Magnify the Display
This option uses pixel replication to magnify the Seismic View. It differs from Zoom in that it performs an actual magnification of all the seismic data selected for display, including the seismic data not currently visible in the display window.
Unlike the Zoom function, Magnify is not dependent upon the interpolation factors of the Seismic View. The Magnify option is limited to pixel replication. Therefore, the display may look “blocky” at a higher magnification level, as shown in the illustration below.
The Magnify function is similar to the Zoom function. Once you have entered the Magnify mode, you can use successive presses of the <+> and <-> keys to increase and decrease the degree of magnification. You can magnify the data up to eight times before reaching the limit. To restore the magnified display to its original scale, press the <r> key.
You will now magnify the data in the Seismic View window.
1. Press the <m> key.
2. Place the cursor in the window, and press the <+> key from the numeric keypad a few times. Now press the <-> key from the
MagnifiedZoomed
Shortcut: Magnifying the display
Once the magnify mode is on, you can use Button 1 presses to increase the degree of magnification. Use Button 2 presses to decrease the degree of magnification.
Button 3 Magnify Popup Menu
Landmark SeisWorks/3D Tutorial
R2003.12.1 Generating a Seismic View: Magnify the Display 78
numeric keypad. Also experiment with Button 1 and 2 presses.
3. Press Button 3 to access the Magnify popup menu shown on the previous page. When the popup menu appears, choose the magnification level you want.
This procedure allows you to go directly to the magnification level without pressing the <+> or <-> keys several times.
4. Press the <r> key, or select 1x from the Magnify popup menu, to return the display to its original view.
5. To exit the Magnify mode, press the <m> key again.
Continue to the Next Chapter
Now, you will expand on your knowledge of Map Views and Seismic Views to learn how to display and interpret horizons and faults. Proceed to the next chapter on page 79.
When magnifying data...
Magnification centers the display wherever you place the point of the cursor within the Seismic View window.

Landmark SeisWorks/3D Tutorial
R2003.12.1 Interpreting Horizons and Faults 79
Interpreting Horizons and Faults
Introduction
In this chapter, you will learn to do the following things:
• Create horizons (page 81).
• Display horizons in Map View (page 83).
• Pick and delete horizons in Seismic View (page 84).
• Use an auto tracker (page 88).
• Open a Perspective View window (page 90).
• Pick fault segments and assign them to fault planes (page 91).
• Calculate fault heaves in Map View (page 99).
• Open a new Seismic View with the Select from List... option (page 102).
• Use bookmarks (page 110).
Landmark SeisWorks/3D Tutorial
R2003.12.1 Interpreting Horizons and Faults: Interpret Horizons 80
Interpret Horizons
After viewing the data and finding the seismic section you want to work with, you will want to interpret horizons and faults. Each interpreter interprets seismic data differently, depending on preferences and the type of data being interpreted.
In this section, you will create and interpret horizons and faults in an order you may not follow with your own data. The exercises in this tutorial are designed to show you some basic steps for interpreting horizon and fault data.
Interpreting horizons is a two-step process. You must first select a horizon, or, if a horizon does not exist, you must create one. When you have selected or created a horizon, you can pick the points for the horizon.
The next several sections describe how to:
• create horizons • enable horizons in Map View• pick horizons• delete horizons• use an auto tracker

Landmark SeisWorks/3D Tutorial
R2003.12.1 Interpreting Horizons and Faults: Interpret Horizons 81
Create a Horizon
To create horizons:
1. Select Horizons ➛ Select from the Seismic View menu bar.
The Multiple Horizon Selection dialog box opens.
This dialog box lists the currently available horizons. If no horizons have been created for the current project, the list is empty. For this exercise, you will create a new horizon.
Landmark SeisWorks/3D Tutorial
R2003.12.1 Interpreting Horizons and Faults: Interpret Horizons 82
2. Click on the Create pushbutton to open the following dialog box.
The internal horizon number indicates the sequence of the horizon among the total number of horizons created for the project. Horizons in the project are numbered serially, beginning with “1.”
The color box allows you to assign a color for the horizon. The horizon will be shown in this color when displayed, except when it is the active horizon during interpretation. In that case, it will assume the annotation color (usually yellow).
3. Enter a name for the new horizon.
• Place the cursor in the horizon name text field, and press Button 1 to activate the field.
• Type: <your initials>greenhzn.
4. Click on the Onset Type pushbutton (set by default to Minimum),and change the setting to Maximum. (This will affect the auto amplitude picker later.) Do not change the horizon type at this time.
5. Click on the color box to open the Select Horizon Color selection box, and click on a bright green selection.
The selection box closes automatically, and your color of choice is reflected in the Create Horizon dialog box.
internalhorizon number
horizon name text field
horizon type
onset type
color box

Landmark SeisWorks/3D Tutorial
R2003.12.1 Interpreting Horizons and Faults: Interpret Horizons 83
6. Click on OK to create the horizon and to close the Create Horizon dialog box.
7. Then click on OK to close the Horizon Selection box.
Turn on Horizon in Map View
Before you begin to interpret your horizon, turn on the horizon in the Map View window so that it will be displayed as it is picked in the Seismic View window.
1. Click on the Contents icon in the Map View window to open the Map View Contents dialog box.
2. Select the top toggle button under Horizons near the bottom of the Map View Contents box.
The Horizon Selection dialog box opens.
3. Select your greenhzn horizon, and click on OK.
The Horizon Selection dialog box closes, and your horizon appears in the text field just to the right of the selected horizon toggle button.
Landmark SeisWorks/3D Tutorial
R2003.12.1 Interpreting Horizons and Faults: Interpret Horizons 84
4. Click on OK in the Map View Contents dialog box.
The dialog box closes. Now that the horizon is turned on, the Map View window dynamically updates to show the horizon as it is being picked in the Seismic View window.
Pick the Horizon
When you interpret a horizon in SeisWorks, you can use several tracking modes: Point, Auto Dip, Auto Track, and Correlation. You are going to interpret your horizon using the Point mode first.
To start the Horizon Interpretation mode:
1. Click on the Horizon Interpretation icon from the Seismic View window, or press the <h> key.
2. The information field at the bottom of the Seismic View window changes to reflect the tracking mode, active horizon, and cursor position as illustrated below. Your greenhzn is automatically chosen as the active horizon.
Although the default tracking mode is Point, you need to see how the tracking mode is selected.
cursor position
tracking mode/horizon

Landmark SeisWorks/3D Tutorial
R2003.12.1 Interpreting Horizons and Faults: Interpret Horizons 85
3. Press and hold down Button 3 anywhere in the Seismic View window to get the Horizon Interpretation menu shown below.
4. Continue pressing Button 3, drag down and selectTracking ➛ Point, then release Button 3. (You can also press the <p> key.)
5. Move the cursor to one of the smooth (non-faulted) events near the top of the seismic section (about 900 ms).
Landmark SeisWorks/3D Tutorial
R2003.12.1 Interpreting Horizons and Faults: Interpret Horizons 86
6. Interpret on a blue reflector since you changed the onset type to maximum a few steps back. Use the illustration below as a guide.
7. Interpret the line from left to right. You may need to use the scroll bar at the bottom of the Seismic View Window to get to the other side of the seismic view.
• Press Button 1 to place the first point.
• Move the cursor to the right, and press Button 1 to place a second point.
In Point mode, no amplitude tracking is being done by the system. The horizon is simply a series of straight lines between points.
8. Using Button 1, continue placing points until about the middle of the line. (Notice the dynamic updating of your picks in the Map View.)
9. Press Button 2 to disconnect the horizon from the cursor’s movement and write the interpretation to the horizon file.
10. Press and hold down Button 3 to get the Horizon Interpretation menu. Highlight Close Interpretation at the bottom of the menu. This ends the interpretation mode.
start here

Landmark SeisWorks/3D Tutorial
R2003.12.1 Interpreting Horizons and Faults: Interpret Horizons 87
Your Seismic View should look similar to that shown below.
Deleting a Horizon
Now, delete this horizon, and pick another using the Auto Track amplitude picker.
To delete the horizon you just picked:
1. Press the <h> key.
This key allows you to start the Interpret Horizon mode without going to the main menu. You can also press Button 3 and select Interpret Horizons. Note that the active horizon indicated at the bottom of the window is still your greenhzn.
2. Press the <d> key to activate the Delete Mode.
3. Delete your horizon pick.
• Place the cursor over one end of the horizon you just picked, and press Button 1.
• Move the cursor to a point in the middle of the horizon, and press Button 1.
The segment of the horizon between the two button presses is deleted. Notice that the Map View window has been dynamically updated to reflect this change.
your greenhzn pick using Point mode
Button 3 popup menu
Landmark SeisWorks/3D Tutorial
R2003.12.1 Interpreting Horizons and Faults: Interpret Horizons 88
4. Use two Button 1 presses to delete the remainder of the horizon. Do not close the interpretation. You will pick the active horizon again using an amplitude tracking mode.
Using Auto Tracking
Now that you have deleted this horizon, repick the horizon using one of the amplitude tracking modes. You should still be in the Horizon Interpretation mode; if not, press the <h> key.
1. Press the <t> key to start Auto Track mode. You can also press Button 3 in the Seismic View window for the Horizon Interpretation menu. Choose Tracking ➛ Auto Tracking.
Auto Tracking is designed to follow a well-defined horizon that may have variable dip. Button 1 indicates the position of the point from which automatic picking is to begin.
Once this initial point is selected, you can track either to the left or to the right. The second Button 1 indicates the horizontal position of a point to which the automatic digitizing is to continue. Only the horizontal location of subsequent Button 1 presses affects the auto-tracking. The vertical position is disregarded.
For more information on auto-tracking, refer to the “Tracking Horizons” chapter in the SeisWorks/3D Horizon Interpretation manual.
2. Place the first point (using Button 1) at the beginning of the line, and place the second point (using Button 1) at the end of the line.
The horizon is automatically tracked. (Notice the Map View window has been updated.)
The Auto Tracking algorithm uses Button 1 to set the seed point on the first trace. Button 1 indicates the direction and length to
Delete Mode behavior
When you switch from any tracking mode to Delete Mode, all interpretation is written to the horizon file. When you switch from Delete Mode to any tracking mode, the deletion is automatically written to the horizon. These changes are obvious only when you choose Undo from the Horizon Interpretation popup menu.

Landmark SeisWorks/3D Tutorial
R2003.12.1 Interpreting Horizons and Faults: Interpret Horizons 89
track. It picks the nearest appropriate maximum, minimum, or zero crossing, depending upon the onset type (in this case, maximum). It then uses the new pick as the new center point of the auto-tracking window.
It continues picking until it cannot find a pick that falls within the specified amplitude range, or until it reaches a horizontal position that corresponds to the horizontal position of the Button 1 press that initiated the auto-tracking sequence.
3. Now, delete this horizon again, using Delete Mode as you did earlier:
• Press the <d> key.
• Place the cursor over one end of the horizon you just picked, and press Button 1.
• Move the cursor to the end of the horizon, and press Button 1.
4. After you delete the horizon, press Button 3 for the Horizon Interpretation menu. Choose Close Interpretation. You will use your greenhzn in a later exercise.
Repicking horizons
You do not need to delete your previous picks before you repick the horizon. Any of the tracking modes can overwrite the picks of another mode.
Tracking in both directions
You can press Ctrl-Button 1 to set the seed point on the first trace and track in both directions to the edges of the displayed section.
Landmark SeisWorks/3D Tutorial
R2003.12.1 Interpreting Horizons and Faults: Interpret Faults 90
Interpret Faults
Now that you have seen how to interpret a horizon using two tracking modes, you will interpret some faults in this seismic section. After interpreting the faults, you will interpret your greenhzn through the faulted area. Once the section is interpreted, you will calculate and display the fault heaves in the Map View window.
For information on interpreting faults in the Map View, see the SeisWorks/3D Fault Interpretation manual.
Open a Perspective View Window
Before interpreting faults, it is often a good idea to open a Perspective View window to see the faults as they are picked.
1. Select File ➛ New Task ➛ Perspective from the Seismic View menu. A message appears asking you to choose the screen on which to place the window.
2. Move the cursor to Screen:1, and press Button 1 to see the window or an outline of the window, depending on your system.
3. Press Button 1 again to place the window.

Landmark SeisWorks/3D Tutorial
R2003.12.1 Interpreting Horizons and Faults: Interpret Faults 91
When the Perspective View window first opens, a frame with no data appears. When you pick faults in Seismic View, you will see them displayed in Perspective View.
Pick Fault Segments
To interpret faults, you pick the fault segments in the Seismic View window, then assign them to fault plane files. Before you begin, resize the Seismic View window so that you can see most of the faulting in the window. You can maximize the window if desired.
To pick fault segments:
1. Press the <f> key while in the Seismic View window, or click on the Fault Interpretation icon. You can also select Faults ➛Interpret.
This procedure starts the Fault Interpretation mode.
2. Use the illustration on the next page as a guide for picking your faults.
• Move the cursor in the window to the point where you want to start the first fault, then press Button 1 for the first point.
• Use Button 1 to place subsequent points. Use Button 2 anywhere to end the rubberband and write the digitized horizon to the file.
Landmark SeisWorks/3D Tutorial
R2003.12.1 Interpreting Horizons and Faults: Interpret Faults 92
• Press Button 1 again to start a new fault.
Notice that as you pick the fault segments in the Seismic View window, they are interactively displayed in the Perspective View window.
As you pick your faults or edit segments, keep this general information in mind:
• In fault creation mode or edit mode, to cut a selected segment, press the expert key <c> or the Delete key. You may also select Cut Segment in the Button 3 popup menu.
• To cut a segment that is not selected, click Button 2 on the fault segment.
• To undo your previous action, press the expert key <u>, or select Undo from the Button 3 popup menu. You can undo a segment cut, undo the last point digitized, undo the last cut of a point, or undo the drag of a point.
When you wish to edit a segment, remember:
• To add new points to a segment, select the segment by clicking Button 1 over the segment. Then click with Button 1 where you
Button 1
Button 1
Button 1
Button 1
Button 1
Button 2 anywhere to end segments

Landmark SeisWorks/3D Tutorial
R2003.12.1 Interpreting Horizons and Faults: Interpret Faults 93
want the new points. SeisWorks lets you know you are over the segment by changing the cursor to a right, upward point hand.
• To delete a point in a segment, select the segment by clicking Button 1 over the segment. Place the mouse cursor over the point until you see a double-pointed cursor ( ), and then click Button 2.
• To move a point in a segment, place the mouse cursor over the point until you see a double-pointed cursor ( ), and then drag the point to a new location with Button 1.
Landmark SeisWorks/3D Tutorial
R2003.12.1 Interpreting Horizons and Faults: Interpret Faults 94
When you have picked two faults, you need to assign them to fault planes.
3. Press and hold Button 3 for the Interpret Faults menu.

Landmark SeisWorks/3D Tutorial
R2003.12.1 Interpreting Horizons and Faults: Interpret Faults 95
4. Drag to Correlate to open the Seismic View Correlate dialog box.
5. Click on the Create... pushbutton.
The Correlate dialog box lists the fault planes that exist for a project.
(Since the minor2D tutorial seismic project and the salnor 3D tutorial seismic project share the same OpenWorks project, salnor fault names will also appear in the minor fault lists.)
Auto-Correlate and Auto-Triangulate options
Although they are not covered in this tutorial, SeisWorks allows users to automatically correlate and triangulate faults as they are selected.
Refer to the SeisWorks/3D Fault Interpretation manual for information pertaining to these options.
Landmark SeisWorks/3D Tutorial
R2003.12.1 Interpreting Horizons and Faults: Interpret Faults 96
The Create Fault dialog box opens.
The color box allows you to assign a color for the fault. The fault will be shown in this color when displayed, except when it is the active fault during interpretation. In that case, it will assume the annotation color, which is usually yellow.
6. Create two fault planes using the names <your initials>3dred and <your initials>3dlightblue. This dialog box works exactly like the Create Horizon dialog box.
• Enter <your initials>3dred as the name of the first fault, and change the color box to red. Click on Apply.
• Enter <your initials>3dlightblue as the name of the second fault, and change the color box to light blue.
7. Click on OK.
The Create Fault dialog box closes, and you see each of the faults you created in the Correlate dialog box. Leave the box open.
fault name field
fault type colorbox

Landmark SeisWorks/3D Tutorial
R2003.12.1 Interpreting Horizons and Faults: Interpret Faults 97
8. Assign the faults in the window to the files you created.
• Move the cursor to the left fault in the Seismic View window, and click on it.
Notice that the cursor assumes a pointing finger shape when over a fault.
• Move the cursor to the Correlate dialog box, and click on <your initials>3dred.
The selected fault is assigned to the red fault plane and is displayed in the color set for that fault plane.
• Assign the other fault to <your initials>3dlightblue. Notice that the Perspective View window has been updated.
9. Click on Close to close the Correlate dialog box.
10. Press and hold Button 3 in the Seismic View window to get the Interpret Faults menu.
11. Drag to Close Interpretation to end the Fault Interpretation mode.
When a fault is selected, the segments are highlighted as shown here.
Landmark SeisWorks/3D Tutorial
R2003.12.1 Interpreting Horizons and Faults: Interpret a New Horizon 98
Interpret a New Horizon
Now that you have some faults picked, interpret another horizon through the faulted data.
1. Press the <h> key while in the Seismic View window to enter Horizon Interpretation mode. Notice that the active horizon is still greenhzn, as shown at the bottom of the window.
2. Press the <p> key to select the Point tracking mode.
3. Interpret a horizon through the faulted data as shown in the illustration below. Remember:
• Button 1 starts and continues a segment. • Button 2 releases the rubber band and writes the digitized
horizon to the file. (No point is created.)
You can press the <d> key to access the Delete Mode if necessary.
4. After interpreting the final horizon segment, press Button 3 for the Horizon Interpretation menu, and select Close Interpretation.
Button 1
Button 1
Button 1
Button 2 anywhere to end rubber band and write horizon to file

Landmark SeisWorks/3D Tutorial
R2003.12.1 Interpreting Horizons and Faults: Calculate Fault Heaves in Map View 99
Calculate Fault Heaves in Map View
Now that you have interpreted a horizon through the faults, you can calculate the fault heaves and display them in the Map View window.
To calculate and display fault heaves in the Map View window:
1. Click on the Contents icon in the Map View window.
2. In the Map View Contents dialog box, select the first radio button under Heaves, just to the left of the Horizons toggle button you selected earlier. The horizon greenhzn with your initials is in the text field to the right.
3. Click on OK at the bottom of the Contents dialog box to close it.
Now that you have selected the horizon containing the fault heaves you want to calculate, you can perform the calculation.
4. Press the </> (forward slash) key while the cursor is over the Seismic View window.
This procedure initiates the Calculate Heaves function.
Landmark SeisWorks/3D Tutorial
R2003.12.1 Interpreting Horizons and Faults: Calculate Fault Heaves in Map View 100
The fault heaves are automatically calculated and displayed in the Map View window as shown below.
Notice on your screen that the fault heaves are shown in the fault display color set in the Seismic View window.
For each fault heave, fault gap ticks represent the gap in the horizon on the shot line where the fault has been interpreted.
The fault gap ticks consist of bars on both sides of the gap and an arrow placed on the bar of the upthrown side.

Landmark SeisWorks/3D Tutorial
R2003.12.1 Interpreting Horizons and Faults: Calculate Fault Heaves in Map View 101
If your fault heaves do not calculate. . .
1. Verify that heaves are selected for display in Map View.
2. Make sure that your horizons do not touch or cross the fault.
3. In the Seismic View main menu, select Faults ➛ Parameters.... When the Fault Parameters dialog box appears, examine the Maximum Gap for Heave Calculation text box. The number keyed in there represents the upper limit on the number of traces the software can search for horizon picks. The gap is applied to each side of the fault. For instance, if you set a gap of 12 traces, the software will search 12 traces on the upthrown side of the fault for horizon picks and 12 traces on the downthrown side of the fault for horizon picks. If SeisWorks does not find a pick within the gap on both sides of the fault, no heave is calculated.
Landmark SeisWorks/3D Tutorial
R2003.12.1 Interpreting Horizons and Faults: Interpret New Seismic Sections 102
Interpret New Seismic Sections
Now that you have interpreted a seismic section and calculated fault heaves, you will interpret several more seismic sections. First, you will interpret a line that intersects the trace you just interpreted. Then you will interpret several sections parallel to the trace using theFrame Control option to “page” through the sections.
Open a New Seismic View Window
Open a new Seismic View window to view inline seismic sections.
1. Select File ➛ New Task ➛ Seismic from the Seismic View window.
2. Place the window on the left screen with the other Seismic View window.
This window displays the same seismic section as the first, so you will need to select another line from the Map View window.
3. Click on the Contents icon in the Seismic View to open the Seismic Contents dialog box.
4. Select Horizon Intersection Symbols, then click on OK to close the dialog box.
5. Press and hold Button 3 in the Seismic View window, and drag to Select from List....
The Select Seismic Section dialog box appears as shown on the next page.

Landmark SeisWorks/3D Tutorial
R2003.12.1 Interpreting Horizons and Faults: Interpret New Seismic Sections 103
This dialog box provides a quick way to select lines, traces, and time slices without having to select them using the Select from Map methods.
6. Double-click in the Line text field, and type 1.
The Sections list is automatically renumbered so that the numbers of all lines increase by the increment of 1.
7. Scroll though the list, and click on line 78.
The selected seismic section is displayed in the Seismic View window as shown on the next page.
8. Click on OK to close the dialog box.
About the Apply Immediately button
Beginning with Release 2003.12.1, an Apply Immediately button is on by default in the Select Seismic Section dialog box. So, as soon as you click on a line, it appears in the Seismic View.
Landmark SeisWorks/3D Tutorial
R2003.12.1 Interpreting Horizons and Faults: Interpret New Seismic Sections 104
When the seismic section displays, you should be able to notice the horizon intersection symbol and the fault indicator. Use the scroll bar at the right of the Seismic View window to scroll to the right depth if necessary.
The horizon you interpreted on trace 45 is indicated by a yellow tick mark enclosed in a circle. The indicator is displayed because you turned on the Horizon Intersection Symbols option in Seismic View Contents.
The fault is indicated by a in the color assigned to the fault
9. Change the color bar for the display to blkwht to see the horizon and fault indicators clearly.
10. Once you have located the indicators, change the color bar to display bluwhtrd.
fault indicator
horizon intersection symbol
Finding the fault indicator
If you cannot locate the fault indicator the first time, use the Select Seismic Section box or the Frame Control icon to select another line that is greater or less than the previous one you chose. For example, if you chose 78 the first time, choose 77, then 79, and so on until you locate the fault indicator.

Landmark SeisWorks/3D Tutorial
R2003.12.1 Interpreting Horizons and Faults: Interpret New Seismic Sections 105
11. Interpret the horizon that the horizon intersection symbol appears on. The steps are outlined below:
• Press the <h> key to activate the Horizon Interpretation mode. The active horizon is still your greenhzn.
• Press the <p> key to enter the Point tracking mode.
• Pick the horizon. Press Button 1 to start and to pick subsequent points. Starting from the left side of the view, interpret to about where the data begins to break up.
• Press Button 3 for the Horizon Interpretation menu. Select Close Interpretation.
Interpret Additional Sections
Now that you have interpreted a line that intersects the trace you interpreted, you will interpret several traces that intersect the line.
1. Move the cursor back to the first Seismic View window, which is displaying trace 45. Place the cursor in the title bar, and press Button 1 to place this window above the other window.
2. Click on the Contents icon to open the Seismic Contents dialog box.
3. Select Horizon Intersection Symbols, then click on OK to close the dialog box.
4. Click on the Frame Control icon to open the Frame Control dialog box.
5. Display trace 37 by using the absolute frame selection:
• Double-click on 45 in the number field next to the Go To button.
• Enter 37 in the number field.
• Click on the Go To button, then close Frame Control.
You should be able to see the horizon intersection symbol from your interpretation on line 78.
Landmark SeisWorks/3D Tutorial
R2003.12.1 Interpreting Horizons and Faults: Interpret New Seismic Sections 106
6. Interpret your faults. The procedure is outlined below.
• Press the <f> key to enter Fault Interpretation mode.
Select/Create Segments should appear at the bottom of the Seismic View message area next to Mode. You are ready to interpret your faults.
• Pick the two fault segments. Remember: Button 1 starts and continues a segment, and Button 2 ends a segment. Use the illustration below as a guide.
• Assign the faults you just picked. Press Button 3 for the Interpret Faults menu again. Choose Correlate. The Seismic View Correlate dialog box opens.
• Move the cursor over the first fault, and press Button 1 to select it. Select <your initials>3dred from the Seismic View Correlate dialog box. Assign the second fault to <yourinitials>3dlightblue. Click on Close.
horizon intersection symbol from line 78

Landmark SeisWorks/3D Tutorial
R2003.12.1 Interpreting Horizons and Faults: Interpret New Seismic Sections 107
7. Interpret your horizon greenhzn. The procedure is outlined below:
• Press the <h> key. • Press the <p> key to enter the Point tracking mode. • Pick the horizon on which the circle and tick mark appear.
Remember: Button 1 starts and continues a segment, and Button 2releases the rubber band and writes the digitized horizon to the file. If necessary, press the <d> key, and use the Delete Mode. After picking the horizon, your Seismic View should look similar to the one below.
8. To calculate the fault heaves, press the </> key (forward slash).
The Map View is updated automatically with the new heaves.
9. Press Button 3 for the Horizon Interpretation menu, and select Close Interpretation.
10. Repeat Steps 4 through 9 for two more traces.
• Continue in the northern direction to interpret traces 27 and 17.
• Calculate the fault heaves after each seismic section is interpreted. Use the illustrations on the next page as a guide to how the interpreted sections should look.
Pick the horizon that the circle and tick mark appear on.
Landmark SeisWorks/3D Tutorial
R2003.12.1 Interpreting Horizons and Faults: Interpret New Seismic Sections 108
Trace 27
Trace 17

Landmark SeisWorks/3D Tutorial
R2003.12.1 Interpreting Horizons and Faults: Interpret New Seismic Sections 109
After you have interpreted traces 45, 37, 27, and 17, and calculated the fault heaves for the two fault planes, your basemap should look somewhat similar to the map shown below.
In the next chapter, “Performing Contouring” on page 119, you will work with several of the SeisWorks mapping features. Before you proceed to that section, please run through the steps in “UseBookmarks” beginning on the next page.
Landmark SeisWorks/3D Tutorial
R2003.12.1 Interpreting Horizons and Faults: Use Bookmarks 110
Use Bookmarks
Bookmarks are an easy way to keep track of displays you have made; redisplay earlier displays; and create lists of displays to view at a later time. With bookmarks, you can:
• Keep a record of Seismic View displays you previously generated.
• Redisplay individual, previously displayed views or a series of previously displayed views.
• Rename a specific display to a name you choose.
• Turn off the automatic bookmarks option, then manually make a bookmark.
• Save a set of bookmarks as a Bookmark File, for display at a later time.
By default, the Bookmarks option is enabled each time you open a SeisWorks session/Seismic View. By default, the Bookmarks option automatically records the latest 20 view displays.
• Global parameters, such as the settings you select for wells, horizons, faults, and the color bar, will apply to all displays.
• View-specific parameters, such as seismic display parameters, flattened horizon displays, and time-depth ranges, will be maintained for each individual view.
To perform the steps in this section of the tutorial, you will use the Seismic View that you created earlier in this tutorial.

Landmark SeisWorks/3D Tutorial
R2003.12.1 Interpreting Horizons and Faults: Use Bookmarks 111
1. In the Seismic View, select View ➛ Bookmarks ➛ Bookmarks....The Bookmarks dialog box opens.
The displays that you produced during the course of this tutorial are listed in the Bookmarks dialog box. The Trace 45 display is highlighted because it is the current display.
2. In the Seismic View, select Seismic ➛ Select from List.... When the Select Seismic Section dialog box opens, select lines 100 and 110 by clicking on the line name, then clicking on Apply. Select line 100 again, and click on Apply. The Seismic View will display each newly selected line each time you click on Apply.
Landmark SeisWorks/3D Tutorial
R2003.12.1 Interpreting Horizons and Faults: Use Bookmarks 112
Notice that as each line appears in the Seismic View, a new bookmark is added to the Bookmarks dialog box. By now your bookmarks list should look similar to this one:
You can navigate through the bookmarks in several ways:
• Use the display navigation arrows to move through the bookmarks in rapid sequence.
The large black arrows advance one bookmark at a time. (You can achieve the same effect by using your spacebar instead of these arrow keys.) The double arrows advance through the entire list of bookmarks until you reach the end of the file, then loop back continuously until you press the red Stop button.
• Double-click on the bookmark you want to display. For example, double-click on 1_<salnor>_<Trc_45>. The Seismic View will display trace 45.
• On your keyboard, use the left arrow key to display previous views, then the right arrow key to return to the most recent view. Note: The cursor must be within the Seismic View for this process to work.
• Select View ➛ Bookmarks ➛ Back to display the Seismic View you last displayed prior to the current view.
• Select View ➛ Bookmarks ➛ Forward to return to your most recent display.
Arrow identifies currently displayed view
Number of panels in view Unique identifier number for duplicate displays
Line or trace numberSeismic project name

Landmark SeisWorks/3D Tutorial
R2003.12.1 Interpreting Horizons and Faults: Use Bookmarks 113
Use the up and down arrow buttons to rearrange the sequence of the bookmarks.
To delete bookmarks, you would select the bookmark to delete, then click on Delete. The bookmark is immediately removed from the list. Do not remove any bookmarks at this time, however.
The ability to rename individual bookmarks is particularly useful for identifying views of the same line with different flattening, display scales, sample rates, magnification, etc.
1. Select 1_<salnor>_<Trc_45>, then click on Rename. The Create New Name dialog box opens.
2. Type Trace_45_tutorial in the New Name text field, then click on OK.
The Create New Name dialog box closes, and Trace_45_tutorialis shown in the Bookmarks dialog box.
To access the bookmark navigation controls without taking up much screen space, click on the “-” button in the upper right corner of the Bookmarks dialog box. Repeat this step to reopen the dialog box.
Landmark SeisWorks/3D Tutorial
R2003.12.1 Interpreting Horizons and Faults: Use Bookmarks 114
The ability to save a list of bookmarks to a bookmark file is useful for grouping views, specific lines with different flattening, display scales, sample rates, and magnification, etc., for use at another time.
1. Use the steps below to rename and delete individual bookmarks to create a list of desirable bookmarks in the Bookmarks dialog box.
2. Click on Save As. The Bookmark File Save As dialog box opens.
3. Type tutorial_list in the New Bookmark File text field, then click on OK.
The Bookmark File Save As dialog box closes, and the name of the bookmark file is shown in the title bar of the Bookmarks dialog box.
As bookmarks are added to and deleted from the list in the Bookmarks dialog box, you must save the list for the changes to be permanent. To do so, click on Save.
Bookmark files are saved in the working project directory with an .svb suffix. To remove bookmark files, you must delete them from the working project directory.
Using the steps you have learned in the Bookmarks section, experiment with the Bookmarks options and create another bookmark list.
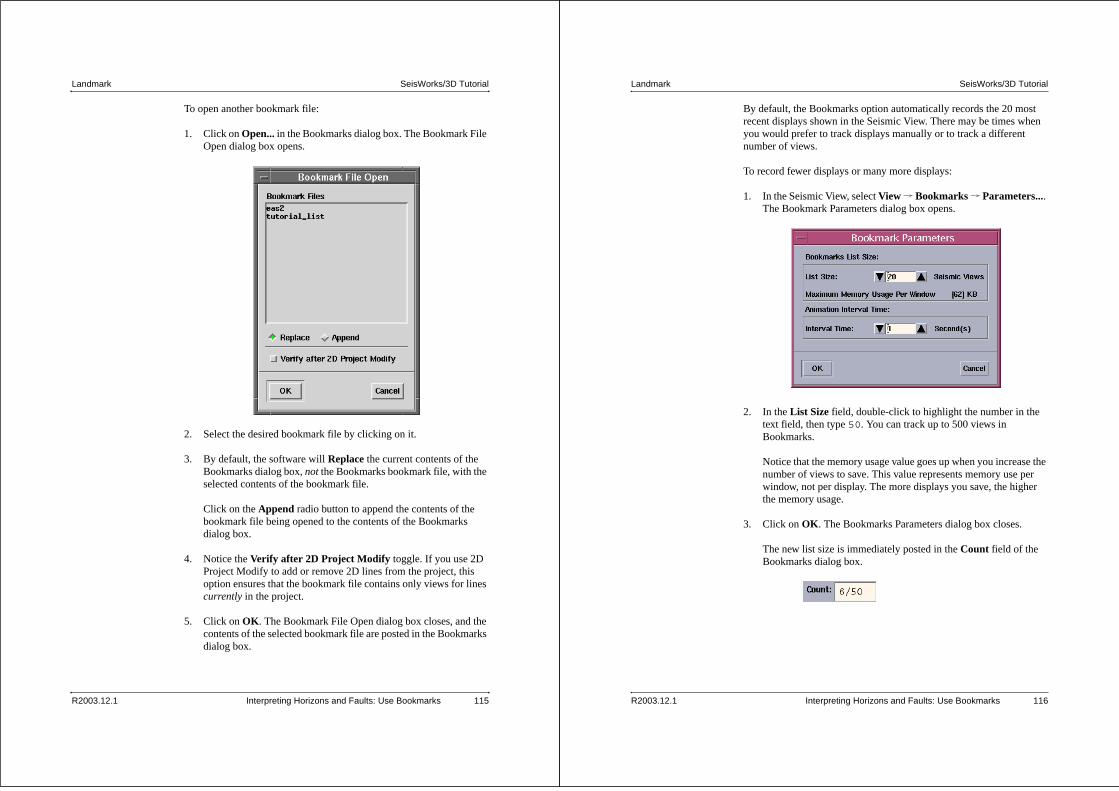
Landmark SeisWorks/3D Tutorial
R2003.12.1 Interpreting Horizons and Faults: Use Bookmarks 115
To open another bookmark file:
1. Click on Open... in the Bookmarks dialog box. The Bookmark File Open dialog box opens.
2. Select the desired bookmark file by clicking on it.
3. By default, the software will Replace the current contents of the Bookmarks dialog box, not the Bookmarks bookmark file, with the selected contents of the bookmark file.
Click on the Append radio button to append the contents of the bookmark file being opened to the contents of the Bookmarks dialog box.
4. Notice the Verify after 2D Project Modify toggle. If you use 2D Project Modify to add or remove 2D lines from the project, this option ensures that the bookmark file contains only views for lines currently in the project.
5. Click on OK. The Bookmark File Open dialog box closes, and the contents of the selected bookmark file are posted in the Bookmarks dialog box.
Landmark SeisWorks/3D Tutorial
R2003.12.1 Interpreting Horizons and Faults: Use Bookmarks 116
By default, the Bookmarks option automatically records the 20 most recent displays shown in the Seismic View. There may be times when you would prefer to track displays manually or to track a different number of views.
To record fewer displays or many more displays:
1. In the Seismic View, select View ➛ Bookmarks ➛ Parameters....The Bookmark Parameters dialog box opens.
2. In the List Size field, double-click to highlight the number in the text field, then type 50. You can track up to 500 views in Bookmarks.
Notice that the memory usage value goes up when you increase the number of views to save. This value represents memory use per window, not per display. The more displays you save, the higher the memory usage.
3. Click on OK. The Bookmarks Parameters dialog box closes.
The new list size is immediately posted in the Count field of the Bookmarks dialog box.

Landmark SeisWorks/3D Tutorial
R2003.12.1 Interpreting Horizons and Faults: Use Bookmarks 117
To track views manually:
1. Put the Bookmarks option in manual mode by clicking on the Autooption button and dragging Button 1 to select Manual. Release Button 1.
2. Display another seismic line in the Seismic View. Notice that it isnot automatically added to the list of displays in the Bookmarks dialog box.
3. Select and display another seismic line in the Seismic View. Manually add this display to the Bookmarks list by clicking on the Add button.
Alternately, you can manually add bookmarks by pressing <Ctrl> + a.
To turn the bookmarks option off altogether, go to the Seismic View menu bar and select View ➛ Bookmarks ➛ Disable. Repeat this step to turn the bookmarks option back on.
Continue to the Next Chapter
When you are done with your interpretations and bookmark experiments, proceed to page 119 to learn about contouring.
Landmark SeisWorks/3D Tutorial
R2003.12.1 Performing Contouring 119
Performing Contouring
Introduction
In this chapter, you will learn to do the following:
• Create a mapping file to store map data (page 122).
• Set the required parameters for creating computed contours (page 123).
• Compute and display contours (page 129).
• Change the contour interval by using the Color Control window (page 131).
• Edit fault polygons (page 132) and regrid the data (page 134).
• Convert computed contours to manual and annotate manual contours (page 136).

Landmark SeisWorks/3D Tutorial
R2003.12.1 Performing Contouring: Create Computed Contours 120
Create Computed Contours
Now that you have interpreted several traces and calculated fault heaves, you are ready to contour your horizon.
To perform contouring, you must first create a mapping file. These mapping files can be built using data that has been derived from project horizons and faults, or data that has been imported from external ASCII files. Mapping files can contain the following three types of data:
• shotline points • control points • fault polygon points
For more information on mapping files, refer to the SeisWorks/3D Maps and Plots manual.
In this part of the tutorial, you will create a new mapping file to store the map data, then set the required parameters for creating computed contours. These parameters include the following:
• the horizon that will be used for input • the sampling parameters • the surface model type (gridded or triangulated) • whether or not to include fault points • the contour range and interval
Landmark SeisWorks/3D Tutorial
R2003.12.1 Performing Contouring: Create Computed Contours 121
Click on the Map It! icon from the Map View window to create the mapping file and set the above parameters. The Map It! dialog box opens. (Menu path in Map View: Mapping ➛ MapIt....)

Landmark SeisWorks/3D Tutorial
R2003.12.1 Performing Contouring: Create Computed Contours 122
Create the Mapping File
To create a new mapping file:
1. Click on the List... pushbutton next to the Mapping file text field to open the Select Mapping File dialog box.
2. Click on the Create pushbutton to open the New Mapping File dialog box, then type <your initials>green in theNew Mapping File text field. Mapping file names can have up to 40 characters.
This mapping file is based on the <your initials>greenhznhorizon.
3. Click on OK to close the New Mapping File dialog box.
Landmark SeisWorks/3D Tutorial
R2003.12.1 Performing Contouring: Create Computed Contours 123
The horizon name now appears in the Mapping Files text field of the Select Mapping File dialog box.
4. Click on OK again to close the Select Mapping File dialog box. Do not close the Map It! dialog box.
Two files are created: a map file with a .dts suffix, and a manual contour file with a .mcf suffix. These files become active immediately. All operations you perform in the next several sections will affect these mapping files.
Define Input Horizon and Sampling Parameters
Now that you have created a mapping file, you must fill out the rest of the Map It! dialog box with the appropriate parameters.
To convert horizons to map points:
1. Click on Convert Horizon To Map Points. It may already be on.
2. Select Entire Project.
3. Click on the List... pushbutton next to the Horizon text field to choose the input horizon. Choose your greenhzn from the list, and click on OK.

Landmark SeisWorks/3D Tutorial
R2003.12.1 Performing Contouring: Create Computed Contours 124
4. Click on the Sampling Parameters... pushbutton to open the Sampling Parameters dialog box, shown below.
5. Select Read shotlines from the Input Control panel. Click on the Trace radio button next to Direction to specify the direction in which the conversion is to be performed.
You want to choose Trace here because you interpreted primarily on the traces in the survey.
6. Set the Increment value to 1.
7. Select Traces in the Fault Usage panel.
8. Select Trace Increments in the Sample Control panel.
This specifies that a control point will be output for every trace at a particular trace increment (defined by you in the Tolerance or increment value field) of each sampled trace.
9. Change the Tolerance or increment value to 1.
10. Click on OK.
Landmark SeisWorks/3D Tutorial
R2003.12.1 Performing Contouring: Create Computed Contours 125
The parameters you have just set have been stored in the mapping file.
Choose Surface Model Type and Set Grid Parameters
Now that you have created a mapping file, defined the sampling parameters, and converted the horizon to map points, you must choose the surface model type: either gridded or triangulated. The gridded surface will produce smoother contours than the triangulated surface. For this exercise, use the gridded surface.
To choose the surface model type:
1. If it is not already chosen, click on Calculate Surface in the Map It! dialog box. Then select Grid for the Surface Model Type.
2. Click on the Grid Parameters... pushbutton to open the following dialog box.
3. Select the radio button next to User Defined.
4. Change the following gridding parameters:
• Grid Interval X to 781• Grid Interval Y to 781
Grid Parameters Dialog Box

Landmark SeisWorks/3D Tutorial
R2003.12.1 Performing Contouring: Create Computed Contours 126
5. Click on OK to close the Grid Parameters dialog box.
For more information on gridding parameters, refer to the “Computed Contours” chapter of the SeisWorks/3D Maps and Plots manual.
Landmark SeisWorks/3D Tutorial
R2003.12.1 Performing Contouring: Create Computed Contours 127
Specify the Fault Mode and Contour Parameters
You must specify whether fault polygons will be read into the mapping file and whether the existing fault polygons will be used to compute contours. When creating gridded contours for the first time, it is best to create and use fault polygons.
1. Select the Create and Use Polygons option in the Fault Usage section of the Map It! dialog box.
2. Next, specify the contour range and interval. Click on the Contour Parameters pushbutton to open the following dialog box.
Computed Contour Parameters Dialog Box

Landmark SeisWorks/3D Tutorial
R2003.12.1 Performing Contouring: Create Computed Contours 128
3. Change the Minimum value to 1400, and change the Maximumvalue to 1700. Leave the Interval and Smoothing Passesparameters as they are.
4. Select Computed Contour Annotation, and change the following:
• Annotation Interval to 40 (This value must be a multiple of the contour interval shown in the Color Control window.)
• Text Size to 500
5. Click on OK to close the Contour Parameters dialog box. Leave the Map It! dialog box open.
Landmark SeisWorks/3D Tutorial
R2003.12.1 Performing Contouring: Compute and Display Contours 129
Compute and Display Contours
To compute and display the contours:
1. Click on OK in the Map It! dialog box.
The conversion of horizon points to map points is performed first. Next, the grid is computed. Finally, the contours are computed. Once the contours have been computed, they are displayed automatically in the Map View window. The Computed Contours option in the Map View Contents dialog box is automatically set to the On position.
2. To see the contours better in the Map View window:
• Open the Contents dialog box, and turn off your greenhzn and all selected Heaves.
• Select Fault Polygons in the Mapping panel. Click on OK.

Landmark SeisWorks/3D Tutorial
R2003.12.1 Performing Contouring: Compute and Display Contours 130
Your contoured map should look something like the Map View below.
Landmark SeisWorks/3D Tutorial
R2003.12.1 Performing Contouring: Change the Contour Interval 131
Change the Contour Interval
Try changing the contour interval using the Color Control window as described below.
1. Click on the Color Control icon from the Map View window.
The Map Color Bar appears. You will need to change two settings at the bottom of the window.
2. Double-click in the Interval field, and type 40. Click on theSet Range pushbutton, then iconify the color bar.
3. Click on the Redraw icon in the Map View window to reflect the interval change.
The contours are redrawn with the new interval.
Zoom the Display
To get a better view of your contours for the next several exercises, zoom the display.
1. Click on the Point Zoom icon from the Map View window.
2. Place the cursor in the middle of the contoured area, and press Button 1.
3. Press Button 3, and select Exit Zoom to exit zoom.

Landmark SeisWorks/3D Tutorial
R2003.12.1 Performing Contouring: Edit the Fault Polygons 132
Edit the Fault Polygons
During the course of your interpretation, you may want to edit the fault polygons that appear on your map. You can edit fault polygons by using the polygon editing function. In this exercise, you will review some of the editing functions available.
To edit fault polygons:
1. Select Faults ➛ Edit Polygons from the Map View main menu. Or, click on the Edit Polygon icon.
This starts the Edit Polygons mode.
2. To select a fault polygon for editing, move the cursor over the fault polygon. When the cursor changes to a shape, press Button 1.
The polygon is selected when you can see the small circular “handles” over segment endpoints as shown below.
3. To edit a polygon, adjust the position of the polygon handles. You can add new handles to the polygon and reposition them, or reposition the existing handles.
• To add new handles to the polygon, place the cursor over a line segment in the position where you want to add a handle.
The cursor will assume the shape. Press Button 1 to insert a handle at this point.
Cursor Shapes
select polygon
over handle
over segment
handles
selected polygon cursor shape over polygon
Landmark SeisWorks/3D Tutorial
R2003.12.1 Performing Contouring: Edit the Fault Polygons 133
• To edit the position of an existing handle, position the cursor over the handle.
The cursor assumes the shape. While pressing Button 1, move the handle to the position you want, then release Button 1.
4. Extend the polygon slightly at both ends. Refer to the last paragraph on the previous page for an explanation of how to select and move a handle.
5. Repeat Steps 1-4 to extend the second polygon.
You may notice that some contours now draw through the polygons after you have edited them. The next step will remedy this problem.
6. With a fault polygon selected, press and hold Button 3 and highlight Delete Pts in Flt Polygon.
This dialog box opens.
Select the following:
• Delete shot lines• Insert points at polygon intersections• Delete points in ALL Fault polygons
7. Click on OK to close the Delete Points in Polygon dialog box.
8. Press Button 3 to bring up the Polygon Edit popup menu, then select Close Editing.
Delete Points in Polygon Dialog Box

Landmark SeisWorks/3D Tutorial
R2003.12.1 Performing Contouring: Regrid the Data 134
Regrid the Data
When you edit fault polygons, you need to regrid your data. Perform the following steps to regrid your greenhzn horizon
1. From the Map View window, click on the Map It! icon.
2. In the Map It! dialog box, turn off Convert Horizon To Map Points.
3. Under Fault Usage, select Use Existing Polygons. Click on Contour Parameters... to open the Computed Contour Parameters dialog box.
• Change the Interval to 20, then toggle offComputed Contour Annotation.
• Click on OK to close the Computed Contour Parameters dialog box.
4. Click on the Display Horizons icon, and select your greenhzn for display in the Map View Horizons dialog box. Then click on OK.
5. Click on OK in the Map It! dialog box.
Landmark SeisWorks/3D Tutorial
R2003.12.1 Performing Contouring: Regrid the Data 135
The data is regridded, and the contours are redrawn. Now, the fault polygons no longer have the contours going through them. Your map should look similar to the one below.

Landmark SeisWorks/3D Tutorial
R2003.12.1Performing Contouring: Convert Computed Contours to Manual & Annotate Manual Contours
Convert Computed Contours to Manual & Annotate Manual Contours
The default contour annotation may not be in the locations you prefer. The annotation feature for manual contours allows you to place annotation wherever you want on the manual contours. Generally, before you plot your contour maps you should convert your computed contours to manual contours so that you can use this annotation feature.
1. Select Contours ➛ Convert ➛ Computed to Manual in the Map View that is displaying the contours shown on the previous page.
The Convert Computed to Manual Contours dialog box opens.
2. Leave these values as they are, and click on OK.
3. Click on OK in the following information box.
4. Click on the Contents icon to open the Map View Contents dialog box, then select Manual Contours in the Mapping subpanel.
5. Click on OK to close the dialog box.
Convert Computed to Manual Contours Dialog Box
Landmark SeisWorks/3D Tutorial
R2003.12.1Performing Contouring: Convert Computed Contours to Manual & Annotate Manual Contours
6. Then, select Contours ➛ Annotate from the Map View menu bar.
The Map View enters the create/edit mode. As you move the cursor over a contour, it changes shape from the standard arrow cursor to this cursor: .
7. You may need to resize the contour. Select View ➛ Show Info from the Map View menu bar.
The scale of the Map View appears at the bottom of Map View.
8. Press Button 3 for the popup menu shown at left, and drag to Contour Text Size to open the Annotation Text Size dialog box.
The annotation is set in World Units.
9. Double-click in the text field, and enter 600. Click on OK.
10. Position the cursor over a contour. When it changes shape to a , double-click using Button 1 to add annotation.
To delete annotation, select the contour, then position the cursor over the annotation. The cursor assumes the following shape: .Press Button 2. The annotation text is deleted.
Annotated Text Size Dialog Box

Landmark SeisWorks/3D Tutorial
R2003.12.1Performing Contouring: Convert Computed Contours to Manual & Annotate Manual Contours
11. Repeat Step 10 to add annotation to your contour map. An example of a contoured and annotated map is shown below.
Continue to the Next Chapter
Now you will make a scaled hardcopy plot file of your map. Proceed to the next chapter on page 139.
Landmark SeisWorks/3D Tutorial
R2003.12.1 Index 143
SeisWorks/3D TutorialIndex
Numerics
24-bit color 37, 66
A
Apply Immediately button 103
Auto Tracking 88
B
basemap, display of 44
Bookmark File Open dialog box 115
Bookmark File Save As dialog box 114
Bookmark Parameters dialog box 116
bookmarks 110-117
Bookmarks dialog box 111
C
Color Control 66-70
contour interval and 131
Computed Contour Parameters dialog box127
contouring 120-138
annotation and 137-138
Computed Contour Parameters dialog box 127-128
computing and displaying of 129-130
converting to manual 136-138
grid parameters, selection of 125-126
input horizon, defining of 123
interval, changing of 131
mapping files, creation of 122-123
sampling parameters and 124-125
surface model type, selection of 125
Convert Computed to Manual Contours136
correlation, fault 94-97
Create Fault dialog box 96
Create Horizon dialog box 82
D
Delete Mode 87-88
Delete Points in Polygon dialog box 133
dialog boxes, illustrated
Bookmark File Open 115
Bookmark File Save As 114
Bookmark Parameters 116
Bookmarks 111
Computed Contour Parameters 127
Convert Computed to Manual Contours136
Create Fault 96
Create Horizon 82
Index

Landmark SeisWorks/3D Tutorial
R2003.12.1 Index 144
Delete Points in Polygon 133
Frame Control 71
Grid Parameters 125
Horizon Selection 83
Interpreters 22
Map It! 121
Map View Contents 46
Map View Scaled Plotting 140
Multiple Horizon Selection 81
New Mapping File 122
Oracle Restore Utility 13
Project Administration 12
Project Change 21
Project Create Node List 14
Project Restore 16
Project Selection 39
Project User Administration 18
Restore Colormap 68
Restore File 15
Restore Type 13
Sampling Parameters 124
Seismic Data Manager 24
Seismic Display Parameters 54
Seismic File Selection 55
Seismic Project Create 30
Seismic Time Selection 60
Seismic View Correlate 95
Select 3D Survey 31
Select Mapping File 122
Select OpenWorks Project 31
Select Seismic Section 103
F
fault heaves 99-101
fault polygons, editing of 132-133
faults
correlation of 94-97
creation of 95-96
in Perspective View 90
interpretation of 90-97
picking segments 91-97
Frame Control 71-73
dialog box illustrated 71
G
grid and navigation coordinates 26-29
Grid Parameters dialog box 125
H
hardcopy plot files 140-141
Horizon Selection dialog box 83
horizons
creation of 81-83
deletion of 87-88
interpretation of 80-89, 98
tracking modes and
Auto Tracking 88
Point 84-87
I
interpolation factors 63-64
interpreters 21-23
Interpreters dialog box 22
Landmark SeisWorks/2D Introduction
R2003.12.1 Index 145
M
magnify option 77-78
manual contours 136-138
Map It! dialog box 121
Map View
Contents dialog box illustrated 46
contents of 46-47
opening of 44
Show Position in 48
Map View Scaled Plotting dialog box 140
mapping files, creation of 122-123
Midpoint display option 56-61
Multiple Horizon Selection dialog box 81
N
navigation coordinates 28-29
New Mapping File dialog box 122
O
OpenWorks
interpreters 21-23
projects
granting access to 18-20
restoring of 12-17
setting of 21-23
seismic projects, creation of 30-32
surveys
creation of 24-25
Oracle Restore Utility dialog box 13
P
permission levels 19-20
Perspective View
faults in 90
Point mode 84-87
polygons, fault
editing of 132-133
Project Administration dialog box 12
Project Change dialog box 21
Project Create Node List dialog box 14
Project Restore dialog box 16
Project Selection dialog box 39
Project User Administration dialog box 18
projects, OpenWorks
granting access to 18-20
restoring of 12-17
setting of 21-23
R
Restore Colormap dialog box 68
Restore File dialog box 15
Restore Type dialog box 13
restoring projects 12-17
S
Sampling Parameters dialog box 124

Landmark SeisWorks/2D Introduction
R2003.12.1 Index 146
scaled hardcopy plot files 140-141
screen management 37
Seismic Data Manager
creating surveys and 24-25
dialog box illustrated 24
navigation coordinates and 28-29
Seismic Display Parameters dialog box 54
seismic display scales 63-64
seismic file selection 54-55
Seismic File Selection dialog box 55
Seismic Project Create dialog box 30,
30-32
seismic projects
creation of 30-32
data and directories 33
selection of 39
Seismic Time Selection dialog box 60
Seismic View
display
altering of 63-64
Midpoint option 56-61
parameters for 54-55
Select from List option 102-103
magnify option in 77-78
opening of 52-53
seismic file selection and 54-55
Show Position in 62
zooming of 74-76
Seismic View Correlate dialog box 95
SeisWorks/3D
starting of 37
Select 3D Survey dialog box 31
Select Mapping File dialog box 122
Select OpenWorks Project dialog box 31
Select Seismic Section dialog box 103
sessions
naming of 41
starting of 36, 40-41
Show Position 48, 62
surveys, creation of 24-25
T
tracking modes 84-87, 88
tutorial data
space requirements 8
U
user permission levels 19-20
Z
zoom option 74-76