sejerø appropriate assessment birds - naturstyrelsen · rogc-s-ra-000285 4 sejerø appropriate...
TRANSCRIPT

Rambøll A/S
Revised draft
May 2015
Sejerø Bugt Offshore Wind Farm
Appropriate Assessment
Birds
Natura 2000

rogc-s-ra-000285 4 sejerø appropriate assessment birds_19 may 2015_renset.docx / hsk /2014-03-17
This report has been prepared under the DHI Business Management System
certified by DNV to comply with ISO 9001 (Quality Management)
DHI • Agern Alle 5 • • DK-2970 Hørsholm • Denmark Telephone: +45 4516 9200 • Telefax: +45 4516 9292 • [email protected] • www.dhigroup.com
Sejerø Bugt Offshore Wind Farm
Appropriate Assessment
Birds
Natura 2000
Prepared for Rambøll A/S
Represented by Claus Fischer Jensen Illustration text
Arial 7 pt Italic RGB 0-65-101
Project manager Ramunas Zydelis
Authors Henrik Skov, Stefan Heinänen
Quality supervisor Maj Høigaard Holst
Project number 11814614-3
Approval date 19-05-2015
Revision Draft: 0.6
Classification Restricted

rogc-s-ra-000285 4 sejerø appropriate assessment birds_19 may 2015_renset.docx / Initials / yyyy-mm-dd

i
CONTENTS
1 Introduction ................................................................................................................. 5 1.1 Background .................................................................................................................................... 5 1.2 The framework for the appropriate assessment ............................................................................ 7
2 Site integrity ................................................................................................................ 8 2.1 Meaning of integrity of a European Site for waterbirds .................................................................. 8 2.2 Duration of effect required for an adverse effect on integrity ......................................................... 8 2.3 Adverse effect and detectability ..................................................................................................... 8 2.4 Conclusions: adverse effect on integrity ........................................................................................ 9
3 Project description .................................................................................................... 10 3.1 Offshore installations ................................................................................................................... 11
4 Designation Basis and Conservation Objectives for affected SPA ....................... 12 4.1 Sejerø Bugt og Nekselø (DK005X094) ........................................................................................ 12
5 Description of the Environment ............................................................................... 15 5.1 Physical aspects .......................................................................................................................... 15 5.2 Biological aspects ........................................................................................................................ 17
6 Description of Potential Effects ............................................................................... 22 6.1 Disturbance and habitat displacement ......................................................................................... 22 6.2 Loss and impairment of habitat .................................................................................................... 23 6.3 Collision mortality ......................................................................................................................... 24 6.4 Barrier effect ................................................................................................................................. 24 6.5 Cumulative impacts ...................................................................................................................... 25
7 Disturbance and habitat displacement .................................................................... 26 7.1 Methods ....................................................................................................................................... 26 7.1.1 Appropriate Assessment for Sejerø Bugt (DK005X094) ............................................................. 26 7.1.2 Waterbird distributions and abundance ....................................................................................... 27 7.1.3 Suitability classification and footprint creation ............................................................................. 27 7.1.4 Estimation of displacement and redistribution ............................................................................. 28 7.1.5 Estimation of density-dependent mortality ................................................................................... 30 7.1.6 Assessing population level impacts - Potential Biological Removal ............................................ 31
8 Results ....................................................................................................................... 33 8.1.1 Suitability and wind farm footprints .............................................................................................. 33 8.1.2 Displacement and redistribution analyses ................................................................................... 35 8.1.3 Density dependent mortality ........................................................................................................ 39 8.1.3.1 Sejerø Bugt og Nekselø (DK005X094) ........................................................................................ 41 8.1.4 Impact on long-term viability of affected populations in SPA ....................................................... 43
9 Loss and impairment of habitat ............................................................................... 44 9.1 Sejerø Bugt og Nekselø (DK005X094) ........................................................................................ 44
10 Collision mortality ..................................................................................................... 46 10.1 Collision risk of local birds ............................................................................................................ 46

ii rogc-s-ra-000285 4 sejerø appropriate assessment birds_19 may 2015_renset.docx / Initials / yyyy-mm-dd
10.2 Collision risk of long-distance migrants ....................................................................................... 47
11 Barrier effects ........................................................................................................... 48
12 Cumulative impacts .................................................................................................. 49 12.1 Regional ....................................................................................................................................... 49 12.2 Population wise ............................................................................................................................ 49
13 Effect on integrity of affected SPAs ........................................................................ 50 13.1 Sejerø Bugt og Nekselø (DK005X094) ........................................................................................ 50 13.1.1 Habitat loss .................................................................................................................................. 50 13.1.2 Collision risk and barrier effect .................................................................................................... 50 13.1.3 Habitat displacement ................................................................................................................... 50 13.1.4 Confidence of assessment .......................................................................................................... 50 13.1.5 Synthesis ..................................................................................................................................... 54
14 References ................................................................................................................ 56
Appendix A Maps presenting predicted densities and standard errors ................................. 61
FIGURES
Figure 1.1 Planned position of Sejerø Bugt OWF together with Sæby and Smålandsfarvandet OWF. ......... 5 Figure 1.2 SPAs within the vicinity of the planned Sejerø Bugt OWF. ........................................................... 6 Figure 3.1 Planned position of Sejerø Bugt OWF with indication of cable corridors. ................................... 10 Figure 5.1 Extension of the study area for the Appropriate Assessment. .................................................... 15 Figure 5.2 Seabed sediments of Sejerø Bugt (GEUS 2015). ....................................................................... 16 Figure 5.3 Current speed (m/s) in Sejerø Bugt and surroundings. Data presented in quantiles. ................. 17 Figure 5.4 Index for filter-feeding bivalves (from Skov et al. 2012b) ............................................................ 18 Figure 7.1 Methodological framework for assessment of density-dependent mortality in SPA and
population-level effects of displacement. ..................................................................................... 27 Figure 7.2 Schematic presentation of the GIS model used for the displacement calculations ..................... 29 Figure 8.1 The predicted densities (right) for Common Eider were classified into four suitability
classes, (percentiles) <25%, 25-75%, 75-90% and >90% (left). The best and worst-case
footprints, and 2 km and 3 km buffers are shown. ....................................................................... 33 Figure 8.2 The predicted densities (right) for Common Scoter were classified into four suitability
classes, (percentiles) <25%, 25-75%, 75-90% and >90% (left). The best and worst-case
footprints, and 2 km and 3 km buffers are shown. ....................................................................... 34 Figure 8.3 The predicted densities (right) for Velvet Scoter were classified into four suitability
classes, (percentiles) <25%, 25-75%, 75-90% and >90% (left). The best and worst-case
footprints, and 2 km and 3 km buffers are shown. ....................................................................... 34 Figure 8.4 Species-specific suitability values were combined into a weighted index defining the most
suitable areas for all thee sea duck species. Index values and resulting best and worst-
case footprints are shown. ........................................................................................................... 35
TABLES
Table 3.1 Turbine size and expected dimensions ....................................................................................... 11 Table 4.1 Designation basis for SPA Sejerø Bugt og Nekselø (DK005X094), with a column showing
whether a species was registered in Sejerø Bugt OWF area during bird surveys
conducted in 2004-2014. Shaded fields indicate landbird of strictly coastal species, which

iii
are irrelevant for the appropriate assessment of the offshore wind farm. Y=breeding,
T=migratory birds of international significance. ........................................................................... 12 Table 4.2 Bird species on the designation basis for SPA Sejerø Bugt og Nekselø (DK005X094),
which are relevant for the impact assessment of the offshore wind farm, excluding
landbirds of strictly coastal species. The table indicate conservation status and criteria for
selection of species for SPA and the abundance of the species in 1983
(http://www2.nst.dk/Download/Natura2000/154_basisanalyse_komp.pdf). ................................ 14 Table 5.1 Fish species likely to be present in the project area. The table is based on logbook data
from ICES square 40G0 and 40G1 supported by additional information from local fisher-
men /6/. Grey markings indicate that the local fishermen are catching the species in the
project area or in its vicinities. From Rambøll 2014b. .................................................................. 18 Table 5.2 Estimated densities (ind/km2) and total numbers of dominant waterbird species within
Sejerø Bugt OWF and 3 km buffer around the wind farm area. Size of bio-geographic
populations is provided in the species column. Species on the designation basis is
marked in bold.............................................................................................................................. 19 Table 6.1 Reported response of waterbirds on the designation basis to shipping (Bellebaum et al.
2006, Schwemmer et al. 2011 and own observations). ............................................................... 23 Table 8.1 Abundance of Common Eiders in the whole study area, SPA, buffer and wind farm
footprint. The number of birds displaced 75% from the footprint and 50% from the 2 km
buffer zone is indicated for each suitability class. ........................................................................ 35 Table 8.2 The abundance of Common Eider in the study area in each suitability class when
excluding the footprint and buffer zone and the abundance when further adding the
displaced birds in the same area. The last column indicates the proportional increase in
the area, which is used for calculating the increase in the SPA only as well. ............................. 36 Table 8.3 Abundance of Common Scoters in the whole study area, SPA, buffer and wind farm
footprint. The number of birds displaced 75% from the footprint and 50% from the 3 km
buffer zone is indicated for each suitability class. ........................................................................ 37 Table 8.4 The abundance of Common Scoter in the study area in each suitability class when
excluding the footprint and buffer zone and the abundance when further adding the
displaced birds in the same area. The last column indicates the proportional increase in
the area, which is used for calculating the increase in the SPA only as well. ............................. 37 Table 8.5 Abundance of Velvet Scoters in the whole study area, SPA, buffer and wind farm
footprint. The number of birds displaced 75% from the footprint and 50% from the 3 km
buffer zone is indicated for each suitability class. ........................................................................ 38 Table 8.6 The abundance of Velvet Scoter in the study area in each suitability class when excluding
the footprint and buffer zone and the abundance when further adding the displaced birds
in the same area. The last column indicates the proportional increase in the area, which is
used for calculating the increase in the SPA only as well. .......................................................... 38 Table 8.7 The density dependent mortality for Common Eider (assuming a 2.5% increase in
mortality per 1% increase in abundance) in the study area (after adding the displaced
birds from the footprint and buffer). The baseline mortality is the natural mortality. The
difference between the baseline mortality and the mortality induced by the displacement is
indicated in the last column. ......................................................................................................... 39 Table 8.8 The density dependent mortality for Common Scoter (assuming a 2.5% increase in
mortality per 1% increase in abundance) in the study area (after adding the displaced
birds from the footprint and buffer). The baseline mortality is the natural mortality. The
difference between the baseline mortality and the mortality induced by the displacement is
indicated in the last column. ......................................................................................................... 40 Table 8.9 The density dependent mortality for Velvet Scoter (assuming a 2.5% increase in mortality
per 1% increase in abundance) in the study area (after adding the displaced birds from
the footprint and buffer). The baseline mortality is the natural mortality. The difference
between the baseline mortality and the mortality induced by the displacement is indicated
in the last column. ........................................................................................................................ 40 Table 8.10 The density dependent mortality for Common Eider (assuming a 2.5% increase in
mortality per 1% increase in abundance) in the SPA (after adding the displaced birds from
the footprint and buffer). The base line mortality is the natural mortality. The difference

iv rogc-s-ra-000285 4 sejerø appropriate assessment birds_19 may 2015_renset.docx / Initials / yyyy-mm-dd
between the baseline mortality and the mortality induced by the displacement is indicated
in the last column. ........................................................................................................................ 41 Table 8.11 The density dependent mortality for Common Scoter (assuming a 2.5% increase in
mortality per 1% increase in abundance) in the SPA (after adding the displaced birds from
the footprint and buffer). The baseline mortality is the natural mortality. The difference
between the baseline mortality and the mortality induced by the displacement is indicated
in the last column ......................................................................................................................... 42 Table 8.12 The density dependent mortality for Velvet Scoter (assuming a 2.5% increase in mortality
per 1% increase in abundance) in the SPA (after adding the displaced birds from the
footprint and buffer). The base line mortality is the natural mortality. The difference
between the baseline mortality and the mortality induced by the displacement is indicated
in the last column ......................................................................................................................... 42 Table 8.13 Calculated Potential Biological Removal (PBR) levels for the three seaduck species,
which The table presents key parameters: size of relevant population, minimum
population size, maximum annual population growth rate λmax, and recovery factor f. ............... 43 Table 8.14 Summary table of the assumed density dependent mortality from selected planned and
operational wind farms. The mortality at “other wind farms” was assumed to be the same
as the rate between displaced birds and increase in density dependent mortality as in
Smålandsfarvandet OWF. .......................................................................................................... 44 Table 10.1 Estimated potential annual collisions for seaducks in the wind farm area. Estimations are
shown for the two wind turbine design variants and four different theoretical avoidance
rates. An assumed uncertainty of ±67% should be coupled to each collision estimate,
Zydelis & Heinänen 2014a. .......................................................................................................... 46

Introduction
5
1 Introduction
The present report covers an Appropriate Assessment for Sejerø Bugt Offshore Wind Farm
(OWF) in relation to birds and the EC Special Protection Area (SPA) Sejerø Bugt og Nekselø
(DK005X094).
1.1 Background
The wind farm is part of the political agreement concerning construction of a series of nearshore
wind farms of 22 March 2012, of which Sejerø Bugt OWF is one.
The project area for the Sejerø Bugt OWF is located offshore between Sejerø and Røsnæs
(Figure 1.1) in the western part of Sejerø Bugt. The size of the built area is 44 km2
approximately 4 km north of the coast of Røsnæs, The wind farm is set to have an upper
capacity of 200 MW and will be installed by 2020. All phases of the wind farm lifecycle –
construction, operation and decommissioning - involve activities that could affect birds.
Figure 1.1 Planned position of Sejerø Bugt OWF together with Sæby and Smålandsfarvandet OWF.
Two marine Natura 2000 (SPA) sites designated for the protection of birds are located within the
Sejerø Bugt or its vicinity: SPA 94 Sejerø Bugt og Nekselø (DK005X094) and SPA 31 Stavns
Fjord (DK00DX031), see Figure 1.2.

6 rogc-s-ra-000285 4 sejerø appropriate assessment birds_19 may 2015_renset.docx / hsk / 2014-03-17
Figure 1.2 SPAs within the vicinity of the planned Sejerø Bugt OWF.
The conclusion of the screening process, which has been a part of the environmental impact
assessment (Zydelis & Heinänen 2014a) was that a significant impact could be ruled out for the
SPA Stavns Fjord.
For Sejerø Bugt og Nekselø (DK005X094) SPA it was decided to undertake an appropriate
assessment (AA) due to predicted large impacts on staging Common Eiders, Common Scoters
and Velvet Scoters listed on the designation basis. The SPA 94 is a part of the Natura 2000 site
154, Sejerø Bugt, Saltbæk Vig, Bjergene og Bollinge Bakke. The borders of the SPA are
identical to the borders of the Ramsar area 18 Sejrø Bugt, Nekselø Bugt og Saltbæk Vig.
The baseline description and the impacts of the Sejerø Bugt OWF project on birds were
assessed in the EIA (Zydelis & Heinänen 2014a). The major part of this region, shallower than
20 m houses concentrations of international importance to Common Scoter Melanitta nigra,
Velvet Scoter Melanitta fusca, Common Eider Somateria mollissima, Red-throated and Black-
throated Diver Gavia stellata/arctica and Red-necked Grebe Podiceps grisegena, of which the
first three species are on the designation basis for SPA 94 (DK005X094).
Obviously, habitat displacement of waterbirds due to the wind farm and associated vessel traffic
was the focus point of the baseline investigation and impact assessment. The assessment,
which also included a Natura 2000 screening, concluded that it cannot be precluded that the
displacement impact could have a significant effect on the conservation status of the three
seaduck species forming the basis for the designation of SPA 94. Thus, the potential for an
adverse effect on the integrity of the SPA arising from Sejerø Bugt OWF could not be
discounted. For this reason, the Danish authorities have decided to carry out an appropriate
assessment in relation to the SPA 94 (DK005X094).

Introduction
7
1.2 The framework for the appropriate assessment
Natura 2000 is the term for a network of protected areas in the European Union. The network
includes protected areas designated under the EU Habitats Directive1, the Special Areas of
Conservation (SAC), and the EC Birds Directive2, the Special Areas of Protection (SPA).
The goal of the Birds Directive is to protect, manage and regulate all wild bird species naturally
living within the European territory of the Member States, including the eggs of these birds, their
nests and their habitats. Specifically, the SPAs are strictly protected sites, classified in
accordance with Article 4 of the Directive, designated to protect wild birds listed in Annex I of the
Directive (breeding birds) and regularly occurring migratory species. In Denmark, 113 SPAs
have been designated.
The aim of the Natura 2000 network is to ensure favourable conservation status for the
designation basis of the area. The Habitats Directive includes regulations for both the habitat
sites and the bird protection sites (the SPAs). The Habitats Directive Article 6 states:
“3. Any plan or project not directly connected with or necessary to the management of the site
but likely to have a significant effect thereon, either individually or in combination with other
plans or projects, shall be subject to appropriate assessment of its implications for the site in
view of the site’s conservation objectives.
The general assessment of the requirements of Article 6 is a step-by-step approach which
contains the following four elements:
1. Screening
2. Appropriate Assessment
3. Assessment of alternative solution
4. Assessment of compensatory measures
This report contains step two of the process. The screening of the potential significant impact of
the SPAs has been done in connection with the EIA for the project (Zydelis & Heinänen 2014a).
1 Council Directive 92/43/EEC of 21 May 1992 on the conservation of natural habitats and of wild fauna and flora.
2 Directive 2009/147/EC. Directive of 30 November 2009 on the conservation of wild birds.

8 rogc-s-ra-000285 4 sejerø appropriate assessment birds_19 may 2015_renset.docx / hsk / 2014-03-17
2 Site integrity
In determining whether the proposed Sejerø wind farm will adversely affect the integrity of
DK005X094, the Danish authorities will consider:
• The meaning of integrity of a European SPA site; and
• The definition of ‘adverse effect’ with respect to the integrity of the SPA, both in terms of the
scale of effect and the duration of effect.
2.1 Meaning of integrity of a European Site for waterbirds
There is currently no legal definition of the term ‘integrity’ in either the Danish Habitats
Regulations or the EU Directive. Policy Statement 9 provides a useful definition of the term
‘integrity of the site’:
‘the coherence of the site’s ecological structure and function, across its whole area, or the
habitats, complex of habitats and/or populations of species for which the site is or will be
classified’.
The guidance document Managing Natura 2000 Sites (EC 2000) emphasises the conservation
objectives of a site as the basis for defining adverse effect:
‘The integrity of the site involves its ecological functions. The decision as to whether it is
adversely affected should focus on and be limited to the site’s conservation objectives’.
2.2 Duration of effect required for an adverse effect on integrity
The Habitats Directive emphasises the ‘long term’ maintenance of species and habitats. Long-
term, in this context, is taken to mean a period of at least five years. This is considered to be an
appropriate timescale for the assessment of adverse effect on integrity for the following reasons:
• Sites are usually designated on the basis of multiple years of waterbird population
estimates. This approach is used because it is considered to take account of sufficient data
to demonstrate that waterbirds use sites regularly, smoothing out any short term peaks and
troughs in numbers. Using the same argument, it is therefore logical to continue to review
populations over the same time scale to demonstrate that observed use or ‘non-use’ of
habitat is typical, and not a chance event; and
• Bird breeding performance and productivity varies between species and between years,
and many species have long life spans. Population dynamics data therefore need to take
into account the possible short-term fluctuations in the numbers of any species.
2.3 Adverse effect and detectability
The assessment of adverse effect on integrity is necessarily addressed in the light on the site’s
conservation objectives. An adverse effect would be one, which caused a detectable reduction
in the species and/or habitats for which a site was designated, at the scale of the site rather than
at the scale of the location of the impact. Where a conservation objective relates directly to a
habitat, loss can be readily measured in terms of area. Where a site is designated for the
species that it supports, the assessment becomes more complex.

Site integrity
9
The DK005X094 SPA is designated for the important overwintering population of seaducks.
These populations vary from year to year according to widely changeable natural influences
including breeding success and weather conditions experienced during migration. Any observed
fluctuations in the populations due to this type of influence will be difficult to separate from the
potential influence of a plan or project such as Sejerø Bugt OWF. As for the AA, it is advised
that key consideration be given to the extent to which the development will adversely affect the
amount of suitable habitat available to support the SPA seaduck populations. This approach
mirrors that of maintaining favourable conservation status given in the Habitats Directive. This is
a habitat-based approach: providing that the habitat supporting the species, for which the site
was designated, is maintained and remains capable of supporting the populations at target
levels, then favourable conditions for these species are maintained.
2.4 Conclusions: adverse effect on integrity
For assessing whether the proposed Sejerø Bugt OWF development is likely to have an adverse
effect on the DK005X094 SPA, it is advised that:
• In accordance with the Habitats Directive, the integrity of the SPA should be assessed
against the long term impacts of the development, best considered as those that will occur
for a minimum period of five years; and
• In the absence of habitat criteria defining the coherence of the ecological structure and
function of DK005X094, the assessment of whether the proposed development will cause
adverse effects on the SPA will be based on an evaluation of the degree to which the
conservation objectives, i.e. the target populations of seaducks within the SPA will be
affected.
10 rogc-s-ra-000285 4 sejerø appropriate assessment birds_19 may 2015_renset.docx / hsk / 2014-03-17
3 Project description
The Sejerø Bugt OWF project comprises the wind farm with its individual turbines, inter array
power cables (between the turbines) and the export cable(s) connecting the OWF to the
electricity grid onshore. The onshore project will require an extension of the electricity grid with
underground cables, a possible electricity substation close to the coast and subsequent
connections to one of the existing substations at Røsnæs, Novo Syd or at Asnæs Power
Station. Onshore activities will not impact Special Protection Areas.
The project includes all plants and installations on and offshore that are necessary for the
connection of the OWF to the Danish national grid. The study area is defined as:
• Study area for wind turbines
• Cable corridor on land and at sea
• Cable stations on land
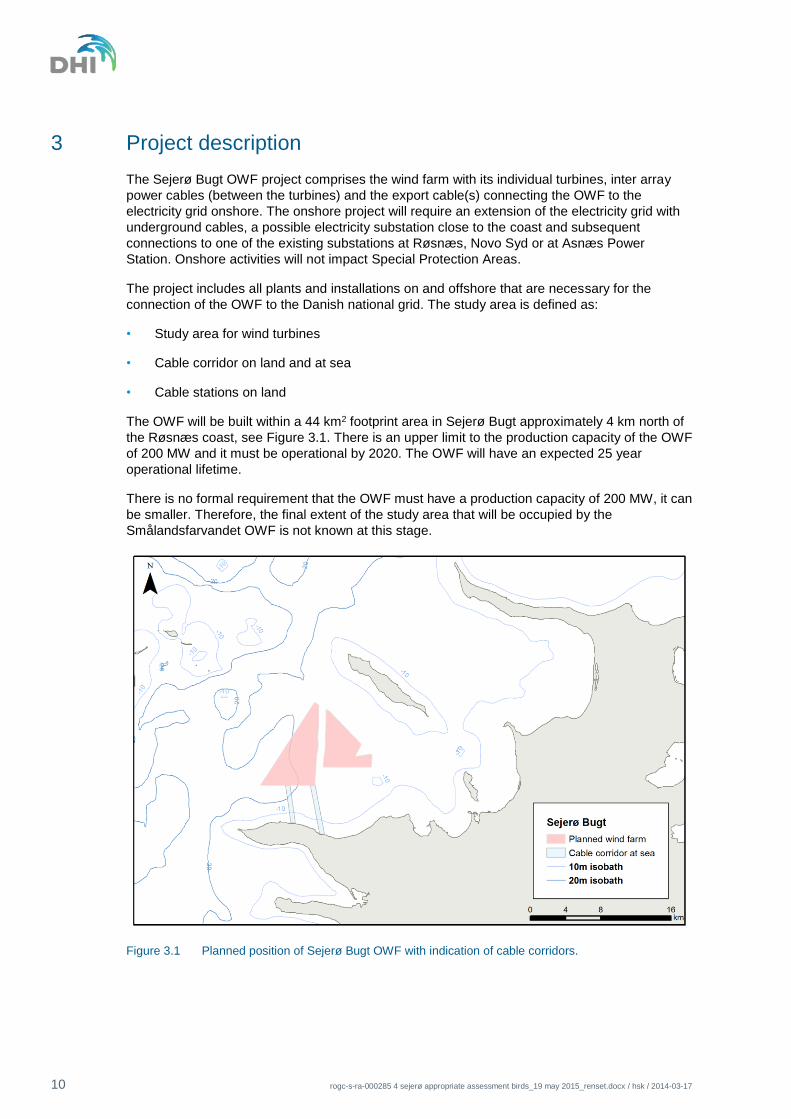
The OWF will be built within a 44 km2 footprint area in Sejerø Bugt approximately 4 km north of
the Røsnæs coast, see Figure 3.1. There is an upper limit to the production capacity of the OWF
of 200 MW and it must be operational by 2020. The OWF will have an expected 25 year
operational lifetime.
There is no formal requirement that the OWF must have a production capacity of 200 MW, it can
be smaller. Therefore, the final extent of the study area that will be occupied by the
Smålandsfarvandet OWF is not known at this stage.
Figure 3.1 Planned position of Sejerø Bugt OWF with indication of cable corridors.

Project description
11
3.1 Offshore installations
The concession will be awarded in 2016, after which detailed design, final location and
construction works will be initiated.
The turbine type or size that will be installed is not currently known. There are a number of
different solutions available, including having many small turbines e.g. up to 67 units of 3 MW
turbines or alternatively, fewer larger turbines with the same total output e.g. 20 units of 10 MW
turbines. Turbine sizes in between are also a possibility.
The dimensions of the turbines are expected to span between a 3 MW turbine and a 10 MW
turbine. Examples of turbines of this size are presented in Table 3.1. It should be noted that
minor differences might occur depending on the manufacturer chosen.
Table 3.1 Turbine size and expected dimensions
Turbine size Rotor diameter Total height Nacelle height
3 MW 112 m 137 m 81 m
10 MW 190 m 220 m 125 m

12 rogc-s-ra-000285 4 sejerø appropriate assessment birds_19 may 2015_renset.docx / hsk / 2014-03-17
4 Designation Basis and Conservation Objectives for affected SPA
4.1 Sejerø Bugt og Nekselø (DK005X094)
SPA 94 is located to the east of the Sejerø Bugt OWF with the shortest distance of 1.5 km
between the nearest boundaries of these areas (Figure 1.2). For area description, please
consult section 5. The SPA has been designated for protection of several breeding coastal
species and terns and non-breeding seaducks (Table 4.1).
Of the designated species for the SPA, three seaducks (Common Eider, Common Scoter and
Velvet Scoter) were registered in the planned wind farm site. Neither of the tern species nor
Greater Scaup were recorded during the dedicated baseline and NOVANA surveys in the
planned wind farm area (see section 5.2).
Table 4.1 Designation basis for SPA Sejerø Bugt og Nekselø (DK005X094), with a column showing whether a species was registered in Sejerø Bugt OWF area during bird surveys conducted in 2004-2014. Shaded fields indicate landbird of strictly coastal species, which are irrelevant for the appropriate assessment of the offshore wind farm. Y=breeding, T=migratory birds of international significance.
Species name English Species name Latin Breeding Staging Recorded in
Sejerø Bugt
OWF
Western Marsh Harrier Circys aeroginosus Y
Corncrake Crex crex Y
Avocet Recurvirostra avosetta Y
Sandwich Tern Sterna sandvicensis Y
Arctic Tern Sterna paradisea Y
Greater Scaup Aythya marila T
Common Eider Somateria mollissima T X
Common Scoter Melanitta nigra T X
Velvet Scoter Melanitta fusca T X
Species description The Sejerø Bugt OWF will not impact strictly coastal species such as Western Marsh Harrier,
Corncrake and Avocet by habitat loss, impairment, displacement. Collision risk and barrier effect
risk is assessed in section 10 and 11.
Sandwich Tern breeds within or close to colonies of Black-headed Gull on uninhabited small
islets with low vegetation. Sandwich terns forage on small fish as sprat, sandeel and herring.
Sandwich Tern is a relatively common species in Danish waters, though the breeding sites are
restricted to few localities (Pihl et al. 2013). Breeding Sandwich Terns are associated with
coastal areas and will not be impacted by the Sejerø Bugt OWF by habitat loss, impairment,
displacement. Collision risk and barrier effect risk is assessed in section 10 and 11.
Arctic Tern are migratory birds, which arrive to Denmark to breed late April and fly back to the
Antarctic in August. They breed on uninhabited small islets with sparse vegetation. The species
is relatively common in Denmark. The food consists of small fish and crustaceans. Breeding

Designation Basis and Conservation Objectives for affected SPA
13
species such as Arctic Terns are associated with coastal areas and will not be impacted by the
Sejerø Bugt OWF by habitat loss, impairment, displacement. Collision risk and barrier effect risk
is assessed in section 10 and 11.
Greater Scaup has not been observed in the area during the baseline investigations, but is still
listed on the designation basis for the area. The birds apparently rest during the day and forage
during the night. The species has a diverse diet and lives on bivalves, insects and small fish and
fish fry, crustaceans and benthic flora. Greater Scaup is associated with areas having a water
depths lower than eight meters (Skov et al. 2011) and the OWF is hence not likely to have any
impact on the species due to habitat loss, impairment or displacement. Collision risk and barrier
effect risk is assessed in section 10 and 11.
Common Eider occurs in shallow marine waters. Its presence in the area is explained by water
depths around 7 m, closeness to land on gentle slopes with intermediate current speed, together
with relatively low ship traffic (Zydelis & Heinänen 2014a). Common Eider feed on bivalves,
chiefly blue mussels (Mytilus edulis), of which they can consume considerable amounts. Eiders
can dive down to 20 m, but prefer more shallow areas.
The size of the flyway population is estimated at 976,000 individuals (Wetlands International
2014). Most of the birds wintering in Danish waters breed in the Swedish-Finish archipelago in
the Northern Baltic Sea. Some Common Eiders also breed in Denmark and in the Netherlands.
The majority of the wintering population is concentrated in the western Baltic Sea (Durinck et al.
1994, Skov et al. 2011, BirdLife International 2014).
Common Scoter is present in very high numbers in Sejerø Bugt and was the species with the
highest abundance recorded in the surveyed area during the spring period and it was the
second most abundant species, after Common Eiders, during the wintering period. The
presence of Common Scoter in Sejerø Bugt is explained by water depths below 10 m, preferably
about 5 km offshore in areas with flat bottom and lower current speed (Zydelis & Heinänen
2014a). Common Scoter is a benthic feeding species, specialised on feeding on infaunal and
epifaunal bivalves (Fox 2003).
Size of the flyway population is estimated at 550,000 individuals (Wetlands International 2014).
The Common Scoter is a migratory species breeding in northern boreal forests and the Arctic
tundra and wintering in the temperate climate zone. The Western Palearctic population breeds
in the Scandinavian Peninsula, Finland and Russian Arctic until and including Taymyr peninsula.
Some birds (if not all) breeding in Iceland migrate to Europe as well. Common Scoters winter in
coastal waters and shallow offshore banks of the Baltic Sea, North Sea and northeast Atlantic,
the majority of wintering population being concentrated in the western Baltic Sea (Durinck et al.
1994, Skov et al. 2011, BirdLife International 2014).
Velvet Scoter is listed as Endangered in the IUCN Red List (IUCN 2013), due to a recently
reported dramatic decline of the biogeographic population of the species (Skov et al. 2011). It is
not listed as protected species in the Danish red list. The probability of presence in the Sejerø
Bugt OWF area is explained by water depths below 15 m, preferably about 8 km offshore on flat
bottoms with lower current speed (Zydelis & Heinänen 2014a). The Velvet Scoter is a benthic
feeding species specialised in feeding on infaunal bivalves (Fox 2003).
Size of the flyway population is estimated at 450,000 individuals (Wetlands International 2014),
of which about 373,000 spend their winter in the Baltic Sea (Skov et al. 2011). Velvet Scoter is a
migratory species breeding in boreal forests and wooded Arctic tundra and migrates to the
temperate climate zone for the wintering period. The Western Palearctic population breeds in
the Scandinavian Peninsula, Finland, Estonia and western Siberia to the River Yenisey. Velvet
Scoters winter in coastal waters and shallow offshore banks of the Baltic Sea, North Sea and
northeast Atlantic, the majority of wintering population being concentrated in the Baltic Sea
(Durinck et al. 1994, BirdLife International 2014).

14 rogc-s-ra-000285 4 sejerø appropriate assessment birds_19 may 2015_renset.docx / hsk / 2014-03-17
Conservation status and objectives The designation basis for this SPA is based on the following abundance of staging seaducks
recorded in 1983, see Table 4.2
(http://www2.nst.dk/Download/Natura2000/154_basisanalyse_komp.pdf). More recently updated
standard data form lists somewhat different maximum numbers of these species, see also Table
4.2 (http://natura2000.eea.europa.eu/Natura2000/SDF.aspx?site=DK005X094). For the
estimated species mean densities based on model predictions, see Table 5.2.
Table 4.2 Bird species on the designation basis for SPA Sejerø Bugt og Nekselø (DK005X094), which are relevant for the impact assessment of the offshore wind farm, excluding landbirds of strictly coastal species. The table indicate conservation status and criteria for selection of species for SPA and the abundance of the species in 1983 (http://www2.nst.dk/Download/Natura2000/154_basisanalyse_komp.pdf).
Species name
English
Species name
Latin
Conservation
status of bird
habitat*
Criteria for
selection
Abundance
(1983)
Abundance*
(SDF-update
2012)
Sandwich Tern Sterna
sandvicensis
Excellent F1 - 685 pairs
Arctic Tern Sterna paradisea Good F1 20-30 pairs 45 pairs
Greater Scaup Aythya marila Good F4 4,000 1,000
Common Eider Somateria
mollissima
Average-
reduced
F4 37,000 12,400
Common Scoter Melanitta nigra Average-
reduced
F4 15,000 15,517
Velvet Scoter Melanitta fusca Average-
reduced
F4 12,000 2,460
*Based on information in Standard Data Form (SDF).
The Danish criteria for selection of species on the designation basis in SPAs relevant for this
appropriate Assessment.
• F4: The species is regularly reoccurring in international significant numbers, i.e. the species
occurs in the area with 1% or more of the total population within its migratory route.
In the Natura 2000 plan (Naturstyrelsen 2011), the conservation status of the bird habitats,
which are important for the designation basis, is unknown due to limited available information. In
the Standard data form the conservation status for the bird habitats are as indicated in Table
4.1.
The overall conservation objective for Sejerø Bugt as a habitat for the designated bird species is
to attain favourable conservation status. As a system for site assessment for bird habitats has
not yet been developed in Denmark, the identification and decision of the conservation objective
for each species has been based on an assessment of size and quality of the habitat, which can
sustain the population, and not the actual presence of the population. For species, this means
that the habitat must form the basis for a breeding population / number of staging birds, as a
minimum equivalent to the conditions at the Danish entry of the Directive (1983) or to a higher
level, reflecting the carrying capacity of the habitat. This means that the condition and the total
area of the habitat for staging birds must be stable or increasing, and that the populations of
staging / foraging birds as a minimum must equal the population size at entry of the Directive
(1983) or a higher population level that have since reflected habitat carrying capacity.

Description of the Environment
15
5 Description of the Environment
Sejerø Bugt is located in the southern part of Kattegat and is an enclosed coastal system with
reefs and sandbanks. The total extent of Sejerø Bugt is 812 km2 and includes a total water
volume of 9,700 mio. m3. The total catchment area for Sejerø Bugt is 312 km2. Circulation
currents are the main determinant of the water exchange in the bay. The area of the SPA site
covers approximately 404 km2.
For the study area of the bird surveys (Zydelis & Heinänen 2014a) and hence the study area,
which will be included in the AA the area extents north of the Sejerø Bugt and includes all major
seaduck habitats, Figure 5.1. The area covers 1,406 km2.
Figure 5.1 Extension of the study area for the Appropriate Assessment.
The combination of relatively shallow waters, areas with boulder reefs and high abundances of
flora and fauna makes Sejerø Bugt biologically important for birds, fish and marine mammals.
5.1 Physical aspects
Water depth The maximal water depth in Sejerø Bugt is approximately 25 m, and the water depth is between
8 and 22 m in the wind farm area. Most if the Sejerø Bugt and all of the SPA has water depths
shallower than 20 m. In the northern and western part of the study area, the water depth > 20 m
(Figure 5.1).
Shallow areas of less than 20 m contain the largest concentrations of seaducks, due to the
limited diving capacity of seaducks and the high productivity of these areas.
Seabed The seabed sediments in Sejerø Bugt consist of sand and muddy sand with areas of glacial till,
which is also characteristic for the seabed within the wind farm area (Figure 5.2). The till areas

16 rogc-s-ra-000285 4 sejerø appropriate assessment birds_19 may 2015_renset.docx / hsk / 2014-03-17
in the bay include 2-3 larger reef areas (Sejerø NV, Sejerø SE and Røsnæs Rev) and a number
of smaller reef areas located especially around Nekselø and Ordrup Næs (Rambøll 2014a).
Areas with hard substrate provide good conditions for growth of blue mussels, which form the
most important food source for Common Eiders (Madsen 1954). During the baseline
investigations, many Common Eiders were observed in areas around the reefs (Zydelis &
Heinänen 2014a). Less than four km2 of hard substrate is found within the wind farm area
(Rambøll 2014a).
Figure 5.2 Seabed sediments of Sejerø Bugt (GEUS 2015).
Hydrodynamics and water quality The waters west of Sejerø forms the transition between the southern Kattegat and the Great
Belt and the hydrography is strongly influenced by these waters; during periods of outgoing
water flow from the Baltic Sea the surface salinity resembles the salinity in the Great Belt, in
periods of westerly winds while the salinity reflects the conditions in the Southern Kattegat. The
salinity is on average 17.5 ppm in the surface layer and on average 30 ppm in the bottom layer.
The bottom current speed in the inner part of Sejerø Bugt (and in the SPA) is below 0.1 m/s
(Figure 5.3). Only at the south-eastern part of Sejerø is the current speed higher than 0.1 m/s.
The current speed in Samsø Belt is up to 0.34 m/s.

Description of the Environment
17
Figure 5.3 Current speed (m/s) in Sejerø Bugt and surroundings. Data presented in quantiles.
5.2 Biological aspects
In connections with the environmental impact assessment (EIA) for the project, Rambøll and
DHI have prepared a number of background reports describing the surrounding environment.
Following sections describe the biological environment, which can have relevance in
connections with birds (Rambøll 2014a,b; Zydelis & Heinänen 2014a).
Benthic flora and fauna Sejerø Bugt, especially in the south-western part of the bay contains several areas with reefs
and boulders, which have species rich epifauna communities with gastropods, bivalves,
polychaetes etc., and local presence of dense blue mussels banks (Bio-consult 2000, Rambøll
2014a). The soft-bottom infaunal macrofauna in Sejerø Bugt is characterised by an Abra
community (Rambøll 2014a), a fjord community, where species are dominated by the bivalve
Abra alba and other bivalves; such as Corbula gibba, Spisula subtruncata, Arctica islandica and
Mytilus edulis and polychaetes.
In general the filter feeding organisms (bivalves) serve as a food source for seaducks. In
connections with the MOPODECO (Modelling of the Potential coverage of habitat-forming
species and Development of tools to evaluate the Conservation status of the marine Annex I
habitats) project (Skov et al. 2012b) a map of potential growth of blue mussels in the Baltic Sea
was produced. The map which depicts index values ranging from 0 to 1 show that, especially
the areas around Sejerø, Sjællands Odde and Røsnæs are habitats, which supports the filtrating
species, Figure 5.4. The OWF area is indexed as having low-medium potential for filter-feeding
bivalves.
The presence of many epi- and infaunal benthic species supports the area as a suitable habitat
for seaducks as Common Eider (eats primarily M. edulis), Common Scoter (specialised in eating
infaunal bivalves, C. gibba, S. subtruncata, A. islandica and epifaunal bivalves such as M.
edulis), Velvet Scoter (specialised in eating infaunal – C. gibba, S. subtruncata, A. islandica).

18 rogc-s-ra-000285 4 sejerø appropriate assessment birds_19 may 2015_renset.docx / hsk / 2014-03-17
Figure 5.4 Index for filter-feeding bivalves (from Skov et al. 2012b)
At hard bottom substrates, the flora is relatively rich, dominated by annual red and brown algae.
In soft bottom areas, the macroalgae vegetation is sparse due to lack of substrates suitable for
attachment. In general, the density of eelgrass (Zostera marina) is limited (Rambøll 2014a).
Fish Based on the habitat types in Sejerø Bugt and the high density of infauna species the project
area is able to support a variety of fish species. Coastal areas often functions as a nursery area
for juvenile fish and so it seems very likely that that the project area and its surroundings
functions as a nursery area for juvenile fish.
Based on fishery statistics following species presented in Table 5.1 are likely to be present in
the area. Of the bird species on the designation basis only small pelagic species like herring,
sprat, sandeel and juveniles are relevant. Sandeel are not present in the area. Herring and sprat
are not caught by fishermen and the general fish abundance in the area is expected to be
limited (Rambøll 2014b).
Table 5.1 Fish species likely to be present in the project area. The table is based on logbook data from ICES square 40G0 and 40G1 supported by additional information from local fisher-men /6/. Grey markings indicate that the local fishermen are catching the species in the project area or in its vicinities. From Rambøll 2014b.
Species
Brill (Scophthalmus rhombus) Mackerel (Scomber scombrus)
Cod (Gadus morhua) Norway lobster (Nephrops norvegicus)
Dab (Limanda limanda) Pollack (Pollachius pollachius)
Eel (Anguilla anguilla) Saithe (Pollachius virens)

Description of the Environment
19
Plaice (Pleuronectes platessa) Salmon (Salmo salar)
Flounder (Platichthys flesus) Sea trout (Salmo trutta trutta)
Garfish (Belone belone) Short-spined sea scorpion (Myoxocephalus scorpius)
Greater Weever (Trachinus draco) Sole (Solea solea)
Haddock (Melanogrammus aeglefinus) Sprat (Sprattus sprattus)
Herring (Clupea harengus) Thicklip grey mullet (Chelon labrosus)
Horse mackerel (trachurus trachurus) Turbot (Scophthalmus maximus)
Lemon sole (Microstomus kitt) Whiting (Merlangius merlangus)
Lumpsucker (Cyclopterus lumpus) -
Birds The results of dedicated waterbird surveys in the Sejerø Bugt revealed that the area supports
high diversity and abundance of birds, particularly during the non-breeding season (Zydelis &
Heinänen 2014a). Based on the observations estimated mean densities of the species present
in the area have been calculated (Zydelis & Heinänen 2014a), Table 5.2.
Table 5.2 Estimated densities (ind/km2) and total numbers of dominant waterbird species within Sejerø Bugt OWF and 3 km buffer around the wind farm area. Size of bio-geographic populations is provided in the species column. Species on the designation basis is marked in bold.
Species / taxonomic
Survey date
Sejerø Bugt OWF 3 km buffer zone
Group Mean
density
Total
number
Mean
density
Total
number
Divers Gaviidae
NRed-throated Diver >
150,000
Jan, Feb 2013 2.14 114 2.23 316
14 Oct 2013 1.57 83 1.63 232
11 Nov 2013 0.91 48 0.95 134
11 Mar 2014 4.39 233 4.55 646
10 Apr 2014 1.15 61 1.20 170
29 July 2014
2 Sep 2014 0.21 11 0.22 32
Grebes
Podicepididae
N > 332,000
(Podiceps cirstatus &
P. grisegena)
Jan, Feb 2013 2.86 152 2.79 396
14 Oct 2013 1.10 58 1.09 154
11 Nov 2013 0.47 25 0.47 67
11 Mar 2014 0.05 3 0.05 8
10 Apr 2014 0.06 3 0.06 9

20 rogc-s-ra-000285 4 sejerø appropriate assessment birds_19 may 2015_renset.docx / hsk / 2014-03-17
Species / taxonomic
Survey date
Sejerø Bugt OWF 3 km buffer zone
Group Mean
density
Total
number
Mean
density
Total
number
29 July 2014
2 Sep 2014 0.66 35 0.65 93
Great Cormorant
Phalacrocorax carbo
N > 380,000
Jan, Feb 2013 0.21 11 0.37 52
14 Oct 2013 0.43 23 0.76 107
11 Nov 2013 0.24 13 0.43 61
11 Mar 2014 0.17 9 0.29 42
10 Apr 2014 0.25 13 0.44 62
29 July 2014 0.65 34 1.12 159
2 Sep 2014 0.49 26 0.85 121
Common Eider
Somateria
mollissima
N > 976,000
Jan, Feb 2013 23.65 1,254 44.10 6,252
14 Oct 2013 5.11 271 11.52 1,633
11 Nov 2013 4.16 220 9.18 1,302
11 Mar 2014 4.10 217 8.49 1,204
10 Apr 2014 1.17 62 2.62 371
29 July 2014 0.18 9 0.41 59
2 Sep 2014 1.31 69 2.89 409
Common Scoter
Melanitta nigra
N > 550,000
Jan, Feb 2013 8.24 437 9.82 1,392
14 Oct 2013 3.30 175 4.27 605
11 Nov 2013 10.93 579 13.81 1,958
11 Mar 2014 12.15 644 14.83 2,102
10 Apr 2014 137.48 7,286 150.31 21,308
29 July 2014 7.09 376 9.05 1,283
2 Sep 2014 0.94 50 1.26 178
Velvet Scoter
Melanitta fusca
N > 450,000
Jan, Feb 2013 17.27 915 7.02 995
14 Oct 2013 1.09 58 0.45 64
11 Nov 2013 14.32 759 5.85 829
11 Mar 2014 23.18 1,228 9.43 1,336

Description of the Environment
21
Species / taxonomic
Survey date
Sejerø Bugt OWF 3 km buffer zone
Group Mean
density
Total
number
Mean
density
Total
number
10 Apr 2014 2.33 124 0.96 137
29 July 2014 0.53 28 0.22 31
2 Sep 2014 0.15 8 0.06 9
Herring Gull
Larus argentatus
N > 1,300,000
Jan, Feb 2013 1.66 88 1.20 171
14 Oct 2013 1.30 69 0.94 133
11 Nov 2013 1.79 95 1.30 184
11 Mar 2014 0.38 20 0.27 39
10 Apr 2014 0.92 49 0.67 95
29 July 2014 0.30 16 0.22 31
2 Sep 2014 1.25 66 0.90 128
Common Gull
Larus canus
N > 1,000,000
Jan, Feb 2013 0.29 15 0.38 53
14 Oct 2013 0.14 7 0.18 26
11 Nov 2013 0.69 36 0.88 124
11 Mar 2014 0.48 25 0.62 88
10 Apr 2014 0.93 49 1.18 168
29 July 2014 0.11 6 0.15 21
Auks Alcidae
N > 1,000,000
Jan, Feb 2013 0.22 12 0.16 23
14 Oct 2013 1.97 104 1.43 203
11 Nov 2013 2.62 139 1.90 269
11 Mar 2014 0.18 10 0.14 19
10 Apr 2014 0.05 3 0.04 5
29 July 2014 0.24 13 0.17 25
2 Sep 2014 1.51 80 1.11 157
The majority of waterbird species were abundant during the non-breeding season: autumn,
winter and spring. However, gulls and cormorants are present round year in similar numbers.
Some Common Eiders use the area for breeding and moulting in summer. In addition, some
Common Scoter and Red-necked Grebes moult in the area in the second half of summer – early
autumn.
Terns and Greater Scaup were not observed within the wind farm area most likely do to the
distance of the OWF from shore.

22 rogc-s-ra-000285 4 sejerø appropriate assessment birds_19 may 2015_renset.docx / hsk / 2014-03-17
6 Description of Potential Effects
The following description of activities that could result in an impact on birds has been based on
all available documentation, especially results of post-construction monitoring at other offshore
wind farms.
The potential impacts will have relevance for waterbirds, which use the OWF area, which for
birds on the designation basis; Common Eider, Common Scoter and Velvet Scoter can
potentially be impacted. Terns are designated as breeding species (on land), which feed in
coastal areas and hence the impacts from the OWF will not impact the breeding species nor the
feeding individuals. Greater Scaup is found in enclosed bays and lagoons with water depths < 8
m and is hence not likely to be impacted by the OWF.
The following potential impact is concentrated on potential impacts to Common Eider, Common
Scoter and Velvet Scoter.
For collision risk, all species on the designation basis will be assessed.
6.1 Disturbance and habitat displacement
Construction phase Habitat displacement effects on waterbirds during construction may vary as a function of the
intensity of construction activities. Disturbance will probably be at the level seen during
operation during intensive construction works, especially due to the concentration and
movements of boats in the wind farm area. As the numbers of waterbirds using the area shows
strong seasonal variability, the potential habitat displacement will depend on the timing of
construction activities. As the abundance of most species of waterbirds in Sejerø Bugt peaks
during October - April the potential for habitat displacement impacts is largest during winter.
Waterbirds respond in different ways to approaching vessels. While some species are attracted
to vessels because they expect food (gulls following fishing vessels), other species show a
negative response and flush if a vessel approaches at a certain distance. The response differs
not only between species but also in relation to the status of a species in its annual cycle, the
function of the area and social structure of waterbird assemblages. In addition, the response
depends on the speed and the size of the vessel. Waterbirds are especially sensitive during
moult where they show large disturbance distances, while reaction distances are smaller during
the winter months (Thiel et al. 1992). Species like Common Scoter exhibit large response
distances of 1–2 km (Bellebaum et al. 2006, Schwemmer et al. 2011). The response distance
usually increases with flock size and speed of vessel making large aggregations more
vulnerable to disturbance from service boats.
Of the species occurring in medium to high densities in the construction site, divers and scoters
have been identified as being most sensitive to disturbance. Based on the available information
it is assumed that these species will be displaced within the distances given in Table 6.1. Flush
distances of smaller flocks to slow-moving vessels are expected to be smaller than distances of
larger flocks to fast moving service and transportation boats. Table 6.1 includes own
observations, and extensions of the relationships between flock size and flush distance in
Schwemmer et al. (2011) taking the larger flocks occurring in Sejerø Bugt into account
(approximately 10x the flock sizes studied by Schwemmer). Accordingly, a range of flush
distances should be expected: 100-1000 m for Common Eider and 1-2.5 km for Common and
Velvet Scoter. Flush distances may be seen as representing the primary distance of disturbance
within, which few birds will occur during a disturbance event. Obviously, habitat displacement
involving lower levels of disturbance may take place at further distances from ships, as corridors
exposed frequently to ships may be used less intensively by waterbirds.

Description of Potential Effects
23
Table 6.1 Reported response of waterbirds on the designation basis to shipping (Bellebaum et al. 2006, Schwemmer et al. 2011 and own observations).
Species Response of small
flocks to slow-moving
vessel (10 knots)
Response of large
flocks to fast-moving
vessel (> 15 knots)
Common Eider (Somateria mollissima) 100-500 m 500-1000 m
Common Scoter (Melanitta nigra) 1-2 km 2-2.5 km
Velvet Scoter (Melanitta fusca) 1-2 km 2-2.5 km
Operational phase The evidence gathered from existing monitoring programmes at offshore wind farms indicate
that specific responses of waterbirds to wind farms are highly variable, both as a function of
specific disturbance stimuli and site-specific characteristics. In addition, adaptations to the
turbines and rotor blades are observed, which make accurate assessment of the scale of habitat
displacement rather difficult, especially over the long term. A further complication is the fact that
habitat displacement impacts as documented during the monitoring programmes of existing
OWFs may not have taken (natural) changes in food supply into consideration. Despite these
uncertainties, habitat displacement is generally regarded as the main source of impact on
staging birds from OWFs. For additional information see Zydelis & Heinänen 2014a.
Decommissioning stage Exact procedures of OWF decommissioning activities are not established yet, but it could be
assumed that habitat displacement would be very similar to that during construction activities
and would primarily originate from disturbance by working ships as they remove wind turbine
over-water structures and underwater foundations.
6.2 Loss and impairment of habitat
The physical changes imposed by constructing the Sejerø Bugt OWF include destruction of the
habitat and direct and indirect impairment of the habitat, by for example reducing the available
food resources.
Direct loss of habitat is the physical presence of the Sejerø Bugt OWF, which may affect bird
habitats by reducing available area for foraging and resting.
During the construction of the Sejerø Bugt OWF physical disturbance of the seafloor may cause
increased turbidity in the water column, reducing the food search possibilities and hence
directly impairing the bird habitat. A threshold of concentration of suspended sediment of
10 mg/l was considered as relevant in relation to direct negative response of feeding birds in the
water column, although no evidence of behavioural responses of waterbirds to this threshold
has been established.
An increase in turbidity can destroy or disturb benthic flora and fauna, which serves as food
resource for marine birds, causing an indirect impairment of the bird habitat.
Additionally, food supply can be increased through creation of artificial reefs at the foundations
of the turbines. Furthermore, turbines may serve as platforms for resting and perching birds,
thereby attracting birds to the area that would not have exploited it previously, increasing the
habitat competition (indirect impairment of habitat). The bird species recorded to use the
turbines as resting or perching platforms mainly include Great Cormorants and large gull
species.

24 rogc-s-ra-000285 4 sejerø appropriate assessment birds_19 may 2015_renset.docx / hsk / 2014-03-17
6.3 Collision mortality
Wherever wind turbines are erected birds will inevitably collide, as the rotor blades and the birds
make use of the same space (Desholm 2006). However, the important question is, in what
numbers birds collide at a given OWF.
Birds either can collide directly with the physical structure of the turbines (i.e. rotor blade or
tower) or are hit by the wake (i.e. turbulence) behind the sweeping rotor-blades. Recent studies
have shown that in practise most birds do actually avoid being hit by turbine rotor blades by
simply showing evasive behaviour towards the wind farm structures (Desholm et al. 2005, Cook
et al. 2014). However, situations occur where the flying birds cannot see the turbines:
• i.e. in poor visibility (at night, in fog or during heavy precipitation) or
• if the birds are busy looking for something else than obstacles in front of them (e.g. birds
hunting for prey or looking for food, birds simply following the flock mate in front of them, or
birds chasing each other during territorial fights).
• furthermore, birds may simply not perceive wind turbines as threats and then allow
themselves to fly at very close range to sweeping rotor blades (e.g. White-tailed Eagles on
the Norwegian island Smøla; Bevanger 2009).
The mortality rate at different wind farms is far from uniform, since local topography, bird
numbers, species composition, wind turbine and wind farm design and local weather pattern can
influence the actual number of birds colliding at a given site. The mortality rate is likely to be
directly proportional to the migration volume, which again shows high variability between sites,
seasons, individual turbines and weather conditions. Especially sites at migration bottlenecks,
also known as migration hot spots, are prone to experience very high concentrations of flying
birds in the airspace occupied by the rotating blades of the turbines, and hence potential high
wind farm related mortality rates (Desholm 2006).
At the species level, a given number of collisions at a wind farm may have very different direct
effects on populations of affected species, due to the species-specific differences in sensitivities
of these human induced additional mortalities (Desholm 2006). Typically, large-bodied, long-
lived species (e.g. raptors and waterbirds) are more vulnerable than small bird species with high
reproductive potential (e.g. passerines).
6.4 Barrier effect
Often the long migration journeys performed by many birds are rather costly energetically, any
avoidance behaviour resulting in extra distance travelled, because of birds adjusting their flight
paths in the presence of the wind farm, have the potential of having significant additional
energetic costs. Several studies in connections to monitoring around wind farms have
documented the behavioural responses of migrating birds to the structures. The background
report for the birds assessment for this report have summed the results (Zydelis & Heinänen
2014a).
Barrier effects may also apply to local movements of birds, e.g. if birds regularly commute
between resting and feeding areas. Whereas such barrier effect is theoretically plausible, it has
not been demonstrated in any of the post construction studies, which could be because existing
wind farms are placed so they do not cause substantial barrier effect to local birds, or this issue
has not been specifically investigated.

Description of Potential Effects
25
6.5 Cumulative impacts
The Sejerø Bugt OWF will be developed in a region of currently low to moderate human
activities, and the OWF can cause additional impacts on birds. Bird populations impacted by
these activities have been considered as part of the baseline conditions for this assessment.
Cumulative impacts with the planned Mejl Flak OWF have been assessed by consultation to the
assessment report for this project http://www.ens.dk/undergrund-forsyning/vedvarende-
energi/vindkraft-vindmoller/havvindmoller/idriftsatte-parker-nye#Mejlflak.

26 rogc-s-ra-000285 4 sejerø appropriate assessment birds_19 may 2015_renset.docx / hsk / 2014-03-17
7 Disturbance and habitat displacement
7.1 Methods
7.1.1 Appropriate Assessment for Sejerø Bugt (DK005X094)
The assessment of displacement effects covers two aspects. One aspect deals with estimation
of density-dependent mortality in neighbouring areas including the SPA using analysis of
redistribution caused by displacement from the wind farm. Coupled to that population level
effects (i.e. long-term survival) of the total displacement of seaducks are assessed using
thresholds for sustainable removal from the relevant bio-geographical populations. The other
aspect deals with the loss of habitat from the SPA caused by the species-specific disturbance
zones from the wind farm.
The estimation of density-dependent mortality is based on an analytical framework, which
combines the following analyses:
• Estimation of the distribution of target species of waterbirds using species distribution
models applied on aerial waterbird survey data from the period 2004-2014 (see details in
Zydelis & Heinänen 2014a);
• Estimation of displacement effects on target species by analysing the results of the
distribution models in GIS applying specific displacement ranges and proportions reported
from monitoring activities;
• Redistribution analysis in GIS by which densities of displaced target species of waterbirds
are moved into areas of similar habitat quality outside the displacement zone associated
with the wind farm;
• Estimation of density-dependent mortality caused by increases in densities of displaced
waterbirds in the areas outside the displacement zone associated with the wind farm.

Disturbance and habitat displacement
27
Figure 7.1 Methodological framework for assessment of density-dependent mortality in SPA and population-level effects of displacement.
7.1.2 Waterbird distributions and abundance
All analyses in this study were based on the predicted bird densities from Zydelis & Heinänen
(2014a). The model area within which redistribution of waterbirds was undertaken encompassed
the entire Sejerø Bugt area including all major seaduck habitats like the shallows off Røsnæs
and Sjællands Odde. The predictions were based on Generalised Additive Models (GAMs)
using aerial survey data from 2004-2014. The resolution of the predictions was 1*1 km and
determined also the resolutions for the analyses conducted in this study. Predicted densities are
shown for each major waterbird survey in Appendix A. For details regarding the observed
numbers of waterbirds and the distribution modelling, see Zydelis & Heinänen (2014a).
7.1.3 Suitability classification and footprint creation
We selected the season with highest abundance for each species and classified the predicted
densities (see Zydelis & Heinänen 2014a) into four percentiles (<25%, 25-75%, 75-90% and
>90%) using the R function “quantile” (R Development Core Team 2004). Incomplete surveys
and surveys not regarded as reliable were not included in the analyses. To be able to define a
best-case and a worst-case footprint of 44 km2 we combined the classified suitability scores for
all three species into a suitability index. More weight was added on the species with higher
proportion in the area of the total flyway population, i.e. the suitability score was multiplied with
the proportion of the flyway population and the summed weighted suitability scores were

28 rogc-s-ra-000285 4 sejerø appropriate assessment birds_19 may 2015_renset.docx / hsk / 2014-03-17
standardised (to be within the range 0-1) by dividing it with the maximum score. The best and
worst-case footprints were chosen manually based on the suitability index, i.e. grid cells (centre
point) with highest suitability were excluded from the best-case scenario and vice versa from the
worst-case scenario.
The general experience regarding displacement of waterbirds from offshore wind farms is that
no species seem to completely avoid the perimeter of the wind farm (Petersen et al. 2006, 2014,
Skov et al. 2012a). Accordingly, an avoidance rate of 75% was applied for both Common Eider,
Common Scoter and Velvet Scoter for the wind farm perimeter.
At the same time, most waterbird species, which have been subject of post-construction
monitoring seem to partly avoid the zone surrounding the wind farm. The Horns Rev 2
monitoring study documented reductions in densities of Common Scoter as a function of
distance from the wind farm. Yet, the size of the buffer zone has not been firmly established for
Common Eider and Velvet Scoter. Therefore, best available evidence was used to deduce the
most suitable species-specific buffer zones. A 2 km “disturbance” buffer for Common Eiders and
a 3 km buffer for Common Scoters and Velvet Scoters were created around both footprints and
were used in the displacement calculations with 50% avoidance. The disturbance zone of 3 km
for Common Scoter was established on the basis of post-construction monitoring data on
densities and flight patterns of the species from Horns Rev 1 and Horns Rev 2 offshore wind
farms (Skov et al. 2012a, Petersen et al. 2014). This is also in line with Schwemmer et al. (2011)
who reported maximum flushing distances of 3 km to approaching vessels. It should be noted
that the investigations by Schwemmer did not include fast vessels like service boats and were
not undertaken in areas of high densities of Common Scoter, hence larger flushing distances
should be expected for Common Scoter to service boats in transit (to and within wind farm site)
through high-density areas like Sejerø Bugt. Even though flushing distances are most likely to
extend to 3 km, significant reductions in densities of Common Scoter were recorded to a
distance of 4 km during the post-construction monitoring at the Horns Rev 2 offshore wind farm,
and reductions could be traced to a distance of 6 km from the wind farm (Petersen et al. 2014).
Thus, the applied 3 km zone for the scoter scenarios can be seen as representing the primary
zone of disturbance.
In the absence of monitoring data for Velvet Scoters, a similar disturbance zone was applied for
this species. Common Eiders are known to be less sensitive to disturbance than scoters,
however evidence of actual disturbance distances from offshore wind farms is not available.
Schwemmer et al. (2011) reported flush distances of medium-sized eider flocks to slow-moving
ships of up to 1 km. With a view on the larger flock sizes occurring in the three planned wind
farm areas and the expected operation of fast service and transportation boats associated with
the wind farms a disturbance zone of 2 km was applied for Common Eider.
7.1.4 Estimation of displacement and redistribution
The suitability scores were added to a file including the predicted densities and converted to an
ArcGIS point shapefile covering the entire study area. By using a GIS-model (Figure 7.2 ), we
further selected and created point shapefiles for each suitability class in each polygon feature of
interest; wind farm footprints, buffers, SPA and the whole study area. The model resulted in
separate tables for each polygon of interest with summed abundance for each suitability class.
These tables were inserted in an excel spread sheet where the displacement calculations were
carried out. In the spreadsheet 75% of the birds were displaced from the footprint and 50% from
the buffer to the rest of the study area. The redistribution was constrained to the same suitability
class, as the food resource (bivalves) of the seaducks is patchily distributed, and as competition
for available food resources is expected to be high in seaduck wintering areas. The
redistribution was done by calculating the percent increase in each suitability class in the study
area excluding the footprint and buffer zone. We also calculated the specific increase in the
SPAs included in the analyses as well.

Disturbance and habitat displacement
29
Figure 7.2 Schematic presentation of the GIS model used for the displacement calculations

30 rogc-s-ra-000285 4 sejerø appropriate assessment birds_19 may 2015_renset.docx / hsk / 2014-03-17
7.1.5 Estimation of density-dependent mortality
No data are available which would enable the calculation of carrying capacity of the affected
areas in relation to the three affected species, so it is not possible to say whether density-
dependent effects occur as a result of competition for food. However, a qualitative assessment
may be used to determine the likelihood of density-dependent survival based on well-
established knowledge of the species’ distribution, winter habitat and foraging ecology.
Common Scoter, Common Eider and Velvet Scoter all display relatively high habitat affinity, and
seem to concentrate in the same areas in those regions which have been surveyed regularly or
where monitoring data are available. Both in the Baltic Sea and in the North Sea it is evident that
the year-to-year variation in the distribution of these species is limited – there are broad areas of
sea that the species consistently prefer i.e. areas with high prey biomass (mussels/fish, Durinck
et al. 1994, Skov et al. 1995, Skov et al. 2011). The aerial baseline survey data and distribution
models from the three planned wind farm areas (Zydelis & Heinänen 2014a) confirm the high
habitat affinity of these species.
Given the high site fidelity displayed by the three species and the high density of non-breeding
waterbirds occurring in the planned wind farm areas it is likely that competition for food is
relatively high and the survival of the birds could potentially be density-dependent. It can
therefore not be ruled out that the areas of high habitat suitability will have limited potential for
accommodating all the displaced waterbirds without impacting the survival of the birds in the
receptor areas.
Very few field studies on density-dependent mortality have been carried out on waterbirds.
Durell et al. (2000), Durell et al. (2001) and Goss-Custard & Durell (1984) studied the mortality
of Oystercatchers overwintering on the Exe estuary over a 15-year period. Controlling for winter
severity they could document a highly significant relationship between % adult winter mortality
and bird density. The Oystercatcher data indicates that as bird density increased by 100% (i.e.
doubled from 15 to 30 birds/ha) over the years of study, the % winter mortality increased from
ca. 1% to ca 5% - ca. 6% (i.e. a 5-fold or 500% increase). However, the latter two winters in the
time series were characterised by adverse conditions, and excluding the data from these two
winters means that the increase in the observed adult winter mortality would have been less
than half or 2-300%. The empirical data as presented can be used to interpolate what the %
increase in mortality is for a given % increase in density. Assuming, for simplicity, linearity in this
relationship, the % increase in mortality associated with any given % increase in density can be
estimated from the observation that a 100% increase in density (15 to 30 birds per ha) is
associated with somewhere between a 250% and a 500% increase in mortality. On that basis, a
1% increase in density would lead to a 2.5% increase in mortality.
Transferring the results of studies on wintering waders to wintering seaducks may be
problematic, although Oystercatchers also show high site fidelity in winter, rely on a predictable
and rich supply and availability of prey and normally experience a high annual survival rate. The
Oystercatcher, though, is known to suffer high rates of mortality in periods of extreme cold
weather, which is not considered to be the case in seaducks. However, these studies can
provide indications for the realistic scale of density-dependent mortality/survival, which possibly
takes place as a result of the displacement of seaducks due to the construction of
Smålandsfarvandet, Sejerø and Sæby wind farms. The degree of aggregation of non-breeding
scoters and eiders is probably at the same level as that of feeding Oystercatchers.
The increase in % mortality post vs pre displacement expressed as a % of the baseline value
was estimated assuming winter mortality rates using published data on adult annual survival.
For Common Eiders we used the survival rates reported by Christensen & Hounisen 2014,
0.848 or 0.152 if converted into annual mortality. We further assumed the winter mortality to be
approximately half of the annual mortality, which gives 7.6%. For Common Scoter we used the
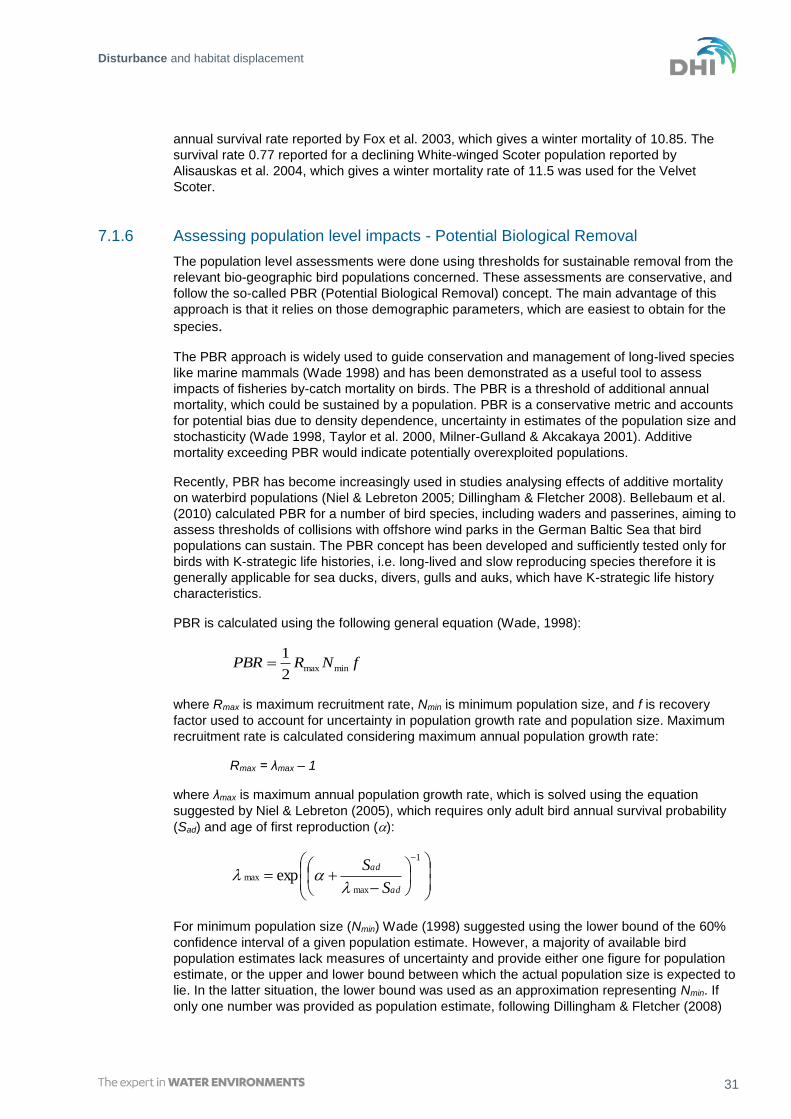
Disturbance and habitat displacement
31
annual survival rate reported by Fox et al. 2003, which gives a winter mortality of 10.85. The
survival rate 0.77 reported for a declining White-winged Scoter population reported by
Alisauskas et al. 2004, which gives a winter mortality rate of 11.5 was used for the Velvet
Scoter.
7.1.6 Assessing population level impacts - Potential Biological Removal
The population level assessments were done using thresholds for sustainable removal from the
relevant bio-geographic bird populations concerned. These assessments are conservative, and
follow the so-called PBR (Potential Biological Removal) concept. The main advantage of this
approach is that it relies on those demographic parameters, which are easiest to obtain for the
species.
The PBR approach is widely used to guide conservation and management of long-lived species
like marine mammals (Wade 1998) and has been demonstrated as a useful tool to assess
impacts of fisheries by-catch mortality on birds. The PBR is a threshold of additional annual
mortality, which could be sustained by a population. PBR is a conservative metric and accounts
for potential bias due to density dependence, uncertainty in estimates of the population size and
stochasticity (Wade 1998, Taylor et al. 2000, Milner-Gulland & Akcakaya 2001). Additive
mortality exceeding PBR would indicate potentially overexploited populations.
Recently, PBR has become increasingly used in studies analysing effects of additive mortality
on waterbird populations (Niel & Lebreton 2005; Dillingham & Fletcher 2008). Bellebaum et al.
(2010) calculated PBR for a number of bird species, including waders and passerines, aiming to
assess thresholds of collisions with offshore wind parks in the German Baltic Sea that bird
populations can sustain. The PBR concept has been developed and sufficiently tested only for
birds with K-strategic life histories, i.e. long-lived and slow reproducing species therefore it is
generally applicable for sea ducks, divers, gulls and auks, which have K-strategic life history
characteristics.
PBR is calculated using the following general equation (Wade, 1998):
fNRPBR minmax2
1
where Rmax is maximum recruitment rate, Nmin is minimum population size, and f is recovery
factor used to account for uncertainty in population growth rate and population size. Maximum
recruitment rate is calculated considering maximum annual population growth rate:
Rmax = λmax – 1
where λmax is maximum annual population growth rate, which is solved using the equation
suggested by Niel & Lebreton (2005), which requires only adult bird annual survival probability
(Sad) and age of first reproduction ():
1
max
max expad
ad
S
S
For minimum population size (Nmin) Wade (1998) suggested using the lower bound of the 60%
confidence interval of a given population estimate. However, a majority of available bird
population estimates lack measures of uncertainty and provide either one figure for population
estimate, or the upper and lower bound between which the actual population size is expected to
lie. In the latter situation, the lower bound was used as an approximation representing Nmin. If
only one number was provided as population estimate, following Dillingham & Fletcher (2008)

32 rogc-s-ra-000285 4 sejerø appropriate assessment birds_19 may 2015_renset.docx / hsk / 2014-03-17
we estimated Nmin as the 20th percentile of the population estimate assuming coefficient of
variation 𝐶𝑉�̂� = 0.5 .
The population recovery factor f, used to account for uncertainty in population growth rate and
population size, ranges between 0.1 and 1. Dillingham & Fletcher (2008) suggested a recovery
factor f = 0.5 for stable populations, f = 0.3 for declining, f = 0.1 for rapidly declining.
We used the population estimates and trends reported in Wetlands International (2014). These
population estimates have been updated with the most recent counts from the coordinated
midwinter census carried out in January each year in most countries in NW Europe. Accordingly,
we have assumed that the population estimates reflect the currently hunted populations, and
hence hunting was not considered as an additive mortality. Seaducks are mainly hunted in
Denmark, Sweden and Finland. The reported annual hunting bag in Denmark is 60,000
Common Eiders, 9,000 Common Scoters and 2,000 Velvet Scoters
(http://bios.au.dk/videnudveksling/til-jagt-og-vildtinteresserede/vinger/resultater/). The current
population trend of Common Scoter is uncertain and might be either stable or decreasing, while
Common Eider and Velvet Scoter are considered declining, furthermore Velvet Scoter is also
considered to be endangered. We therefore applied the 0.3 f factor for Common Eider and 0.1
for the rapidly declining Velvet Scoter, while a factor of 0.4 was used for Common Scoter taking
the uncertainty in the development of the population into account. For the PBR calculations we
chose to use the average survival rates reported by Hario et al. (2009), 0.882 as a reliable
“maximum” value. The survival rate for Common Scoter was based on Fox et al. (2003), 0.783
and Velvet Scoter based on the highest value reported by Alisauskas et al. (2004), 0.84. The
age of first reproduction was assumed to be 3 years.

Results
33
8 Results
8.1.1 Suitability and wind farm footprints
Based on the predicted densities (Zydelis & Heinänen 2014a) we chose to use the winter
season for Common Eiders. The mean predicted density from surveys conducted in January
2004, January & February 2008, January and February 2013, March 2014, October 2013 and
November 2013 was therefore used. The Common Scoter was clearly most abundant in spring
(Zydelis & Heinänen 2014a). We therefore chose to include the predictions for April 2014 for
Common Scoters. The winter season was chosen for the Velvet Scoter, mean of the surveys
conducted in November 2013 and March 2014 was used.
The densities were classified into four suitability classes (Figure 8.1). The highest densities and
consequently the highest suitability for Common Eiders were around the spits of the two
peninsulas (Røsnæs and Sjællands Odde) and the Sejerø island and generally along the coast.
The suitability in the wind farm footprint is therefore classified to be in the two lowest suitability
classes for Common Eider (Figure 8.1). The coastal areas in the SPA were classified as of high
suitability.
Figure 8.1 The predicted densities (right) for Common Eider were classified into four suitability classes, (percentiles) <25%, 25-75%, 75-90% and >90% (left). The best and worst-case footprints, and 2 km and 3 km buffers are shown.
The highest suitability for Common Scoters was predicted to be in the outer parts of the Sejerø
Bugt, around the outer spit of Sejerø and outside Sjællands Odde. The area classified as high
suitability within the SPA was therefore relatively small (Figure 8.2). The Northern most part of
the wind farm study area was classified as being of highest suitability (Figure 8.2).

34 rogc-s-ra-000285 4 sejerø appropriate assessment birds_19 may 2015_renset.docx / hsk / 2014-03-17
Figure 8.2 The predicted densities (right) for Common Scoter were classified into four suitability classes, (percentiles) <25%, 25-75%, 75-90% and >90% (left). The best and worst-case footprints, and 2 km and 3 km buffers are shown.
The highest suitability for Velvet Scoters was classified to be within the northern and eastern
parts of the wind farm footprint, and in the north-eastern parts of the Sejerø Bugt and SPA.
Figure 8.3 The predicted densities (right) for Velvet Scoter were classified into four suitability classes, (percentiles) <25%, 25-75%, 75-90% and >90% (left). The best and worst-case footprints, and 2 km and 3 km buffers are shown.
The species-specific suitability classes were further combined into a suitability index, which was
used for defining the best-case and worst-case footprints (Figure 8.4). The best-case footprint is

Results
35
located in the south-western parts of the wind farm footprint and the worst-case is located more
to the North East (Figure 8.4).
Figure 8.4 Species-specific suitability values were combined into a weighted index defining the most suitable areas for all thee sea duck species. Index values and resulting best and worst-case footprints are shown.
8.1.2 Displacement and redistribution analyses
The birds were displaced from the footprints and buffer zones to the same suitability classes in
the other parts of the study area.
Common Eider The total number of Common Eiders displaced from both the footprint and buffer zone was 772
for the best-case scenario and 909 for the worst-case (Table 8.1). After redistributing the
displaced birds from the footprints and buffer zones to the remaining parts of the study area, the
proportional increase was highest in the lowest suitability class 16.7% (best-case) and 14.6%
(worst-case) and 4.3% (best-case) and 5.5% (worst-case) in the medium class (class 2), Table
8.2.
Table 8.1 Abundance of Common Eiders in the whole study area, SPA, buffer and wind farm footprint. The number of birds displaced 75% from the footprint and 50% from the 2 km buffer zone is indicated for each suitability class.
Best-case Worst-case
Suitability km2 Abundance N displaced km2 Abundance N displaced
Whole
area
1 352 1,325 352 1,325
2 702 15,108 702 15,108
3 211 17,961 211 17,961

36 rogc-s-ra-000285 4 sejerø appropriate assessment birds_19 may 2015_renset.docx / hsk / 2014-03-17
Best-case Worst-case
Suitability km2 Abundance N displaced km2 Abundance N displaced
4 141 29,713 141 29,713
SPA
1 0 0 0 0
2 212 6,132 212 6,132
3 131 11,202 131 11,202
4 46 6,252 46 6,252
Buffer
1 21 113 57 28 155 77
2 65 984 492 69 1,070 535
3 0 0 0 0 0 0
4 0 0 0 0 0 0
Wind
farm
1 28 159 120 18 104 78
2 15 137 103 24 292 219
3 0 0 0 0 0 0
4 0 0 0 0 0 0
Table 8.2 The abundance of Common Eider in the study area in each suitability class when excluding the footprint and buffer zone and the abundance when further adding the displaced birds in the same area. The last column indicates the proportional increase in the area, which is used for calculating the increase in the SPA only as well.
Suitability Abundance excluding
footprint and buffer
Abundance after
adding displaced birds % increase
Best-case
1 1,052 1,228 16.7%
2 13,987 14,582 4.3%
3 17,961 17,961 0%
4 29,713 29,713 0%
Worst-case
1 1,066 1,221 14.6%
2 13,746 14,500 5.5%
3 17,961 17,961 0%
4 29,713 29,713 0%
Common Scoter The total number of Common Scoters displaced from both the footprint and buffer zone was
14,032 for the best-case scenario and 15,649 for the worst-case (Table 8.3). After redistributing
the displaced birds from the footprints and buffer zones to the remaining parts of the study area,
the increase was highest in the suitability class 3 with 16.0% (best-case) and 18.6% (worst-
case) and 10.5% in the medium class (class 2) for both scenarios, Table 8.4.

Results
37
Table 8.3 Abundance of Common Scoters in the whole study area, SPA, buffer and wind farm footprint. The number of birds displaced 75% from the footprint and 50% from the 3 km buffer zone is indicated for each suitability class.
Best-case Worst-case
Suitability km2 Abundance N displaced km2 Abundance N displaced
Whole
area
1 352 12,738 352 12,738
2 702 84,846 702 84,846
3 211 36,375 211 36,375
4 141 32,546 141 32,546
SPA
1 29 1,731 29 1,731
2 296 35,629 296 35,629
3 45 7,743 45 7,743
4 13 2,821 13 2,822
Buffer
1 13 757 378 13 791 395
2 72 9,304 4,652 78 10,043 5,021
3 37 6,407 3,203 38 6,583 3,292
4 15 3,121 1,560 23 4,977 2,488
Wind
farm
1 2 123 92 0 0 0
2 31 3,806 2,855 27 3,329 2,497
3 10 1,723 1,292 14 2,405 1,803
4 0 0 0 1 205 153
Table 8.4 The abundance of Common Scoter in the study area in each suitability class when excluding the footprint and buffer zone and the abundance when further adding the displaced birds in the same area. The last column indicates the proportional increase in the area, which is used for calculating the increase in the SPA only as well.
Suitability Abundance excluding
footprint and buffer
Abundance after
adding displaced birds
Prop.
increase
Best-case
1 11,859 12,329 4.0%
2 71,735 79,242 10.5%
3 28,246 32,741 16.0%
4 29,425 30,986 5.3%
Worst-case
1 11,948 12,343 3.3%
2 71,474 78,992 10.5%
3 27,388 32,483 18.6%
4 27,365 30,007 9.7%

38 rogc-s-ra-000285 4 sejerø appropriate assessment birds_19 may 2015_renset.docx / hsk / 2014-03-17
Velvet Scoter For Velvet Scoter the total number displaced birds from both the footprint and buffer zone was
1,195 for the best-case scenario and 1,261 for the worst-case (Table 8.5). The redistributing of
the displaced birds from the footprints and buffer zones to the remaining parts of the study area
gave an increase in the highest suitability class of 41.6% (best-case) and 44.4% (worst-case),
Table 8.6.
Table 8.5 Abundance of Velvet Scoters in the whole study area, SPA, buffer and wind farm footprint. The number of birds displaced 75% from the footprint and 50% from the 3 km buffer zone is indicated for each suitability class.
Best-case Worst-case
Suitability km2 Abundance N displaced km2 Abundance N displaced
Whole
area
1 352 238 352 238
2 702 4,444 702 4,444
3 211 2,823 211 2,823
4 141 3,233 141 3,233
SPA
1 2 2 2 2
2 198 1,646 198 1,646
3 133 1,779 133 1,779
4 50 1,071 50 1,071
Buffer
1 41 31 16 42 32 16
2 46 310 155 65 405 202
3 18 249 125 19 265 132
4 32 699 349 26 568 284
Wind
farm
1 7 5 4 6 4 3
2 13 79 59 6 39 29
3 3 43 33 3 40 30
4 20 605 454 27 754 565
Table 8.6 The abundance of Velvet Scoter in the study area in each suitability class when excluding the footprint and buffer zone and the abundance when further adding the displaced birds in the same area. The last column indicates the proportional increase in the area, which is used for calculating the increase in the SPA only as well.
Suitability Abundance excluding
footprint and buffer
Abundance after
adding displaced birds
Prop.
increase
Best-case
1 202 221 9.4%
2 4,055 4,269 5.3%
3 2,531 2,688 6.2%
4 1,929 2,733 41.6%
Worst-case 1 202 221 9.4%

Results
39
Suitability Abundance excluding
footprint and buffer
Abundance after
adding displaced birds
Prop.
increase
2 4,000 4,231 5.8%
3 2,519 2,681 6.4%
4 1,912 2,761 44.4%
8.1.3 Density dependent mortality
Based on the percent increase (see above chapter 8.1.2) in the areas excluding the footprints
and buffer zones we calculated the mortality, assuming a 2.5% increase in mortality per 1%
increase in abundance.
Common Eider The increase in mortality due to the displacement was highest in the lowest suitability class
41.9% and 36.4% for best-case and worst-case respectively. This means that the winter
mortality would increase from 7.6% to 10.8% (best-case) and 10.4% (worst-case) and would
result in that 39 (best-case) and 34 (worst-case) more Common Eiders would die in the lowest
suitability class in comparison to the baseline. In total, the assumed density-dependent mortality
would result in that 157 (best-case) and185 (worst-case) more Common Eiders would die in
comparison to the baseline. See Table 8.7.
Table 8.7 The density dependent mortality for Common Eider (assuming a 2.5% increase in mortality per 1% increase in abundance) in the study area (after adding the displaced birds from the footprint and buffer). The baseline mortality is the natural mortality. The difference between the baseline mortality and the mortality induced by the displacement is indicated in the last column.
Suitability Baseline
mortality
Increase
in
mortality
(2.5% per
%
increase)
New
mortality
(%)
N dead
birds
baseline N
dead birds
Difference
(increased N
of dead
birds)
Best-
case
1 7.6% 41.9% 10.8% 140 101 39
2 7.6% 10.6% 8.4% 1,266 1,148 118
3 7.6% 0.0% 7.6% 1,365 1,365 0
4 7.6% 0.0% 7.6% 2,258 2,258 0
total 5,029 4,872 157
Worst-
case
1 7.6% 36.4% 10.4% 134 101 34
2 7.6% 13.7% 8.6% 1,299 1,148 151
3 7.6% 0.0% 7.6% 1,365 1,365 0
4 7.6% 0.0% 7.6% 2,258 2,258 0
total 5,057 4,872 185

40 rogc-s-ra-000285 4 sejerø appropriate assessment birds_19 may 2015_renset.docx / hsk / 2014-03-17
Common Scoter The increase in mortality due to the displacement was highest in third suitability class, 39.8%
and 46.5% for best-case and worst-case respectively. This leads to an increase in the winter
mortality from 10.85% to 15.2% (best-case) and 15.9% (worst-case) and would result in that
1,414 (best-case) and 1,639 (worst-case) more Common Scoter would die in the third suitability
class in comparison to the baseline. In total, the assumed density-dependent mortality would
result in that 4,241 (best-case) and 4,790 (worst-case) more Common Scoter would die in
comparison to the baseline. See Table 8.8.
Table 8.8 The density dependent mortality for Common Scoter (assuming a 2.5% increase in mortality per 1% increase in abundance) in the study area (after adding the displaced birds from the footprint and buffer). The baseline mortality is the natural mortality. The difference between the baseline mortality and the mortality induced by the displacement is indicated in the last column.
Suitability Baseline
mortality
Increase
in
mortality
(2.5% per
%
increase)
New
mortality
(%)
N dead
birds
baseline
N dead
birds
Difference
(increased N
of dead
birds)
Best-
case
1 10.85% 9.9% 11.9% 1,515 1,382 133
2 10.85% 26.2% 13.7% 11,455 9,206 2,249
3 10.85% 39.8% 15.2% 5,360 3,947 1,414
4 10.85% 13.3% 12.3% 3,977 3,531 446
total 22,307 18,066 4,241
Worst-
case
1 10.85% 8.3% 11.7% 1,493 1,382 111
2 10.85% 26.3% 13.7% 11,460 9,206 2,254
3 10.85% 46.5% 15.9% 5,586 3,947 1,639
4 10.85% 24.1% 13.5% 4,317 3,531 786
total 22,855 18,066 4,790
Velvet Scoter The increase in mortality due to the displacement was highest in third suitability class, 39.8%
and 46.5% for best-case and worst-case, respectively. This leads to an increase in the winter
mortality of Velvet Scoter from 11.5% to 23.5% (best-case) and 24.3% (worst-case) and would
result in that 327 (best-case) and 353 (worst-case) more Velvet Scoter would die in the fourth
suitability class in comparison to the baseline. In total, the assumed density-dependent mortality
would result in that 446 (best-case) and 479 (worst-case) more Velvet Scoter would die in
comparison to the baseline. See Table 8.9.
Table 8.9 The density dependent mortality for Velvet Scoter (assuming a 2.5% increase in mortality per 1% increase in abundance) in the study area (after adding the displaced birds from the footprint and buffer). The baseline mortality is the natural mortality. The difference between the baseline mortality and the mortality induced by the displacement is indicated in the last column.

Results
41
Suitability Baseline
mortality
Increase
in
mortality
(2.5% per
%
increase)
New
mortality
(%)
N dead
birds
Baseline N
dead birds
Difference
(increased N
of dead
birds)
Best-
case
1 11.5% 23.6% 14.2% 33 27 6
2 11.5% 13.2% 13.0% 576 511 65
3 11.5% 15.5% 13.3% 373 325 48
4 11.5% 104.1% 23.5% 699 372 327
Total 1,681 1,235 446
Worst-
case
1 11.5% 23.5% 14.2% 33 27 6
2 11.5% 14.5% 13.2% 581 511 70
3 11.5% 16.1% 13.4% 374 325 50
4 11.5% 111.1% 24.3% 724 372 353
Total 1,713 1,235 479
8.1.3.1 Sejerø Bugt og Nekselø (DK005X094)
Common Eider When assessing specifically the density dependent induced mortality in the SPA the total
number of dead birds was 52 and 67 birds for best-case and worst-case, respectively. An
increase in number of Common Eiders only took place in the medium (or second) suitability
class. This accounts for a site related mortality of 0.2-0.3% (best-case- worst-case, respectively)
of the total SPA baseline abundance (Table 8.1).
Table 8.10 The density dependent mortality for Common Eider (assuming a 2.5% increase in mortality per 1% increase in abundance) in the SPA (after adding the displaced birds from the footprint and buffer). The base line mortality is the natural mortality. The difference between the baseline mortality and the mortality induced by the displacement is indicated in the last column.
Suitability Increased number
Change in number
N dead birds
baseline N dead birds
Difference (increased n of dead birds)
Best-case
1 0 0 0 0 0
2 6,393 261 537 486 52
3 11,202 0 851 851 0
4 6,252 0 475 475 0
total 1,864 1,812 52
Worst-case
1 0 0 0 0 0
2 6,468 336 559 492 67
3 11,202 0 851 851 0

42 rogc-s-ra-000285 4 sejerø appropriate assessment birds_19 may 2015_renset.docx / hsk / 2014-03-17
Suitability Increased number
Change in number
N dead birds
baseline N dead birds
Difference (increased n of dead birds)
4 6,252 0 475 475 0
total 1,886 1,818 67
Common Scoter The total number of Common Scoter, which dies specifically in the SPA due to the density
dependent induced mortality was 1,567 for best-case and 1,684 for worst-case. The highest
increase was found in the second suitability class. This accounts for a site related mortality of
3.3-3.5% (best-case- worst-case, respectively of the total SPA baseline abundance (Table 8.3).
Table 8.11 The density dependent mortality for Common Scoter (assuming a 2.5% increase in mortality per 1% increase in abundance) in the SPA (after adding the displaced birds from the footprint and buffer). The baseline mortality is the natural mortality. The difference between the baseline mortality and the mortality induced by the displacement is indicated in the last column
Suitability Increased number
Change in number
N dead birds
baseline N dead birds
Difference (increased n of dead birds)
Best-case
1 1,800 69 215 195 19
2 39,357 3,728 5,387 4,270 1,117
3 8,975 1,232 1,361 974 387
4 2,971 150 365 322 43
total 7,328 5,762 1,567
Worst-case
1 1,788 57 210 194 16
2 39,376 3,748 5,396 4,272 1,124
3 9,184 1,440 1,460 996 463
4 3,094 272 417 336 81
total 7,482 5,798 1,684
Velvet Scoter When assessing specifically the density dependent induced mortality in the SPA for Velvet
Scoter, the total number of dead birds was 242 for the best-case and 20 birds more for the
worst-case (262). The highest increase was found in the highest suitability class (4). This
accounts for a site related mortality of 5.4-5.8% (best-case- worst-case, respectively of the total
SPA baseline abundance (Table 8.5).
Table 8.12 The density dependent mortality for Velvet Scoter (assuming a 2.5% increase in mortality per 1% increase in abundance) in the SPA (after adding the displaced birds from the footprint and buffer). The base line mortality is the natural mortality. The difference between the baseline mortality and the mortality induced by the displacement is indicated in the last column
Suitability Increased number
Change in number
N dead birds
baseline N dead birds
Difference (increased n of dead birds)

Results
43
Suitability Increased number
Change in number
N dead birds
baseline N dead birds
Difference (increased n of dead birds)
Best-case
1 2 0 0 0 0
2 1,733 87 226 199 26
3 1,889 110 251 217 34
4 1,516 446 356 174 182
total 833 591 242
Worst-case
1 2 0 0 0 0
2 1,741 95 229 200 29
3 1,893 114 253 218 35
4 1,546 476 375 178 198
total 858 596 262
Greater Scaup As stressed earlier, Greater Scaup has not been observed in the area during the baseline
investigations, but is still listed on the designation basis for the area with a standard data form
population of up to 1,000 wintering birds. It is clear that the species’ occurrence in Sejerø Bugt is
not very regular. The risk of wind farm induced habitat displacement of Greater Scaup when
present in Sejerø Bugt is minimal, as the species is associated with areas having a water depths
lower than eight meters.
8.1.4 Impact on long-term viability of affected populations in SPA
The populations of seaducks in question are already affected by displacement-related mortality
from existing offshore wind farms. As this added mortality is not accounted for in the applied
PBR, the potential impact at population level was assessed by comparing the PBR (Table 8.13)
threshold to the additive mortality by the Sejerø Bugt wind farm together with the baseline
mortality caused by the other wind farms. We included the large wind farms in Denmark Nysted,
Rødsand, Anholt and Horns Rev 1, 2 and 3 in the assessment. We did not include the German,
Dutch or British wind farms in the assessment as they are outside the main staging areas for
seaducks (Table 8.14).
According to the impact assessments and post construction studies from other constructed wind
farms it was only Common Scoters of these three seaduck species that was reported to be
displaced in greater numbers (Table 8.14). The site-related mortality of Sejerø OWF is
equivalent to 0.9-1.0 % (best/worst case) of the PBR threshold for Common Eider, 24.9-28.2 %
of the PBR threshold for Common Scoter and 14.5-15.5 % of the threshold for Velvet Scoter
(Table 8.14). The combined baseline OWF and Sejerø Bugt OWF related mortality of Common
Eider is 157/185 birds, which is equivalent to 0.9-1.0 % (best/worst case) of the PBR threshold,
while the combined mortality of Velvet Scoter (446/479) is equivalent to 14.5-15.5 % of the PBR
threshold (Table 8.14). The additive mortality (Sejerø Bugt and the baseline wind farms listed in
Table 8.14) for Common Scoter, however, is at a very high level (11,394/11,943) which is
equivalent to 67-70 % of the PBR threshold (Table 8.14).
Table 8.13 Calculated Potential Biological Removal (PBR) levels for the three seaduck species, which the table presents key parameters: size of relevant population, minimum population size, maximum annual population growth rate λmax, and recovery factor f.

44 rogc-s-ra-000285 4 sejerø appropriate assessment birds_19 may 2015_renset.docx / hsk / 2014-03-17
Species Population
size
Nmin λmax F PBR
Common Eider 976,000 641,278 1.18 0.3 17,700
Common Scoter 550,000 361,376 1.24 0.4 17,012
Velvet Scoter 450,000 295,671 1.21 0.1 3,083
Table 8.14 Summary table of the assumed density dependent mortality from Sejerø Bugt OWF (best case/worst case) and operational wind farms (baseline wind farms). The mortality at baseline wind farm was assumed to be the same as the rate between displaced birds and increase in density dependent mortality as in Smålandsfarvandet OWF (Zydelis & Heinänen 2014b).
Common Eider
mortality Common Scoter
mortality Velvet Scoter
mortality Reference
Best
case
Worst
case
Best
case
Worst
case
Best
case
Worst
case
Sejerø 157 185 4,241 4,790 446 479
Baseline wind farms
Anholt
Few
Few
Few
Few
Few
Few
Few
Few
Few
Skov et al.
2009
Nysted Petersen et
al. (2006)
Rødsand Kahlert et al.
(2007)
Horns Rev 1
1,000
Assumption,
Petersen et
al. (2006)
Horns Rev 2 5,310 Petersen et
al. (2014)
Horns Rev 3 843 Dorsch et al.
(2014)
Total 157 185 11,394 11,943 446 479
PBR 17,700 17,012 3083
% of PBR 0.9 % 1.0 % 67.0 % 70.2 % 14.5 % 15.5 %
9 Loss and impairment of habitat
9.1 Sejerø Bugt og Nekselø (DK005X094)
Assessments of loss and impairment of habitat for the entire study area of Sejerø Bugt (Figure
5.1) have been done in connection to the EIA (Zydelis & Heinänen 2014a).

Loss and impairment of habitat
45
Construction phase Habitat displacement due to disturbance from the construction site and associated activities on
waterbirds within the SPA is likely to be identical with habitat displacement for the operational
phase (following Table 6.1). As a result, flush distances should be expected to range from 100
m to 1000 m for Common Eider and from 1 km to 2.5 km for Common and Velvet Scoter
depending on flock size and speed of vessel. These distances represent the primary distance of
disturbance within which few birds will occur during a disturbance event. Yet, waterbirds may
move into the traffic corridor in between events of passing ships and boats. Although
observations of flush distances of seaducks are available, no studies on the impact of ship traffic
on habitat use by seaducks have yet been published. Post-construction monitoring of changes
in flight patterns of Common Scoter at Horns Rev 1 and 2 offshore wind farms elucidated major
changes taking place at 2-3 km distance (Skov et al. 2012a). These changes may be more
related to traffic associated with the wind farms than to the actual turbine structures, and may be
part of overall change in habitat use recorded between pre- and post-construction periods
(Petersen et al. 2014). If Odden or Kalundborg Harbour are used for transport and construction
vessels, it is not likely that the ships will travel in or close to the SPA on the way to the OWF. As
the closest distance from the eastern edge of the OWF to the SPA is 1.8 km, it is unlikely that
disturbance from associated ships and boats will cause any loss of habitat in the SPA.
Sediment dispersal affecting available food supplies of benthic invertebrates and fish have been
estimated to be insignificant (Rambøll 2014a, Rambøll 2014b). Even if concentrations of
suspended material are estimated to exceed 10 mg/l during periods of the construction the
sediment plumes will be of short duration with no risk for affecting feeding conditions of diving
waterbirds for more than a few hours. This applies for the entire study area. The amount of
dispersed sediment and hence the risk of impact will be even smaller in the SPA.
On the basis of the above, there will be no adverse impacts on the waterbirds on the designation
basis in the construction phase due to loss and impairment of habitat.
Operational phase On the basis of the above, there will be no adverse impacts on the birds on the designation
basis in the Operational phase due to loss and impairment of habitat.

46 rogc-s-ra-000285 4 sejerø appropriate assessment birds_19 may 2015_renset.docx / hsk / 2014-03-17
10 Collision mortality
Nearly all flying birds face certain collision risk with operating wind turbines. Assessments are
typically done separately for two distinct groups:
• Collision risk of local birds that live in the area and may cross the wind farm zone multiple
times
• Collision risk of long-distance migrant birds that may cross the wind farm area only once
per seasonal migration.
Collision risk assessments have been done in the EIA for Sejerø Bugt OWF and details of the
modelling and assessment methods can be found in Zydelis and Heinänen 2014. The below
sections gives a short summery of the results.
10.1 Collision risk of local birds
Collision risk of the relevant local birds on the designation basis for the SPA Sejerø Bugt og
Nekseløx (DK005X094) are Common Eider, Common Scoter and Velvet Scoter. Collision risk of
breeding birds are not relevant, as the species do not use the area as foraging site (Table 5.2).
Breeding birds, which migrate over long distances, are assessed in the following section.
Furthermore, the Sejerø Bugt is a site of low intensity of migration (not a migration corridor).
Seaducks have been shown to have a high avoidance rate, e.g. 99.3% (Krijgsveld et al. 2011) or
even larger than >99.9% (Smartwind 2013). The 99.5% avoidance rate can therefore be
considered as a suitable scenario for Common Eiders, Common Scoter and Velvet Scoter, and
would result in one or two annual collision of staging individuals of the species if the 3 MW
turbines are used (Table 10.1) and none if 10 MW turbines are used. Even if a more
conservative approach and an avoidance rate of 95% is used, the number of colliding birds
would be low, respectively for the two scenarios.
Table 10.1 Estimated potential annual collisions for seaducks in the wind farm area. Estimations are shown for the two wind turbine design variants and four different theoretical avoidance rates. An assumed uncertainty of ±67% should be coupled to each collision estimate, Zydelis & Heinänen 2014a.
Common Eider 3 MW 10 MW
Collision risk (95% avoidance), number of birds colliding 12 5
Collision risk (98% avoidance), number of birds colliding 5 2
Collision risk (99% avoidance), number of birds colliding 2 1
Collision risk (99.5% avoidance), number of birds colliding 1 0
Common Scoter 3 MW 10 MW
Collision risk (95% avoidance), number of birds colliding 18 2
Collision risk (98% avoidance), number of birds colliding 7 1
Collision risk (99% avoidance), number of birds colliding 4 0
Collision risk (99.5% avoidance), number of birds colliding 2 0

Collision mortality
47
Velvet Scoter 3 MW 10 MW
Collision risk (95% avoidance), number of birds colliding 16 2
Collision risk (98% avoidance), number of birds colliding 6 1
Collision risk (99% avoidance), number of birds colliding 3 0
Collision risk (99.5% avoidance), number of birds colliding 2 0
10.2 Collision risk of long-distance migrants
Due to the lack of quantitative data on long-distance migration of both landbirds and waterbirds
in Sejerø Bugt and the perceived low intensity of migration through the planned wind farm site in
general, only a qualitative assessment of the level of collisions has been made in the EIA
(Zydelis & Heinänen 2014a). The assessment has been based on experiences from the post-
construction monitoring programmes at Horns Rev 2 (Skov et al. 2012c), Rødsand 2 (Skov et al.
2012a) and OWEZ, Netherlands (Krijgsveld et al. 2011).
Based on the available information about the patterns of bird migration in southern
Kattegat/North Zealand the migration intensity of both groups of birds in the wind farm area is
expected to be low (see Zydelis and Heinänen 2014), although variations in spatial trends may
occur over time. The extent of collision risks to landbirds and waterbirds on long-distance
migration is therefore assessed as insignificant for SPAs and adverse impacts on SPAs will not
occur.

48 rogc-s-ra-000285 4 sejerø appropriate assessment birds_19 may 2015_renset.docx / hsk / 2014-03-17
11 Barrier effects
Due to the lack of quantitative data on the spatial distribution of long-distance migration of
waterbirds through Sejerø Bugt it is assumed that the migration of waterbirds will progress over
the entire offshore region without tendencies for being concentrated in specific corridors. For this
reason, the extent of barrier effect on waterbirds on long-distance migration is assessed as
insignificant, with minor additional energy expenditures required for the birds to circumvent the
wind farm.
Resident waterbird species that are sensitive to wind farm presence may also experience barrier
effect from the operating wind farm if they commute regularly through the area where the wind
farm is built. Telemetry investigations of Common Eider and Velvet Scoter movements in
Smålandsfarvandet and study of Common Eiders and Long-tailed Ducks in the Fehmarnbelt
revealed that these species are rather sedentary during the wintering season and do not
commute regularly between separate habitat sites. Based on these findings we conclude that
Sejerø Bugt wind farm would have insignificant impact on staging waterbirds due to barrier
effect.

Cumulative impacts
49
12 Cumulative impacts
12.1 Regional
When several projects within the same region may have effects on the same environmental
conditions at the same time, there are cumulative impacts. For a project to be it requires that the
project:
• is within the same geographic area
• has some of the same impacts as Sejerø Bugt OWF
• affects some of the same environmental conditions, habitats or components
It has been identified that the planned wind farm in Sejerø Bugt may have cumulative impacts
on birds with the planned offshore wind farm Mejlflak in Århus Bugt. The impacts on waterbirds
from the Mejlflak project were assessed by Rambøll (2012), and disturbance impacts on
Common Scoter, Velvet Scoter and Common Eider were estimated to be pertinent. As the
abundance of neither of these species at Mejlflak are considered of international importance the
impact of habitat displacement from a wind farm here would be much smaller than for the Sejerø
Bugt wind farm. Accordingly, the cumulative impact of the two projects would not be much
higher than from the Sejerø wind farm on its own. Common Scoters displaced from both wind
farms would seek to find alternative feeding areas most likely in the southern Kattegat, and
cause densities in some areas to increase.
12.2 Population wise
Cumulative impacts on the affected populations may also arise as a function of displacement
related added mortality induced by planned offshore wind farms within the non-breeding habitats
of the seaduck species. Assessments of cumulative impacts were undertaken by comparing the
PBR threshold (Table 8.13,Table 12.1) to the additive mortality by Sejerø and existing wind
farms in combination with the planned coastal wind farm Smålandsfarvandet (Skov et al. 2015).
The mortality of Common Eider related to Sejerø and existing OWFs is estimated at 157/182
birds (best/worst case), at 11,394/11,943 for Common Scoter and at 446/479 for Velvet Scoter
(Table 12.1). The cumulative mortality of Common Eider in combination with Smålandsfarvandet
OWF (2,832-3,573 birds) is equivalent to 16-20% of the PBR threshold, while the cumulative
mortality of Velvet Scoter (1,084-1,296) is equivalent to 35-42% of the PBR threshold (Table
12.1). The cumulative mortality for Common Scoter, however, is at a very high level (16,348-
17,761) which is equivalent to 96-104% of PBR (Table 12.1).
Table 12.1 Cumulative assumed density dependent mortality from planned and operational/approved wind farms (baseline wind farms). Both the best case and worst case estimates are given. The mortality at baseline wind farm was assumed to be the same as the rate between displaced birds and increase in density dependent mortality as in Smålandsfarvandet OWF (Zydelis & Heinänen 2014b).
Common Eider mortality
Common Scoter mortality
Velvet Scoter mortality
Sejerø Bugt OWF +
baseline 157/185 11,394/11,943 446/479
Smålandsfarvandet OWF 2,675/3,388 4,954/5,818 638/817
Total 2,832/3,573 16,348/17,761 1,084/1,296
PBR 17,700 17,012 3,083

50 rogc-s-ra-000285 4 sejerø appropriate assessment birds_19 may 2015_renset.docx / hsk / 2014-03-17
13 Effect on integrity of affected SPAs
13.1 Sejerø Bugt og Nekselø (DK005X094)
Below, the effect on the integrity of the SPA Sejerø Bugt og Nekselø (DK005X094) is assessed
based on the results presented in the previous section and the advice set in section 2.4
regarding integrity of the site and assessment of the potential for adverse effects of the
development of the Sejerø Bugt OWF.
13.1.1 Habitat loss
There is no direct habitat loss within the SPA 94. Hence, there will be no adverse impacts on the
birds on the designation basis due to loss and impairment of habitat.
13.1.2 Collision risk and barrier effect
With respect to collision risks one or two annual collisions of staging Common Eiders, Common
Scoters and Velvet Scoters were estimated for the 3 MW turbines, and no collisions for the 10
MW turbines. The extent of collision risks to landbirds and waterbirds on long-distance migration
were also assessed as insignificant for the target species, and hence there will be no adverse
effects on the integrity of the site due to collisions with the Sejerø Bugt OWF. As only minor
additional energy expenditures are required for waterbirds on long-distance migration to
circumvent the wind farm, and as telemetry studies show the locally staging waterbirds are
relatively sedentary no adverse effects due to the barrier imposed by the wind farm can be
expected.
13.1.3 Habitat displacement
Wind farm related annual mortality within the SPA (best-case) is estimated at 52 Common Eider
(0.42 %/0.22% of abundance sensu Standard Data Form and EIA baseline), 1,567 Common
Scoter (10.10%/2.9% of abundance sensu Standard Data Form and EIA baseline) and 242
Velvet Scoter (9.28%/5.25% of abundance sensu Standard Data Form and EIA baseline). The
combined baseline and Sejerø Bugt related mortality of Common Eider is 157 birds, which is
equivalent to 0.9% of the PBR threshold. The baseline and Sejerø Bugt related mortality of
Velvet Scoter is 446 birds, which is equivalent to 14% of the PBR threshold. The combined
additive mortality for Common Scoter, however, is at a very high level (11,394) which is 67% of
the PBR threshold. Cumulatively with Smålandsfarvandet OWF the wind farm related mortality
of Common Scoter will be above or just below 100% of PBR.
13.1.4 Confidence of assessment
The quantification of displacement related effects described above rests on several
assumptions:
Future habitat and pressure features for seaducks will be similar to the existing
conditions;

Effect on integrity of affected SPAs
51
Patterns of boat traffic do not change during the lifetime of the wind farm;
Seaducks are not displaced to areas where hunting is prohibited;
The seaducks will not display any habituation to the wind farm over time;
The boundaries of the distribution models applied provide a realistic frame for relocation
of displaced seaducks;
The 75% and 50% avoidance rates applied for the wind farm perimeter and buffer
zones, respectively, can be regarded as the most suitable species-specific avoidance
rates for the chosen zones;
Relocation of displaced seaducks to areas of similar suitability is a realistic scenario for
the three species of seaducks;
Published (best available) adult mortality rates are correct and the proportion of
juveniles in seaduck populations is relatively small;
The density dependent mortality is 2.5% per 1% increase in density due to the
displacement
The rate of density-dependent (winter) mortality can be applied to Common Scoters
during the 1.5-month period in spring;
The confidence of the distribution models used as a basis for displacement scenarios is
good and the models accurately describe the observed densities of the three species of
seaducks.
The calculations assume that future habitat and pressure features for the three species of
seaducks in the areas outside the wind farm and buffer zones will be similar to the existing
conditions. This may not be the case. Climate change and other meso scale environmental
conditions like changes in nutrient loads to offshore waters are suggested as main drivers
behind the widespread decline in the wintering populations of Common Eider, Common Scoter
and Velvet Scoter experienced in the Baltic Sea since 1993 (Skov et al. 2011). As further
reductions in eutrophication and increasing effects of rising sea temperatures are forecasted for
the coming 20 years, it is likely that the feeding conditions for these species will deteriorate
further in many offshore areas, potentially also in Sejerø Bugt. The degree to which such
changes will affect density-dependence in the seaduck community in Sejerø Bugt cannot be
assessed without detailed knowledge of the current available food supply.
Patterns of boat traffic are not static, and hence may change during the lifetime of the wind farm.
It is even likely that some of the existing smaller shipping lanes, like the one crossing the wind
farm from Sejerø towards Røsnæs, will be less used by ships after the construction of the wind
farm. Ship traffic (AIS data) was included in the waterbird distribution models applied during the
baseline and was documented to affect the presence of both Common Scoter and Common
Eider negatively. With potentially less traffic in some of the shipping lanes following the
construction of the wind farm the possibility exists that areas of suitable habitat will become
more available to seaducks. However, as the suitability of the feeding habitat in these shipping
lanes cannot be determined from the distribution models the potential for such changes cannot
be safely estimated, and hence estimated disturbance effects may be slightly overestimated.
The most suitable habitats to the three species in Sejerø Bugt have been identified during the
baseline as areas of relatively low density of ship traffic. It is presently not known whether the
routes to be used by service and maintenance boats to the wind farm will intersect the areas of
high habitat suitability, and thereby cause a higher level of displacement than anticipated in the
calculations of wind farm related mortality.
All three species of seaducks are currently under hunting pressure in Danish waters where
60,000 Common Eider, 9,000 Common Scoter and 2,000 Velvet Scoter are shot annually

52 rogc-s-ra-000285 4 sejerø appropriate assessment birds_19 may 2015_renset.docx / hsk / 2014-03-17
(http://bios.au.dk/videnudveksling/til-jagt-og-vildtinteresserede/vinger/resultater/). After the
construction of the wind farm birds could possibly be displaced to areas where hunting is
prohibited and hence indirectly suffer a lower mortality due to hunting. However, hunting is
allowed in SPAs in Denmark as long as the hunting is sustainable, and hunting is only prohibited
in game reserves. As no game reserves are located within the habitats used offshore by the
seaducks in Sejerø Bugt such an effect is unlikely.
The calculations also assume that the behavioural responses of the seaducks to the wind farm
will remain the same over long periods of time and that no habituation will take place. The
potential habituation of seaducks to offshore wind farm is an ongoing theme discussed in
relation to post-construction monitoring. Habituation was suggested for Common Scoter at
Horns Rev 1 following observations of increasing numbers in the wind farm in the mid 2000s
(Petersen et al. 2006). However, on the basis of 20 aerial surveys undertaken since construction
of Horns Rev 1, Petersen et al. (2014) concludes that no change in the utilisation of the wind
farm by Common Scoter can be documented. Due to larger scale changes in the ecology of the
species, the number of Common Scoter wintering in the Horns Rev area has increased
significantly after the construction of the Horns Rev 1 wind farm, yet the proportion of the birds,
which use the wind farm for feeding has remained at a low level. The mean abundance post-
construction at Horns Rev 1 and 2 reported by Petersen et al. (2014) was 13,193 birds less than
pre-construction within the wind farms and a buffer zone of 2 km around the outer turbines. It is
therefore most likely that the assumption of no habituation is realistic for the Sejerø wind farm.
The displacement scenarios were analysed using the existing boundaries of the distribution
models applied during the EIA. The choice of using the existing model boundaries was driven by
the fact that the model domain represented all the primary waterbird habitats in Sejerø Bugt,
including the shallows around Røsnæs and Sjællands Odde. Obviously, the estimates of
density-dependent mortality are sensitive to the size of the area within which displaced birds
relocate. Based on satellite telemetry of Common Eiders in Fehmarnbelt, FEBI (2013) average
home ranges of 606±663 km2 (±SD) was found. Distances between Common Eider weekly
location fixes, were rather small during the wintering season averaging at 13.2±14.3 km (±SD).
Based on inspection of moving trajectories and relocation distances, 11 out of 13 tagged
Common Eiders, which were followed during the entire wintering season, used only one or two
discrete wintering sites, one bird used three sites, and none of these individuals commuted
regularly between these sites. In addition to satellite telemetry, Common Eiders were also
tracked using GPS data loggers, which further demonstrated relatively short movement
distances (average 9.7±7.7 km (±SD)). Data from Eiders tagged with GPS-transmitters during
the baseline investigations in relation to Smålandsfarvandet OWF (Zydelis & Heinänen 2014b)
reiterated the pattern of short-range movements of the species in the wintering areas. From
these empirical data, which represent the best available knowledge of the home ranges of
wintering seaducks in Danish waters, it is reasonable to judge that the size of the model area
(roughly 1350 km2) exceeds the size of the expected home range for the three target species of
seaducks. Although no sensitivity tests have been undertaken, it is safe to assess that using a
smaller model area comparable to the home range of the species would have resulted in higher
displacement-related mortality rates as densities would increase above the level in the current
scenarios. It is therefore likely that the use of the model has underestimated the displacement
effects on the seaducks, although the application of a conservative 2 km buffer zone and
avoidance rates may have resulted in a more balanced assessment of the effect on the
Common Eider. The size of the model area is therefore judged as a suitable range on which to
base the displacement scenarios for these two species of seaducks, albeit the resulting mortality
may have been slightly underestimated for Common and Velvet Scoter.
The 75% and 50% avoidance rates applied for the wind farm perimeter and buffer zones have
been based on expert judgements in view of the observed and potential flush distances and
movement patterns for the three seaduck species, and would necessarily change if different
sizes of zones were used. Petersen et al. (2014) documented an avoidance rate for staging

Effect on integrity of affected SPAs
53
Common Scoter in the Horns Rev 2 OWF of approximately 40% in the wind farm, 20% at 2 km
distance, 10% at 4 km distance and 5% at 5 km distance. Skov et al. (2012a) reported a higher
degree (> 75%) of avoidance of flying Common Scoter within the Horns Rev 2 wind farm.
Application of the avoidance rates reported for staging Common Scoter using buffer distances of
up to 6 km may result in different displacement figures, but as the size of the buffer zone would
be much larger (approximately 4x) the overall level of displacement may not be substantially
different. Concluding, the applied avoidance rates should most likely be regarded as reflecting
the most suitable species-specific avoidance rates for the chosen zones.
The relocation of displaced seaducks was constrained to areas of similar suitability. This rule is
consistent with the perceived patchy distribution of prey (molluscs) and high competition for food
in seaduck communities during the non-breeding season. Inter-specific competition and food
supply result in patchiness with the less competitive individuals dispersed in the periphery of
good food patches in areas of lower suitability. The patchy distribution of food is mirrored in the
distribution of all three species of seaducks both in the Inner Danish waters as well as in the
Baltic Sea as a whole (Petersen & Nielsen 2011, Skov et al. 2011). Thus, the rule of
displacement within areas of similar suitability is most likely reflecting realistic scenarios.
The rate of density-dependent mortality of 2.5% following 1% increase in densities of seaducks
after displacement was applied to numbers of Common Scoters present in Sejerø Bugt during
the 1.5-month period in spring, although the original study of Oystercatchers in the Exe Estuary
was related to the winter season of 3-4 months (Durell et al. 2000, 2001). Despite the spring
season being shorter and day length longer this rate was still regarded as appropriate due to the
expected reduction in available food supply (due to predation by seaducks and other predators)
and increased competition for food during the spring period. Investigations of diving activities in
wintering Common Eiders in Fehmarn Belt revealed an increase in diving activity by 100%
between the early part of winter and spring (FEBI 2013). Similar studies on seasonal changes in
feeding behaviour of scoters are not available, but the precautionary principle would entail
transferring the data on Common Eiders to scoters, in which case the rate of density-dependent
mortality of 2.5% would be appropriate, even if the estimated density-dependent mortality during
the spring period may be 25-50% lower than during the winter period. As relatively large
numbers of wintering Common Scoters (> 15,000) occur in the area relatively high density-
dependent mortality may still be present throughout the winter period.
The baseline mortality applied in the calculations of density-dependent mortality relied on
published data on adult mortality, even though young birds also occur in the seaduck
communities and may suffer a higher natural mortality than adult birds. However, following the
breeding season, the average proportion of first year juveniles in duck species is quite low and
generally around 15% (Flint 2015). Accordingly, the natural mortality of seaducks in Sejerø Bugt
would only have been slightly under-estimated.
The species distribution models developed during the EIA formed the basis for estimation of
changes in densities because of displacement from the wind farm. Thus, the confidence of the
distribution models has been vital for the overall confidence of the assessment. Confidence of
the distribution models was rated in relation to both the explanatory and predictive power of
each model (Zydelis & Heinänen 2014a). The models were trained on data spanning 10 years of
waterbird surveys, including NOVANA and the baseline surveys. As the models included habitat
as well as pressure factors affecting the distribution of the three seaduck species they were
capable of generalising seaduck distributions along both environmental and time gradients. The
predictive ability of the models was good with AUC values >0.80, indicating that the models
were good at distinguishing between presence and absence. Further, the total numbers
predicted for the survey segments matched the observed numbers in the same segments very
closely and the correlation between observed and predicted abundance ranged between 0.27
(Velvet Scoter) to 0.39 (Common Eider and Common Scoter) indicating that the models were
also good at predicting numbers of the right order (Zydelis & Heinänen 2014a). The explanation
degree (deviance explained) ranged between 22.3 and 38.0 % and the responses to the
environmental variables (response curves) were in accordance with the knowledge we have

54 rogc-s-ra-000285 4 sejerø appropriate assessment birds_19 may 2015_renset.docx / hsk / 2014-03-17
regarding seaduck distributions indicating that the explanatory ability by the models was also
good. The waterbird models showed a highly stable use of Sejerø Bugt by Common and Velvet
Scoter and Common Eider. Hence, predicted distributions should be regarded as very robust.
The observed numbers of waterbirds used as input to the models are shown in Zydelis &
Heinänen (2014a) and the model predictions for each of the surveys in Sejerø Bugt are shown
in Appendix A.
13.1.5 Synthesis
Despite the uncertainties discussed above a range of the most realistic effects due to density
dependent mortality of the target species of seaducks on account of the Sejerø Bugt OWF in
combination with existing wind farms can be assessed. The estimates of displacement related
effects show that the planned Sejerø Bugt OWF together with existing wind farms may cause a
small to moderate level of additive mortality of Common Eider and Velvet Scoter which can be
sustained by the current populations. With regards to Common Scoter, however, a high
proportion of the SPA population will suffer additive annual mortality both in relation to
construction of best and worst cases of the Sejerø Bugt OWF. In combination with the mortality
from existing offshore wind farms, the additive mortality of Common Scoter is estimated
between 67% and 70%, The PBR threshold for Common Scoter has not taken a number of
anthropogenic mortality factors like factors associated with climate changes and reduced
eutrophication into account. In addition, the home range of the birds may be about half the size
of the model extent used for the displacement scenarios. Accordingly, the estimated additive
mortality may be slightly underestimated and the PBR threshold slightly overestimated. On the
conservative note, the estimation of density-dependent mortality has been based on the
abundance and distribution of Common Scoter during the short spring period when much larger
numbers occur in Sejerø Bugt as compared to the mid-winter period. As density-dependent
mortality of Common Scoters is still likely to occur throughout winter, the mortality is probably
only slightly over-estimated. In light of the above, the level of density-dependent mortality
induced by the Sejerø wind farm and existing wind farms may not currently be sustained by the
biogeographic population.
This means that although Common Scoters are recruited from a vast area of Fennoscandia and
western Russia the population may not be able to compensate fully from the wind farm related
mortality and the population using the SPA will most likely suffer a long-term decline, the size
will depend on the overall trend of the population wintering in NW Europe. Here, it should be
mentioned that although the species is classified by Wetlands International and AEWA as
suffering a long-term decline the minimum population figure applied in the estimation of the PBR
threshold (361,000) is most certainly underestimated. However, the best available estimate of
the size of the flyway population is still 550,000, as concurrent surveys of the numbers of
Common Scoters wintering in the Baltic and North Seas have not been undertaken since 1993.
Accordingly, precautionary assessment of the density dependent mortality of Common Scoter
related to Sejerø Bugt OWF and existing wind farms would be that adverse effects on the
integrity of the SPA Sejerø Bugt og Nekselø (DK005X094) may be pertinent with negative
effects on the conservation objectives of the SPA. Apart from these effects, the Sejerø Bugt
OWF farm is not estimated to affect the integrity of the SPA in relation to other bird species on
the designation basis.
If Sejerø OWF would be developed to 150 MW the additive mortality of Common Scoter with the
existing wind farms will be equivalent to 60.7%-63.2% of PBR, and if developed to 100 MW the
mortality will be equivalent to 54.5%-56.1% of PBR. Hence, a precautionary assessment would
entail that a reduction of the project to 100 MW would be required to achieve a level of impact
which would clearly be below a level which could be sustained by the Common Scoter
population.
In combination with the planned Smålandsfarvandet OWF cumulative mortality of Velvet Scoter
and Common Eider will be of similar magnitude to the mortality induced by Sejerø Bugt and

Effect on integrity of affected SPAs
55
existing wind farms, and may be sustained by the populations of these species. The cumulative
mortality for Common Scoter, however, will be unsustainable, and hence adverse affects on the
integrity of the site cannot be discounted. Cumulative impacts below a critical level would not be
achieved even if the capacity of Smålandsfarvandet OWF was reduced to 100 MW or an area of
22 km2 (irrespective of lay-out and location). This area would constitute 50% of the
Smålandsfarvandet wind farm area, yet the cumulative impact in terms of additive mortality of
Common Scoter and assuming an even distribution of Common Scoters at the site would be
87% of PBR.
The possible project of Omø Syd Windfarm may result in displacements of seaducks at the
same magnitude as estimated for Smålandsfarvandet. Thus, the cumulative impacts on the SPA
will be twice the cumulative impacts described above for Sejerø Bugt and Smålandsfarvandet
OWFs.
Although the estimated cumulative displacement related mortality points at possible adverse
cumulative effects of the wind farm development on the integrity of the SPA, the uncertainties
mentioned above warrant further considerations and simulations in order to quantify the exact
range of outcomes in terms of additive mortality and long-term population development of the
three species of seaducks in the SPA. This is especially relevant for Common Scoter, both due
to the significance of the estimated impacts on this species, and due to the uncertainties
regarding the current size of the biogeographic population.

56 rogc-s-ra-000285 4 sejerø appropriate assessment birds_19 may 2015_renset.docx / hsk / 2014-03-17
14 References
/1/ Alisauskas, R. T., J. J. Traylor, C. J. Swoboda, and F. P. Kehoe. 2004. Components of
population growth rate for White-winged Scoters in Saskatchewan, Canada. Animal
Biodiversity and Conservation 27.1:451-460.
/2/ Bellebaum, J., A. Diederichs, J. Kube, A. Schulz & G. Nehls. 2006. Flucht-und
Meidedistanzen überwinternder Seetaucher und Meeresenten gegenüber Schiffen auf
See. Ornithologischer Rundbrief Mecklenburg-Vorpommern 45: 86–90.
/3/ Bevanger, K. et al. 2009. Pre-and post-construction studies of conflicts between birds and
wind turbines in coastal Norway. NINA Report no. 505. 70 pp.
/4/ Bio-Consult a/s 2000. Sejerø Bugt og Kalundborg Fjord 2000. Kortlægning af vegetation
og blåmuslinger. Notat udarbejdet for Vestsjællands Amt.
/5/ BirdLife International 2014. IUCN Red List for birds. Downloaded from
http://www.birdlife.org on 13/10/2014.
/6/ Christensen, T.K. & Hounisen, J.P. 2014. Managing hunted populations through sex-
specific season lengths: a case of Common Eider in the Baltic-Wadden Seas flyway
population. Eur J Wildl Res 60: 717-726.
/7/ Cook, A.S.C.P., Humphreys, E.M., Masden, E. A. & Burton, N.H.K. 2014. The avoidance
rates of collision between birds and offshore turbines. BTO Research Report No. 656.
/8/ Desholm, M. 2006. Wind farm related mortality among avian migrants – a remote sensing
study and model analysis. PhD thesis, University of Copenhagen. 127 pp.
/9/ Desholm, M., Fox, A.D., Beasley, P. & Kahlert, J. 2006. Remote techniques for counting
and estimating the number of bird-wind turbine collisions at sea: a review. Ibis 148: 76-89.
/10/ Dillingham, P.W. and Fletcher, D. 2008. Estimating the ability of birds to sustain additional
human-caused mortalities using a simple decision rule and allometric relation-ships.
Biological Conservation, 141, 1783–1792.
/11/ Dorsch, M., Girardello, M., Weiß, F., Laczny, M. & Nehls, G. 2014. Horns Rev 3 Offshore
Wind Farm. Technical report no. 9. Resting Birds. Report commissoned by Energinet.dk.
/12/ Durell, S. E. A. Le V. dit, Goss-Custard, J. D., Stillman, R. A. and West, A. D. 2001. The
effect of weather and density dependence on oystercatcher Haematopus ostralegus
winter mortality. Ibis 143: 498-499.
/13/ Durell, SEA. Le V. dit, Goss-Custard, J.D., Clarke, R.T. & McGrorty, S. 2000. Density-
dependent mortality in Oystercatchers Haematopus ostralegus. lbis 142: 132-138.
/14/ Durinck, J., Skov, H., Jensen, F.P. & Pihl, S. 1994. Important Marine Areas for Wintering
Birds in the Baltic Sea. EU DG XI research contract no. 2242/90-09-01. Ornis Consult
report.
/15/ EC 2000. European Commission. MANAGING NATURA 2000 SITES. The provisions of
Article 6 of the ‘Habitats’ Directive 92/43/EEC. ISBN 92-828-9048-1.
/16/ FEBI 2013. Fehmarnbelt Fixed Link EIA. Bird Investigations in Fehmarnbelt – Baseline.
Volume II. Waterbirds in Fehmarnbelt. Report No. E3TR0011. 529 pages.
/17/ Flint, P. L. 2015. Population dynamics of sea ducks: Using models to understand the
causes, consequences, evolution, and management of variation in life history

References
57
characteristics. Pages 59-88 in Ecology and Conservation of North American Sea Ducks
(J-P.L. Savard, D.V. Derksen, D. Esler, and J.M. Eadie, eds.). Studies in Avian Biology.
/18/ Fox, A.D. 2003. Diet and habitat use of scoters Melanitta in the Western Palearctic – a
brief overview. Wildfowl 54:163-182.
/19/ GEUS 2015. Digitalt kort over Havbundssedimenter omkring Danmark 1:250.000.
http://data.geus.dk/geusmap/?mapname=marta#zoom=1.8284069781749936&lat=62250
00&lon=557500&visiblelayers=Topografisk&filter=&layers=sediment_250000_eng&mapn
ame=marta&filter=&epsg=25832&mode=map&map_imagetype
/20/ Goss-Custard, J.D. & Durell, SEA. Le V. dit 1984. Winter mortality of adult oystercatchers
on the Exe estuary. Wader Study Group Bull. 40: 37-38.
/21/ Hario, M. & Rintala, J. 2009. Age of first breeding in the Common Eider Somateria m.
mollissima population in the northern Baltic Sea. Ornis Fennica 86:81–88.
/22/ IUCN 2013. The IUCN Red List of Threatened Species. Version 2014.2.
<http://www.iucnredlist.org>. Downloaded on 24 July 2014.
/23/ Kahlert, J., Petersen, I.K. & Desholm, M. 2007. Effects on birds of the Rødsand 2 offshore
wind farm: Environmental Impact Assessment. Report commissioned by DONG Energy.
National Environmental Research Institute University of Aarhus – Denmark.
/24/ Krijgsveld, K.L., Fijn, R.C., Japink, M., van Horssen, P.W., Heunks, C., Collier, M.P., Poot,
M.J.M., Beuker, D., Dirksen, S. (2011). Effect Studies Offshore Wind Farm Egmond aan
Zee: Flux, flight altitude and behaviour of flying birds. Report nr.: 10-219 /
OWEZ_R_231_T1_20111110_flux&flight. Commissioned by NoordzeeWind. Bureau
Waardenburg bv, The Netherlands.
/25/ Madsen, F.J. 1954. On the food habits of the Diving Ducks in Denmark. Danish Rev. of
Game Biol, 2: 157-266.
/26/ Milner-Gulland, E.J. & Akçakaya, H.R. 2001. Sustainability indices for exploited
populations under uncertainty. Trends in Ecology and Evolution 16, 686-692.
/27/ Naturplanlægning og Biodiversitet, Naturstyrelsen. 2011. Vejledning til bekendtgørelse nr.
408 af 1. maj 2007 om udpegning og administration af internationale
naturbeskyttelsesområder samt beskyttelse af visse arter. Naturstyrelsen, Miljøministeriet.
/28/ Naturstyrelsen 2011. Natura 2000-plan 2010-2015. Sejerø Bugt, Saltbæk Vig, Bjergene
og Bollinge Bakke. Natura 2000-område nr. 154. Habitatområde H135, H244.
Fuglebeskyttelsesområde F94, F99.
/29/ Niel, C. and Lebreton, J.D. 2005. Using demographic invariants to detect over-harvested
bird populations from incomplete data. Conservation Biology, 19, 826–835.
/30/ Petersen, I.K. & Nielsen, R.D. 2011. Abundance and distribution of selected waterbird
species in Danish marine areas. Report commissioned by Vattenfall A/S. National
Environmental Research Institute, Aarhus University, Denmark. 62 pp.
/31/ Petersen, I.K., Nielsen, R.D. & Mackenzie, M.L. 2014. Post-construction evaluation of bird
abundances and distributions in the Horns Rev 2 offshore wind farm area, 2011 and
2012. Report commissioned by DONG Energy. Aarhus University, DCE – Danish Centre
for Environment and Energy. 51 pp.
/32/ Petersen, I.K., Christensen, T.K., Kahlert, J., Desholm, M. & Fox, A.D. 2006 Final results
of bird studies at the offshore wind farms at Nysted and Horns Rev, Denmark. Report

58 rogc-s-ra-000285 4 sejerø appropriate assessment birds_19 may 2015_renset.docx / hsk / 2014-03-17
commissioned by DONG energy and Vattenfall A/S. National Environmental Research
Institute.
/33/ Pihl, S., Clausen, P., Petersen, I.K., Nielsen, R.D., Laursen, K., Bregnballe, T., Holm, T.E.
& Søgaard, S. 2013. Fugle 2004-2011. NOVANA. Aarhus Universitet, DCE – Nationalt
Center for Miljø og Energi, 188 s. - Videnskabelig rapport fra DCE - Nationalt Center for
Miljø og Energi nr. 49. http://www.dmu.dk/Pub/SR49.pdf
/34/ R Development Core Team. 2004. A language and environment for statistical computing.
R Foundation for Statistical Computing, Vienna, Austria. http://www.R-project.org
/35/ Rambøll 2014a. ROGC-S-RA-000118 4. Sejerø Bugt Offshore Wind Farm. Flora and
Fauna.
/36/ Rambøll 2014b. ROGC-S-RA-000119. Sejerø Bugt Offshore Wind Farm. Fish
/37/ Rambøll 2012. Mejlflak havmøllepark. Resumé af vvm-redegørelsen. Rapport til Havvind
Århus Bugt (HÅB).
/38/ Schwemmer, P., B. Mendel, N. Sonntag, V. Dierschke & S. Garthe (2011): Effects of ship
traffic on seabirds in offshore waters: implications for marine conservation and spatial
planning. Ecol. Appl. 21: 1851-1860.
/39/ Skov. H et al. 2009. Anholt offshore windfarm, birds. Report commissioned by
Energinet.dk. DHI report.
/40/ Skov, H., Heinänen, S., Jensen, N., Durinck, J., & Johansen, T. 2012a. Rødsand 2
Offshore Wind Farm Post Construction. Post Construction Studies on Migrating Red
Kite/Landbirds. DHI. Report commissioned by E.ON Sweden.
/41/ Skov, H. et al. 2012b. MOPODECO. Modelling of the Potential coverage of habitat-
forming species and Development of tools to evaluate the Conservation status of the
marine Annex I habitats. TemaNord 2012:532. ISBN 978-92-893-2368-0.
http://dx.doi.org/10.6027/TN2012-532. Nordic Council of Ministers 2012.
/42/ Skov, H., Durinck, J., Leopold, M.F. & Tasker, M.L. 1995. Important Bird Areas for
seabirds in the North Sea, including the Channel and Kattegat. - BirdLife International,
Cambridge.
/43/ Skov, H., Heinänen, S., Žydelis, R., Bellebaum, J., Bzoma, S., Dagys, M., Durinck, J.,
Garthe, S., Grishanov, G., Hario, M., Kieckbusch, J.J., Kube, J., Kuresoo, A., Larsson, K.,
Luigujoe, L., Meissner, W., Nehls, H.W., Nilsson, L., Petersen, I.K., Roos, M.M., Pihl, S.,
Sonntag, N., Stock, A., Stipniece, A., Wahl, J. 2011. Waterbird populations and pressures
in the Baltic Sea. TemaNord 2011:550, Nordic Council of Ministers, Copenhagen,
Denmark. 229 p.
/44/ Skov, H., Leonhard, S.B., Heinänen, S., Zydelis, R., Jensen, N.E., Durinck, J., Johansen,
T.W., Jensen, B.P., Hansen, B.L., Piper, W., Grøn, P.N. 2012c. Horns Rev 2 Monitoring
2010-2012. Migrating Birds. Orbicon, DHI, Marine Observers and Biola. Report
commissioned by DONG Energy.
/45/ Smartwind. 2013. Review of avoidance rates in seabirds at offshore windfarms and
applicability of use in the band collision risk model. Hornsea Offshore Wind Farm, Project
One. Appendix O to the Response submitted for Deadline II.
/46/ Taylor, B.L., Wade, P.R., DeMaster, D.P., and Barlow, J. 2000. Incorporating uncertainty
into management models for marine mammals. Conservation Biology, 14, 1243–1252.
References
59
/47/ Thiel, M., Nehls, G., Bräger, S. and Meissner, J. 1992. The impact of boating on the
distribution of seals and moulting ducks in the Wadden Sea of Schleswig-Holstein Publ.
Ser. Neth. Inst. Sea Res., 20, 221-233.
/48/ Wade, P.R. 1998. Calculating limits to the allowable human-caused mortality of cetaceans
and pinnipeds. Marine Mammal Science, 14, 1–37.
/49/ Wetlands International. 2014. Waterbird Population Estimates. Retrieved from
wpe.wetlands.org
/50/ Zydelis, R. & Heinänen, S. 2014a. Sejerø Bugt Offshore Wind Farm. Birds and Bats.
Technical Background report. DHI report.
/51/ Zydelis, R. & Heinänen, S. 2014b. Smålandsfarvandet Offshore Wind Farm. Birds and
Bats. Technical Background report. DHI report.

60 rogc-s-ra-000285 4 sejerø appropriate assessment birds_19 may 2015_renset.docx / hsk / 2014-03-17
APPENDIX A – Extended pred ict ions of
densi t ies
Maps presenting predicted densities and standard errors

References
61
A Maps presenting predicted densities and standard errors
Common Eiders

62 rogc-s-ra-000285 4 sejerø appropriate assessment birds_19 may 2015_renset.docx / hsk / 2014-03-17

References
63

64 rogc-s-ra-000285 4 sejerø appropriate assessment birds_19 may 2015_renset.docx / hsk / 2014-03-17

References
65

66 rogc-s-ra-000285 4 sejerø appropriate assessment birds_19 may 2015_renset.docx / hsk / 2014-03-17
Common Scoters

References
67

68 rogc-s-ra-000285 4 sejerø appropriate assessment birds_19 may 2015_renset.docx / hsk / 2014-03-17

References
69

70 rogc-s-ra-000285 4 sejerø appropriate assessment birds_19 may 2015_renset.docx / hsk / 2014-03-17

References
71
Velvet Scoters

72 rogc-s-ra-000285 4 sejerø appropriate assessment birds_19 may 2015_renset.docx / hsk / 2014-03-17

References
73

74 rogc-s-ra-000285 4 sejerø appropriate assessment birds_19 may 2015_renset.docx / hsk / 2014-03-17

References
75