select college and career readiness … final print in... · select college and career readiness...
TRANSCRIPT
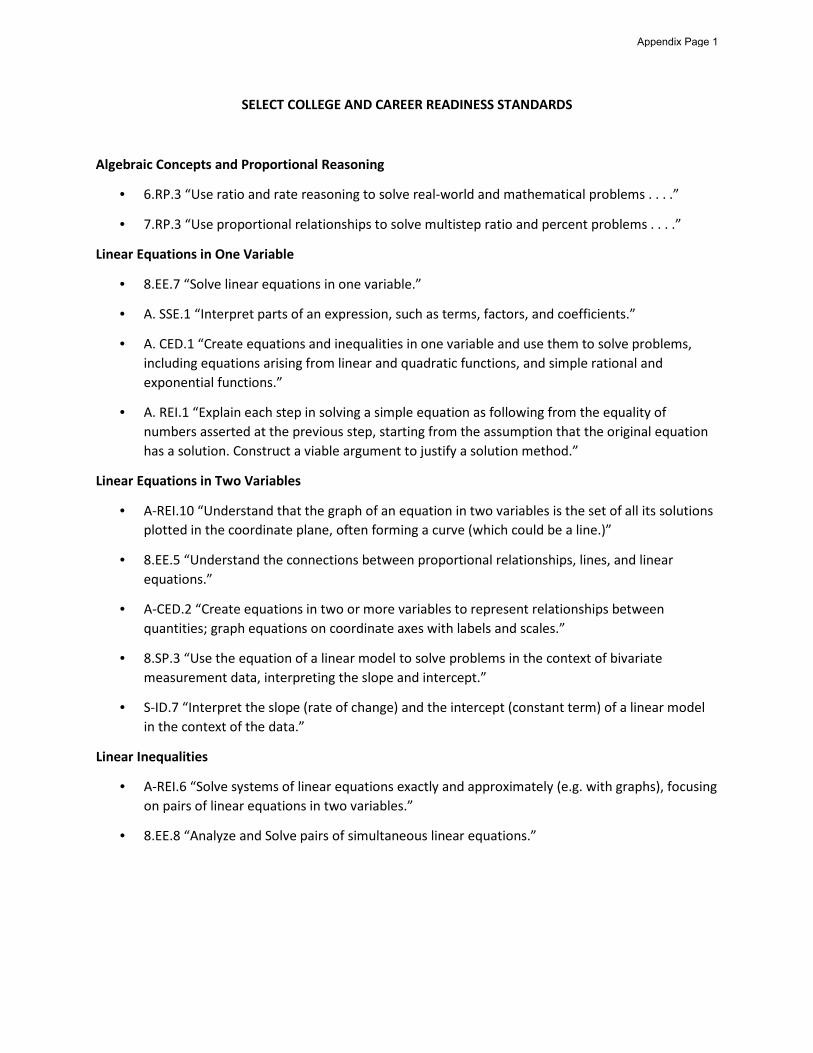
SELECT COLLEGE AND CAREER READINESS STANDARDS
Algebraic Concepts and Proportional Reasoning
• 6.RP.3 “Use ratio and rate reasoning to solve real-world and mathematical problems . . . .”
• 7.RP.3 “Use proportional relationships to solve multistep ratio and percent problems . . . .”
Linear Equations in One Variable
• 8.EE.7 “Solve linear equations in one variable.”
• A. SSE.1 “Interpret parts of an expression, such as terms, factors, and coefficients.”
• A. CED.1 “Create equations and inequalities in one variable and use them to solve problems,including equations arising from linear and quadratic functions, and simple rational andexponential functions.”
• A. REI.1 “Explain each step in solving a simple equation as following from the equality ofnumbers asserted at the previous step, starting from the assumption that the original equationhas a solution. Construct a viable argument to justify a solution method.”
Linear Equations in Two Variables
• A-REI.10 “Understand that the graph of an equation in two variables is the set of all its solutionsplotted in the coordinate plane, often forming a curve (which could be a line.)”
• 8.EE.5 “Understand the connections between proportional relationships, lines, and linearequations.”
• A-CED.2 “Create equations in two or more variables to represent relationships betweenquantities; graph equations on coordinate axes with labels and scales.”
• 8.SP.3 “Use the equation of a linear model to solve problems in the context of bivariatemeasurement data, interpreting the slope and intercept.”
• S-ID.7 “Interpret the slope (rate of change) and the intercept (constant term) of a linear modelin the context of the data.”
Linear Inequalities
• A-REI.6 “Solve systems of linear equations exactly and approximately (e.g. with graphs), focusingon pairs of linear equations in two variables.”
• 8.EE.8 “Analyze and Solve pairs of simultaneous linear equations.”
Appendix Page 1
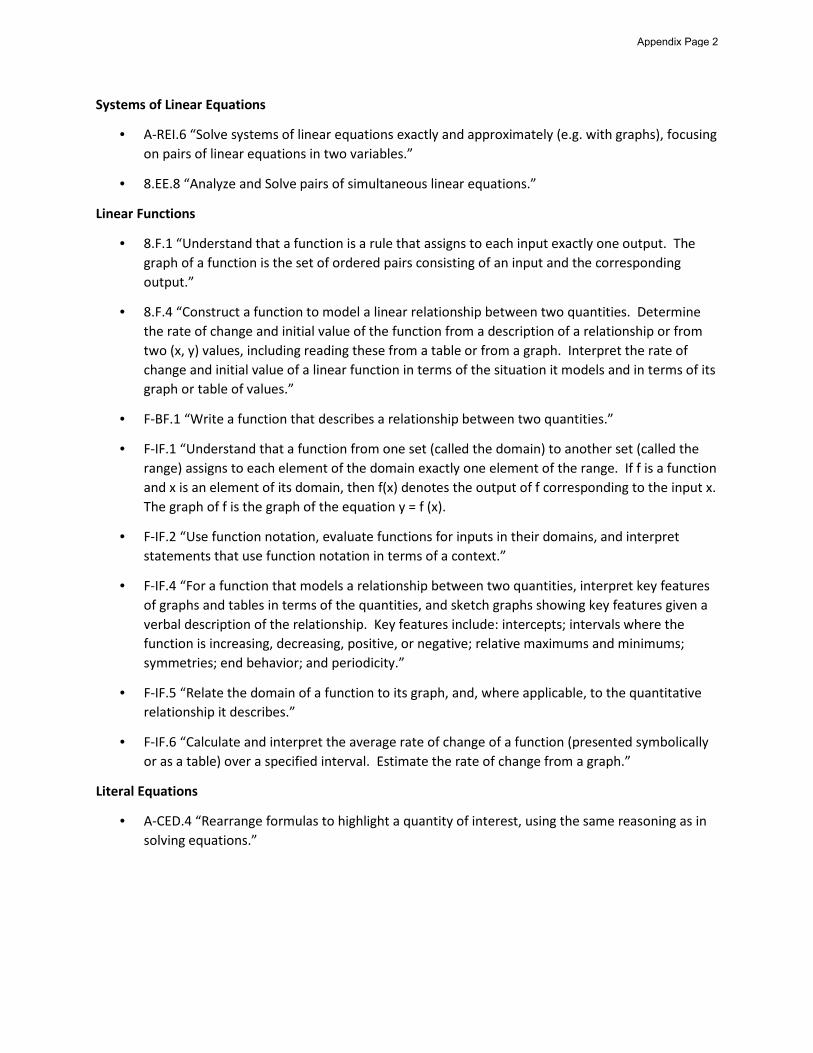
Systems of Linear Equations
• A-REI.6 “Solve systems of linear equations exactly and approximately (e.g. with graphs), focusingon pairs of linear equations in two variables.”
• 8.EE.8 “Analyze and Solve pairs of simultaneous linear equations.”
Linear Functions
• 8.F.1 “Understand that a function is a rule that assigns to each input exactly one output. Thegraph of a function is the set of ordered pairs consisting of an input and the correspondingoutput.”
• 8.F.4 “Construct a function to model a linear relationship between two quantities. Determinethe rate of change and initial value of the function from a description of a relationship or fromtwo (x, y) values, including reading these from a table or from a graph. Interpret the rate ofchange and initial value of a linear function in terms of the situation it models and in terms of itsgraph or table of values.”
• F-BF.1 “Write a function that describes a relationship between two quantities.”
• F-IF.1 “Understand that a function from one set (called the domain) to another set (called therange) assigns to each element of the domain exactly one element of the range. If f is a functionand x is an element of its domain, then f(x) denotes the output of f corresponding to the input x.The graph of f is the graph of the equation y = f (x).
• F-IF.2 “Use function notation, evaluate functions for inputs in their domains, and interpretstatements that use function notation in terms of a context.”
• F-IF.4 “For a function that models a relationship between two quantities, interpret key featuresof graphs and tables in terms of the quantities, and sketch graphs showing key features given averbal description of the relationship. Key features include: intercepts; intervals where thefunction is increasing, decreasing, positive, or negative; relative maximums and minimums;symmetries; end behavior; and periodicity.”
• F-IF.5 “Relate the domain of a function to its graph, and, where applicable, to the quantitativerelationship it describes.”
• F-IF.6 “Calculate and interpret the average rate of change of a function (presented symbolicallyor as a table) over a specified interval. Estimate the rate of change from a graph.”
Literal Equations
• A-CED.4 “Rearrange formulas to highlight a quantity of interest, using the same reasoning as insolving equations.”
Appendix Page 2
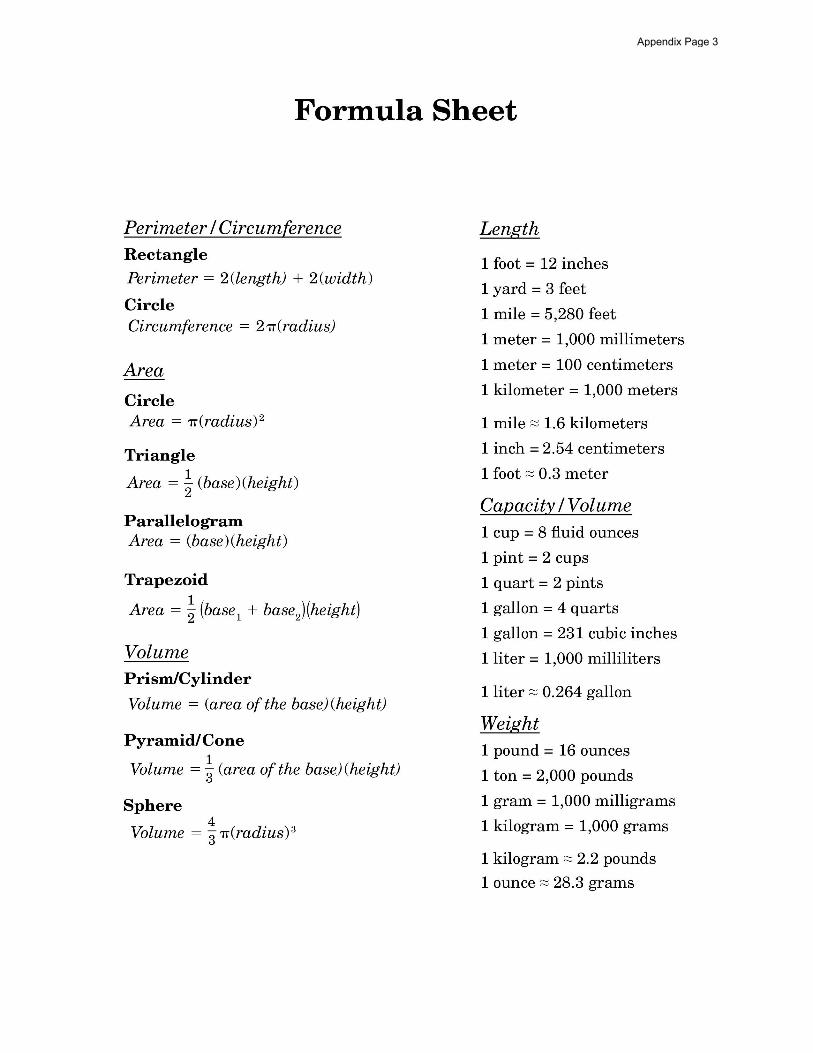
Formula Sheet
Perimeter I Circumference Rectangle Perimeter = 2(length) + 2(width)
Circle Circumference = 2TI(radius)
Area
Circle Area = TI(radius) 2
Triangle
Area = i (base)(height)
Parallelogram Area = (base)(height)
Trapezoid
Area = i (base 1 + base2 )(height)
Volume Prism/Cylinder
Volume = (area of the base) (height)
Pyramid/Cone
Volume = i (area of the base) (height)
Sphere 4
Volume = 3TI(radius) 3
Length
1 foot = 12 inches
1 yard = 3 feet
1 mile= 5,280 feet
1 meter= 1,000 millimeters
1 meter= 100 centimeters
1 kilometer= 1,000 meters
1 mile ;:::; 1.6 kilometers
1 inch= 2.54 centimeters
1 foot ;:::; 0.3 meter
Capacity I Volume 1 cup = 8 fluid ounces
1 pint = 2 cups
1 quart = 2 pints
1 gallon = 4 quarts
1 gallon = 231 cubic inches
1 liter= 1,000 milliliters
1 liter ;:::; 0.264 gallon
Weight 1 pound = 16 ounces
1 ton = 2,000 pounds
1 gram= 1,000 milligrams
1 kilogram = 1,000 grams
1 kilogram ;:::; 2.2 pounds
1 ounce ;:::; 28.3 grams
Appendix Page 3

Appendix Page 4
11
Mathematics
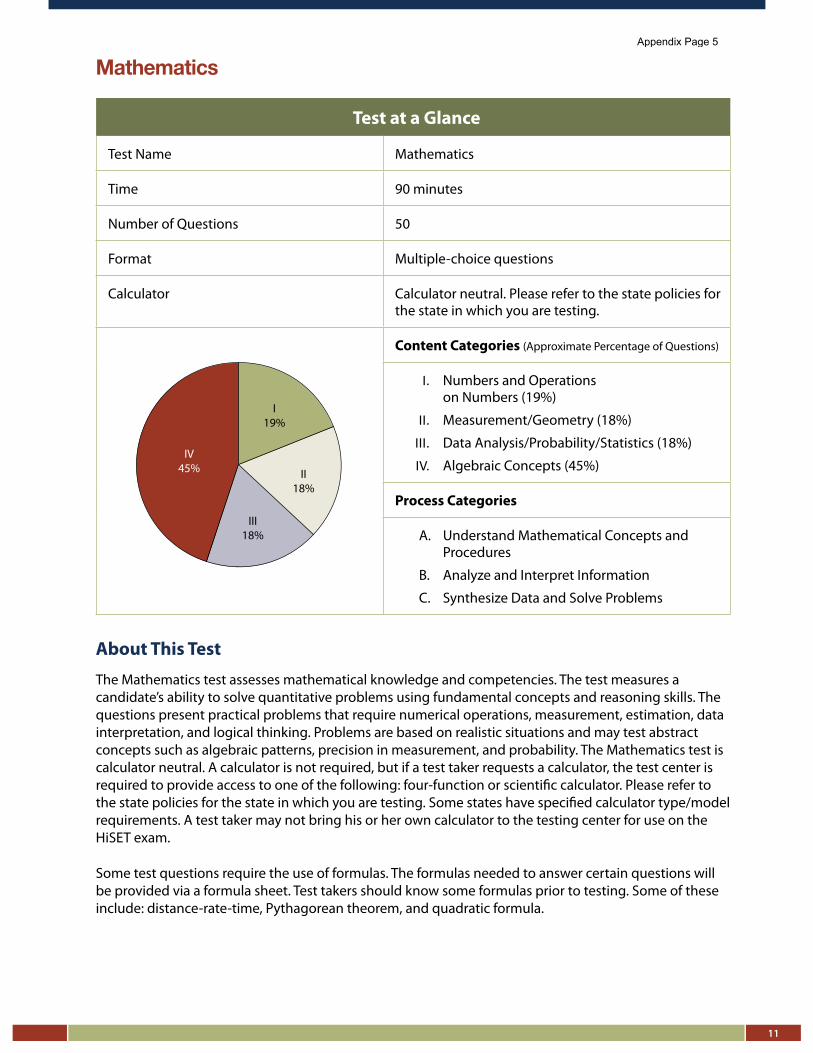
Test at a Glance
Test Name Mathematics
Time 90 minutes
Number of Questions 50
Format Multiple-choice questions
Calculator Calculator neutral. Please refer to the state policies for the state in which you are testing.
Content Categories (Approximate Percentage of Questions)
I. Numbers and Operationson Numbers (19%)
II. Measurement/Geometry (18%)
III. Data Analysis/Probability/Statistics (18%)
IV. Algebraic Concepts (45%)
Process Categories
A. Understand Mathematical Concepts andProcedures
B. Analyze and Interpret Information
C. Synthesize Data and Solve Problems
About This Test
The Mathematics test assesses mathematical knowledge and competencies. The test measures a candidate’s ability to solve quantitative problems using fundamental concepts and reasoning skills. The questions present practical problems that require numerical operations, measurement, estimation, data interpretation, and logical thinking. Problems are based on realistic situations and may test abstract concepts such as algebraic patterns, precision in measurement, and probability. The Mathematics test is calculator neutral. A calculator is not required, but if a test taker requests a calculator, the test center is required to provide access to one of the following: four-function or scientific calculator. Please refer to the state policies for the state in which you are testing. Some states have specified calculator type/model requirements. A test taker may not bring his or her own calculator to the testing center for use on the HiSET exam.
Some test questions require the use of formulas. The formulas needed to answer certain questions will be provided via a formula sheet. Test takers should know some formulas prior to testing. Some of these include: distance-rate-time, Pythagorean theorem, and quadratic formula.
III 18%
IV 45%
I 19%
II 18%
Appendix Page 5
12
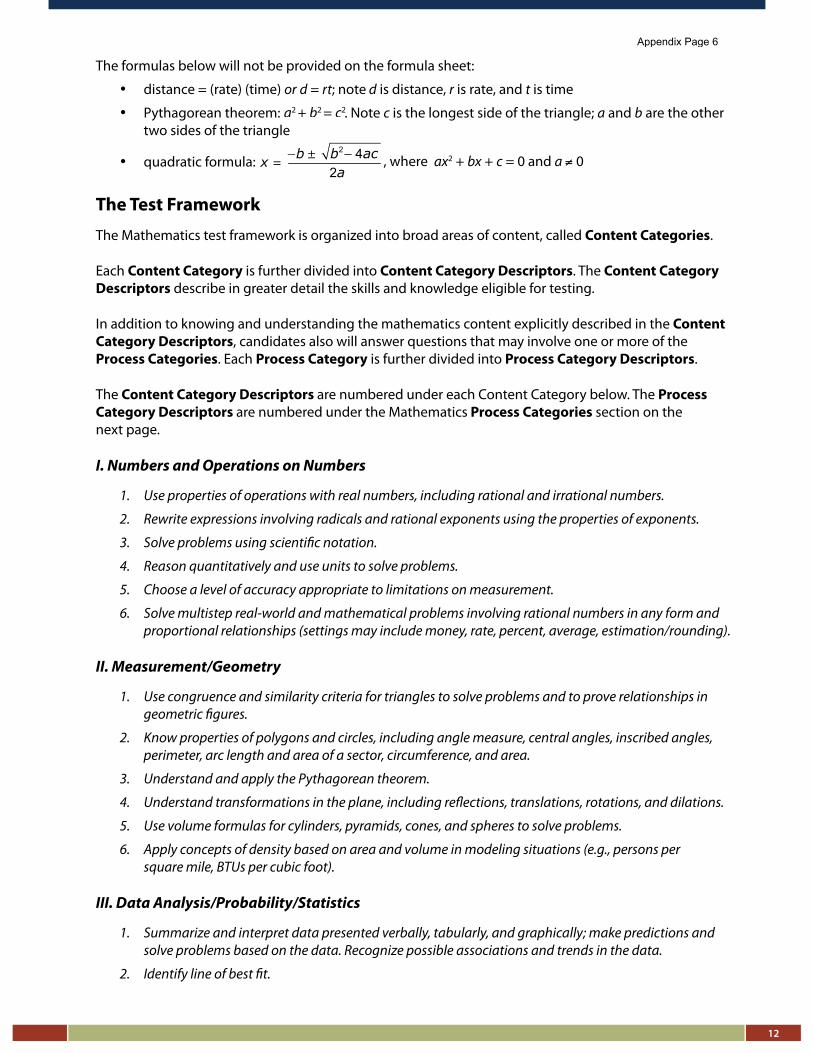
The formulas below will not be provided on the formula sheet:
• distance = (rate) (time) or d = rt; note d is distance, r is rate, and t is time
• Pythagorean theorem: . Note c is the longest side of the triangle; a and b are the other two sides of the triangle
• quadratic formula:
The Test Framework
The Mathematics test framework is organized into broad areas of content, called Content Categories.
Each Content Category is further divided into Content Category Descriptors. The Content Category Descriptors describe in greater detail the skills and knowledge eligible for testing.
In addition to knowing and understanding the mathematics content explicitly described in the Content Category Descriptors, candidates also will answer questions that may involve one or more of the Process Categories. Each Process Category is further divided into Process Category Descriptors.
The Content Category Descriptors are numbered under each Content Category below. The Process Category Descriptors are numbered under the Mathematics Process Categories section on the next page.
I. Numbers and Operations on Numbers
1. Use properties of operations with real numbers, including rational and irrational numbers.
2. Rewrite expressions involving radicals and rational exponents using the properties of exponents.
3. Solve problems using scientific notation.
4. Reason quantitatively and use units to solve problems.
5. Choose a level of accuracy appropriate to limitations on measurement.
6. Solve multistep real-world and mathematical problems involving rational numbers in any form andproportional relationships (settings may include money, rate, percent, average, estimation/rounding).
II. Measurement/Geometry
1. Use congruence and similarity criteria for triangles to solve problems and to prove relationships ingeometric figures.
2. Know properties of polygons and circles, including angle measure, central angles, inscribed angles,perimeter, arc length and area of a sector, circumference, and area.
3. Understand and apply the Pythagorean theorem.
4. Understand transformations in the plane, including reflections, translations, rotations, and dilations.
5. Use volume formulas for cylinders, pyramids, cones, and spheres to solve problems.
6. Apply concepts of density based on area and volume in modeling situations (e.g., persons persquare mile, BTUs per cubic foot).
III. Data Analysis/Probability/Statistics
1. Summarize and interpret data presented verbally, tabularly, and graphically; make predictions andsolve problems based on the data. Recognize possible associations and trends in the data.
2. Identify line of best fit.
Appendix Page 6
13
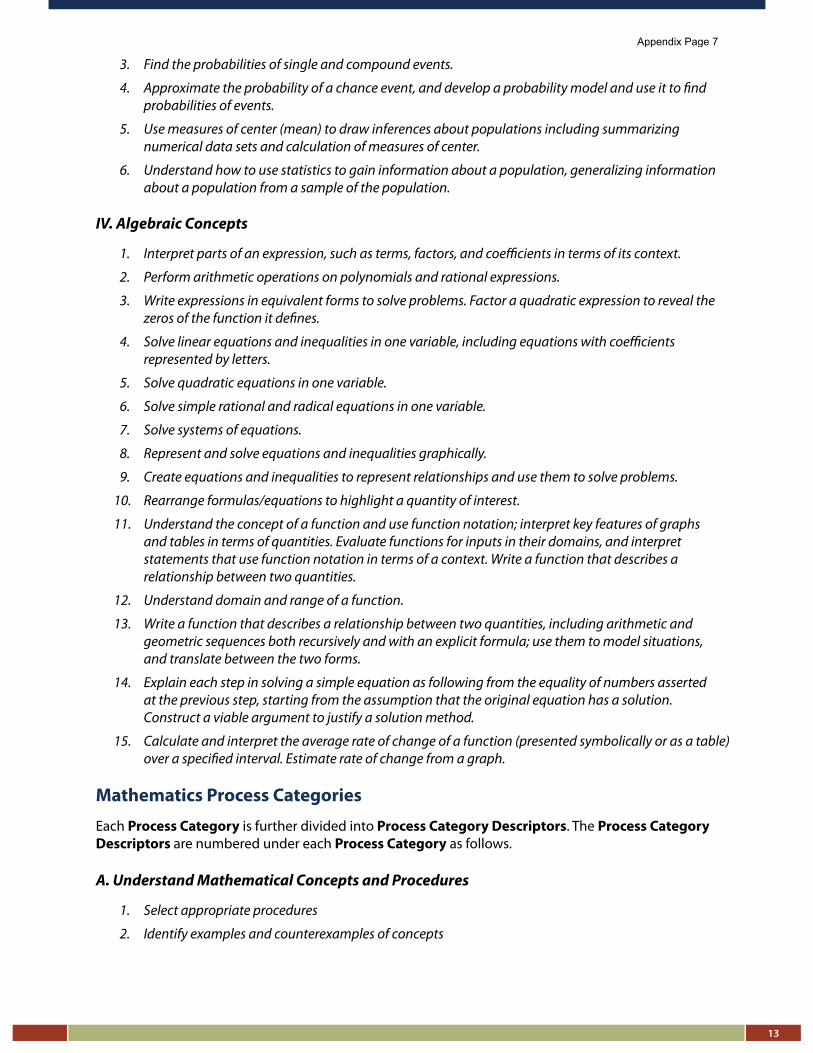
3. Find the probabilities of single and compound events.
4. Approximate the probability of a chance event, and develop a probability model and use it to find probabilities of events.
5. Use measures of center (mean) to draw inferences about populations including summarizing numerical data sets and calculation of measures of center.
6. Understand how to use statistics to gain information about a population, generalizing information about a population from a sample of the population.
IV. Algebraic Concepts
1. Interpret parts of an expression, such as terms, factors, and coefficients in terms of its context.
2. Perform arithmetic operations on polynomials and rational expressions.
3. Write expressions in equivalent forms to solve problems. Factor a quadratic expression to reveal the zeros of the function it defines.
4. Solve linear equations and inequalities in one variable, including equations with coefficients represented by letters.
5. Solve quadratic equations in one variable.
6. Solve simple rational and radical equations in one variable.
7. Solve systems of equations.
8. Represent and solve equations and inequalities graphically.
9. Create equations and inequalities to represent relationships and use them to solve problems.
10. Rearrange formulas/equations to highlight a quantity of interest.
11. Understand the concept of a function and use function notation; interpret key features of graphs and tables in terms of quantities. Evaluate functions for inputs in their domains, and interpret statements that use function notation in terms of a context. Write a function that describes a relationship between two quantities.
12. Understand domain and range of a function.
13. Write a function that describes a relationship between two quantities, including arithmetic and geometric sequences both recursively and with an explicit formula; use them to model situations, and translate between the two forms.
14. Explain each step in solving a simple equation as following from the equality of numbers asserted at the previous step, starting from the assumption that the original equation has a solution. Construct a viable argument to justify a solution method.
15. Calculate and interpret the average rate of change of a function (presented symbolically or as a table) over a specified interval. Estimate rate of change from a graph.
Mathematics Process Categories
Each Process Category is further divided into Process Category Descriptors. The Process Category Descriptors are numbered under each Process Category as follows.
A. Understand Mathematical Concepts and Procedures
1. Select appropriate procedures
2. Identify examples and counterexamples of concepts
Appendix Page 7
14
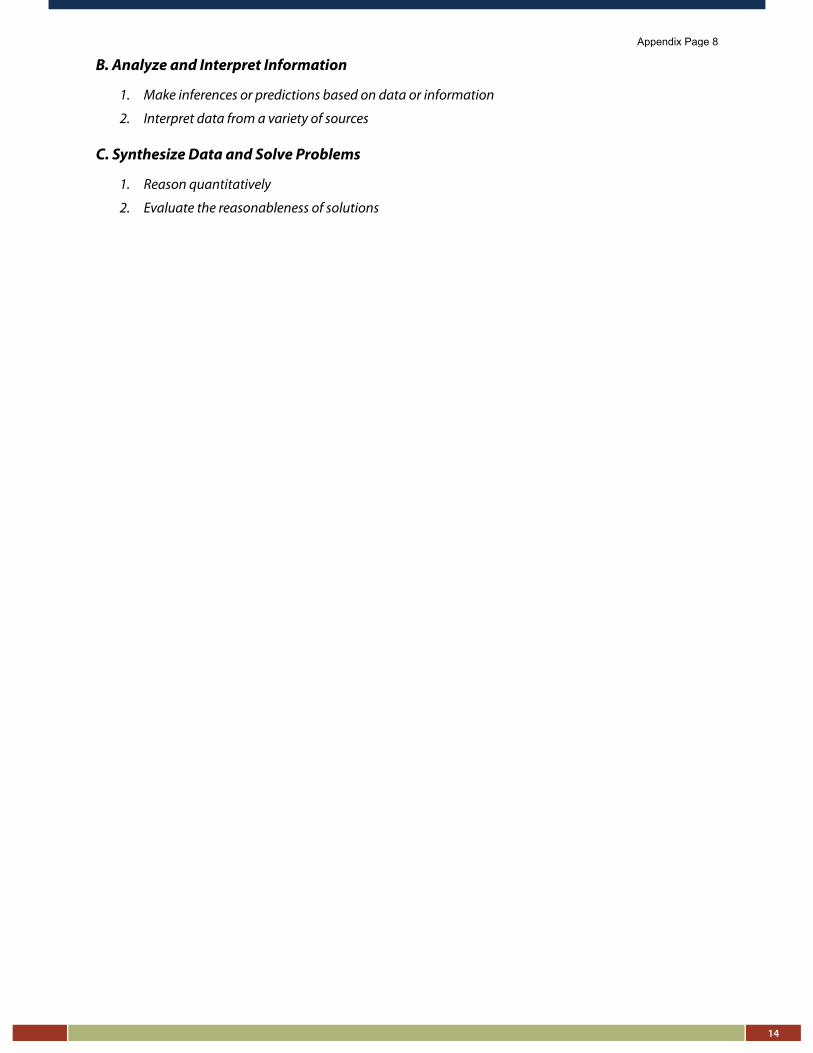
B. Analyze and Interpret Information
1. Make inferences or predictions based on data or information
2. Interpret data from a variety of sources
C. Synthesize Data and Solve Problems
1. Reason quantitatively
2. Evaluate the reasonableness of solutions
Appendix Page 8
15
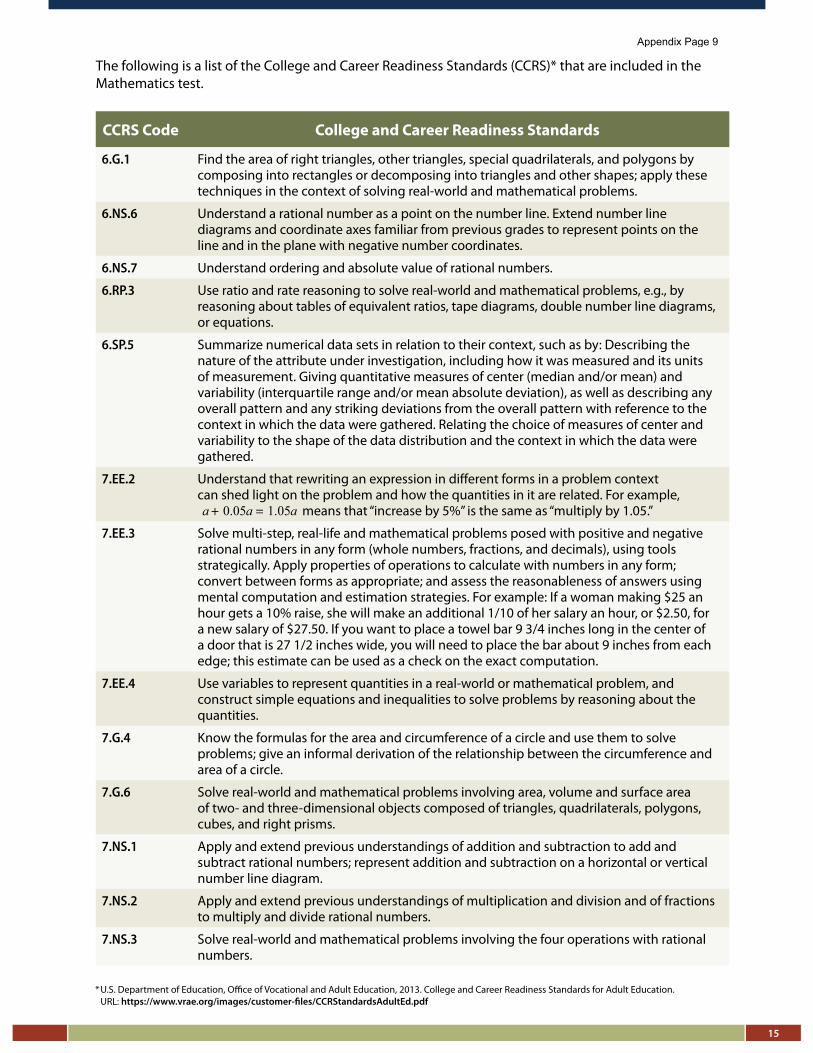
The following is a list of the College and Career Readiness Standards (CCRS)* that are included in the Mathematics test.
CCRS Code College and Career Readiness Standards
6.G.1 Find the area of right triangles, other triangles, special quadrilaterals, and polygons by composing into rectangles or decomposing into triangles and other shapes; apply these techniques in the context of solving real-world and mathematical problems.
6.NS.6 Understand a rational number as a point on the number line. Extend number line diagrams and coordinate axes familiar from previous grades to represent points on the line and in the plane with negative number coordinates.
6.NS.7 Understand ordering and absolute value of rational numbers.
6.RP.3 Use ratio and rate reasoning to solve real-world and mathematical problems, e.g., by reasoning about tables of equivalent ratios, tape diagrams, double number line diagrams, or equations.
6.SP.5 Summarize numerical data sets in relation to their context, such as by: Describing the nature of the attribute under investigation, including how it was measured and its units of measurement. Giving quantitative measures of center (median and/or mean) and variability (interquartile range and/or mean absolute deviation), as well as describing any overall pattern and any striking deviations from the overall pattern with reference to the context in which the data were gathered. Relating the choice of measures of center and variability to the shape of the data distribution and the context in which the data were gathered.
7.EE.2 Understand that rewriting an expression in different forms in a problem context can shed light on the problem and how the quantities in it are related. For example,
0.05 1.05a a a+ = means that “increase by 5%” is the same as “multiply by 1.05.”
7.EE.3 Solve multi-step, real-life and mathematical problems posed with positive and negative rational numbers in any form (whole numbers, fractions, and decimals), using tools strategically. Apply properties of operations to calculate with numbers in any form; convert between forms as appropriate; and assess the reasonableness of answers using mental computation and estimation strategies. For example: If a woman making $25 an hour gets a 10% raise, she will make an additional 1/10 of her salary an hour, or $2.50, for a new salary of $27.50. If you want to place a towel bar 9 3/4 inches long in the center of a door that is 27 1/2 inches wide, you will need to place the bar about 9 inches from each edge; this estimate can be used as a check on the exact computation.
7.EE.4 Use variables to represent quantities in a real-world or mathematical problem, and construct simple equations and inequalities to solve problems by reasoning about the quantities.
7.G.4 Know the formulas for the area and circumference of a circle and use them to solve problems; give an informal derivation of the relationship between the circumference and area of a circle.
7.G.6 Solve real-world and mathematical problems involving area, volume and surface area of two- and three-dimensional objects composed of triangles, quadrilaterals, polygons, cubes, and right prisms.
7.NS.1 Apply and extend previous understandings of addition and subtraction to add and subtract rational numbers; represent addition and subtraction on a horizontal or vertical number line diagram.
7.NS.2 Apply and extend previous understandings of multiplication and division and of fractions to multiply and divide rational numbers.
7.NS.3 Solve real-world and mathematical problems involving the four operations with rational numbers.
* U.S. Department of Education, Office of Vocational and Adult Education, 2013. College and Career Readiness Standards for Adult Education. URL: https://www.vrae.org/images/customer-files/CCRStandardsAdultEd.pdf
Appendix Page 9
16
CCRS Code College and Career Readiness Standards
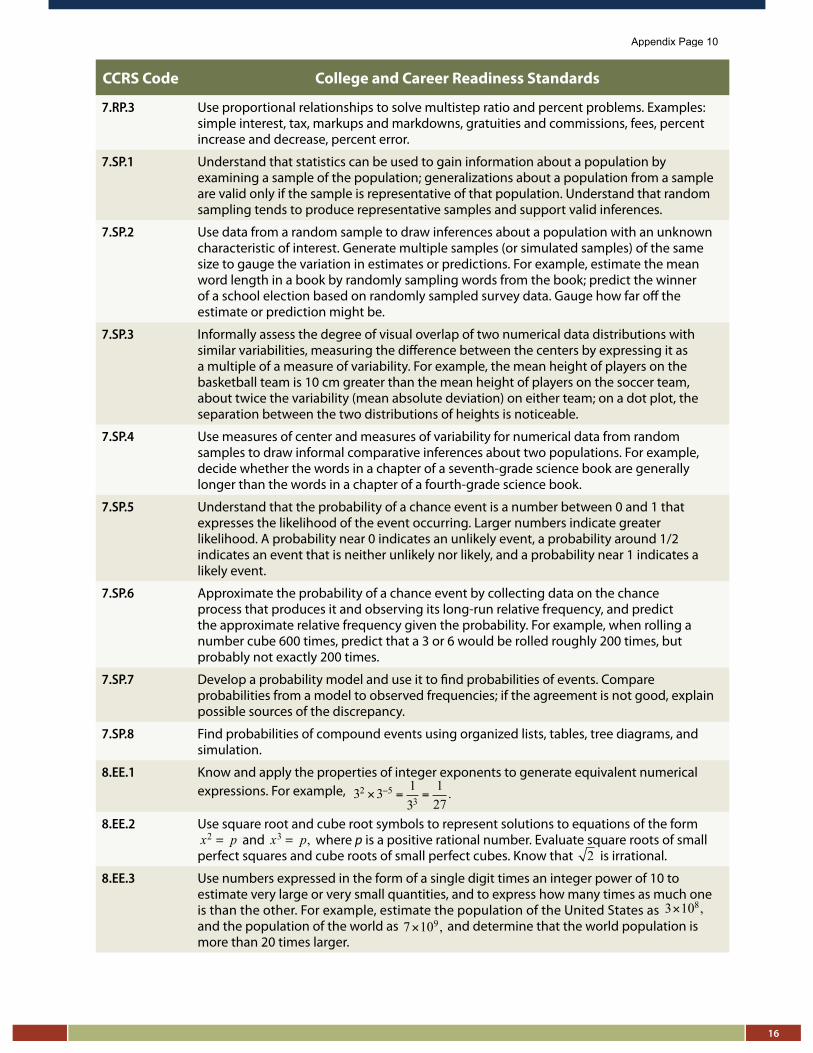
7.RP.3 Use proportional relationships to solve multistep ratio and percent problems. Examples: simple interest, tax, markups and markdowns, gratuities and commissions, fees, percent increase and decrease, percent error.
7.SP.1 Understand that statistics can be used to gain information about a population by examining a sample of the population; generalizations about a population from a sample are valid only if the sample is representative of that population. Understand that random sampling tends to produce representative samples and support valid inferences.
7.SP.2 Use data from a random sample to draw inferences about a population with an unknown characteristic of interest. Generate multiple samples (or simulated samples) of the same size to gauge the variation in estimates or predictions. For example, estimate the mean word length in a book by randomly sampling words from the book; predict the winner of a school election based on randomly sampled survey data. Gauge how far off the estimate or prediction might be.
7.SP.3 Informally assess the degree of visual overlap of two numerical data distributions with similar variabilities, measuring the difference between the centers by expressing it as a multiple of a measure of variability. For example, the mean height of players on the basketball team is 10 cm greater than the mean height of players on the soccer team, about twice the variability (mean absolute deviation) on either team; on a dot plot, the separation between the two distributions of heights is noticeable.
7.SP.4 Use measures of center and measures of variability for numerical data from random samples to draw informal comparative inferences about two populations. For example, decide whether the words in a chapter of a seventh-grade science book are generally longer than the words in a chapter of a fourth-grade science book.
7.SP.5 Understand that the probability of a chance event is a number between 0 and 1 that expresses the likelihood of the event occurring. Larger numbers indicate greater likelihood. A probability near 0 indicates an unlikely event, a probability around 1/2 indicates an event that is neither unlikely nor likely, and a probability near 1 indicates a likely event.
7.SP.6 Approximate the probability of a chance event by collecting data on the chance process that produces it and observing its long-run relative frequency, and predict the approximate relative frequency given the probability. For example, when rolling a number cube 600 times, predict that a 3 or 6 would be rolled roughly 200 times, but probably not exactly 200 times.
7.SP.7 Develop a probability model and use it to find probabilities of events. Compare probabilities from a model to observed frequencies; if the agreement is not good, explain possible sources of the discrepancy.
7.SP.8 Find probabilities of compound events using organized lists, tables, tree diagrams, and simulation.
8.EE.1 Know and apply the properties of integer exponents to generate equivalent numerical expressions. For example, 32 ×3−5 = 1
33=127.
8.EE.2 Use square root and cube root symbols to represent solutions to equations of the form 2x p= and 3 ,x p= where p is a positive rational number. Evaluate square roots of small
perfect squares and cube roots of small perfect cubes. Know that 2 is irrational.
8.EE.3 Use numbers expressed in the form of a single digit times an integer power of 10 to estimate very large or very small quantities, and to express how many times as much one is than the other. For example, estimate the population of the United States as 3×10⁸,and the population of the world as 7×10⁹, and determine that the world population is more than 20 times larger.
Appendix Page 10
17
CCRS Code College and Career Readiness Standards
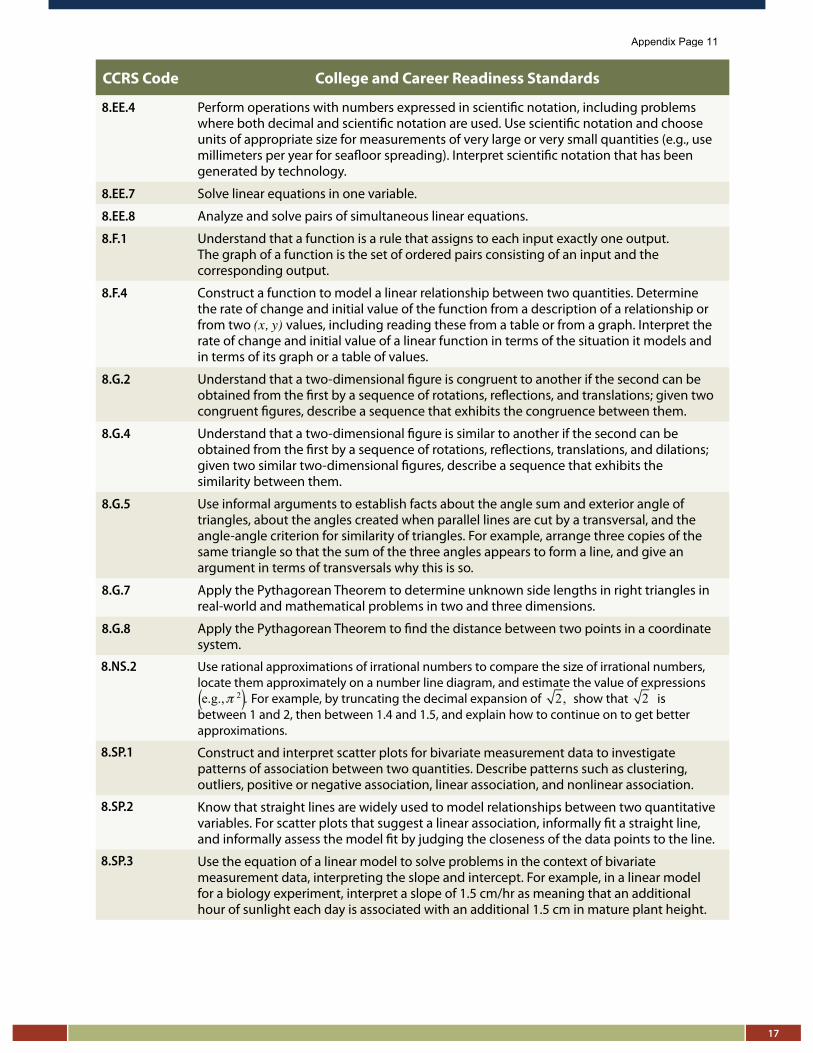
8.EE.4 Perform operations with numbers expressed in scientific notation, including problems where both decimal and scientific notation are used. Use scientific notation and choose units of appropriate size for measurements of very large or very small quantities (e.g., use millimeters per year for seafloor spreading). Interpret scientific notation that has been generated by technology.
8.EE.7 Solve linear equations in one variable.
8.EE.8 Analyze and solve pairs of simultaneous linear equations.
8.F.1 Understand that a function is a rule that assigns to each input exactly one output. The graph of a function is the set of ordered pairs consisting of an input and the corresponding output.
8.F.4 Construct a function to model a linear relationship between two quantities. Determine the rate of change and initial value of the function from a description of a relationship or from two (x, y) values, including reading these from a table or from a graph. Interpret the rate of change and initial value of a linear function in terms of the situation it models and in terms of its graph or a table of values.
8.G.2 Understand that a two-dimensional figure is congruent to another if the second can be obtained from the first by a sequence of rotations, reflections, and translations; given two congruent figures, describe a sequence that exhibits the congruence between them.
8.G.4 Understand that a two-dimensional figure is similar to another if the second can be obtained from the first by a sequence of rotations, reflections, translations, and dilations; given two similar two-dimensional figures, describe a sequence that exhibits the similarity between them.
8.G.5 Use informal arguments to establish facts about the angle sum and exterior angle of triangles, about the angles created when parallel lines are cut by a transversal, and the angle-angle criterion for similarity of triangles. For example, arrange three copies of the same triangle so that the sum of the three angles appears to form a line, and give an argument in terms of transversals why this is so.
8.G.7 Apply the Pythagorean Theorem to determine unknown side lengths in right triangles in real-world and mathematical problems in two and three dimensions.
8.G.8 Apply the Pythagorean Theorem to find the distance between two points in a coordinate system.
8.NS.2 Use rational approximations of irrational numbers to compare the size of irrational numbers, locate them approximately on a number line diagram, and estimate the value of expressions For example, by truncating the decimal expansion of 2, show that 2 is between 1 and 2, then between 1.4 and 1.5, and explain how to continue on to get better approximations.
8.SP.1 Construct and interpret scatter plots for bivariate measurement data to investigate patterns of association between two quantities. Describe patterns such as clustering, outliers, positive or negative association, linear association, and nonlinear association.
8.SP.2 Know that straight lines are widely used to model relationships between two quantitative variables. For scatter plots that suggest a linear association, informally fit a straight line, and informally assess the model fit by judging the closeness of the data points to the line.
8.SP.3 Use the equation of a linear model to solve problems in the context of bivariate measurement data, interpreting the slope and intercept. For example, in a linear model for a biology experiment, interpret a slope of 1.5 cm/hr as meaning that an additional hour of sunlight each day is associated with an additional 1.5 cm in mature plant height.
e.g.,π 2( ).
Appendix Page 11
18
CCRS Code College and Career Readiness Standards
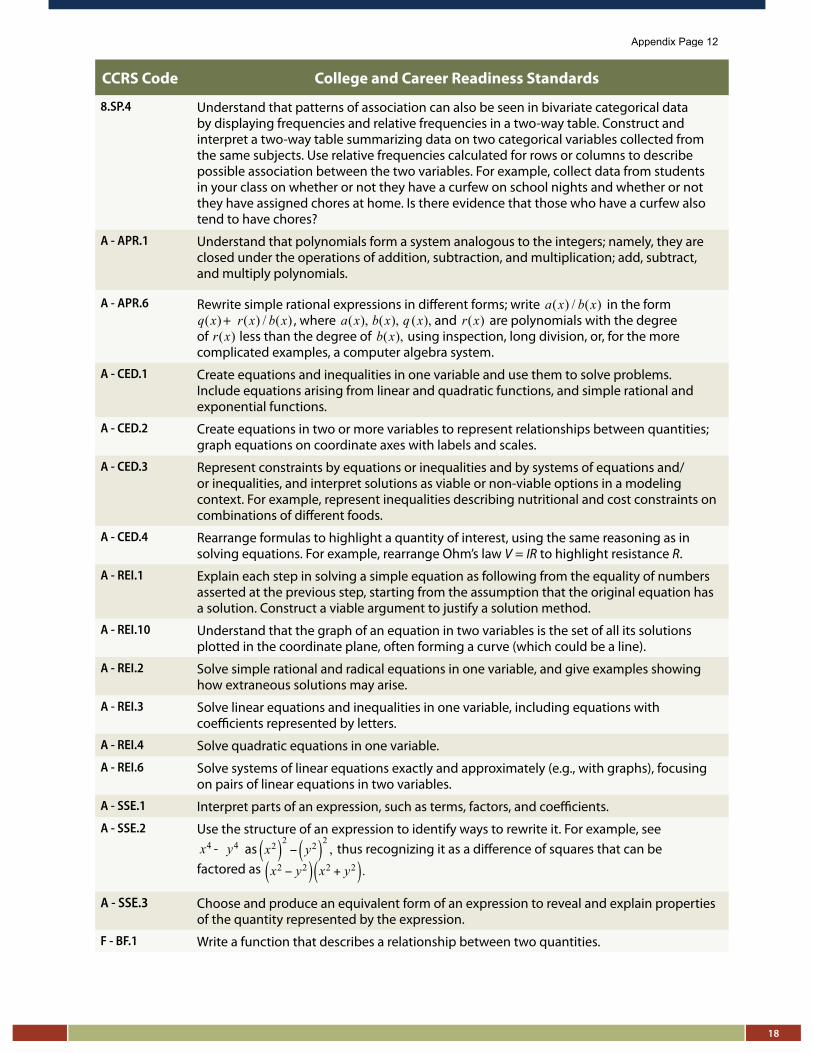
8.SP.4 Understand that patterns of association can also be seen in bivariate categorical data by displaying frequencies and relative frequencies in a two-way table. Construct and interpret a two-way table summarizing data on two categorical variables collected from the same subjects. Use relative frequencies calculated for rows or columns to describe possible association between the two variables. For example, collect data from students in your class on whether or not they have a curfew on school nights and whether or not they have assigned chores at home. Is there evidence that those who have a curfew also tend to have chores?
A - APR.1 Understand that polynomials form a system analogous to the integers; namely, they are closed under the operations of addition, subtraction, and multiplication; add, subtract, and multiply polynomials.
A - APR.6 Rewrite simple rational expressions in different forms; write ( ) / ( )a x b x in the form( ) ( ) / ( )q x r x b x+ , where ( ), ( ), ( ),a x b x q x and ( )r x are polynomials with the degree
of ( )r x less than the degree of ( ),b x using inspection, long division, or, for the more complicated examples, a computer algebra system.
A - CED.1 Create equations and inequalities in one variable and use them to solve problems. Include equations arising from linear and quadratic functions, and simple rational and exponential functions.
A - CED.2 Create equations in two or more variables to represent relationships between quantities; graph equations on coordinate axes with labels and scales.
A - CED.3 Represent constraints by equations or inequalities and by systems of equations and/or inequalities, and interpret solutions as viable or non-viable options in a modeling context. For example, represent inequalities describing nutritional and cost constraints on combinations of different foods.
A - CED.4 Rearrange formulas to highlight a quantity of interest, using the same reasoning as in solving equations. For example, rearrange Ohm’s law V = IR to highlight resistance R.
A - REI.1 Explain each step in solving a simple equation as following from the equality of numbers asserted at the previous step, starting from the assumption that the original equation has a solution. Construct a viable argument to justify a solution method.
A - REI.10 Understand that the graph of an equation in two variables is the set of all its solutions plotted in the coordinate plane, often forming a curve (which could be a line).
A - REI.2 Solve simple rational and radical equations in one variable, and give examples showing how extraneous solutions may arise.
A - REI.3 Solve linear equations and inequalities in one variable, including equations with coefficients represented by letters.
A - REI.4 Solve quadratic equations in one variable.
A - REI.6 Solve systems of linear equations exactly and approximately (e.g., with graphs), focusing on pairs of linear equations in two variables.
A - SSE.1 Interpret parts of an expression, such as terms, factors, and coefficients.
A - SSE.2 Use the structure of an expression to identify ways to rewrite it. For example, see 4 4x y- as thus recognizing it as a difference of squares that can be
factored as
A - SSE.3 Choose and produce an equivalent form of an expression to reveal and explain properties of the quantity represented by the expression.
F - BF.1 Write a function that describes a relationship between two quantities.
x2( )2− y2( )
2,
x2 − y2( ) x2 + y2( ).
Appendix Page 12
19
CCRS Code College and Career Readiness Standards
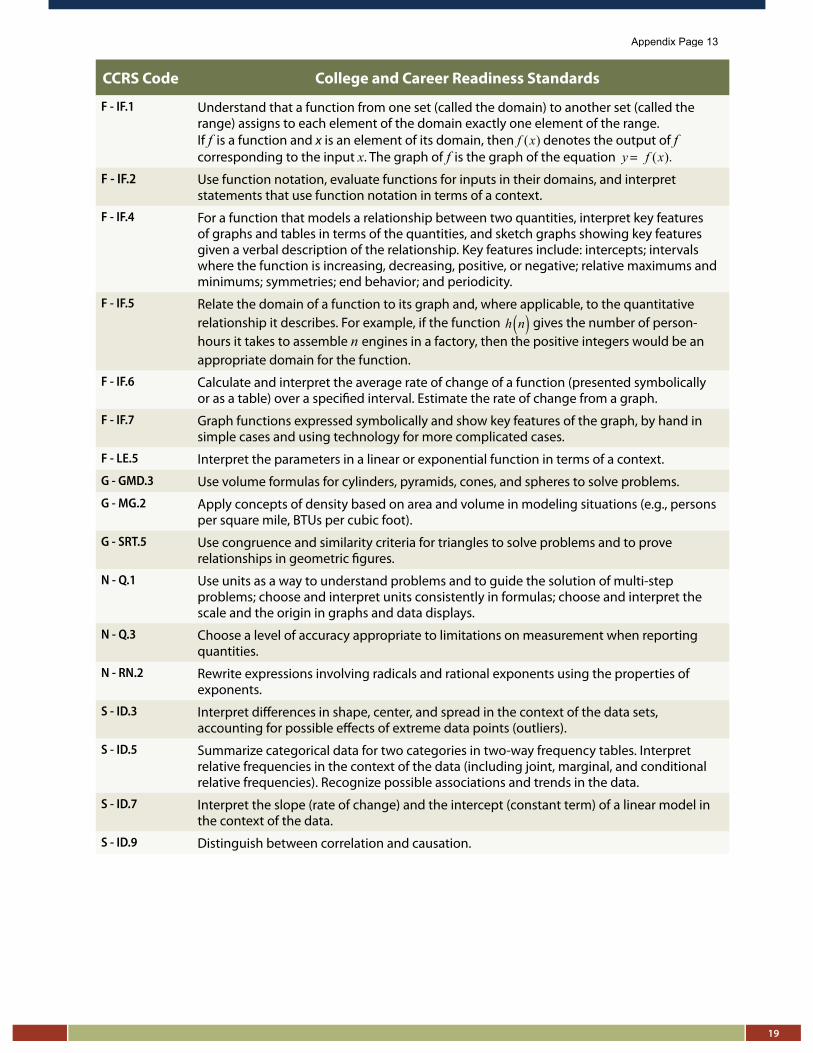
F - IF.1 Understand that a function from one set (called the domain) to another set (called the range) assigns to each element of the domain exactly one element of the range. If f is a function and x is an element of its domain, then ( )f x denotes the output of f corresponding to the input x. The graph of f is the graph of the equation ( ).y f x=
F - IF.2 Use function notation, evaluate functions for inputs in their domains, and interpret statements that use function notation in terms of a context.
F - IF.4 For a function that models a relationship between two quantities, interpret key features of graphs and tables in terms of the quantities, and sketch graphs showing key features given a verbal description of the relationship. Key features include: intercepts; intervals where the function is increasing, decreasing, positive, or negative; relative maximums and minimums; symmetries; end behavior; and periodicity.
F - IF.5 Relate the domain of a function to its graph and, where applicable, to the quantitative relationship it describes. For example, if the function gives the number of person-hours it takes to assemble n engines in a factory, then the positive integers would be an appropriate domain for the function.
F - IF.6 Calculate and interpret the average rate of change of a function (presented symbolically or as a table) over a specified interval. Estimate the rate of change from a graph.
F - IF.7 Graph functions expressed symbolically and show key features of the graph, by hand in simple cases and using technology for more complicated cases.
F - LE.5 Interpret the parameters in a linear or exponential function in terms of a context.
G - GMD.3 Use volume formulas for cylinders, pyramids, cones, and spheres to solve problems.
G - MG.2 Apply concepts of density based on area and volume in modeling situations (e.g., persons per square mile, BTUs per cubic foot).
G - SRT.5 Use congruence and similarity criteria for triangles to solve problems and to prove relationships in geometric figures.
N - Q.1 Use units as a way to understand problems and to guide the solution of multi-step problems; choose and interpret units consistently in formulas; choose and interpret the scale and the origin in graphs and data displays.
N - Q.3 Choose a level of accuracy appropriate to limitations on measurement when reporting quantities.
N - RN.2 Rewrite expressions involving radicals and rational exponents using the properties of exponents.
S - ID.3 Interpret differences in shape, center, and spread in the context of the data sets, accounting for possible effects of extreme data points (outliers).
S - ID.5 Summarize categorical data for two categories in two-way frequency tables. Interpret relative frequencies in the context of the data (including joint, marginal, and conditional relative frequencies). Recognize possible associations and trends in the data.
S - ID.7 Interpret the slope (rate of change) and the intercept (constant term) of a linear model in the context of the data.
S - ID.9 Distinguish between correlation and causation.
h n( )
Appendix Page 13

Appendix Page 14
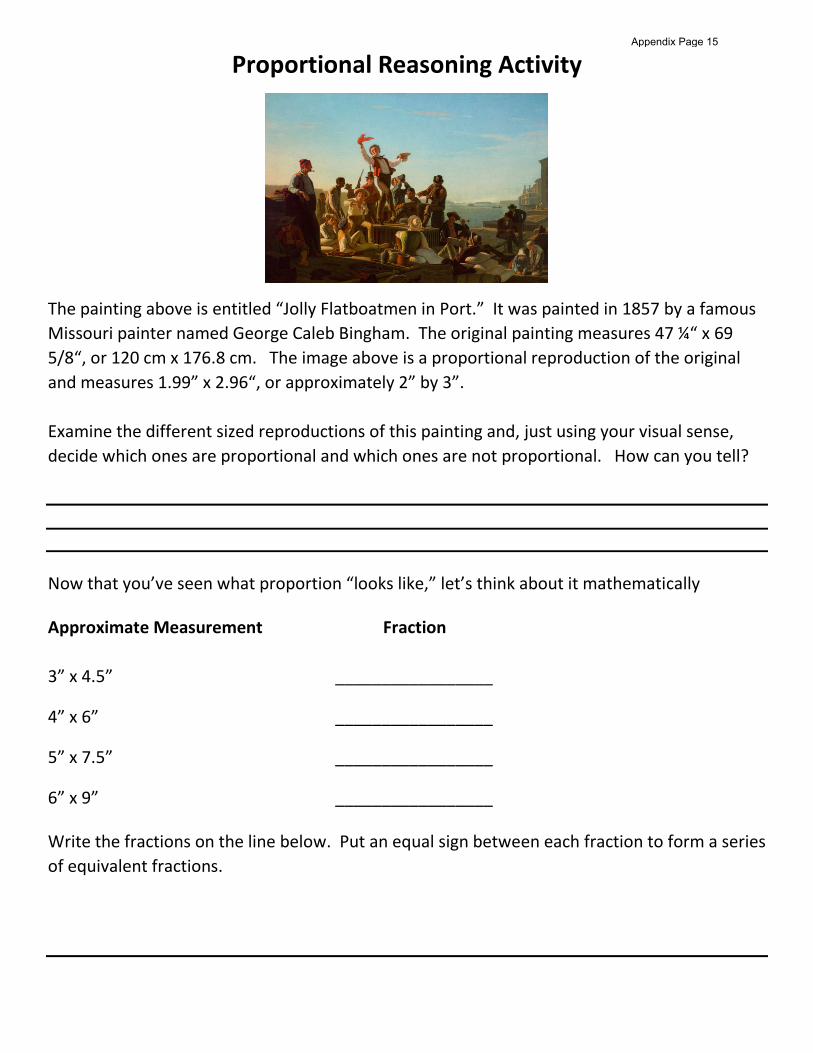
Proportional Reasoning Activity
The painting above is entitled “Jolly Flatboatmen in Port.” It was painted in 1857 by a famous Missouri painter named George Caleb Bingham. The original painting measures 47 ¼“ x 69 5/8“, or 120 cm x 176.8 cm. The image above is a proportional reproduction of the original and measures 1.99” x 2.96“, or approximately 2” by 3”.
Examine the different sized reproductions of this painting and, just using your visual sense, decide which ones are proportional and which ones are not proportional. How can you tell?
Now that you’ve seen what proportion “looks like,” let’s think about it mathematically
Approximate Measurement Fraction
3” x 4.5” _________________
4” x 6” _________________
5” x 7.5” _________________
6” x 9” _________________
Write the fractions on the line below. Put an equal sign between each fraction to form a series of equivalent fractions.
Appendix Page 15
Now look at the numbers and describe the relationship between the different ratios. Is there a pattern?
Proportion is defined as relative magnitude. What does this mean?
_____________________________________________________________________________
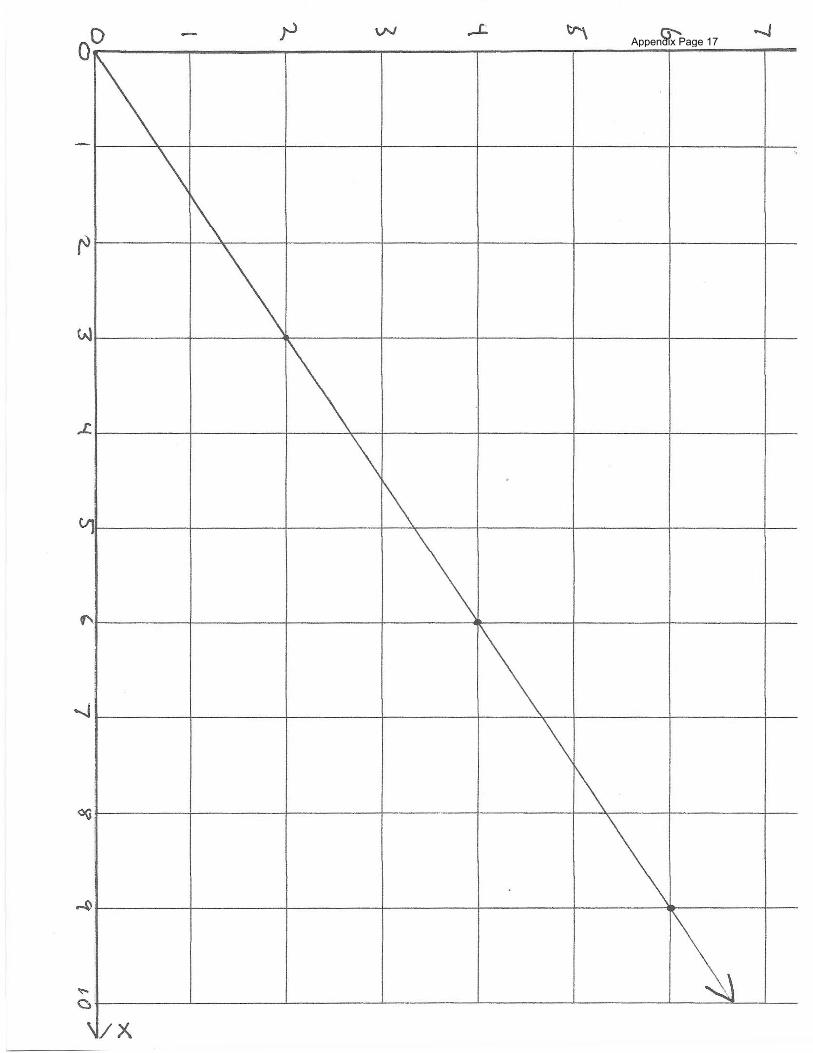
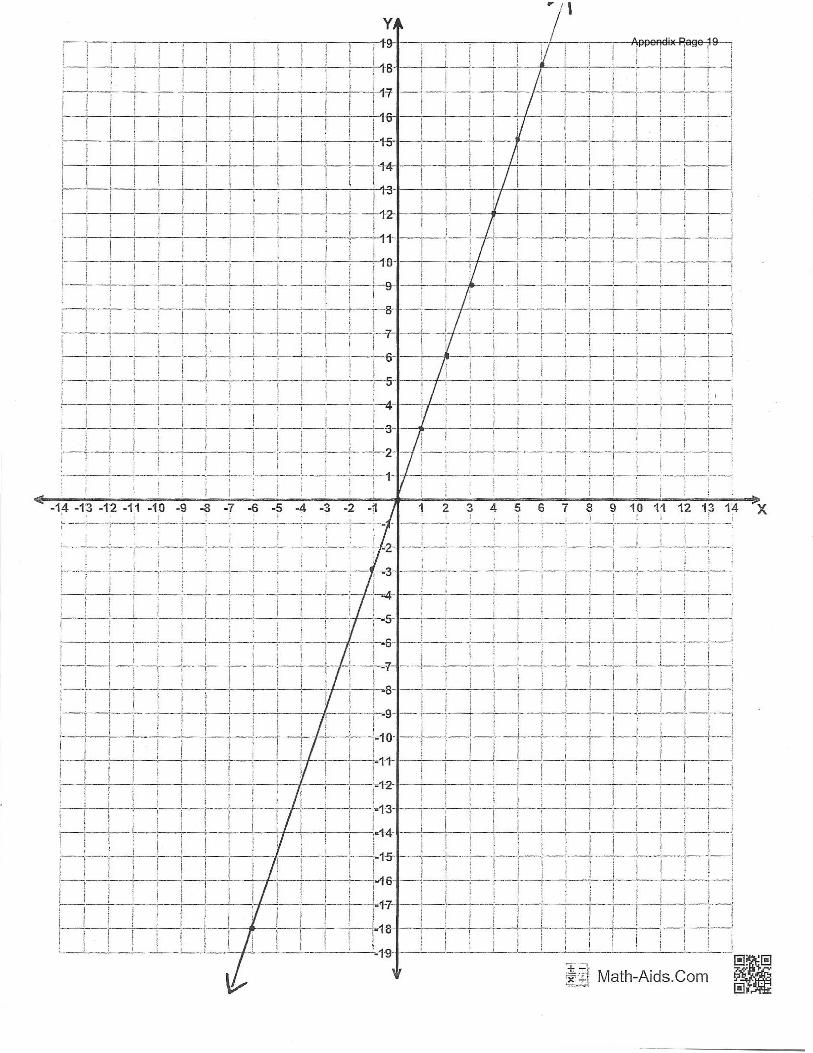
Proportion and Linear Equations Take graph paper and draw an x and y axis to make the first quadrant of the coordinate grid. One by one, place the proportional images on the graph paper so they are flush with the x and y axis (i.e., the bottom left corner is at the origin.) Place a point on the graph at the upper right corner of each image. Do this with each image. Then draw a line from the bottom left corner of our grid (the origin) through all the points on the graph.
Why do all the corners of the proportional images fall on the same line?
What is the equation that defines this line?
Appendix Page 16
Appendix Page 17

Appendix Page 18
Appendix Page 19
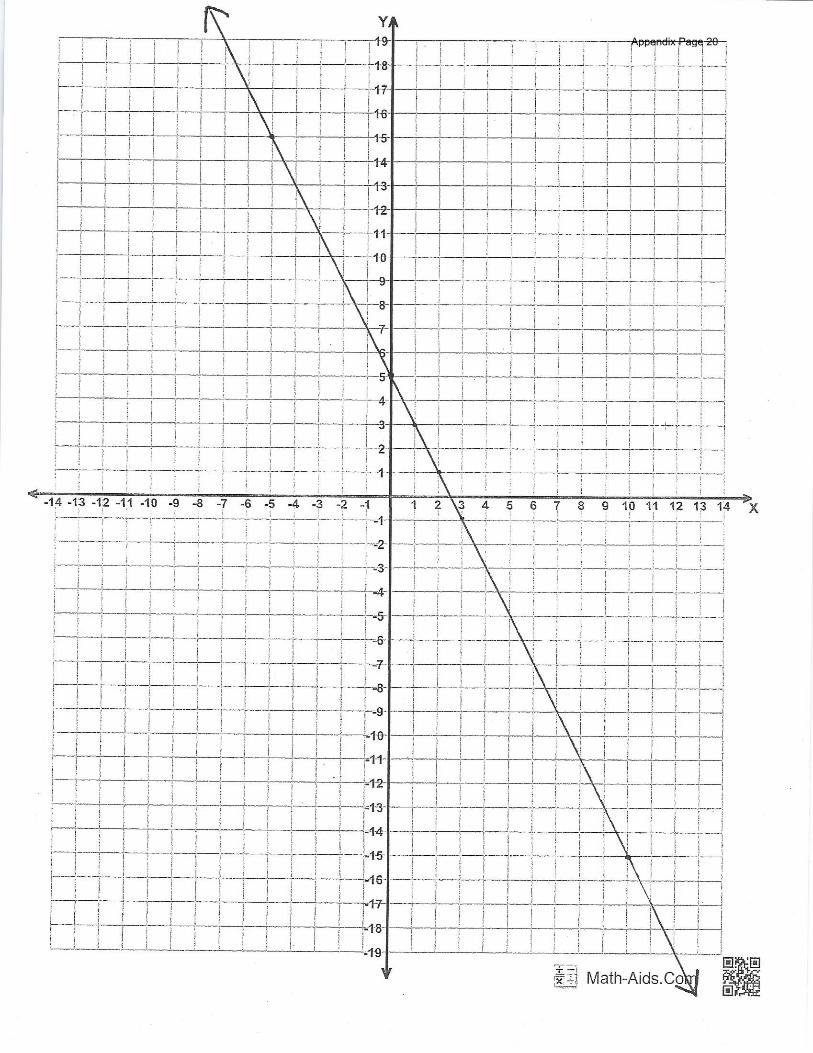
Appendix Page 20
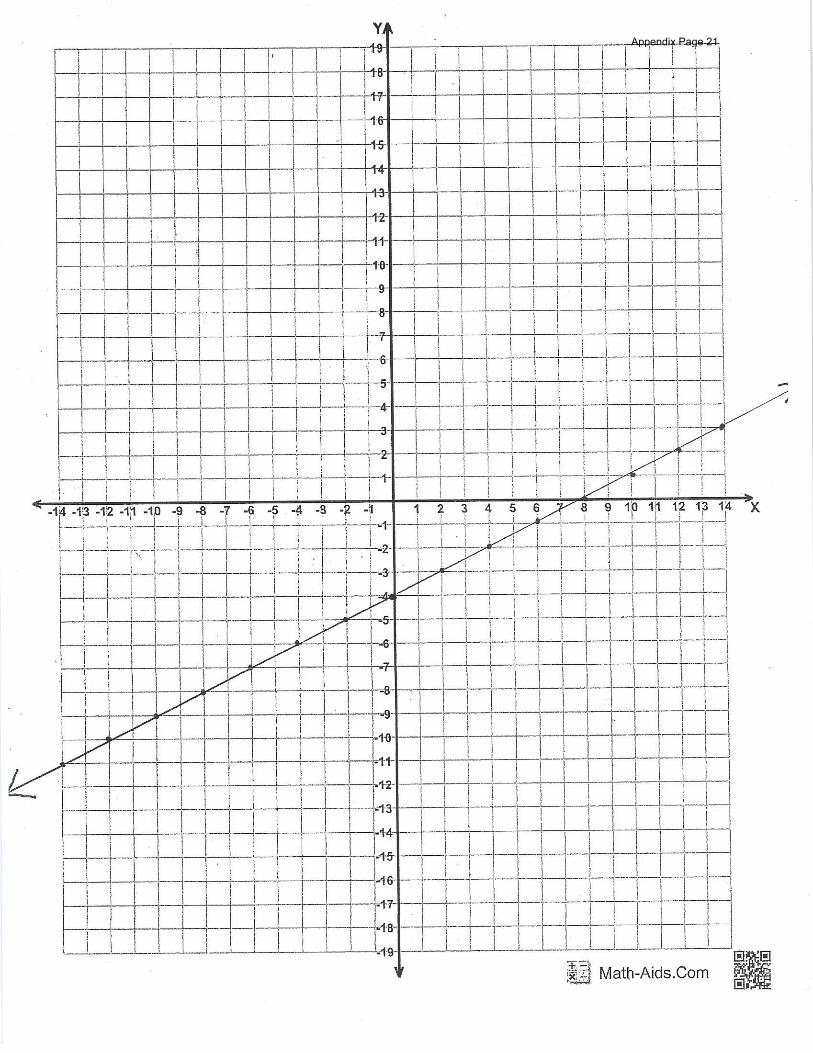
Appendix Page 21
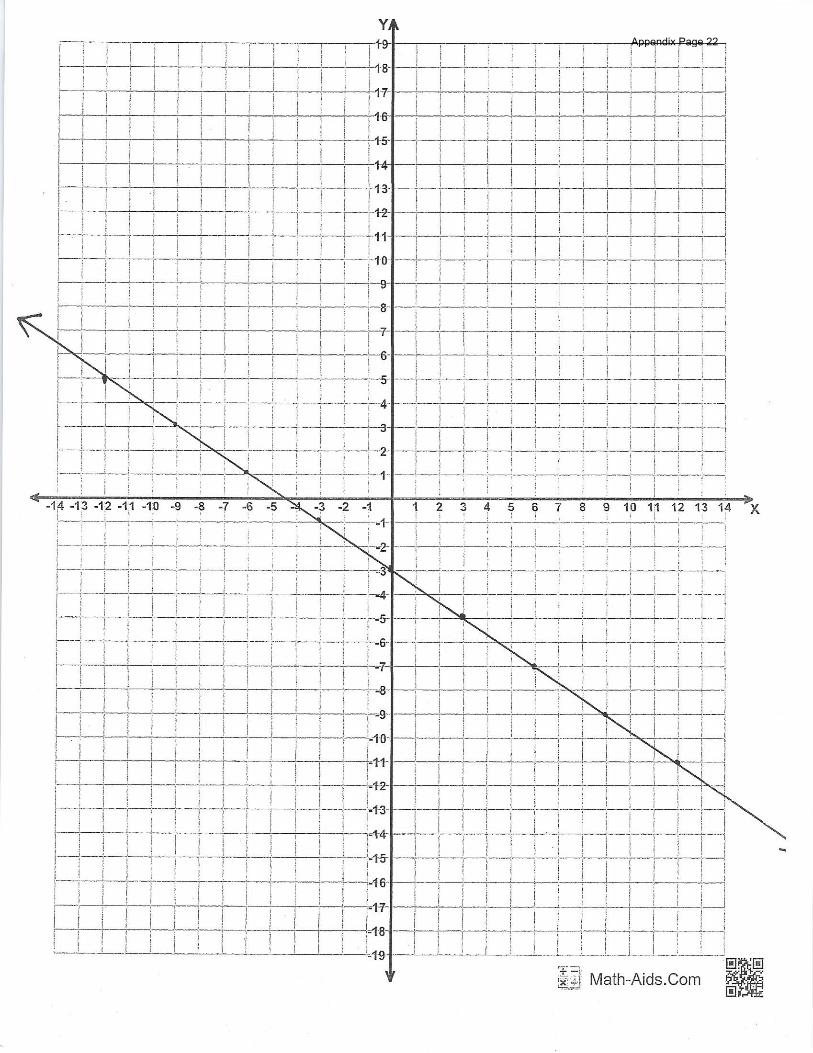
Appendix Page 22
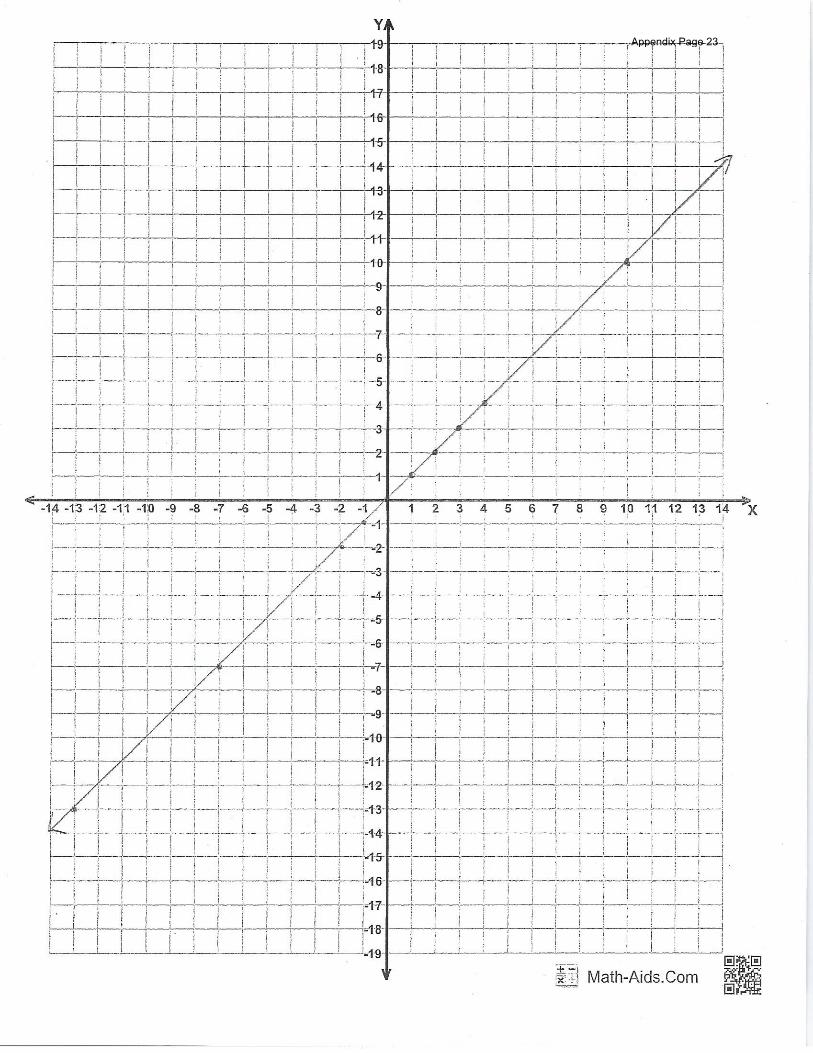
Appendix Page 23
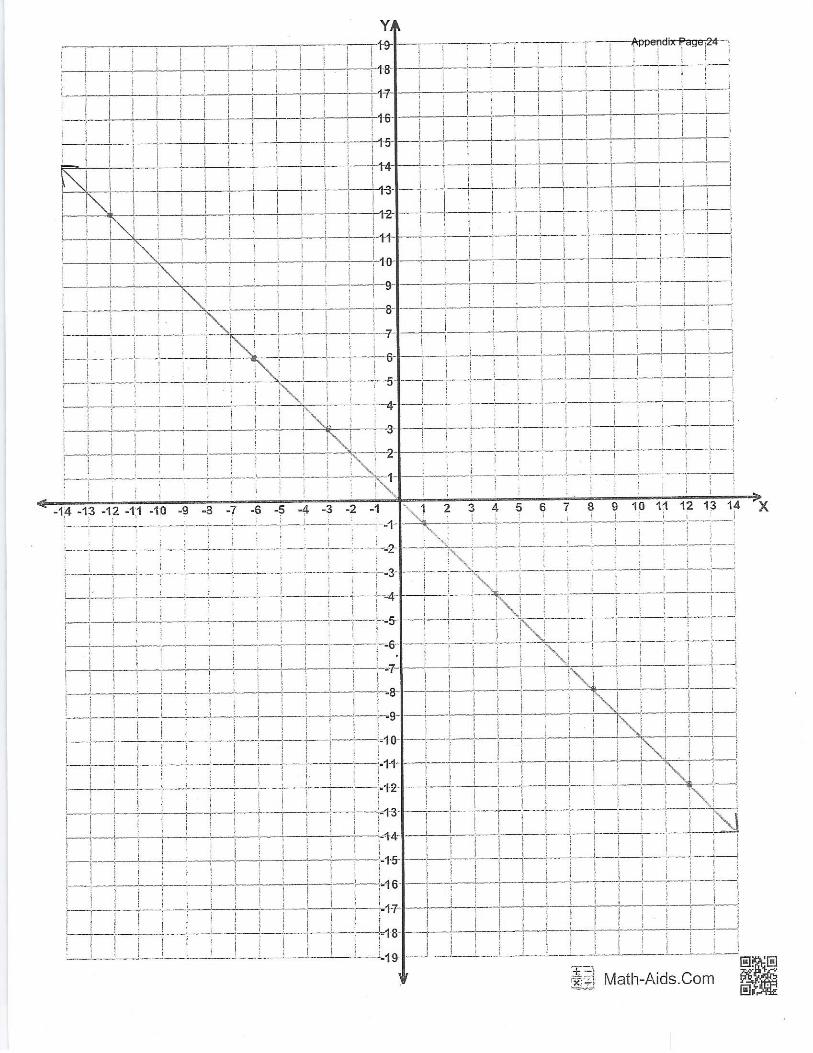
Appendix Page 24
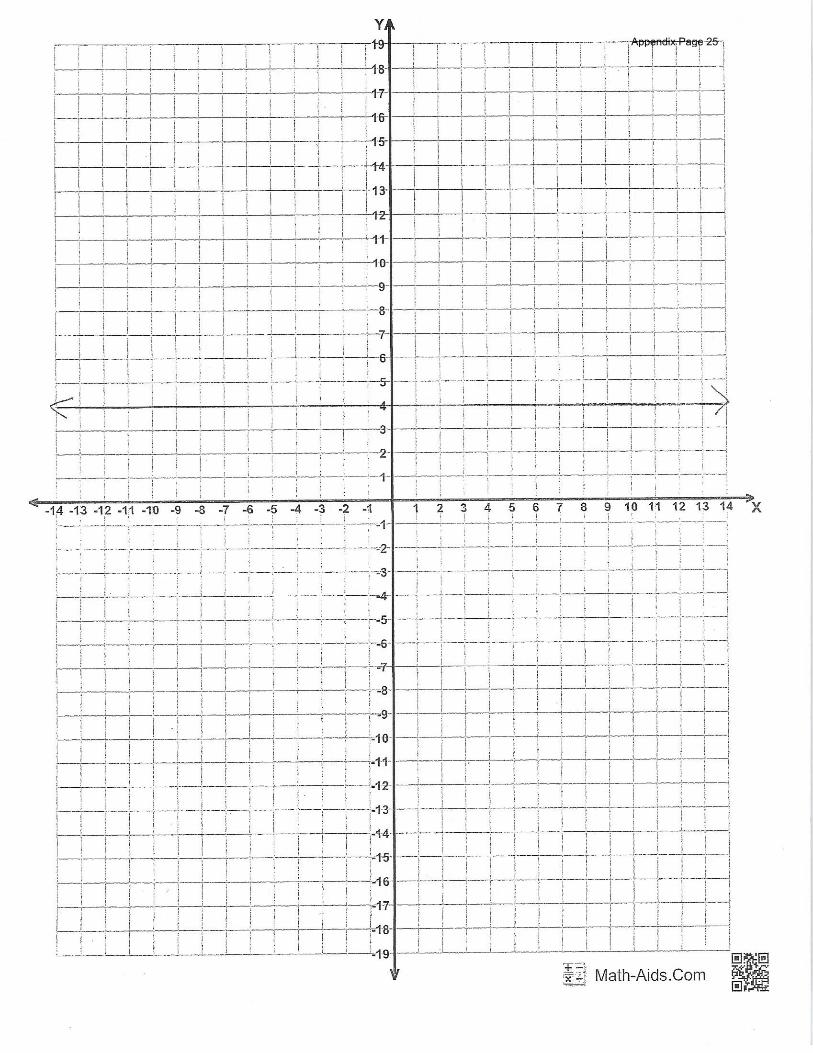
Appendix Page 25
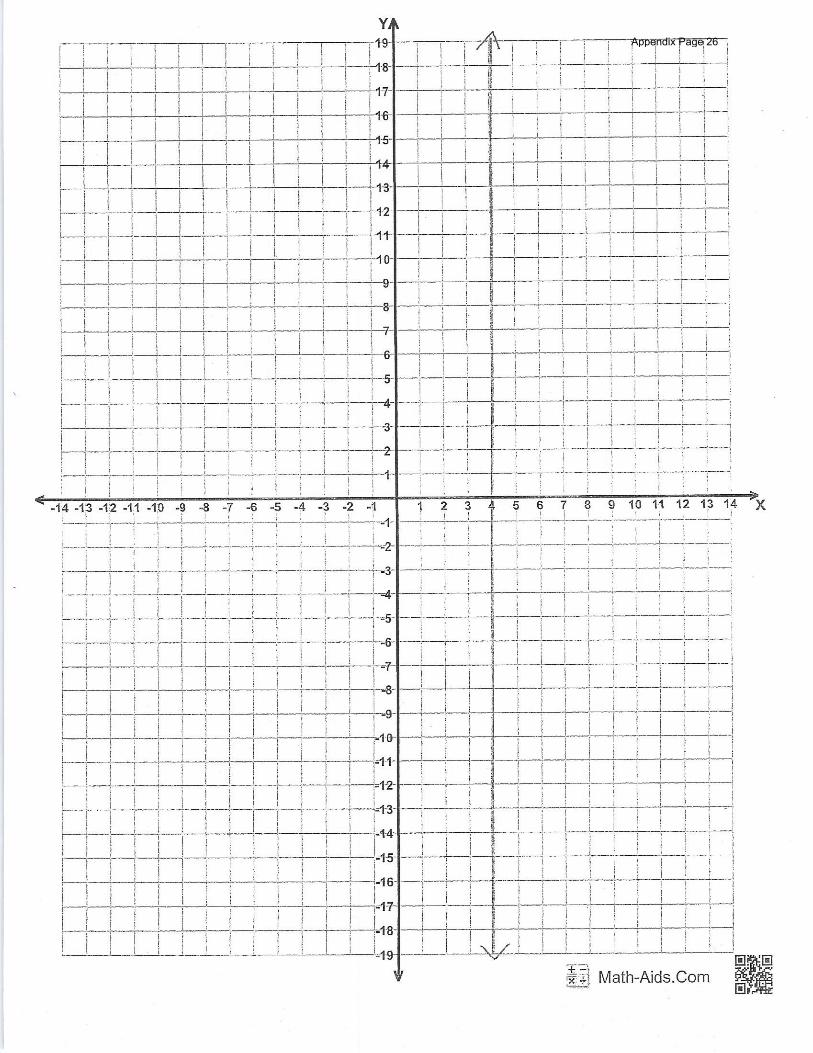
Appendix Page 26
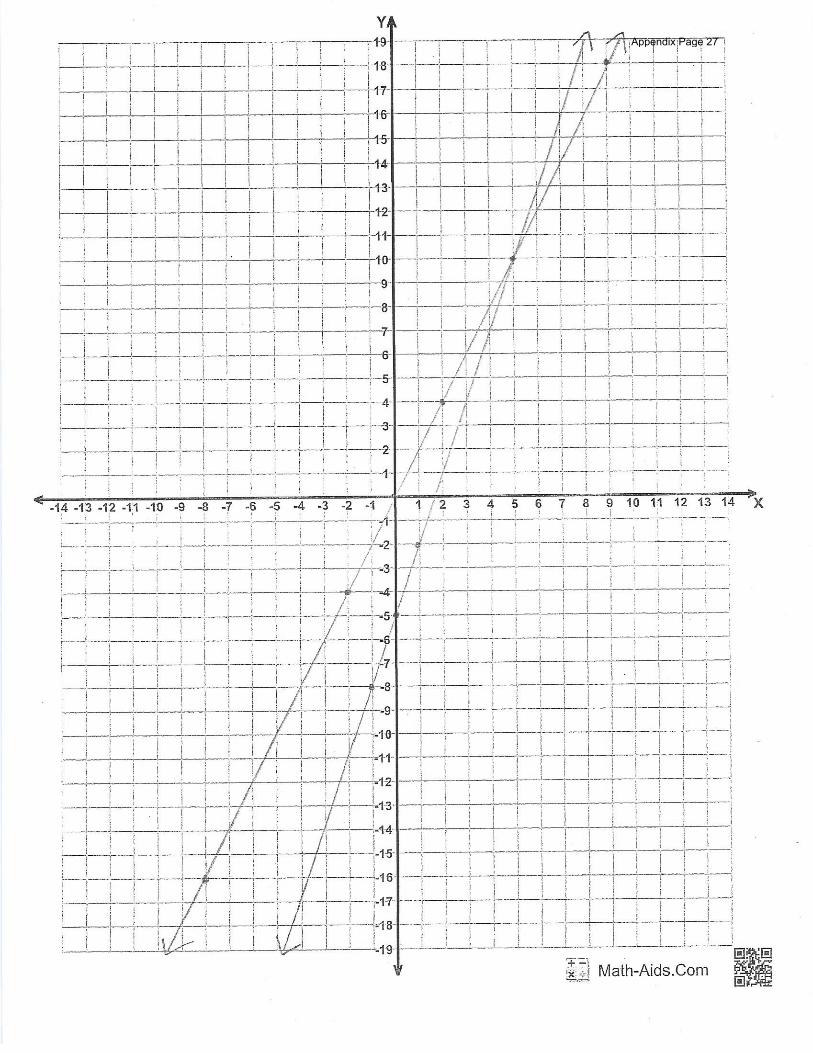
Appendix Page 27
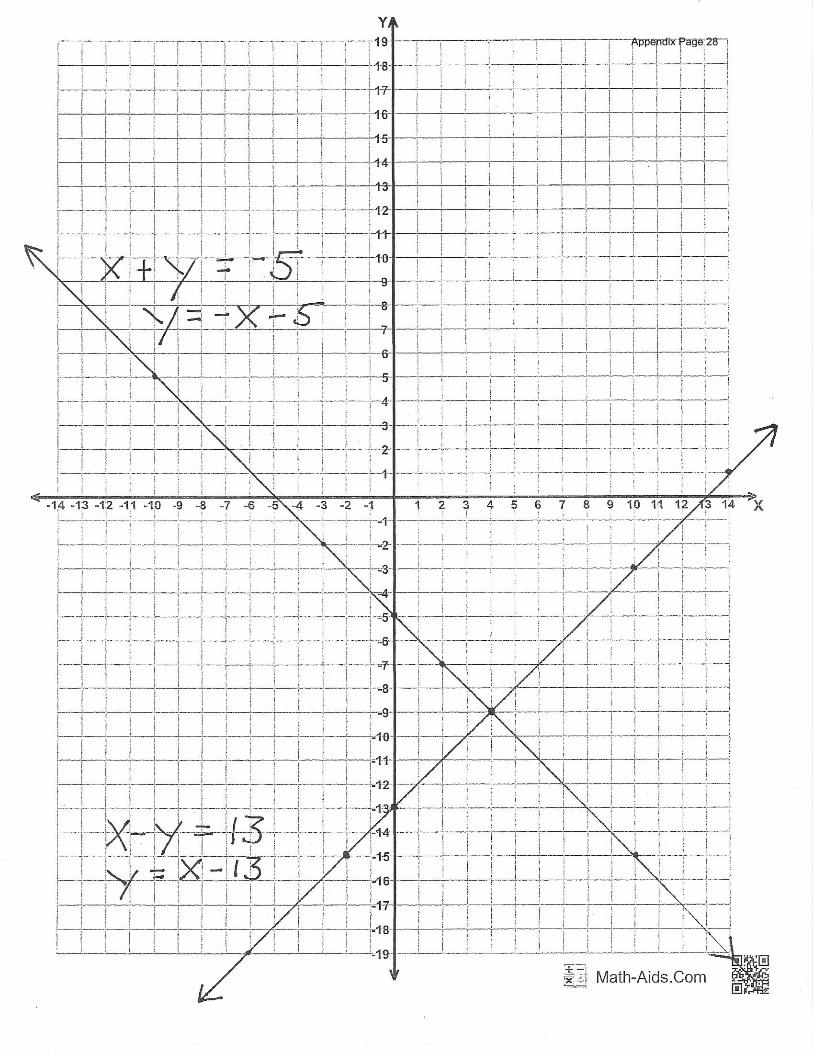
Appendix Page 28
Appendix Page 29

Appendix Page 30
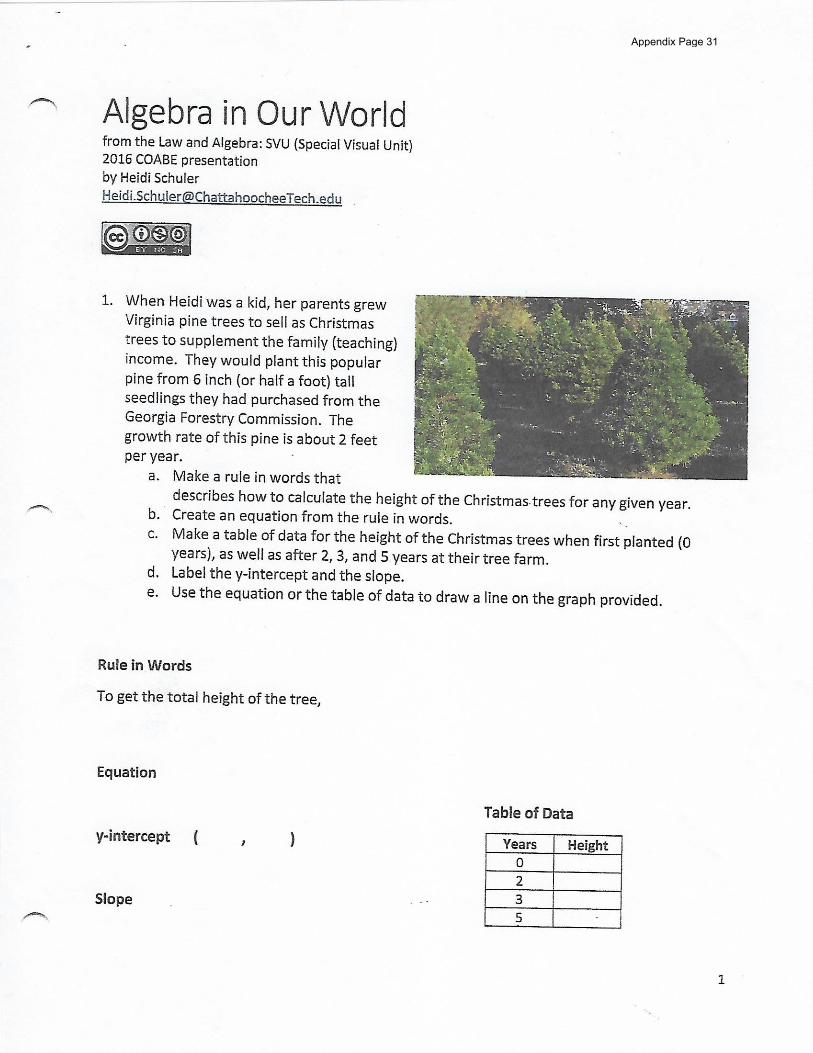
Appendix Page 31
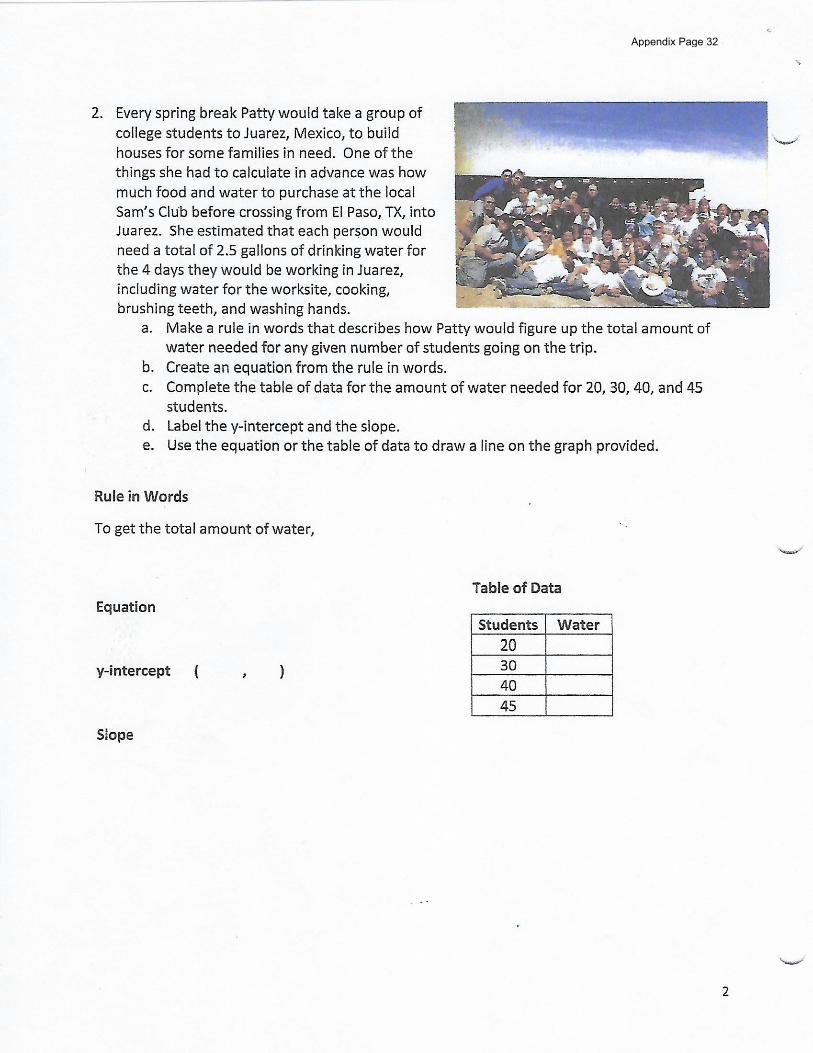
Appendix Page 32
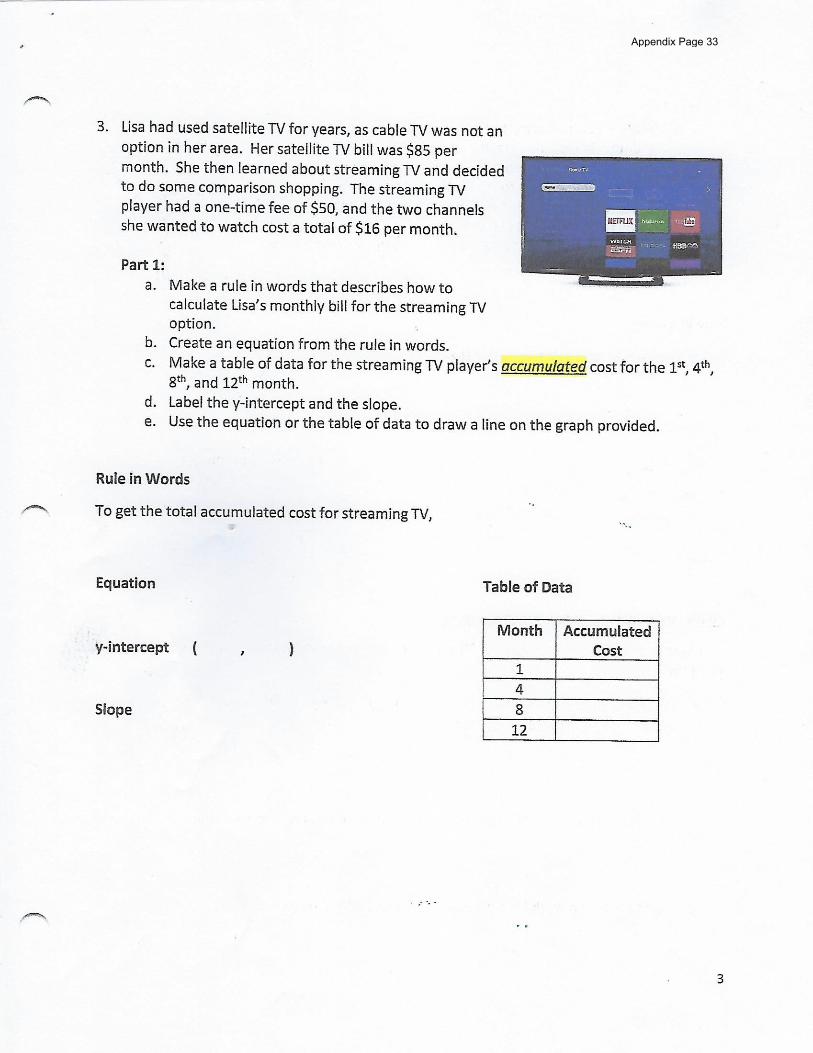
Appendix Page 33
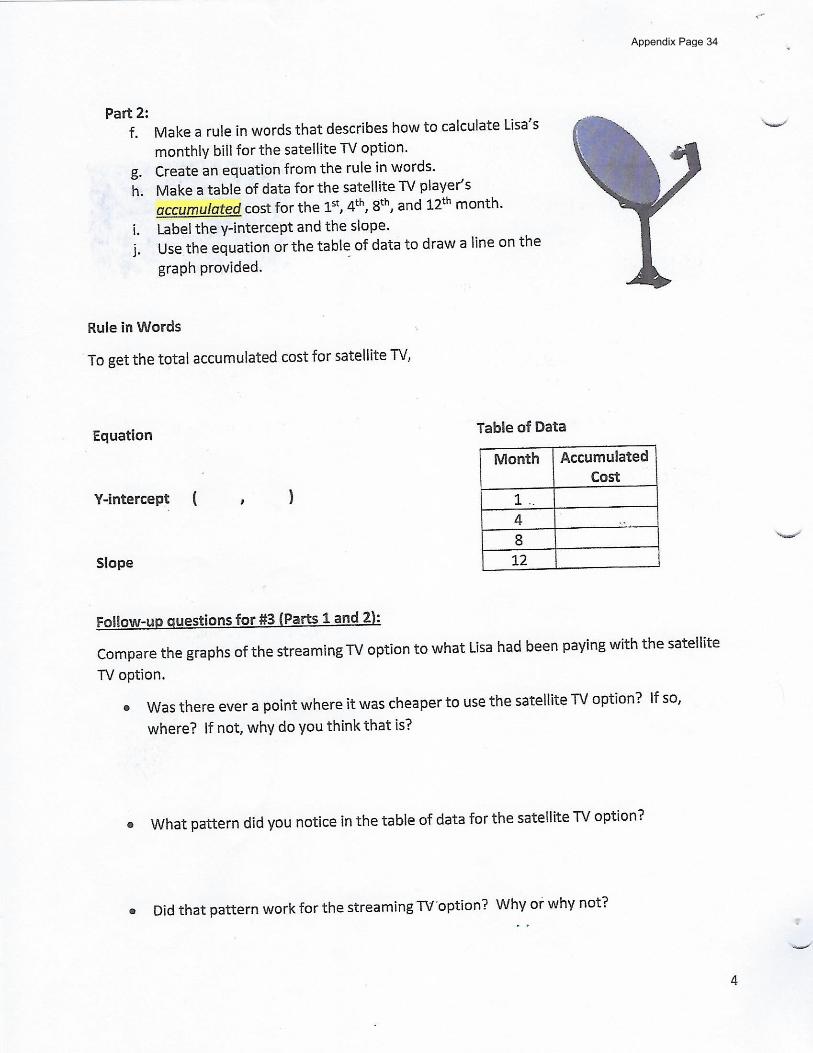
Appendix Page 34