select sands corporate presentation
TRANSCRIPT

CORPORATE November, 2016
TIER 1 COMMERCIAL SILICA PRODUCER
TSX-V:SNS | OTC:CLICF
The Economic Irreplaceable Raw Material
JUNE, 2016 SILICA PRODUCT
1Mark Horan, P.Eng. of Tetra Tech, a Qualified Person as defined by National Instrument 43-101,
has reviewed and approved the scientific and technical disclosure in this document.

TSX-V:SNS | OTC:CLICF
www.selectsandscorp.com
This corporate presentation (the “Presentation”) has been prepared by management of Select Sands Corp.
(the “Corporation”) based on public information and the Corporation’s confidential information. This
Presentation is for information purposes only and is being made available on a confidential basis solely to
enable the prospective investor to evaluate the securities of the Corporation (the “Securities”). This
Presentation does not constitute an offer to sell to any person, or a general offer to the public of, or the
general solicitation from the public of offers to subscribe or purchase, any of the Securities. Any unauthorized
use of this Presentation is strictly prohibited. Distribution or copying of this Presentation, in whole or in part in
any medium, to any person other than the prospective investor is prohibited without the prior written consent
of the Corporation. The information contained in these slides, the Presentation made to you verbally and any
other information provided to you (in writing or otherwise) in connection with the Corporation and its business
(the “Presentation Materials”) is subject to updating, completion, revision, verification and amendment without
notice which may result in material changes.
The Presentation Materials are not intended to provide financial, tax, legal or accounting advice and do not
purport to contain all the information that a prospective investor may require. Each prospective investor
should perform and rely on its own investigation and analysis of the Corporation and the terms of any offering
of the Securities, including the merits and risks involved, and are advised to seek their own professional
advice on the legal, financial and taxation consequences of making an investment in the Corporation.
No securities commission or similar regulatory authority in Canada has reviewed or in any way passed upon
this presentation, and any representation to the contrary is an offence. Neither the Corporation nor the agent
of the Corporation makes any representation or warranty, express or implied, and assumes no responsibility
for the accuracy or completeness of the information contained in this Presentation or any other oral or written
communication transmitted to prospective investors, and nothing contained in this summary is, or shall be
relied upon as, a promise or representation by the Corporation or the agent of the Corporation as to the past
or future performance of the Corporation.
The Corporation does not undertake to provide any additional further information or to enter into negotiations
regarding the investment opportunity to which these Presentation Materials relate. The Corporation retains
the right, at any time, to terminate any discussions or negotiations with prospective investors. In the event of
such termination the Corporation will not be under any obligation to disclose the reasons for such termination
nor will they have any liability to any recipient hereof for any costs whatsoever incurred in the consideration of
the information contained in these Presentation Materials.
Certain statements contained in this Presentation are forward looking statements. These forward looking
statements are not based on historical facts but rather on the expectations of management of the Corporation
regarding the resulting company's future performance. All statements, other than statements of historical fact,
may be forward looking statements. Forward looking statements are often, but not always, identified by the
use of words such as “seek”, “anticipate”, “plan”, “continue”, “estimate”, “expect”, “may”, “will”, “project”,
“predict”, “propose”, “potential”, “targeting”, “intend”, “could”, “might”, “should”, “believe” and similar
expressions. Although the Corporation believes in light of the experience of its officers and directors, current
conditions and expected future developments and other factors that have been considered appropriate that
the expectations reflected in this forward-looking information are reasonable, undue reliance should not be
placed on them because the
Corporation can give no assurance that they will prove to be correct, and actual results, performance or
achievement could differ materially from those expressed in, or implied by, these forward-looking statements.
Forward-looking statements contained in this Presentation include, but are not limited to, statements with
respect to the Corporation's business strategy, the market in which the Corporation operates; the ability of the
Corporation to successfully integrate businesses; the timing and nature of equity offerings to be completed by
the Corporation; the Corporation's potential revenue; the ability of the Corporation to successfully complete
mergers and acquisitions; the ability of the Corporation to realize on the potential of target companies; and
other expectations, beliefs, plans, objectives, assumptions, intentions or statements about future events or
performance. Forward-looking statements contained in this Presentation reflect the current beliefs and
assumptions of the Corporation's management based on information in its possession as of the date of this
Presentation.
Readers are cautioned that the foregoing list is not exhaustive. The forward-looking statements contained
herein are expressly qualified in their entirety by this cautionary statement. The forward-looking statements
included in this presentation are made as of the date of this presentation and the Corporation does not
undertake and is not obligated to publicly update such forward-looking statements to reflect new information,
subsequent events or otherwise unless so required by applicable securities laws.
DISCLAIMER
2

TSX-V:SNS | OTC:CLICF
www.selectsandscorp.com
OPERATIONS OVERVIEW
Hottest Commodity in Oil Patch
“…frac sand industry, where we expect demand to grow by 80% in 2017 – the highest growth among all oil services sub-sectors.”
Goldman Sachs June, 2016
“…higher concentration of 40/70 and 100 mesh product, this is a potential windfall for southern mines while a potential headwind for select northern mines who tend to produce a greater relative volume of coarse product… looming demand uplift could be more heavily weighted towards 40/70 and 100 mesh product…estimate for 40/70 and 100 mesh yield is ~50% of total production…For simplicity reasons, if our 2H'18 run-rate demand estimate of ~70M tons is reasonable and if our U.S. directed name-plate capacity estimate of 100M tons (at 90% utilization) is within the realm of reason, we can create a scenario whereby we are sold out of 40/70 product while 100 mesh product could tighten greatly…”
Simmons and Company June, 2016
Comps trading 8x (Avg) EV/EBITDA (2018)
Average sand consumption increased from 2,000 tons per well (Q1 2012) to 4,000 tons per well (Q1 2016)
Attractive Value Proposition
Growing frac intensities & potential tight markets
We produce what is in high demand
3

TSX-V:SNS | OTC:CLICF
www.selectsandscorp.com
+ “Coupled with higher sand/well, we thus see sand demand rising
~70%/80% in 2017/18” – May 2016,Morgan Stanley
+ Pickering estimates …the sand consumption can grow from about
30MM ton this year—a four- or five-year low—to 70MM ton-100MM
tons by 2018 – June 2016,Citi and Tudor
+ Frack sand demand estimated to grow from about 30 MM tons 2016
consumption rate currently, to 50 MM tons in 2017 and 64MM tons in
2018 – June 2016, Goldman Sachs
+ “Sand will be the fastest growing sub-segment of the oilfield services
market” – Sept. 2016, Credit Suisse
+ From Q1 2014 to Q2 2016 well completion is using substantially
higher quantities of finer grade sand (40/70 and 100 mesh) which has
increased from 40% to about 60% - Mar. 2016 NavPort
+ Based upon recent industry reports, leading US based fracking
companies are now using up to 2,500 pounds of frac sand per lateral
foot per well, with some wells requiring 25,000 tons of sand for one
well completion; two years ago the average well would use
approximately use 800 lbs. of frac sand per lateral foot
NORTH-AMERICAN FRAC-SAND OUTLOOK
4

TSX-V:SNS | OTC:CLICF
www.selectsandscorp.com
SELECT SANDS TIMELINE
FEB 2011Management
Change – new CEO
JUNE 2015Sandtown,
Engineering Studies
Complete
OCT 2013Focus shifts to frac sand
SEPT 2014LaRonge
acquires 22% equity in Canfrac
Sands
2012 - 2013SaskachewanGold Deposit Exploration
NOV 2014LaRonge
changes name to Select Sands
Corp.
OCT 2014LaRonge options Arkansas USA
Frac Sands Prospect
SEPT 2015Start test mining and production at
SandtownArkansas USA
FEB 2016Resource
increases to 41.98M tons
AUG 2016Gold asset sale
to Comstock Metals
SEPT 2016Wet
processing plant
acquisition
OCT 2016Option to purchase
Ozark Premium
Sand (OPS)
2011 2012 2013 2014 2015 2016
5

TSX-V:SNS | OTC:CLICF
www.selectsandscorp.com
+ Indicated Resources of 41.98MM tons (TetraTech Report Feb.,2016)
+ Grades: 13% of 30/50, 22% of 40/70 & 58% of 100 mesh (70/140mesh)
+ Contains high-purity Silica (+99% SiO2), with high roundness and
sphericity, exceeds or meets various industrial and API Tier-1
Specifications
+ Crush Resistance: 7K of 30/50, 9K-10K of 40/70 & 10K of 100 mesh
+ Annual production capacity of 600,000 tons of commercial silica
products; operational year-round; Potential to increase to 1,500,000 tons
per annum in the future with minimal capex
+ Target markets are Energy (oil and gas), Industrial & Specialty Products
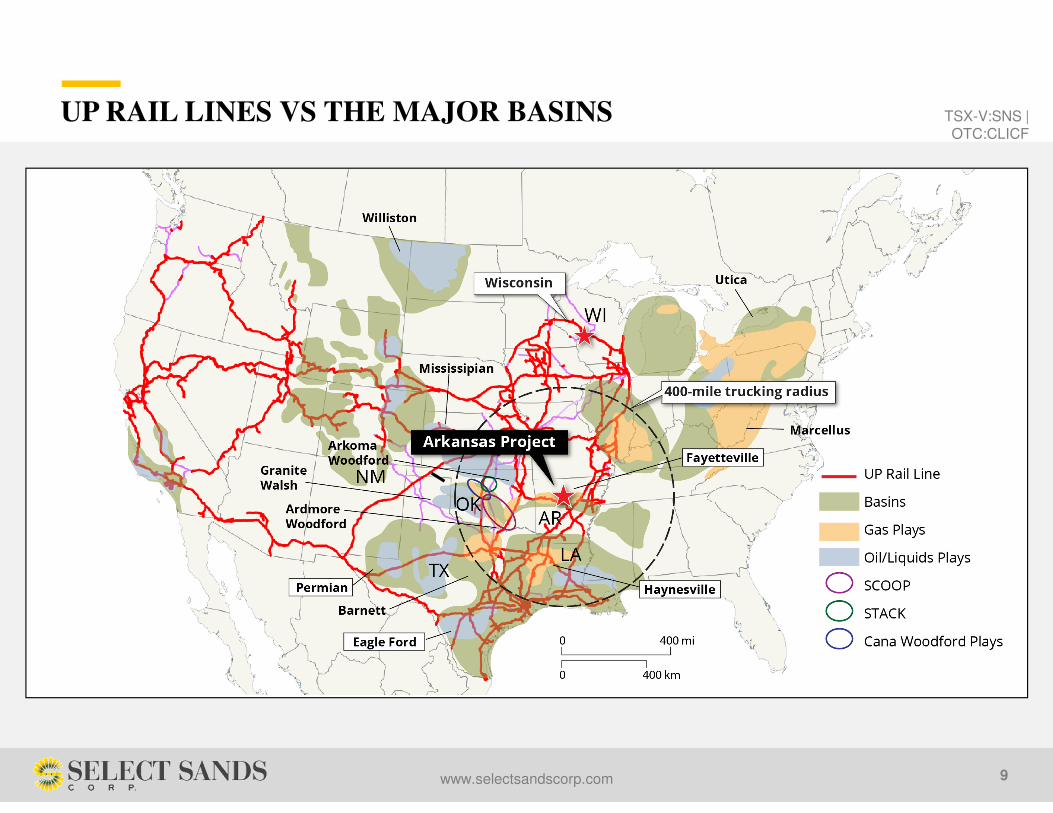
+ Sandtown is 650 rail-miles closer to the major Texas, Oklohama and
Louisiana energy and industrial markets than Wisconsin silica mines,
offering up to US$15/ton savings in transportation costs to customers
(Source:UP & BNSF Rail Quotes)
Cautionary Note: The PEA is preliminary in nature , and there is no certainty that the PEA
will be realized.
SANDTOWN PROJECT
6

TSX-V:SNS | OTC:CLICF
www.selectsandscorp.com
OVERVIEW OF OPS ACQUISITION INCLUDING OPTION
+ Permitted Wet Processing Plant ( 600KT/yr Current
Production Capacity)
+ Permitted Dry Processing Plant On Union Pacific Rail
+ 7000 tons of dry storage
+ 26-Acres Real Estate
+ Office & Truck Shop
+ Earth Moving Equipment etc,
+ Customers List
+ Good Will
+ Inventory
+ TertraTech Engineering Report Estimated Capex
US$42MM* vs Our cost $US5.0MM*
(*US$4.9MM Rail Spur not included in Capex)
Cautionary Note: The PEA is preliminary in nature , and there is no certainty that the PEA
will be realized.
7

TSX-V:SNS | OTC:CLICF
www.selectsandscorp.com
WHY THIS OPS ACQUISITION IS A GAME CHANGER
+ Cost: By owning Wet and Dry Processing Plant we can introduce cost efficiency in recovery
(%product yield), and product types (30/50,40/70 and 100 mesh)
+ Efficiencies: Product yield / recovery improvements will bring down cost of production by about
20%
+ Products can be trucked to destination
+ Rail access: The plant is located on Tier 1 Union Pacific Rail Line on 26 Acres-fully permitted
facility & in operation
8
TSX-V:SNS | OTC:CLICF
www.selectsandscorp.com
UP RAIL LINES VS THE MAJOR BASINS
9
TSX-V:SNS | OTC:CLICF
www.selectsandscorp.com
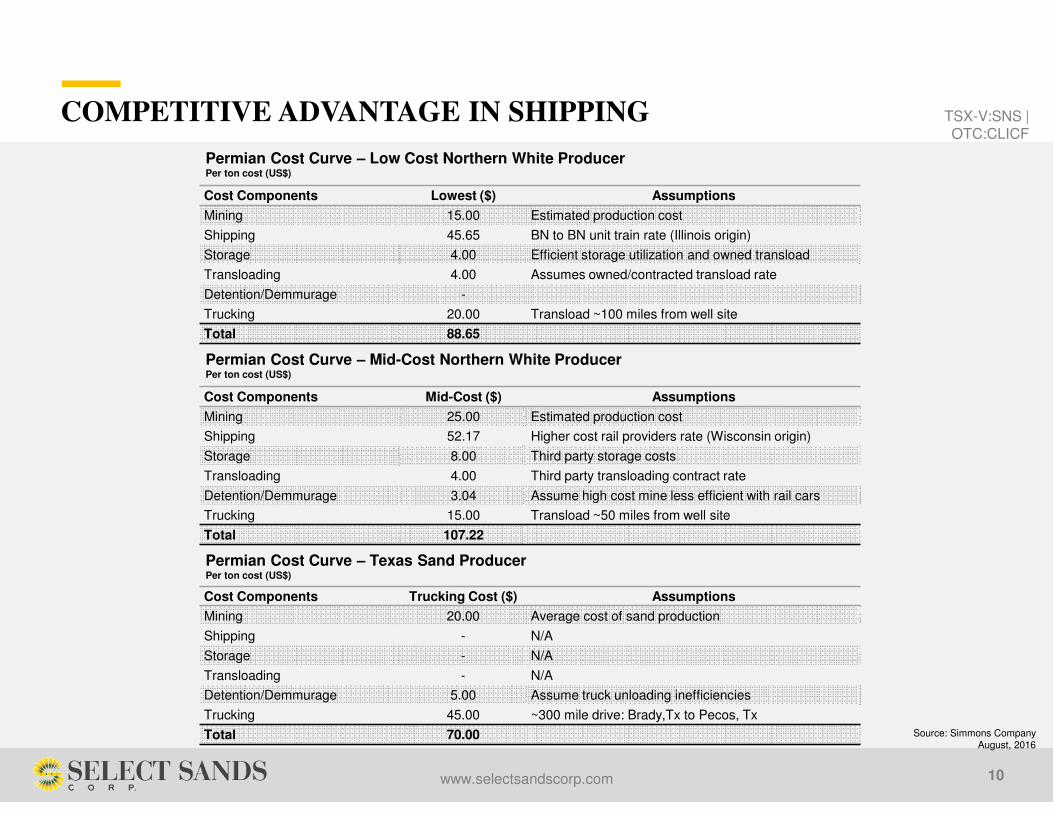
Cost Components Lowest ($) Assumptions
Mining 15.00 Estimated production cost
Shipping 45.65 BN to BN unit train rate (Illinois origin)
Storage 4.00 Efficient storage utilization and owned transload
Transloading 4.00 Assumes owned/contracted transload rate
Detention/Demmurage -
Trucking 20.00 Transload ~100 miles from well site
Total 88.65
COMPETITIVE ADVANTAGE IN SHIPPING
10
Permian Cost Curve – Low Cost Northern White ProducerPer ton cost (US$)
Cost Components Mid-Cost ($) Assumptions
Mining 25.00 Estimated production cost
Shipping 52.17 Higher cost rail providers rate (Wisconsin origin)
Storage 8.00 Third party storage costs
Transloading 4.00 Third party transloading contract rate
Detention/Demmurage 3.04 Assume high cost mine less efficient with rail cars
Trucking 15.00 Transload ~50 miles from well site
Total 107.22
Permian Cost Curve – Mid-Cost Northern White ProducerPer ton cost (US$)
Cost Components Trucking Cost ($) Assumptions
Mining 20.00 Average cost of sand production
Shipping - N/A
Storage - N/A
Transloading - N/A
Detention/Demmurage 5.00 Assume truck unloading inefficiencies
Trucking 45.00 ~300 mile drive: Brady,Tx to Pecos, Tx
Total 70.00
Permian Cost Curve – Texas Sand ProducerPer ton cost (US$)
Source: Simmons CompanyAugust, 2016

TSX-V:SNS | OTC:CLICF
www.selectsandscorp.com
2018 FRAC DEMAND – Q1 2016 AVERAGE SCENARIO
Frac Sand Potential Demand Outlook: Q1 2016 Average Per Well Demand Scenario
11
2011 2012 20132014Peak
2015 2016E 2017E 2018E
Rigs 1,842 1,871 1,705 1,804 947 431 647 906
Rig Count Growth 22.2% 1.6% -8.9% 5.8% -47.5% -54.5% 50.1% 40.0%
Wells Drilled 35,001 36,824 35,703 37,884 21,781 10,344 16,175 22,650
Wells per Rig 19 20 21 21 23 24 25 25
Frac Sand Consumed (mm tons) 24.5 29 3754
(108B lbs)44.5 31 55.5 73.5
Frac Sand Consumer per Well (mm lbs) 1.4 1.6 2.1 2.9 4.1 6.0 6.9 6.5
% Vertical Wells 66% 60% 53% 50% 40% 15% 15% 20%
% Horizontal Wells 34% 40% 47% 50% 60% 85% 85% 80%
Vertical Wells 23,101 22,094 18,923 18,942 8,712 1,552 2,426 4,530
Horizontal Wells 11,900 14,730 16,780 18,942 13,069 8,792 13,749 18,120
Frac Sand per Horizontal Well (mm lbs) 3.2 3.2 3.9 5.2 6.5 7.0 8.0 8.0
Frac Sand per Vertical Well (mm lbs) 0.5 0.5 0.5 0.5 0.5 0.5 0.5 0.5Sources Baker Hughes, Drilling Info, HPDI, HIS PacWest, TPH Research
Source: Credit Suisse
Sand Type Capacity % of TotalActive
CapacityMarket Share Market Mix Utilization
Northern White 82.5 75% 56.50 60% 20.78 36.8%
Regional 27.5 25% 18.86 40% 13.85 73.4%
Total 109.99 75.36 34.63 46.0%
CS Projected Q3 Demand Annualized 34.63
Utilization by Sand Type (mm tons)
Source: Credit Suisse | 7 September 2016 Americas/United States | Equity Research | Oil & Gas Equipment & Services

TSX-V:SNS | OTC:CLICF
www.selectsandscorp.com
FRAC SAND DEMAND SENSITIVITY ANALYSIS Note : 2014 Peak 108 B lbs. (54 mm tons)
12
Sand/Well (mm lbs)
Wells Per Rig
22 23 24 25 26 27
10.5 128 134 140 146 151 157
11.0 134 140 146 152 159 165
11.5 140 147 153 159 166 172
12.0 146 153 160 166 173 179
12.5 152 159 166 173 180 187
13.0 158 166 173 18 187 194
Sand/Well (mm lbs)
Horizontal % of US Well Count
90% 85% 80% 75% 70% 65%
10.5 154 146 137 129 121 113
11.0 161 152 144 135 127 118
11.5 168 159 150 142 133 124
12.0 175 166 157 148 138 129
12.5 183 173 163 154 144 134
13.0 190 180 170 160 150 140
Sand/Well (mm lbs)
US Onshore Rig Count
550 600 650 700 750 800
10.5 124 135 146 158 169 180
11.0 130 141 153 165 177 189
11.5 135 148 160 172 185 197
12.0 141 154 167 180 193 206
12.5 147 161 174 187 201 214
13.0 153 167 181 195 209 223
Sand/Well (mm lbs)
Wells Per Rig
22 23 24 25 26 27
10.5 169 177 185 193 200 208
11.0 177 185 194 202 210 218
11.5 185 194 202 211 219 227
12.0 193 202 211 220 228 237
12.5 201 210 220 229 238 247
13.0 209 219 228 238 247 257
Sand/Well (mm lbs)
Horizontal % of US Well Count
90% 85% 80% 75% 70% 65%
10.5 215 204 193 181 170 159
11.0 225 213 202 190 178 166
11.5 236 223 211 198 186 173
12.0 246 233 220 207 194 181
12.5 256 242 229 215 202 188
13.0 266 252 238 224 210 195
Sand/Well (mm lbs)
US Onshore Rig Count
800 850 900 950 1000 1050
10.5 170 181 191 202 213 223
11.0 178 189 200 211 223 234
11.5 186 198 209 221 233 244
12.0 194 206 218 230 243 255
12.5 202 215 227 240 253 265
13.0 210 223 236 249 263 276
2017 Frac Sand Demand (B lbs)Sensitivity Analysis #1
2017 Frac Sand Demand (B lbs)Sensitivity Analysis #2
2017 Frac Sand Demand (B lbs)Sensitivity Analysis #3
2018 Frac Sand Demand (B lbs)Sensitivity Analysis #1
2018 Frac Sand Demand (B lbs)Sensitivity Analysis #2
2018 Frac Sand Demand (B lbs)Sensitivity Analysis #3
Sources Baker Hughes, Drilling Info, HPDI, HIS PacWest, TPH Research

TSX-V:SNS | OTC:CLICF
www.selectsandscorp.com
3Q16E 4Q16E 1Q17E 2Q17E 3Q17E 4Q17E
Market Mix
Northern White 20.78 20.78 20.78 20.78 20.78 20.78
Regional 13.85 16.51 16.20 25.40 34.05 38.76
Total Demand 34.63 37.29 36.98 46.18 54.83 59.53
Check 0.00 0.00 0.00 0.00 0.00 0.00
Incremental Demand 2.664 -0.312 9.201 8.647 4.706
Active Capacity
Northern White 56.50 56.50 56.50 56.50 56.50 56.50
Regional 18.86 18.86 18.86 18.86 18.86 18.86
Total 75.36 75.36 75.36 75.36 75.36 75.36
Utilization
Northern White 36.8% 36.8% 36.8% 36.8% 36.8% 36.8%
Regional 73.4% 87.6% 85.9% 134.7% 180.6% 205.5%
Horizontal Rig Count 356 366 382 463 538 574
Increase from 2Q16 9.5% 12.7% 17.5% 42.7% 65.6% 76.6%
Well Count 2,225 2,278 2,179 2,657 3,096 3,303
Increase from 2Q16 11.2% 13.8% 8.9% 32.8% 54.7% 65.1%
Source: Credit Suisse | 7 September 2016 Americas/United States | Equity Research | Oil & Gas Equipment & Services
Regional Sand Maximum Share Scenario(All figures annualized- mm tons)
3Q16E 4Q16E 1Q17E 2Q17E 3Q17E 4Q17E
Market Mix
Northern White 20.78 22.37 22.19 27.71 32.90 35.72
Regional 13.85 14.92 14.79 18.47 21.93 23.81
Total Demand 34.63 37.29 36.98 46.18 54.83 59.53
Check 0.00 0.00 0.00 0.00 0.00 0.00
Incremental Demand 2.664 -0.312 9.201 8.647 4.706
Active Capacity
Northern White 56.50 56.50 56.50 56.50 56.50 56.50
Regional 18.86 18.86 18.86 18.86 18.86 18.86
Total 75.36 75.36 75.36 75.36 75.36 75.36
Utilization
Northern White 36.8% 39.6% 39.3% 49.0% 58.2% 63.2%
Regional 73.4% 79.1% 78.4% 98.0% 116.3% 126.3%
Horizontal Rig Count 356 366 382 463 538 574
Increase from 2Q16 9.5% 12.7% 17.5% 42.7% 65.6% 76.6%
Well Count 2,225 2,278 2,179 2,657 3,096 3,303
Increase from 2Q16 11.2% 13.8% 8.9% 32.8% 54.7% 65.1%
Regional Sand Maintain Share Scenario(All figures annualized-mm tons)
CAPACITY UTILIZATION REGIONAL VS WISCONSIN
13

TSX-V:SNS | OTC:CLICF
www.selectsandscorp.com
COMMENTS – SHALE LEADER SAND/ LATERAL FOOT
14
EOG Bakken
EOG used 2700 lbs/ft of sand in 10,000’ lateral well (13,500 tons of sand per well)
CHK Haynesville
CHK utilized 3000 lbs/ft of sand in a 10,000’ lateral well (15,000 tons of sand per well)
XEC Permian
XEC is using 3500 lbs/ft of sand in a 10,000’ lateral well (17,500 tons of sand per well)
RICE Marcellus
Rice is using 5400 lbs/ft of sand in a 10,000’ lateral well (27,000 tons of sand per well)
Source : Public Filings ; Simmons Company

TSX-V:SNS | OTC:CLICF
www.selectsandscorp.com
• Former Chairman and Director of Tribute Pharmaceuticals (TSXV: TRX; OTCQX: TBUFF)
• Former Financial consultant at Devine Entertainment Corporation, CEO of ARC International, and Chairman of the Board of Cabletel Communications
• Former Director of Ballantyne of Omaha, Inc; and Phillip Services Inc., a Canadian metal recycling company serving as a representative of Mr. Carl Icahn.
RASOOL MOHAMMADPresident & CEO, Director
• Over 20 years’ experience in the mining and mineral exploration industry
• Has worked on mineral exploration and development projects in Canada, the United States, Mexico, Colombia, Peru, and Brazil.
• Worked on projects from grassroots level to over 50,000 tons per day operations in the Americas
• Bachelor of Science in Mining Engineering from UET, Peshawar, Pakistan (1991)
• 16 years experience with Martin Marietta Materials as President of Mid-South Division, VP General Manager Arkansas District, and VP General Manager Houston
District
• Northeast General Manager, Canadian Sales & Marketing Manager, Western Region
• Manager, Branch Manager, & Technical Sales Rep. for W.R. Grace & Co.
• MBA, International Business, Heriot Watt University, Edinburgh, Scotland
• Civil Engineering Technology, Mohawk College, Hamilton, Canada
ZIGURDS R. VITOLSChief Operating Officer / Director
ARNOLD TENNEYChairman / Director
STEVEN GOLDMANDirectorGeneral Counsel
• Partner in Toronto Law Firm Goldman Hine LLP
• BA (Carleton University, President’s Medal), JD (Queen’s University)
• Former Director of Tribute Pharmaceuticals Inc. (TRX:TSX.V), Director in Comstock Metals (CSL.V).
DOUGLAS TURNBULLDirector
• Consulting geologist with over 30 years experience in diamond, precious and base metal exploration
• Bachelor of Science degree with Honours in Geology and is a Qualified Professional Geoscientist
• Director in Comstock Metals Ltd., Astur Gold Corporation, and Grizzly Discoveries Inc.
DARREN URQUHARTChief Financial Officer (CFO)
• Mr. Urquhart is a Chartered Accountant and B.A.Sc. (Electrical Engineering) with more than 15 years of experience working in both public practice and industry.
CARL BUCHANANIndustrial Sales Manager
• Regional Manager for US Silica (SLCA: NYSE) for over 16 years, where he increased Building Products sales revenues by 40%, establishing US Silica’s Building
Products market as the quickest emerging sector in the company
• Sales and management experience of a seven-state territory and was head of National Account sales for major building product and glass customers.
BOARD OF DIRECTORS & SENIOR MANAGEMENT
15
JOHN KIMEIndependent Director &Audit Committee Chairman
• President and CEO of iBD Advisors Inc.• From 1991 to 1998, served as Director of International Development for Big ‘O’ Inc.• BA from Western University, has a significant business operating, accounting and financial experience.

TSX-V:SNS | OTC:CLICF
www.selectsandscorp.com
COMPARISONS
16
EMES FMSA HCLP SLCA
Price $12.92 $8.97 $16.76 $47.87
Shares Outstanding 24.1 162.0 49.1 63.6
Equity Value 311.6 1,453.3 823.6 3,043.6
Cash and ST Investments (3.2) (61.6) (39.7) (454.2)
Total Debt 312.2 1,146.6 195.2 490.0
Preferred equity - - - -
Minority Interest - 0.3 2.6 -
TEV $620.7 $2,538.5 $981.7 $3,079.4
EBITDA 2016 ($56.9) ($2.7) ($6.6) $29.1
EBITDA 2017 ($15.5) $109.8 $45.6 $154.0
EBITDA 2018 $31.4 $250.8 $109.0 $331.1
EBITDA 2019 $532.7 $254.2 $608.0
Avg
EV/EBITDA 2016 NA NA NA 106.0x
EV/EBITDA 2017 NA 23.1x 21.5x 20.0x 21.6x
EV/EBITDA 2018 19.8x 10.1x 9.0x 9.3x 9.5x
EV/EBITDA 2019 4.8x 3.9x 5.1x 4.6x
Source: Fact Set
Notes:US$ EMES recently announced the sale of their fuel business for $168MM and the numbers are not proforma for the saleHCLP recently acquired a 2.86MMT/Y mine and completed an equity offering and the numbers are not proforma for the transactionsSLCA acquired Sand Box Logistics and NBR and the numbers are not proforma for the transactions
TSX-V:SNS | OTC:CLICF
www.selectsandscorp.com
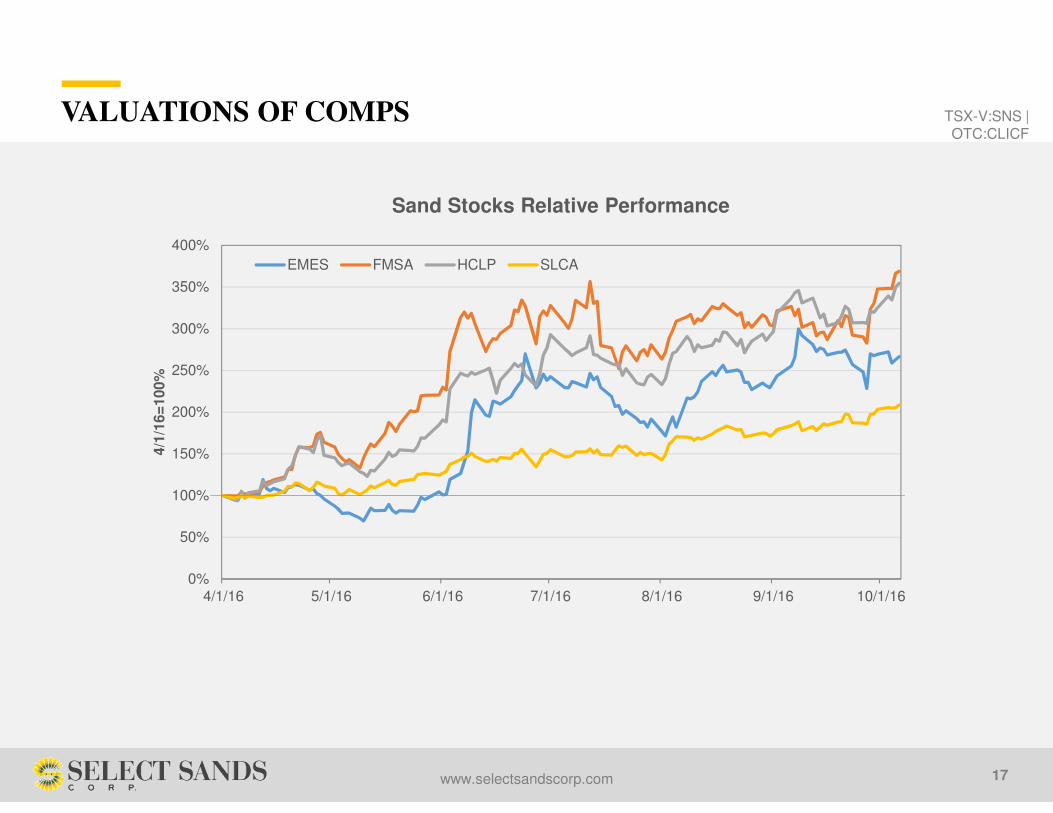
VALUATIONS OF COMPS
17
0%
50%
100%
150%
200%
250%
300%
350%
400%
4/1/16 5/1/16 6/1/16 7/1/16 8/1/16 9/1/16 10/1/16
4/1
/16=
100%
Sand Stocks Relative Performance
EMES FMSA HCLP SLCA
TSX-V:SNS | OTC:CLICF
www.selectsandscorp.com
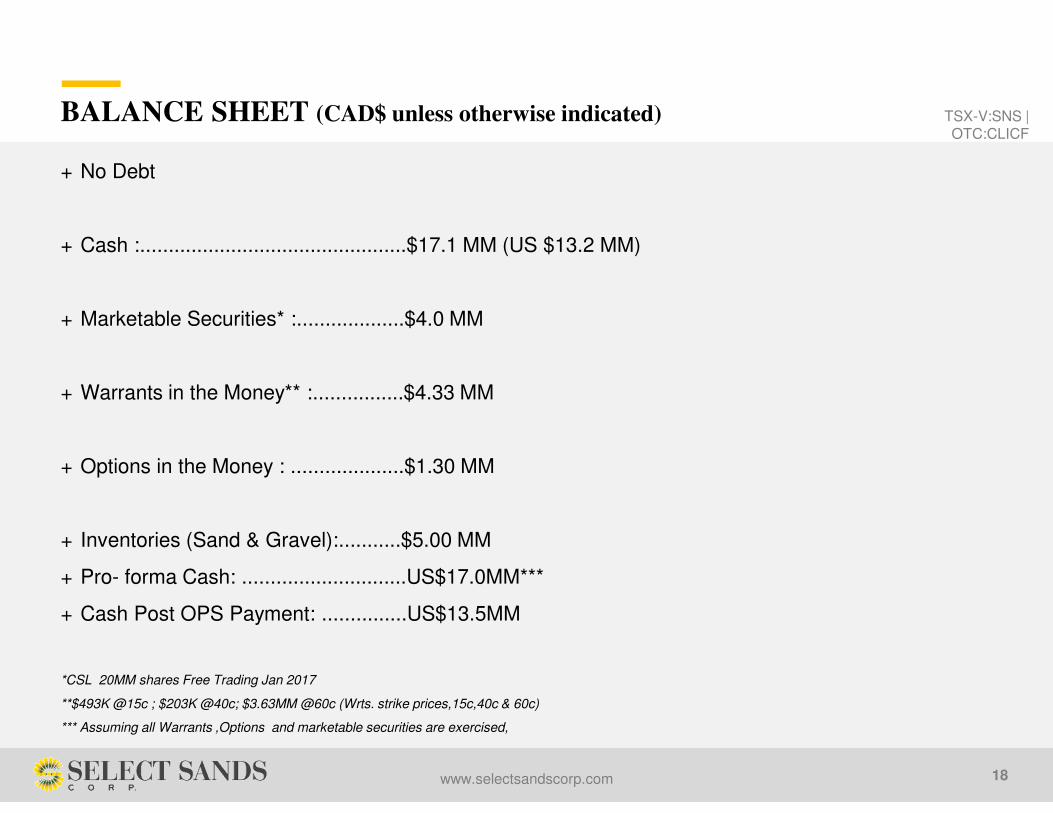
BALANCE SHEET (CAD$ unless otherwise indicated)
18
+ No Debt
+ Cash :...............................................$17.1 MM (US $13.2 MM)
+ Marketable Securities* :...................$4.0 MM
+ Warrants in the Money** :................$4.33 MM
+ Options in the Money : ....................$1.30 MM
+ Inventories (Sand & Gravel):...........$5.00 MM
+ Pro- forma Cash: .............................US$17.0MM***
+ Cash Post OPS Payment: ...............US$13.5MM
*CSL 20MM shares Free Trading Jan 2017
**$493K @15c ; $203K @40c; $3.63MM @60c (Wrts. strike prices,15c,40c & 60c)
*** Assuming all Warrants ,Options and marketable securities are exercised,

TSX-V:SNS | OTC:CLICF
www.selectsandscorp.com
INVESTMENT UPSIDE
19
+ Sandtown Project has a resource of 41.98MM tons (38.08MM tonnes) of drill indicated high purity silica resources
+ SNS’ PEA report Pre-tax NPV at 8% of US$160 million based on 20M tons of reserve
+ Premium silica product attributes which are in constant demand in both industrial and energy markets
+ Superior location of SNS sand quarry in Arkansas, USA to service industrial product suppliers and oil/gas fracking
markets based in Texas and surrounding states providing significant and sustainable logistic advantages and cost
savings to those end buyers
+ No Debt
+ Potential increase in market value of 20 MM Comstock (V.CSL) Shares (CSL shares are Free Trading on
Jan14,2017)
SIGNIFICANT OPPORTUNITIES
+ Become a significant Tier 1 Sand Supplier into Oil & Gas market
+ Purchasing additional nearby existing production facilities materially reducing capex and shortening time to
production
+ Ability to generate profitable business very rapidly with low capex
+ Value of SNS investment in CSL could increase substantially with the CSL ongoing exploration efforts
Cautionary Note: See Disclaimer on page 2; The PEA is preliminary in nature , and there is no certainty that the PEA will be realized.

TSX-V:SNS | OTC:CLICF
www.selectsandscorp.com
Producing and developing a Tier-1 commercial
silica deposit in Arkansas with low capex
+ Quality Tier-1 Grade Advantage + Logistics Advantage + Year Round Mining Advantage
+ Regional Producer
+ Situated to Serve South East U.S.A
+ Cost Effective
+ Mild Winters
+ Optimum Ground Conditions (No Sub-Zero Temperatures)
+ Operational Year-Round
+ Critical in a Variety of Industries
+ ”Northern White” Premium
FINAL TAKE AWAY
20
TSX-V:SNS | OTC:CLICF
www.selectsandscorp.com
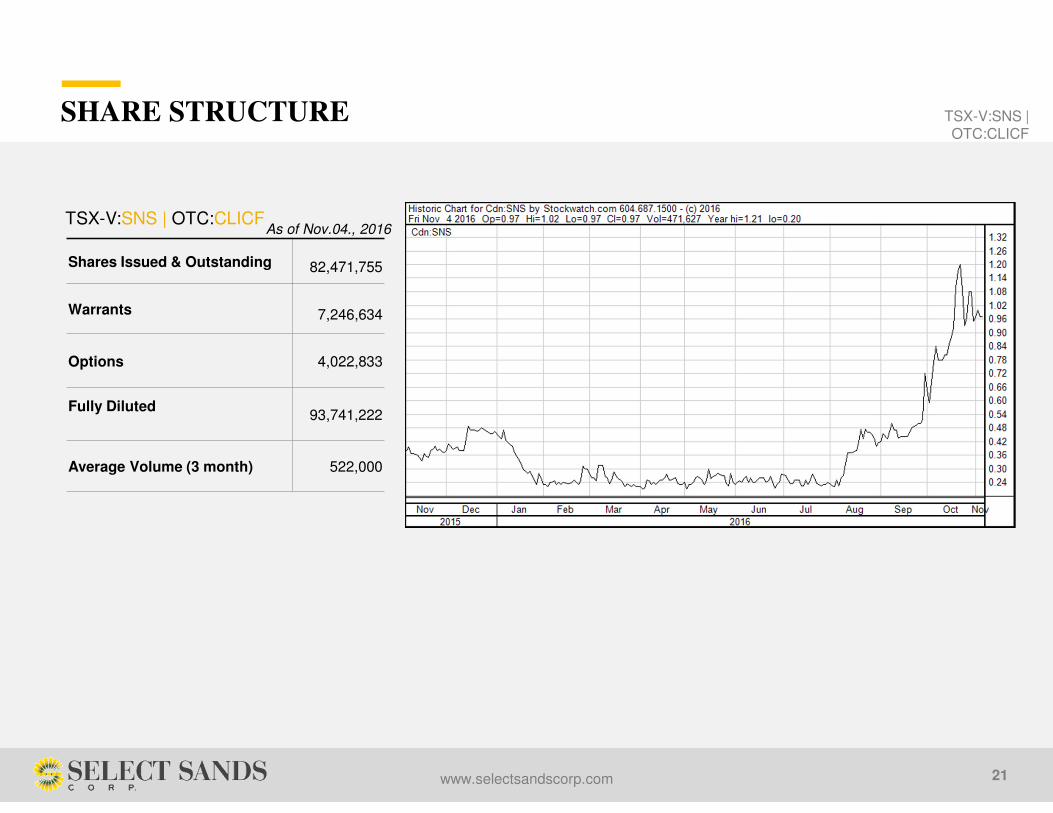
Shares Issued & Outstanding 82,471,755
Warrants 7,246,634
Options 4,022,833
Fully Diluted93,741,222
Average Volume (3 month) 522,000
As of Nov.04., 2016TSX-V:SNS | OTC:CLICF
SHARE STRUCTURE
21

310 – 850 West Hasting Street
Vancouver, British Columbia, Canada V6C 1E1
+1 604-639-4533
+1 604-669-2744
SELECT SANDS CORPORATION
www.kincommunications.com
INVESTOR RELATIONS
Kin Communications Inc.
100 – 736 Granville Street
Vancouver, British Columbia, Canada V6Z 1G3
+1 604-684-6730
+1 866-684-6730 (toll free)
www.selectsandscorp.com
22