selected financial data - verizon fios & custom tv | internet, cable … · ·...
TRANSCRIPT

25
Selected Financial data
v e r i zo n co m m u n i c at i o n s i n c . a n d s u b s i d i a r i e s
Verizon S&P 500 Telecom Services S&P 500
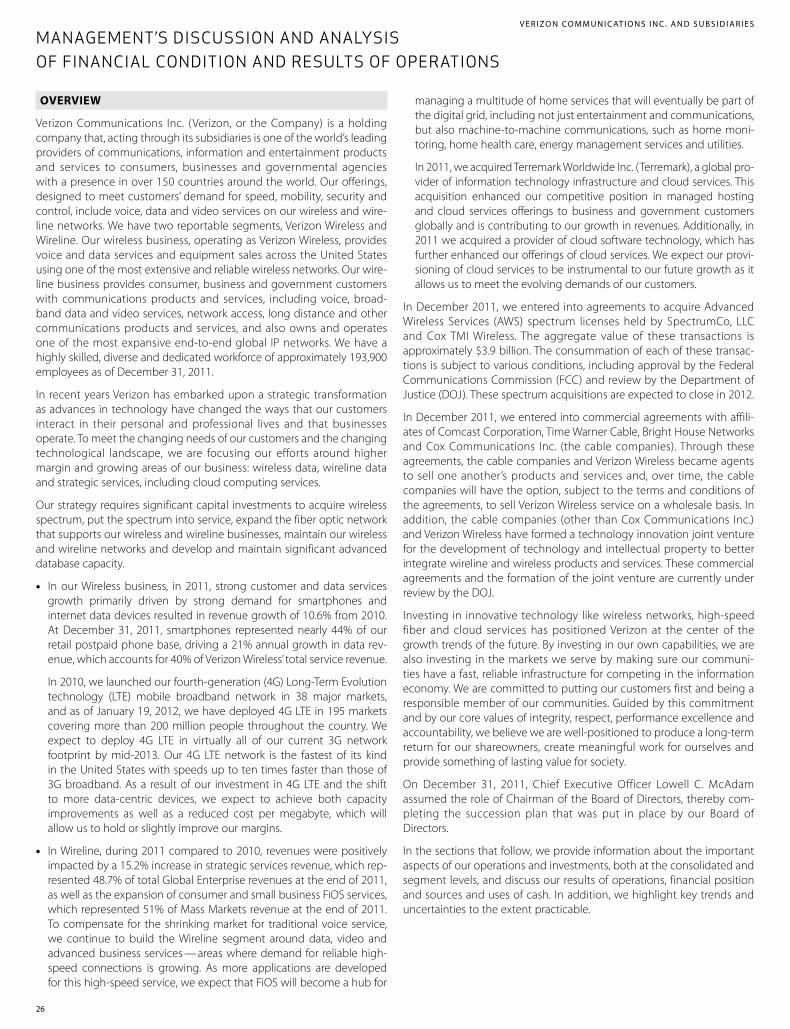
Stock Performance Graph
$100
$80
$60
$40
$140
$120
$160
2006 2007 2008 2009 2010 2011
Dol
lars
Comparison of Five-Year Total Return Among Verizon, S&P 500 Telecommunications Services Index and S&P 500 Stock Index
The graph compares the cumulative total returns of Verizon, the S&P 500 Telecommunications Services Index, and the S&P 500 Stock Index over a five-year period. It assumes $100 was invested on December 31, 2006 with dividends (including the value of each respective spin-off ) being reinvested.
Data Points in DollarsAt December 31,
2006 2007 2008 2009 2010 2011
Verizon 100.0 122.1 100.0 103.9 127.9 151.3 S&P 500 Telecom Services 100.0 111.9 77.8 84.7 100.8 107.3 S&P 500 100.0 105.5 66.5 84.1 96.7 98.8
(dollars in millions, except per share amounts)
2011 2010 2009 2008 2007
Results of Operations Operating revenues $ 110,875 $ 106,565 $ 107,808 $ 97,354 $ 93,469 Operating income 12,880 14,645 15,978 2,612 17,816 Income (loss) before discontinued operations and extraordinary item attributable to Verizon 2,404 2,549 4,894 (2,193) 7,201 Per common share – basic .85 .90 1.72 (.77) 2.48 Per common share – diluted .85 .90 1.72 (.77) 2.48 Net income (loss) attributable to Verizon 2,404 2,549 4,894 (2,193) 7,212 Per common share – basic .85 .90 1.72 (.77) 2.49 Per common share – diluted .85 .90 1.72 (.77) 2.49 Cash dividends declared per common share 1.975 1.925 1.870 1.780 1.670 Net income attributable to noncontrolling interest 7,794 7,668 6,707 6,155 5,053 Financial Position Total assets $ 230,461 $ 220,005 $ 226,907 $ 202,185 $ 186,942 Debt maturing within one year 4,849 7,542 7,205 4,993 2,954 Long-term debt 50,303 45,252 55,051 46,959 28,203 Employee benefit obligations 32,957 28,164 32,622 32,512 29,960 Noncontrolling interest 49,938 48,343 42,761 37,199 32,266 Equity attributable to Verizon 35,970 38,569 41,382 41,592 50,580
• Significanteventsaffectingourhistoricalearningstrendsin2009through2011aredescribedin“OtherItems”inthe“Management’sDiscussionandAnalysisofFinancialConditionandResults ofOperations”section.• 2008and2007dataincludessalesofbusinesses,severance,pensionandbenefitcharges,mergerintegrationcosts,andotheritems.
managing a multitude of home services that will eventually be part of the digital grid, including not just entertainment and communications, but also machine-to-machine communications, such as home moni-toring, home health care, energy management services and utilities.
In 2011, we acquired Terremark Worldwide Inc. (Terremark), a global pro-vider of information technology infrastructure and cloud services. This acquisition enhanced our competitive position in managed hosting and cloud services offerings to business and government customers globally and is contributing to our growth in revenues. Additionally, in 2011 we acquired a provider of cloud software technology, which has further enhanced our offerings of cloud services. We expect our provi-sioning of cloud services to be instrumental to our future growth as it allows us to meet the evolving demands of our customers.
In December 2011, we entered into agreements to acquire Advanced Wireless Services (AWS) spectrum licenses held by SpectrumCo, LLC and CoxTMIWireless. The aggregate value of these transactions isapproximately $3.9 billion. The consummation of each of these transac-tionsissubjecttovariousconditions,includingapprovalbytheFederalCommunicationsCommission(FCC)andreviewbytheDepartmentofJustice (DOJ). These spectrum acquisitions are expected to close in 2012.
In December 2011, we entered into commercial agreements with affili-ates of Comcast Corporation, Time Warner Cable, Bright House Networks and Cox Communications Inc. (the cable companies). Through these agreements, the cable companies and Verizon Wireless became agents to selloneanother’sproductsand servicesand,over time, thecablecompanies will have the option, subject to the terms and conditions of the agreements, to sell Verizon Wireless service on a wholesale basis. In addition, the cable companies (other than Cox Communications Inc.) and Verizon Wireless have formed a technology innovation joint venture for the development of technology and intellectual property to better integrate wireline and wireless products and services. These commercial agreements and the formation of the joint venture are currently under review by the DOJ.
Investing in innovative technology like wireless networks, high-speed fiber and cloud services has positioned Verizon at the center of the growth trends of the future. By investing in our own capabilities, we are also investing in the markets we serve by making sure our communi-ties have a fast, reliable infrastructure for competing in the information economy. We are committed to putting our customers first and being a responsible member of our communities. Guided by this commitment and by our core values of integrity, respect, performance excellence and accountability, we believe we are well-positioned to produce a long-term return for our shareowners, create meaningful work for ourselves and provide something of lasting value for society.
On December 31, 2011, Chief Executive Officer Lowell C. McAdamassumed the role of Chairman of the Board of Directors, thereby com-pleting the succession plan that was put in place by our Board of Directors.
In the sections that follow, we provide information about the important aspects of our operations and investments, both at the consolidated and segment levels, and discuss our results of operations, financial position and sources and uses of cash. In addition, we highlight key trends and uncertainties to the extent practicable.
Overview
Verizon Communications Inc. (Verizon, or the Company) is a holding companythat,actingthroughitssubsidiariesisoneoftheworld’sleadingproviders of communications, information and entertainment products and services to consumers, businesses and governmental agencies with a presence in over 150 countries around the world. Our offerings, designedtomeetcustomers’demandforspeed,mobility,securityandcontrol, include voice, data and video services on our wireless and wire-line networks. We have two reportable segments, Verizon Wireless and Wireline. Our wireless business, operating as Verizon Wireless, provides voice and data services and equipment sales across the United States using one of the most extensive and reliable wireless networks. Our wire-line business provides consumer, business and government customers with communications products and services, including voice, broad-band data and video services, network access, long distance and other communications products and services, and also owns and operates one of the most expansive end-to-end global IP networks. We have a highly skilled, diverse and dedicated workforce of approximately 193,900 employees as of December 31, 2011.
In recent years Verizon has embarked upon a strategic transformation as advances in technology have changed the ways that our customers interact in their personal and professional lives and that businesses operate. To meet the changing needs of our customers and the changing technological landscape, we are focusing our efforts around higher margin and growing areas of our business: wireless data, wireline data and strategic services, including cloud computing services.
Our strategy requires significant capital investments to acquire wireless spectrum, put the spectrum into service, expand the fiber optic network that supports our wireless and wireline businesses, maintain our wireless and wireline networks and develop and maintain significant advanced database capacity.
• In our Wireless business, in 2011, strong customer and data services growth primarily driven by strong demand for smartphones and internet data devices resulted in revenue growth of 10.6% from 2010. At December 31, 2011, smartphones represented nearly 44% of our retail postpaid phone base, driving a 21% annual growth in data rev-enue,whichaccountsfor40%ofVerizonWireless’totalservicerevenue.
In 2010, we launched our fourth-generation (4G) Long-Term Evolution technology (LTE) mobile broadband network in 38 major markets, and as of January 19, 2012, we have deployed 4G LTE in 195 markets covering more than 200 million people throughout the country. We expect to deploy 4G LTE in virtually all of our current 3G network footprint by mid-2013. Our 4G LTE network is the fastest of its kind in the United States with speeds up to ten times faster than those of 3G broadband. As a result of our investment in 4G LTE and the shift to more data-centric devices, we expect to achieve both capacity improvements as well as a reduced cost per megabyte, which will allow us to hold or slightly improve our margins.
• In Wireline, during 2011 compared to 2010, revenues were positively impacted by a 15.2% increase in strategic services revenue, which rep-resented 48.7% of total Global Enterprise revenues at the end of 2011, aswellastheexpansionofconsumerandsmallbusinessFiOSservices,whichrepresented51%ofMassMarketsrevenueattheendof2011.To compensate for the shrinking market for traditional voice service, we continue to build the Wireline segment around data, video and advanced business services — areas where demand for reliable high-speed connections is growing. As more applications are developed forthishigh-speedservice,weexpectthatFiOSwillbecomeahubfor
26
ManageMent’S diScuSSion and analySiS oF Financial condition and ReSultS oF opeRationS
v e r i zo n co m m u n i c at i o n s i n c . a n d s u b s i d i a r i e s

TrendsWe expect that competition will continue to intensify with traditional, non-traditional and emerging service providers seeking increased market share. We believe that our networks differentiate us from our competi-tors, enabling us to provide enhanced communications experiences to our customers. We believe our focus on the fundamentals of running a good business, including operating excellence and financial discipline, gives us the ability to plan and manage through changing economic conditions. We will continue to invest for growth, which we believe is the key to creating value for our shareowners.
Connection and Operating TrendsIn our Wireless segment, we expect to continue to attract and main-tain the loyalty of high-quality retail postpaid customers, capitalizing on customer demand for data services and bringing our customers new ways of using wireless services in their daily lives. We expect that future connection growth will accelerate as we continue to introduce new smartphones, internet devices such as tablets, and our suite of 4G LTE devices. We believe these devices will attract and retain higher value retail postpaid customers, contribute to continued increases in the pen-etration of data services and keep our device line-up competitive versus other wireless carriers. We expect future growth opportunities will be dependent on expanding the penetration of our data services, offering innovative wireless devices for both consumer and business customers and increasing the number of ways that our customers can connect with our network and services.
In recent years, we have experienced continuing access line losses in our Wireline segment as customers have disconnected both primary and secondary lines and switched to alternative technologies such as wire-less, VoIP and cable for voice and data services. We expect to continue to experience access line losses as customers continue to switch to alter-nate technologies. In the third quarter of 2011, we experienced a decline in our Wireline margin due to storm-related and work stoppage events thatoccurredinthequarter.However,wereducedourFiOSinstallationbacklog caused by the storm-related events, and we expect to continue improving margins in the Wireline segment in 2012.
Despite this challenging environment, we expect that we will continue to grow key aspects of our wireline business by providing superior network reliability, offering innovative product bundles that include high-speed Internet access, digital television and local and long distance voice ser-vices, offering more robust IP products and services, and accelerating our cloud computing strategy. We will also continue to focus on cost effi-ciencies to attempt to offset adverse impacts from unfavorable economic conditions.
Operating Revenue We expect to experience service revenue growth in our Verizon Wireless segment in 2012 primarily as a result of the growth of our postpaid customer base as well as continued data revenue growth driven by increased penetration of data services resulting from increased sales of smartphones and other data-capable devices. We expect that retail postpaidaveragerevenueperuser(ARPU)willcontinuetoincreaseasan increasing proportion of our customers use smartphone devices with bundled voice and data service plans. However, we expect both retail postpaidARPUandretailpostpaiddataARPUgrowthtobeadverselyimpacted by the ongoing declines in our average voice revenue per user, an expected decline in revenues from text messaging and an increase in the sale of lower priced packages for internet data devices, such as tablets,USBmodemsorJetpacks,formerlyknownas“MobileHotspots.”Inaddition,wehaveexperiencedARPUdilutionasaresultofcustomersoptimizing the value of their data packages for internet data devices,
and we expect this trend to continue. We expect that our future service revenue growth will be substantially derived from data revenue growth as we continue to expand the penetration of our wireless data offerings and increase our sales and usage of innovative wireless smartphones and other data-capable devices.
During 2011, we experienced a significant increase in Wireless equip-ment and other revenue as a result of sales of new smartphone devices, includingApple’siPhone4and4Sandour4GLTE-capabledevices.Weexpect that continued emphasis on increasing smartphone penetration will positively impact equipment revenue as these devices typically carry higher price points than basic phones.
WeexpectFiOSbroadbandandvideopenetrationtopositivelyimpactourMassMarketsrevenueandsubscriberbasebuttocontinuetoexperi-ence declining revenues in our Wireline segment primarily due to access line losses as a result of wireless substitution, along with a continued decline in our legacy wholesale and enterprise markets. However, we also expect continued growth of strategic services revenue as we derive addi-tional revenues from cloud, security and other solutions-based services and customers continue to migrate their services to Private IP and other strategic networking services.
Operating Costs and ExpensesWe anticipate our overall wireless operating costs will increase as a result of the expected increase in the volume of smartphone sales, which will result in higher equipment and sales commission costs. In addition, we expect content costs for our video services to continue to increase. However, we expect to continue to achieve other operating cost effi-ciencies through a number of cost savings initiatives to help control our overall operating costs. In addition, we continue to improve our pro-cesses across all business lines with a focus on improving productivity, which we expect will continue to contribute positively to our profitability.
Capital ExpendituresOur 2012 capital program includes capital to fund advanced networks and services, including4GLTEandFiOS, thecontinuedexpansionofour core networks, including our IP and data center enhancements, maintenance and support for our legacy voice networks and other expenditures to drive operating efficiencies. The amount and the timing oftheCompany’scapitalexpenditureswithinthesebroadcategoriescanvary significantly as a result of a variety of factors outside our control, including, for example, material weather events. We are not subject to any agreement that would constrain our ability to control our capital expenditures by requiring material capital expenditures on a designated schedule or upon the occurrence of designated events. Capital expendi-tures in 2011 were $16.2 billion, as compared to $16.5 billion in 2010. We believe that we have significant discretion over the amount and timing of our capital expenditures on a company-wide basis.
Cash Flow from OperationsWe create value for our shareowners by investing the cash flows gen-erated by our business in opportunities and transactions that support continued profitable growth, thereby increasing customer satisfaction and usage of our products and services. In addition, we have used our cash flows to maintain and grow our dividend payout to shareowners. Verizon’sBoardofDirectorsincreasedtheCompany’squarterlydividendby 2.6% during 2011, making this the fifth consecutive year in which we have raised our dividend.
Our goal is to use our cash to create long-term value for our shareholders. We will continue to look for investment opportunities that will help us to grow the business. When appropriate, we will also use our cash to reduce our debt levels and buy back shares of our outstanding common stock,
27
ManageMent’S diScuSSion and analySiS oF Financial condition and ReSultS oF opeRationS continued
andVerizonWirelessmaymakedistributionsto itspartners (see“CashFlowsfromFinancingActivities-Other,net”).
OtherWe do not currently expect that legislative efforts relating to climate control will have a material adverse impact on our consolidated financial results or financial condition. We believe there may be opportunities for companies to increase their use of communications services, including those we provide, in order to minimize the environmental impact of their businesses.
We continue to be actively involved in labor negotiations with our unions.Manyofourunion-representedemployeesarecurrentlyworkingunder an agreement indefinitely extending the contracts that expired in August 2011, with either the Company or the unions having the right to terminate the contract extension after providing seven days notice. The terms of any new contract will affect our future obligations to our employees for compensation and benefits.
COnsOlidated results Of OperatiOns
In this section, we discuss our overall results of operations and high-light items of a non-operational nature that are not included in our segment results. We have two reportable segments, which we operate and manage as strategic business units and organize by products and services.OursegmentsareVerizonWirelessandWireline. In“SegmentResultsofOperations,”wereviewtheperformanceofourtworeportablesegments.
Corporate, eliminations and other includes unallocated corporate expenses such as certain pension and other employee benefit related costs, intersegment eliminations recorded in consolidation, the results of other businesses such as our investments in unconsolidated busi-nesses, lease financing and divested operations, and other adjustments and gains and losses that are not allocated in assessing segment perfor-mance due to their non-operational nature. Although such transactions are excluded from the business segment results, they are included in reported consolidated earnings. Gains and losses that are not individually significant are included in all segment results as these items are included inthechiefoperatingdecisionmaker’sassessmentofsegmentperfor-mance. We believe that this presentation assists users of our financial statements in better understanding our results of operations and trends from period to period.
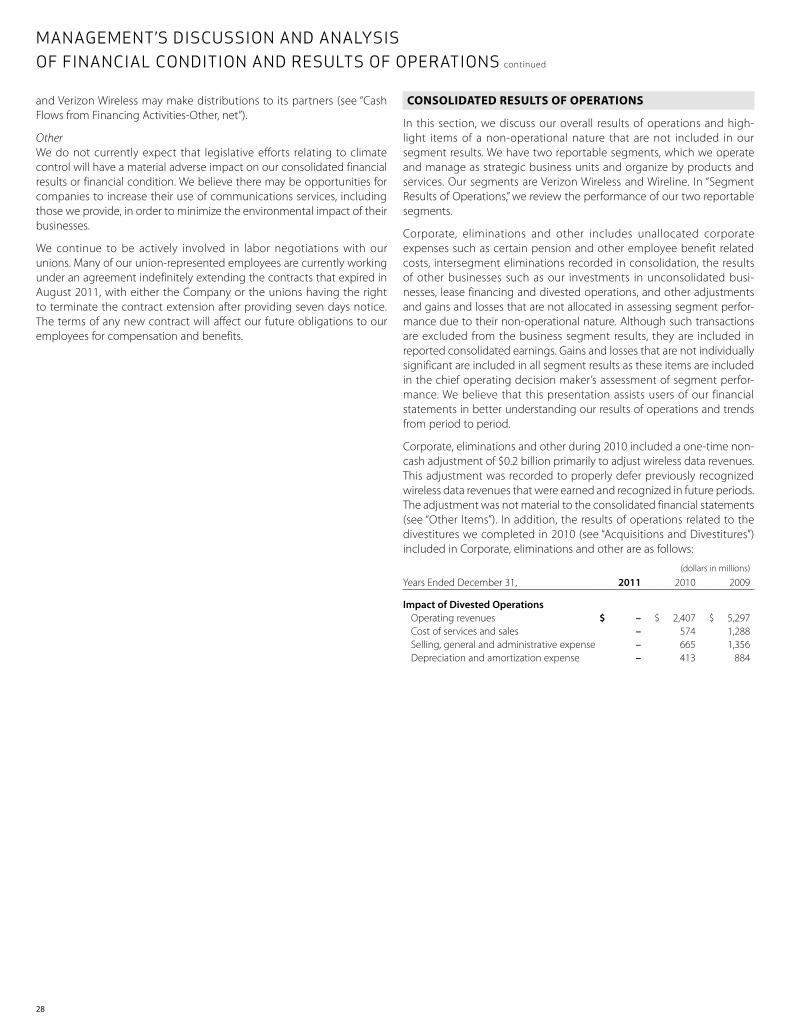
Corporate, eliminations and other during 2010 included a one-time non-cash adjustment of $0.2 billion primarily to adjust wireless data revenues. This adjustment was recorded to properly defer previously recognized wireless data revenues that were earned and recognized in future periods. The adjustment was not material to the consolidated financial statements (see“OtherItems”). Inaddition,theresultsofoperationsrelatedtothedivestitureswecompletedin2010(see“AcquisitionsandDivestitures”)included in Corporate, eliminations and other are as follows:
(dollars in millions)
Years Ended December 31, 2011 2010 2009
Impact of Divested Operations Operating revenues $ – $ 2,407 $ 5,297 Cost of services and sales – 574 1,288 Selling, general and administrative expense – 665 1,356 Depreciation and amortization expense – 413 884
28
ManageMent’S diScuSSion and analySiS oF Financial condition and ReSultS oF opeRationS continued

Consolidated Revenues
(dollars in millions) Increase/(Decrease)Years Ended December 31, 2011 2010 2009 2011 vs. 2010 2010 vs. 2009
Verizon Wireless Service revenue $ 59,157 $ 55,629 $ 52,046 $ 3,528 6.3 % $ 3,583 6.9 % Equipment and other 10,997 7,778 8,279 3,219 41.4 (501) (6.1) Total 70,154 63,407 60,325 6,747 10.6 3,082 5.1 Wireline MassMarkets 16,337 16,256 16,115 81 0.5 141 0.9 Global Enterprise 15,622 15,316 15,289 306 2.0 27 0.2 Global Wholesale 7,973 8,746 9,533 (773) (8.8) (787) (8.3) Other 750 909 1,514 (159) (17.5) (605) (40.0) Total 40,682 41,227 42,451 (545) (1.3) (1,224) (2.9) Corporate, eliminations and other 39 1,931 5,032 (1,892) (98.0) (3,101) (61.6) Consolidated Revenues $ 110,875 $ 106,565 $ 107,808 $ 4,310 4.0 $ (1,243) (1.2)
oftherevenuesofTerremark,andinMassMarkets,primarilyduetotheexpansionofFiOSservices(Voice,InternetandVideo),partiallyoffsetbythe decline of local exchange revenues.
2010 Compared to 2009The decrease in Consolidated revenues during 2010 compared to 2009 was primarily due to the impact of divested operations and declines in revenues at our Wireline segment resulting from switched access line lossesanddecreasedMOUsintraditionalvoiceproducts,partiallyoffsetby higher revenues in our growth markets.
The increase inVerizonWireless’ revenues during 2010 compared to2009 was primarily due to growth in service revenue. Service revenue increased during 2010 compared to 2009 primarily due to an increase in total customers since January 1, 2010, as well as continued growth in our dataARPU,partiallyoffsetbyadeclineinvoiceARPU.
Total wireless data revenue was $19.6 billion and accounted for 35.1% of service revenue during 2010, compared to $15.6 billion and 29.9% during 2009. Total data revenue increased as a result of the increased penetra-tion of data offerings, in particular for web and e-mail services resulting in part from increased sales of smartphone and other data-capable devices. Voice revenue decreased as a result of continued declines in our voice ARPU,partiallyoffsetbyanincreaseinthenumberofcustomers.
Equipment and other revenue decreased during 2010 compared to 2009 due to a decrease in the number of equipment units sold, which resulted from a decrease in customer gross additions.
ThedecreaseinWireline’srevenuesduring2010comparedto2009wasprimarily due to lower Global Wholesale and Other revenue, partially offsetbyan increase inMassMarketsrevenue.Thedecrease inGlobalWholesale revenues during 2010 compared to 2009 was primarily due to decreasedMOUsintraditionalvoiceproducts,increasesinvoicetermina-tion pricing on certain international routes, which negatively impacted volume, and continued rate compression due to competition in the marketplace. The decrease in Other revenue during 2010 compared to 2009 was primarily due to reduced business volumes, including former MCImassmarketcustomerlosses.TheincreaseinMassMarketsrevenueduring 2010 compared to 2009 was primarily driven by the expansion of FiOSservices(Voice,InternetandVideo),partiallyoffsetbythedeclineoflocal exchange revenues principally as a result of a decline in switched access lines. Global Enterprise revenues during 2010 compared to 2009 were essentially unchanged as higher customer premise equipment and strategic networking revenues were offset by lower local services and tra-ditional circuit-based revenues.
29
ManageMent’S diScuSSion and analySiS oF Financial condition and ReSultS oF opeRationS continued
2011 Compared to 2010The increase in consolidated revenues during 2011 compared to 2010 was primarily due to higher revenues at Verizon Wireless, the expan-sionofFiOSservicesandincreasedrevenuesfromstrategicservicesatour Wireline segment. In addition, the increase during 2011 was partially offset by the impact of divested operations.
TheincreaseinVerizonWireless’revenuesduring2011comparedto2010was primarily due to growth in both service and equipment revenue. Service revenue increased during 2011 compared to 2010 primarily due to an increase in total connections since January 1, 2011, as well as continued growth in our data revenue, partially offset by a decline in voice revenue.
Total wireless data revenue was $23.6 billion and accounted for 40.0% of service revenue during 2011 compared to $19.6 billion and 35.1% during 2010. Total data revenue continues to increase as a result of the increased penetration of data offerings, in particular for smartphone data service plans which provide our customers with access to web and e-mail via their wireless device. We have also experienced growth in data revenues for internet data devices such as tablets, USB modems and Jetpacks which also require service plans allowing access to data services. Voice revenue decreased as a result of continued declines in retail postpaid voiceARPUduetotheongoingimpactofourretailcustomersseekingto optimize the value of our voice minute bundles, partially offset by an increase in the number of customers.
Equipment and other revenue increased during 2011 compared to 2010 due to an increase in the sales volume for smartphones to new and upgrading customers. Partially offsetting these increases was a decrease in the sales volume for basic phones in both periods.
The decrease inWireline’s revenues during 2011 compared to 2010was primarily driven by declines in Global Wholesale and Other Global Enterprise revenues. The decrease in Global Wholesale revenues was pri-marily due to a $0.4 billion decline in international voice revenues as a resultofdecreasedminutesofuse(MOUs)intraditionalvoiceproductsas a result of increases in voice termination pricing on certain interna-tional routes. Other Global Enterprise revenues declined primarily due to lower customer premise equipment revenues, reflecting our focus on improving margins by de-emphasizing sales of equipment that are not a part of an overall enterprise solutions bundle, as well as customers migrating to next generation IP services. Other Wireline revenue also decreasedprimarily as a result of formerMCImassmarket customerlosses. These revenue declines were partially offset by continued revenue growth in Global Enterprise strategic services, in part due to the inclusion

2010 Compared to 2009Cost of Services and SalesCost of services and sales decreased during 2010 compared to 2009 pri-marily due to the impact of divested operations, lower headcount and productivity improvements at our Wireline and Verizon Wireless seg-ments, partially offset by higher severance, pension and benefit charges during 2010 and other non-operational charges noted in the table below as well as higher customer premise equipment and content costs. In addition, lower access costs at Wireline were primarily driven by manage-ment actions to reduce exposure to unprofitable international wholesale routes.OurFiOSVideoandInternetcostofacquisitionperadditionalsodecreased in 2010 compared to 2009. Wireless network costs increased as a result of an increase in local interconnection cost and increases in roaming costs.
Selling, General and Administrative ExpenseSelling, general and administrative expense increased during 2010 com-pared to 2009 primarily due to higher severance, pension and benefit charges, which primarily included a pension and postretirement ben-efit plan remeasurement loss in 2010 compared to a remeasurement gain in 2009, as well as the charges in connection with an agreement reached with certain unions on temporary enhancements. In addition, the increase in Selling, general and administrative expense reflected higher sales commission expense at our Verizon Wireless segment in our indirect channel as a result of increases in both the average commission per unit, as the mix of units continues to shift toward data devices and more customers activate data service, and contract renewals in connec-tion with equipment upgrades. Partially offsetting the increase was the impact of divested operations and the impact of cost reduction initia-tives in our Wireline segment. Selling, general and administrative expense during 2010 was also impacted by lower access line spin-off and merger integration related charges noted in the table below.
Depreciation and Amortization ExpenseDepreciation and amortization expense decreased during 2010 com-pared to 2009. The decrease was primarily due to the impact of divested operations, partially offset by additions to the depreciable asset base. Depreciation and amortization expense during 2010 was also impacted by lower non-operational charges noted in the table below.
30
Consolidated Operating Expenses
(dollars in millions) Increase/(Decrease)Years Ended December 31, 2011 2010 2009 2011 vs. 2010 2010 vs. 2009
Cost of services and sales $ 45,875 $ 44,149 $ 44,579 $ 1,726 3.9 % $ (430) (1.0) %Selling, general and administrative expense 35,624 31,366 30,717 4,258 13.6 649 2.1 Depreciation and amortization expense 16,496 16,405 16,534 91 0.6 (129) (0.8) Consolidated Operating Expenses $ 97,995 $ 91,920 $ 91,830 $ 6,075 6.6 $ 90 0.1
Consolidated operating expenses increased during 2011 and 2010 pri-marilyduetohigherseverance,pensionandbenefitcharges(see“OtherItems”)aswellasincreasedoperatingexpensesatVerizonWireless.Thechanges in consolidated operating expenses during 2011 and 2010 were also favorably impacted by divested operations.
2011 Compared to 2010Cost of Services and SalesCost of services and sales includes the following costs directly attribut-able to a service or product: salaries and wages, benefits, materials and supplies, contracted services, network access and transport costs, wire-less equipment costs, customer provisioning costs, computer systems support, costs to support our outsourcing contracts and technical facili-tiesandcontributionstotheUniversalServiceFund.Aggregatecustomercare costs, which include billing and service provisioning, are allocated between Cost of services and sales and Selling, general and administra-tive expense.
Cost of services and sales increased during 2011 compared to 2010 primarily due to higher cost of equipment sales at our Verizon Wireless segment, as well as increased costs at our Wireline segment related to repair and maintenance expenses caused by storm-related events during 2011, higher content costs associated with continued FiOSsubscriber growth and the acquisition of Terremark in the second quarter of 2011. Partially offsetting the increase were lower non-operational charges noted in the table below, a decrease in access costs resulting primarily from management actions to reduce exposure to unprofitable international wholesale routes and declines in overall wholesale long distance volumes.
Selling, General and Administrative ExpenseSelling, general and administrative expense includes: salaries and wages and benefits not directly attributable to a service or product; bad debt charges; taxes other than income taxes; advertising and sales commis-sion costs; customer billing; call center and information technology costs; professional service fees; and rent and utilities for administrative space.
Selling, general and administrative expense increased during 2011 com-pared to 2010 primarily due to higher severance, pension and benefit charges and costs caused by storm-related events as well as higher sales commission expense at our Verizon Wireless segment. Partially offset-ting the increase was the absence of merger integration and acquisition related charges and access line spin-off charges during 2011 and a decrease in compensation expense at our Wireline segment.
Depreciation and Amortization ExpenseDepreciation and amortization expense increased during 2011 com-pared to 2010 as a result of growth in depreciable assets at our Wireless segment and the acquisition of Terremark in the second quarter of 2011, partially offset by lower non-operational charges noted in the table below and amortization expense as a result of a reduction in capitalized non-network software at our Wireline segment. The change in depre-ciation and amortization expense was also partially attributable to the impact of divested operations.
ManageMent’S diScuSSion and analySiS oF Financial condition and ReSultS oF opeRationS continued
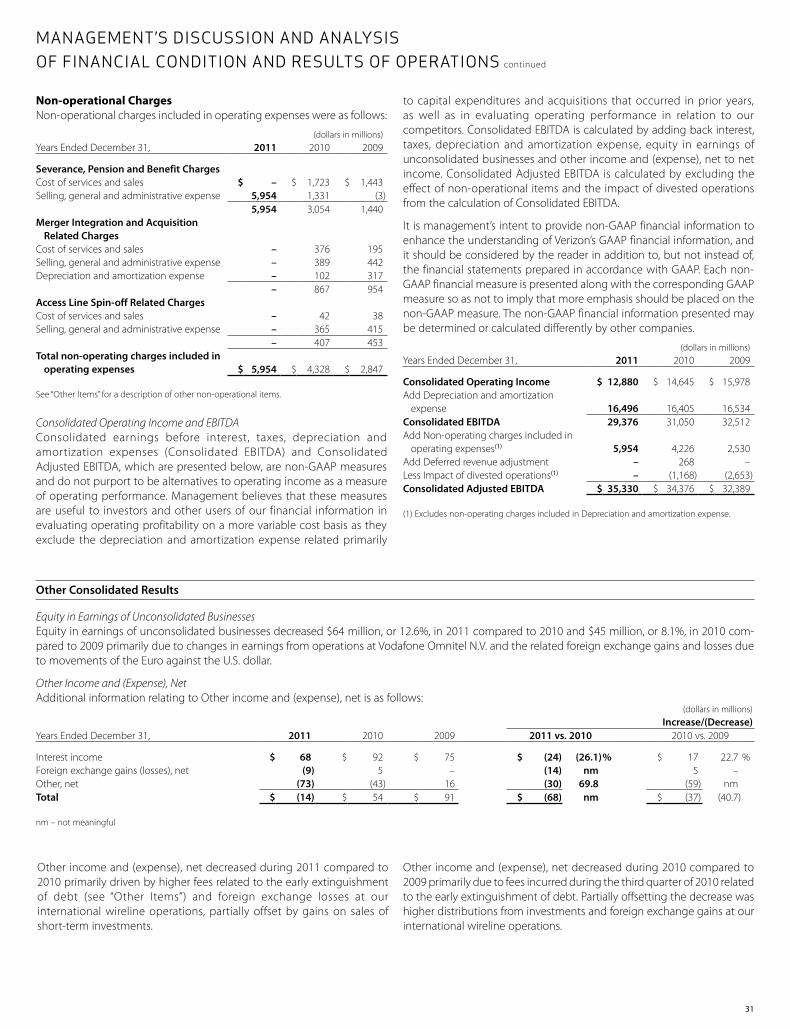
non-operational ChargesNon-operational charges included in operating expenses were as follows:
(dollars in millions)Years Ended December 31, 2011 2010 2009
Severance, Pension and Benefit Charges Cost of services and sales $ – $ 1,723 $ 1,443 Selling, general and administrative expense 5,954 1,331 (3) 5,954 3,054 1,440 Merger Integration and Acquisition
Related Charges Cost of services and sales – 376 195 Selling, general and administrative expense – 389 442 Depreciation and amortization expense – 102 317 – 867 954 Access Line Spin-off Related Charges Cost of services and sales – 42 38 Selling, general and administrative expense – 365 415 – 407 453 Total non-operating charges included in
operating expenses $ 5,954 $ 4,328 $ 2,847
See“OtherItems”foradescriptionofothernon-operationalitems.
Consolidated Operating Income and EBITDAConsolidated earnings before interest, taxes, depreciation and amortization expenses (Consolidated EBITDA) and Consolidated Adjusted EBITDA, which are presented below, are non-GAAP measures and do not purport to be alternatives to operating income as a measure ofoperatingperformance.Managementbelievesthatthesemeasuresare useful to investors and other users of our financial information in evaluating operating profitability on a more variable cost basis as they exclude the depreciation and amortization expense related primarily
31
to capital expenditures and acquisitions that occurred in prior years, as well as in evaluating operating performance in relation to our competitors. Consolidated EBITDA is calculated by adding back interest, taxes, depreciation and amortization expense, equity in earnings of unconsolidated businesses and other income and (expense), net to net income. Consolidated Adjusted EBITDA is calculated by excluding the effect of non-operational items and the impact of divested operations from the calculation of Consolidated EBITDA.
Itismanagement’sintenttoprovidenon-GAAPfinancialinformationtoenhancetheunderstandingofVerizon’sGAAPfinancialinformation,andit should be considered by the reader in addition to, but not instead of, the financial statements prepared in accordance with GAAP. Each non-GAAP financial measure is presented along with the corresponding GAAP measure so as not to imply that more emphasis should be placed on the non-GAAP measure. The non-GAAP financial information presented may be determined or calculated differently by other companies.
(dollars in millions)Years Ended December 31, 2011 2010 2009
Consolidated Operating Income $ 12,880 $ 14,645 $ 15,978 Add Depreciation and amortization
expense 16,496 16,405 16,534 Consolidated EBITDA 29,376 31,050 32,512 Add Non-operating charges included in
operating expenses(1) 5,954 4,226 2,530 Add Deferred revenue adjustment – 268 – Less Impact of divested operations(1) – (1,168) (2,653)Consolidated Adjusted EBITDA $ 35,330 $ 34,376 $ 32,389
(1) Excludes non-operating charges included in Depreciation and amortization expense.
ManageMent’S diScuSSion and analySiS oF Financial condition and ReSultS oF opeRationS continued
Other Consolidated Results
Equity in Earnings of Unconsolidated BusinessesEquity in earnings of unconsolidated businesses decreased $64 million, or 12.6%, in 2011 compared to 2010 and $45 million, or 8.1%, in 2010 com-pared to 2009 primarily due to changes in earnings from operations at Vodafone Omnitel N.V. and the related foreign exchange gains and losses due to movements of the Euro against the U.S. dollar.
Other Income and (Expense), NetAdditional information relating to Other income and (expense), net is as follows:
(dollars in millions) Increase/(Decrease)Years Ended December 31, 2011 2010 2009 2011 vs. 2010 2010 vs. 2009
Interest income $ 68 $ 92 $ 75 $ (24) (26.1)% $ 17 22.7 %Foreignexchangegains(losses),net (9) 5 – (14) nm 5 – Other, net (73) (43) 16 (30) 69.8 (59) nm Total $ (14) $ 54 $ 91 $ (68) nm $ (37) (40.7)
nm – not meaningful
Other income and (expense), net decreased during 2011 compared to 2010 primarily driven by higher fees related to the early extinguishment of debt (see “Other Items”) and foreign exchange losses at our international wireline operations, partially offset by gains on sales of short-term investments.
Other income and (expense), net decreased during 2010 compared to 2009 primarily due to fees incurred during the third quarter of 2010 related to the early extinguishment of debt. Partially offsetting the decrease was higher distributions from investments and foreign exchange gains at our international wireline operations.

32
Interest Expense (dollars in millions) Increase/(Decrease)Years Ended December 31, 2011 2010 2009 2011 vs. 2010 2010 vs. 2009
Total interest costs on debt balances $ 3,269 $ 3,487 $ 4,029 $ (218) (6.3)% $ (542) (13.5) %Less capitalized interest costs 442 964 927 (522) (54.1) 37 4.0 Total $ 2,827 $ 2,523 $ 3,102 $ 304 12.0 $ (579) (18.7) Average debt outstanding $ 55,629 $ 57,278 $ 64,039 Effective interest rate 5.9 % 6.1 % 6.3 %
Total interest costs on debt balances decreased during 2011 com-pared to 2010 primarily due to a $1.6 billion decrease in average debt (see“ConsolidatedFinancialCondition”)anda lowereffective interestrate. Capitalized interest costs were lower in 2011 primarily due to our ongoing deployment of the 4G LTE network.
Provision for Income Taxes (dollars in millions) Increase/(Decrease)Years Ended December 31, 2011 2010 2009 2011 vs. 2010 2010 vs. 2009
Provision for income taxes $ 285 $ 2,467 $ 1,919 $ (2,182) (88.4)% $ 548 28.6 %Effective income tax rate 2.7 % 19.4 % 14.2 %
Total interest costs on debt balances decreased during 2010 compared to 2009 primarily due to a $6.8 billion decline in average debt. Interest costs during 2009 included fees related to the bridge facility that was entered into and utilized to complete the acquisition of Alltel Corporation (Alltel), which contributed to the higher effective interest rate.
The effective income tax rate is calculated by dividing the provision for income taxes by income before the provision for income taxes. Our effective income tax rate is significantly lower than the statutory federal income tax rate for all years presented due to the inclusion of income attributabletoVodafoneGroupPlc.’s(Vodafone)noncontrollinginterestin the Verizon Wireless partnership within our income before the provi-sion for income taxes, which resulted in our effective income tax rate being 7.9, 29.8 and 14.0 percentage points lower during 2011, 2010 and 2009, respectively.
The effective income tax rate in 2011 decreased to 2.7% from 19.4% in 2010. This decrease was primarily driven by lower income before provi-sion for income taxes as a result of higher pension and benefit charges recorded in 2011 as well as tax benefits from state valuation allowance reversals in 2011. The decrease was also due to a one-time, non-cash income tax charge of $1.0 billion recorded during the three months ended March31,2010asaresultoftheenactmentofthePatientProtectionandAffordableCareActandtheHealthCareandEducationReconciliationActof2010,bothofwhichbecamelawinMarch2010(collectivelytheHealth Care Act). Under the Health Care Act, beginning in 2013, Verizon
andothercompaniesthatreceiveasubsidyunderMedicarePartDtoprovide retiree prescription drug coverage will no longer receive a fed-eral income tax deduction for the expenses incurred in connection with providing the subsidized coverage to the extent of the subsidy received. Because future anticipated retiree prescription drug plan liabilities and relatedsubsidiesarealreadyreflectedinVerizon’sfinancialstatements,this change in law required Verizon to reduce the value of the related tax benefits recognized in its financial statements in the period during which the Health Care Act was enacted.
The effective income tax rate in 2010 increased to 19.4% from 14.2% in 2009. The increase was primarily driven by a one-time, non-cash income tax charge of $1.0 billion for the Health Care Act described above. The increase was partially offset primarily by higher earnings attributable to Vodafone’snoncontrollinginterestintheVerizonWirelesspartnership.
A reconciliation of the statutory federal income tax rate to the effective income tax rate for each period is included in Note 12 to the consoli-dated financial statements.
ManageMent’S diScuSSion and analySiS oF Financial condition and ReSultS oF opeRationS continued
Net Income Attributable to Noncontrolling Interest (dollars in millions) Increase/(Decrease)Years Ended December 31, 2011 2010 2009 2011 vs. 2010 2010 vs. 2009
Net income attributable to noncontrolling interest $ 7,794 $ 7,668 $ 6,707 $ 126 1.6 % $ 961 14.3 %
The increases in Net income attributable to noncontrolling interest during 2011 compared to 2010, and 2010 compared to 2009 were due to higher earnings in our Verizon Wireless segment, which has a 45% noncontrol-ling partnership interest attributable to Vodafone.

33
segment results Of OperatiOns
We have two reportable segments, Verizon Wireless and Wireline, which we operate and manage as strategic business units and organize by products and services. We measure and evaluate our reportable segments based on segment operating income. The use of segment operating income is con-sistentwiththechiefoperatingdecisionmaker’sassessmentofsegmentperformance.
Segment EBITDA, which is presented below, is a non-GAAP measure and does not purport to be an alternative to operating income as a measure of operatingperformance.Managementbelievesthatthismeasureisusefultoinvestorsandotherusersofourfinancialinformationinevaluatingoper-ating profitability on a more variable cost basis as it excludes the depreciation and amortization expense related primarily to capital expenditures and acquisitions that occurred in prior years, as well as in evaluating operating performance in relation to our competitors. Segment EBITDA is calculated by adding back depreciation and amortization expense to segment operating income.
Verizon Wireless Segment EBITDA service margin, also presented below, is calculated by dividing Verizon Wireless Segment EBITDA by Verizon Wireless service revenues. Verizon Wireless Segment EBITDA service margin utilizes service revenues rather than total revenues. Service revenues primarily exclude equipment revenues in order to reflect the impact of providing service to the wireless customer base on an ongoing basis. Verizon Wireline EBITDA margin is calculated by dividing Wireline EBITDA by total Wireline revenues. You can find additional information about our segments in Note 13 to the consolidated financial statements.
Verizon Wireless
Our Verizon Wireless segment, primarily comprised of Cellco Partnership doing business as Verizon Wireless, is a joint venture formed in April 2000 by the combination of the U.S. wireless operations and interests of Verizon and Vodafone. Verizon owns a controlling 55% interest in Verizon Wireless and Vodafone owns the remaining 45%. Verizon Wireless provides wireless voice and data services across one of the most extensive wireless networks in the United States and has the largest 3G and 4G LTE networks of any U.S. wireless service provider.
We provide these services and equipment sales to consumer, business and government customers in the United States on a postpaid and prepaid basis. Postpaid customers represent individual lines of service for which a customer pays in advance a monthly access charge in return for a monthly voice and/or data service allowance, and use of any services beyond the allowances is billed monthly in arrears. Our prepaid service enables indi-viduals to obtain wireless data and voice services without a long-term contract or credit verification by paying in advance.
All financial results included in the tables below reflect the consolidated results of Verizon Wireless.
Operating Revenue and Selected Operating Statistics (dollarsinmillions,exceptARPU) Increase/(Decrease)Years Ended December 31, 2011 2010 2009 2011 vs. 2010 2010 vs. 2009
Retailservice $ 56,660 $ 53,308 $ 50,760 $ 3,352 6.3 % $ 2,548 5.0 % Other service 2,497 2,321 1,286 176 7.6 1,035 80.5 Service revenue 59,157 55,629 52,046 3,528 6.3 3,583 6.9 Equipment and other 10,997 7,778 8,279 3,219 41.4 (501) (6.1) Total Operating Revenue $ 70,154 $ 63,407 $ 60,325 $ 6,747 10.6 $ 3,082 5.1 Connections(’000):(1) Total connections(2) 107,798 102,246 96,495 5,552 5.4 5,751 6.0 Retailcustomers 92,167 87,535 85,445 4,632 5.3 2,090 2.4 Retailpostpaidcustomers 87,382 83,125 80,495 4,257 5.1 2,630 3.3 Netadditionsinperiod(’000):(3) Total connections(2) 5,419 5,517 4,935 (98) (1.8) 582 11.8 Retailcustomers 4,624 1,977 4,369 2,647 133.9 (2,392) (54.7) Retailpostpaidcustomers 4,252 2,529 3,987 1,723 68.1 (1,458) (36.6) ChurnRate: Retailcustomers 1.26 % 1.38 % 1.41 % Retailpostpaidcustomers 0.95 % 1.02 % 1.07 % ARPU: Retailservice $ 52.69 $ 51.51 $ 50.85 $ 1.18 2.3 $ 0.66 1.3 Retailpostpaid 54.34 53.14 52.29 1.20 2.3 0.85 1.6 Retailpostpaiddata 21.70 18.78 15.75 2.92 15.5 3.03 19.2
(1) As of end of period.(2) The number of Total connections for 2011 reflects a reduction of 869,000 Wholesale and Other Connections from previously reported numbers.(3) Excluding acquisitions and adjustments.
ManageMent’S diScuSSion and analySiS oF Financial condition and ReSultS oF opeRationS continued

34
2011 Compared to 2010The increase inVerizonWireless’ totaloperating revenueduring2011compared to 2010 was primarily due to growth in service and equip-ment revenue.
ConnectionsTotal connections increased during 2011 compared to 2010 primarily due to an increase in retail postpaid customer gross additions as well as ongoing improvements in our retail customer churn rate, both of which we believe were primarily the result of the strength of the devices in our product portfolio, including the Apple iPhone 4 and 4S and our line-up of 3G and 4G Android and other 4G LTE capable devices, as well as the reliability of our network, partially offset by a year-over-year decline in net additions from wholesale and other connections.
Total connections represent the total of our retail customers and whole-sale and other connections. Wholesale and other connections include customers from our reseller channel as well as connections from non-tra-ditional wireless-enabled devices, such as those used to support vehicle tracking, telematics services and machine-to-machine connections.
Retail(non-wholesale)customersarecustomersdirectlyservedandman-agedbyVerizonWirelessthatuseitsbrandedservices.Retailpostpaidcustomers represent individual lines of service for which a customer pays in advance a monthly access charge in return for a monthly voice and/or data service allowance, and use of any services beyond the allow-ances is billed in arrears. Churn is the rate at which customers disconnect individual lines of service. We expect to continue to experience retail customer growth based on the strength of our product offerings and network service quality.
Service revenueService revenue increased during 2011 compared to 2010 primarily due to the above-mentioned increase in total connections during the year, as well as continued growth in data revenue, partially offset by a decline in voice revenue.
Total data revenue was $23.6 billion and accounted for 40.0% of service revenue during 2011 compared to $19.6 billion and 35.1% during 2010. Total data revenue continues to increase as a result of the increased penetration of our data offerings, in particular for higher-tier data ser-vice plans which provide our customers with access to web and e-mail via their wireless device. We have also experienced growth in data rev-enues from the use of internet data devices such as tablets, USB modems and Jetpacks. Voice revenue decreased as a result of continued declines inretailpostpaidvoiceARPU,asdiscussedbelow,partiallyoffsetbyanincrease in the number of customers. We expect that total service revenue and total data revenue will continue to grow as we grow our customer base and increase the penetration of our data offerings as a larger propor-tion of our customers use smartphones and other data-capable devices.
TheincreasesinretailserviceARPU(theaveragerevenueperuserpermonthfromretailcustomers)andretailpostpaidARPU(theaveragerev-enue per user per month from retail postpaid customers) during 2011 compared to 2010 were due to a continued increase in our retail post-paiddataARPU,offsetbyadecline inour retailpostpaidvoiceARPU.RetailpostpaiddataARPUincreasedasaresultofcontinuedgrowthinthe proportion of our customer base using smartphones, which grew to 43.5% of our retail postpaid customers as of December 31, 2011 com-pared to 28.1% at December 31, 2010. However, both retail postpaid ARPUandretailpostpaiddataARPUgrowthwereadverselyimpactedbythe growing proportion of our customers using internet data devices and customers optimizing the value of their data packages for these devices. Internet data devices represented 8.1% of our retail postpaid customer base as of December 31, 2011 compared to 7.0% at December 31, 2010. Inaddition,ourretailpostpaidvoiceARPUwas$32.64during2011,rep-resenting a decline of $1.72, or 5.0%, compared to 2010 primarily due to
the ongoing impact of our retail customers seeking to optimize the value of our voice minute bundles.
Other service revenue includes revenue from wholesale and other con-nections as well as third party roaming revenue. Other service revenue increased during 2011 compared to 2010 as a result of year-to-date growth in wholesale and other connections, partially offset by a decrease in third party roaming revenue.
Equipment and Other RevenueEquipment and other revenue increased during 2011 compared to 2010 due to an increase in the sales volume of smartphones to new and upgrading customers. Partially offsetting these increases was a decrease in the sales volume for basic phones in both periods.
2010 Compared to 2009The increase inVerizonWireless’ totaloperating revenueduring2010compared to 2009 was primarily due to growth in service revenue.
ConnectionsTotal connections increased during 2010 compared to 2009 due to the increase during the year in customer net additions from our reseller channel as a result of the marketplace shift in customer activations during the first half of the year toward unlimited prepaid offerings of the type being sold by a number of resellers, as well as connections from non-traditional wire-less-enabled devices, partially offset by the decline in retail customer net additions. The decline in retail customer net additions during 2010 com-pared to 2009 was due to a decrease in retail customer gross additions, as well as an increase in churn for our retail prepaid base in part due to the marketplace shift in customer activations mentioned above.
Customers from acquisitions and adjustments at December 31, 2010 included approximately 106,000 net customers, after conforming adjust-ments, that we acquired in a transaction with AT&T. Customers from acquisitions at December 31, 2009 included approximately 11.4 million total customer net additions, after conforming adjustments and the impact of required divestitures, which resulted from our acquisition of AlltelinJanuary2009(see“AcquisitionsandDivestitures”).
Service revenueService revenue increased during 2010 compared to 2009 primarily due to an increase in total customers since January 1, 2010, as well as con-tinuedgrowthinourdataARPU,partiallyoffsetbyadeclineinvoiceARPU.
Total data revenue was $19.6 billion and accounted for 35.1% of service revenue during 2010 compared to $15.6 billion and 29.9% during 2009. Total data revenue increased as a result of the increased penetration of our data offerings, in particular for web and e-mail services resulting in part from increased sales of smartphone and other data-capable devices. Voice revenuedecreasedasaresultofcontinueddeclinesinourvoiceARPU,asdiscussed below, partially offset by an increase in the number of customers.
ThedeclineinserviceARPUduring2010comparedto2009wasduetoa continued reduction in voice revenue per customer and the impact of changes in our customer mix as a result of increased reseller customer net additions,partiallyoffsetbyanincreaseinretailpostpaiddataARPU.TotalretailpostpaidvoiceARPUdeclined$2.18,or6.0%,duetotheongoingimpact of customers seeking to optimize the value of our voice minute bundles.TotalretailpostpaiddataARPUincreasedasaresultofcontinuedgrowth and penetration of our data offerings resulting in part from the above mentioned increase in sales of our smartphones and other data-capabledevices.RetailserviceARPU,theaveragerevenueperuserfromretail customers, increased during 2010 due to increases in our penetration of data offerings which more than offset declines in our voice revenues.
Equipment and Other RevenueEquipment and other revenue decreased during 2010 compared to 2009 due to a decrease in the number of equipment units sold as a result of a decrease in customer gross additions.
ManageMent’S diScuSSion and analySiS oF Financial condition and ReSultS oF opeRationS continued

35
ManageMent’S diScuSSion and analySiS oF Financial condition and ReSultS oF opeRationS continued
Cost of Services and SalesCost of services and sales increased during 2011 compared to 2010 primarily due to higher costs of equipment sales. Cost of equipment sales increased by $4.9 billion driven by increased sales of higher cost smartphones,includingApple’siPhone4and4Sandotherdata-capabledevices. Partially offsetting these increases were decreases in the volume sold and average cost per unit of basic phones. In addition, cost of services increased during 2011 due to higher wireless network costs resulting from an increase in local interconnection costs related to addi-tional Evolution-Data Optimized (EV-DO) capacity to meet expected data usage demands as well as an increase in Ethernet facilities costs that support the 4G LTE network. The increase in cost of services was also impacted by higher roaming costs incurred in markets divested during 2010 and increased data roaming. Partially offsetting these increases was a decrease in costs for long distance and data services and applications.
Cost of services and sales decreased during 2010 compared to 2009 due to a decrease in the cost of equipment sales, partially offset by an increase in cost of services. Cost of equipment sales decreased by $0.6 billion primarily due to both a decrease in retail customer gross addi-tions and cost reduction initiatives, partially offset by an increase in the average cost per unit. Cost of services increased due to higher wireless network costs driven by increases in local interconnection cost as a result of both higher capacity needs from increases in data usage as well as costs incurred to transition to Ethernet facilities used to support the 4G LTE network. In addition, the increase in costs of services was impacted by higher roaming costs as a result of increased international roaming vol-umes, data roaming and roaming costs incurred in the markets divested during 2010, partially offset by synergies from moving traffic to our own network. Also contributing to higher wireless network costs during 2010 compared to 2009 was an increase in operating lease expense related to our network cell sites.
Selling, General and Administrative ExpenseSelling, general and administrative expense increased during 2011 com-pared to 2010 primarily due to higher sales commission expense in our indirect channel. Indirect sales commission expense increased $1.2 bil-lion during 2011 compared to 2010 as a result of increases in the average commission per unit, as the mix of units continues to shift toward data devices and more customers activate data services, and increased con-tract renewals in connection with equipment upgrades.
Selling, general and administrative expense increased during 2010 compared to 2009 primarily due to an increase in sales commission expense in our indirect channel, as well as increases in other general and administrative expenses, partially offset by a decrease in advertising and promotional costs. Indirect sales commission expense increased $0.8 billion during 2010 compared to 2009 as a result of increases in both the average commission per unit, as the mix of units continues to shift toward data devices and more customers activate data service, and in contract renewals in connection with equipment upgrades. Other gen-eral and administrative expenses such as billing and data processing charges, non-income taxes, and bad debt expense increased primarily as a result of the growth of our customer base. Advertising and promotional costs decreased $0.2 billion during 2010 compared to 2009 primarily due to reductions in media spending.
Depreciation and Amortization ExpenseThe changes in depreciation and amortization expense during 2011 and 2010 compared to the preceding year were primarily driven by growth in depreciable assets.
Operating Expenses (dollars in millions) Increase/(Decrease)Years Ended December 31, 2011 2010 2009 2011 vs. 2010 2010 vs. 2009
Cost of services and sales $ 24,086 $ 19,245 $ 19,348 $ 4,841 25.2 % $ (103) (0.5) %Selling, general and administrative expense 19,579 18,082 17,309 1,497 8.3 773 4.5 Depreciation and amortization expense 7,962 7,356 7,030 606 8.2 326 4.6 Total Operating Expenses $ 51,627 $ 44,683 $ 43,687 $ 6,944 15.5 $ 996 2.3
Segment Operating Income and EBITDA (dollars in millions)Increase/(Decrease)
Years Ended December 31, 2011 2010 2009 2011 vs. 2010 2010 vs. 2009
Segment Operating Income $ 18,527 $ 18,724 $ 16,638 $ (197) (1.1)% $ 2,086 12.5 %Add Depreciation and amortization expense 7,962 7,356 7,030 606 8.2 326 4.6 Segment EBITDA $ 26,489 $ 26,080 $ 23,668 $ 409 1.6 $ 2,412 10.2 Segment operating income margin 26.4 % 29.5 % 27.6 % Segment EBITDA service margin 44.8 % 46.9 % 45.5 %
The changes in the table above during the periods presented were pri-marily a result of the factors described in connection with operating revenues and operating expenses above.
Non-recurringornon-operationalitemsexcludedfromVerizonWireless’Operating income were as follows: (dollars in millions)Years Ended December 31, 2011 2010 2009
Mergerintegrationandacquisition related charges $ – $ 867 $ 954
Severance, pension and benefit charges 76 – – Impact of divested operations – (348) (789)Deferred revenue adjustment – 235 (78) $ 76 $ 754 $ 87

36
Wireline
The Wireline segment provides customers with voice service including long distance, broadband video and data, IP network services, network access and other services. We provide these products and services to consumers and small businesses in the United States, as well as to businesses and government customers and carriers both in the United States and in over 150 other countries around the world.
Reclassificationshavebeenmadetoreflectcomparableoperatingresultsforthespin-offoftheoperationsincludedintheFrontiertransaction,whichweownedthroughJune30,2010(see“AcquisitionsandDivestitures”).
Operating Revenues and Selected Operating Statistics (dollars in millions) Increase/(Decrease)Years Ended December 31, 2011 2010 2009 2011 vs. 2010 2010 vs. 2009
Consumer retail $ 13,606 $ 13,419 $ 13,202 $ 187 1.4 % $ 217 1.6 % Small business 2,731 2,837 2,913 (106) (3.7) (76) (2.6) MassMarkets 16,337 16,256 16,115 81 0.5 141 0.9 Strategic services 7,607 6,602 6,195 1,005 15.2 407 6.6 Other 8,015 8,714 9,094 (699) (8.0) (380) (4.2)Global Enterprise 15,622 15,316 15,289 306 2.0 27 0.2 Global Wholesale 7,973 8,746 9,533 (773) (8.8) (787) (8.3) Other 750 909 1,514 (159) (17.5) (605) (40.0) Total Operating Revenues $ 40,682 $ 41,227 $ 42,451 $ (545) (1.3) $ (1,224) (2.9) Connections (’000):(1) Total voice connections 24,137 26,001 28,323 (1,864) (7.2) (2,322) (8.2) Total Broadband connections 8,670 8,392 8,160 278 3.3 232 2.8 FiOSInternetsubscribers 4,817 4,082 3,286 735 18.0 796 24.2 FiOSVideosubscribers 4,173 3,472 2,750 701 20.2 722 26.3
(1) As of end of period.
Wireline’srevenuesdecreasedduring2011comparedto2010primarilydriven by declines in Global Wholesale and Other Global Enterprise reve-nues, largely as a result of declines in voice connections and in traditional voice and data services provided to business customers, partially offset by increased revenues from our growth markets as well as the impact of the revenues of Terremark.
Mass MarketsMassMarketsoperationsprovidelocalexchange(basicserviceandend-user access) and long distance (including regional toll) voice services, broadbandservices (includinghigh-speed Internet,FiOS InternetandFiOSVideo)toresidentialandsmallbusinesssubscribers.
2011 Compared to 2010MassMarketsrevenuesincreasedslightlyduring2011comparedto2010primarilyduetotheexpansionofconsumerandsmallbusinessFiOSser-vices (Voice, Internet, Video), partially offset by the continued decline of local exchange revenues.
AswecontinuetoexpandthenumberofpremiseseligibletoorderFiOSservicesandextendoursalesandmarketingeffortstoattractnewFiOSsubscribers, we have continued to grow our subscriber base and con-sistentlyimprovedpenetrationrateswithinourFiOSserviceareas.Ourpricing strategy allows us to provide competitive offerings to our cus-tomers and potential customers. As of December 31, 2011, we achieved penetrationratesof35.5%and31.5%forFiOSInternetandFiOSVideo,respectively,comparedtopenetrationratesof31.9%and28.0%forFiOSInternetandFiOSVideo,respectively,atDecember31,2010.
MassMarketsrevenueswerenegativelyimpactedbythedeclineoflocalexchange revenues primarily due to a 7.2% decline in total voice connec-tions resulting primarily from competition and technology substitution. Total voice connections include traditional switched access lines in ser-
viceaswellasFiOSdigitalvoiceconnections.Themajorityofthedeclinein total voice connections was sustained in the residential retail market, which experienced a 7.3% voice connection loss primarily due to sub-stituting traditional landline services with wireless, VoIP, broadband and cable services. There was also a 5.3% decline in small business retail voice connections, primarily reflecting challenging economic conditions, com-petition and a shift to both IP and high-speed circuits.
2010 Compared to 2009The increase inMassMarketsrevenueduring2010comparedto2009was primarily driven by the expansion of consumer and small business FiOSservices(Voice,InternetandVideo),whicharetypicallysoldinbun-dles, partially offset by the decline of local exchange revenues principally as a result of a decline in switched access lines as of December 31, 2010 compared to December 31, 2009, primarily as a result of competition and technology substitution. The majority of the decrease was sustained in the residential retail market, which experienced a 9.0% access line loss primarily due to substituting traditional landline services with wireless, VoIP, broadband and cable services. Also contributing to the decrease was a decline of nearly 5.0% in small business retail access lines, primarily reflecting economic conditions, competition and a shift to both IP and high-speed circuits.
As of December 31, 2010, we achieved penetration rates of 31.9% and 28.0%forFiOSInternetandFiOSVideo,respectively,comparedtopen-etration rates of 28.3% and 24.7% for FiOS Internet and FiOSVideo,respectively, at December 31, 2009.
ManageMent’S diScuSSion and analySiS oF Financial condition and ReSultS oF opeRationS continued

37
Global EnterpriseGlobal Enterprise offers strategic services including networking prod-ucts and solutions, advanced communications services, and other core communications services to medium and large business customers, mul-tinational corporations and state and federal government customers.
2011 Compared to 2010Global Enterprise revenues increased during 2011 compared to 2010 pri-marily driven by higher strategic services revenues, in part due to the inclusion of the revenues of Terremark, partially offset by lower local services and traditional circuit-based revenues and decreased revenues from the sale of customer premise equipment. Strategic services rev-enue increased $1.0 billion, or 15.2%, during 2011 compared to 2010 primarily due to growth in advanced services, such as managed net-work, call center, IP communications and our cloud offerings. Strategic servicescontinuetobeGlobalEnterprise’sfastestgrowingsuiteofoffer-ings. Traditional circuit-based services such as frame relay, private line and ATMservicesdeclinedcomparedtothesimilarperiod lastyearasourcustomer base continues to migrate to next generation IP services. The decline in customer premise equipment revenues reflects our focus on improving margins by de-emphasizing sales of equipment that are not a part of an overall enterprise solutions bundle.
2010 Compared to 2009 Global Enterprise revenues were essentially unchanged during 2010 compared to 2009. Higher customer premise equipment and strategic networking revenues were offset by lower local services and tradi-tional circuit-based revenues. Long distance revenues declined due to the negative effects of the continuing global economic conditions and competitive rate pressures. In addition to increased customer premise equipment revenues, strategic enterprise services revenue increased $0.4 billion, or 6.3%, during 2010 compared to 2009 primarily due to higher information technology, security solution and strategic networking rev-enues.StrategicenterpriseservicescontinuetobeGlobalEnterprise’sfastest growing suite of offerings. Traditional circuit-based services such asframerelay,privatelineandATMservicesdeclinedin2010comparedto 2009 as our customer base continued its migration to next generation IP services.
Global WholesaleGlobal Wholesale provides communications services including data, voice and local dial tone and broadband services primarily to local, long distance and other carriers that use our facilities to provide services to their customers.
2011 Compared to 2010The decrease in Global Wholesale revenues during 2011 compared to 2010 was primarily due to a $0.4 billion decline in international voice revenues asaresultofdecreasedMOUsintraditionalvoiceproductsasaresultof increases in voice termination pricing on certain international routes, which negatively impacted volume, and continued rate compression due to competition in the marketplace. Switched access and interexchange wholesaleMOUsdeclinedprimarilyasaresultofwirelesssubstitutionand connection losses. Domestic wholesale connections declined by 8.3% as of December 31, 2011 compared to December 31, 2010 due to the continued impact of competitors deemphasizing their local market initiatives coupled with the impact of technology substitution. Voice and local loop services declined during 2011 compared to 2010. Partially offsetting the overall decrease in wholesale revenue was a continuing demand for high-speed digital data services primarily due to fiber-to-the-cell customers upgrading their core data circuits to Ethernet facilities. As a result of the upgrading customers, the number of DS1/DS3 circuits experienced a 9.5% decline as compared to the similar period in 2010.
2010 Compared to 2009 The decrease in Global Wholesale revenues during 2010 compared to 2009wasprimarilyduetodecreasedMOUsintraditionalvoiceproducts,primarily as a result of increases in voice termination pricing on certain international routes, which negatively impacted volume, and continued rate compression due to competition in the marketplace. Switched access andinterexchangewholesaleMOUsdeclinedprimarilyasaresultofwire-less substitution and connection losses. Domestic wholesale connections declined by 9.0% as of December 31, 2010 compared to December 31, 2009 due to the continued impact of competitors deemphasizing their local market initiatives coupled with the impact of technology substi-tution, as well as the continued level of economic pressure. Voice and local loop services declined during 2010 compared to 2009. Continuing demand for high-capacity, high-speed digital services was partially offset by lower demand for older, low-speed data products and services. As of December 31, 2010, customer demand, as measured in DS1 and DS3 circuits, for high-capacity and high-speed digital data services increased 4.6% compared to 2009.
OtherOther revenues include such services as local exchange and long distance servicesfromformerMCImassmarketcustomers,operatorservices,cardservices and supply sales. The decrease in revenues from other services during 2011 and 2010 was primarily due to reduced business volumes, includingformerMCImassmarketcustomerlosses.
ManageMent’S diScuSSion and analySiS oF Financial condition and ReSultS oF opeRationS continued

38
Operating Expenses (dollars in millions) Increase/(Decrease)Years Ended December 31, 2011 2010 2009 2011 vs. 2010 2010 vs. 2009
Cost of services and sales $ 22,158 $ 22,618 $ 22,693 $ (460) (2.0)% $ (75) (0.3) %Selling, general and administrative expense 9,107 9,372 9,947 (265) (2.8) (575) (5.8) Depreciation and amortization expense 8,458 8,469 8,238 (11) (0.1) 231 2.8 Total Operating Expenses $ 39,723 $ 40,459 $ 40,878 $ (736) (1.8) $ (419) (1.0)
Selling, General and Administrative ExpenseSelling, general and administrative expense decreased during 2011 com-pared to 2010 primarily due to lower pension and other postretirement benefits and compensation expense, partially offset by higher costs caused by storm-related events in the third quarter of 2011, as well as the acquisition of Terremark in the second quarter of 2011.
Selling, general and administrative expense decreased during 2010 com-pared to 2009 primarily due to the decline in compensation expense as a result of lower headcount and cost reduction initiatives, partially offset by higher gains on sales of assets in 2009.
Depreciation and Amortization ExpenseDepreciation and amortization expense was effectively flat during 2011 compared to 2010 primarily due to a decrease in amortization expense as a result of a reduction in capitalized non-network software, partially offset by an increase in depreciation expense primarily due to the acquisition of Terremark in the second quarter of 2011.
Depreciation and amortization expense increased during 2010 com-pared to 2009 due to growth in depreciable assets.
Cost of Services and SalesCost of services and sales decreased during 2011 compared to 2010 due to a decrease in access costs resulting primarily from management actions to reduce exposure to unprofitable international wholesale routes and declines in overall wholesale long distance volumes, as well as lower pension and other postretirement benefit expenses. The decrease was partially offset by higher costs related to repair and maintenance expenses caused by storm-related events during the third quarter of 2011,contentcostsassociatedwithcontinuedFiOSsubscribergrowthand the acquisition of Terremark in the second quarter of 2011.
Cost of services and sales were essentially unchanged during 2010 com-pared to 2009. Decreases were primarily due to lower costs associated with compensation and installation expenses as a result of lower head-count and productivity improvements, as well as lower access costs driven mainly by management actions to reduce exposure to unprofitable inter-national wholesale routes and declines in overall wholesale long distance volumes.Inaddition,ourFiOSVideoandInternetcostofacquisitionperaddition also decreased in 2010 compared to 2009. These declines were partially offset by higher customer premise equipment costs and content costsassociatedwithcontinuedFiOSsubscribergrowth.
Segment Operating Income and EBITDA (dollars in millions) Increase/(Decrease)Years Ended December 31, 2011 2010 2009 2011 vs. 2010 2010 vs. 2009
Segment Operating Income $ 959 $ 768 $ 1,573 $ 191 24.9 % $ (805) (51.2) %Add Depreciation and amortization expense 8,458 8,469 8,238 (11) (0.1) 231 2.8 Segment EBITDA $ 9,417 $ 9,237 $ 9,811 $ 180 1.9 $ (574) (5.9) Segment operating income margin 2.4 % 1.9 % 3.7 % Segment EBITDA margin 23.1 % 22.4 % 23.1 %
The changes inWireline’s Operating income, Segment EBITDA andSegment EBITDA margin during the periods presented were primarily a result of the factors described in connection with operating revenues and operating expenses above.
Non-recurring or non-operational items excluded from Wireline’sOperating income were as follows:
(dollars in millions)Years Ended December 31, 2011 2010 2009
Severance, pension and other benefit charges $ – $ 2,237 $ 2,253
Access line spin-off related charges – 79 51 Impact of divested operations – (408) (980) $ – $ 1,908 $ 1,324
ManageMent’S diScuSSion and analySiS oF Financial condition and ReSultS oF opeRationS continued

39
Dispositions
Access Line-Spin-off Related ChargesDuring 2010 and 2009, we recorded pre-tax charges of $0.5 billion and $0.2 billion, respectively, primarily for costs incurred related to network, non-network software and other activities to enable the divested mar-kets inthetransactionwithFrontiertooperateonastand-alonebasissubsequent to the closing of the transaction; professional advisory and legal fees in connection with this transaction; and fees related to the early extinguishment of debt from the use of proceeds from the trans-action. During 2009, we also recorded pre-tax charges of $0.2 billion for costs incurred related to our Wireline cost reduction initiatives (See “AcquisitionsandDivestitures”).
Alltel Divestiture MarketsDuring the second quarter of 2010, we recorded a tax charge of approximately $0.2 billion for the taxable gain associated with the Alltel DivestitureMarkets(see“AcquisitionsandDivestitures”).
Medicare Part D Subsidy Charges
Under the Patient Protection and Affordable Care Act and the Health Care andEducationReconciliationActof2010,bothofwhichbecamelawinMarch2010(collectivelytheHealthCareAct),beginningin2013,VerizonandothercompaniesthatreceiveasubsidyunderMedicarePartDtoprovide retiree prescription drug coverage will no longer receive a fed-eral income tax deduction for the expenses incurred in connection with providing the subsidized coverage to the extent of the subsidy received. Because future anticipated retiree prescription drug plan liabilities and relatedsubsidiesarealreadyreflectedinVerizon’sfinancialstatements,this change in law required Verizon to reduce the value of the related tax benefits recognized in its financial statements in the period during which the Health Care Act was enacted. As a result, Verizon recorded a one-time, non-cash income tax charge of $1.0 billion in the first quarter of 2010 to reflect the impact of this change.
Other
Debt Redemption CostsDuring November 2011, we recorded debt redemption costs of $0.1 bil-lion in connection with the early redemption of $1.0 billion of 7.375% Verizon Communications Notes due September 2012, $0.6 billion of 6.875% Verizon Communications Notes due June 2012, $0.4 billion of 6.125%VerizonFloridaInc.DebenturesdueJanuary2013,$0.5billionof6.125%VerizonMarylandInc.DebenturesdueMarch2012and$1.0bil-lion of 6.875% Verizon New York Inc. Debentures due April 2012.
Deferred RevenueCorporate, eliminations and other during the periods presented include a non-cash adjustment of $0.2 billion and ($0.1 billion) in 2010 and 2009, respectively, primarily to adjust wireless data revenues. This adjustment was recorded to properly defer previously recognized wireless data reve-nues that were earned and recognized in future periods. The adjustment was recorded during 2010, which reduced Net income (loss) attributable to Verizon by approximately $0.1 billion. Consolidated revenues in 2009 were not affected as the amounts involved were not material to our con-solidated financial statements.
Other items
Severance, Pension and Benefit Charges
During 2011, we recorded net pre-tax severance, pension and benefits charges of approximately $6.0 billion for our pension and postretirement plans in accordance with our accounting policy to recognize actuarial gains and losses in the year in which they occur. The charges were pri-marily driven by a decrease in our discount rate assumption used to determine the current year liabilities from 5.75% at December 31, 2010 to 5% at December 31, 2011 ($5.0 billion); the difference between our esti-mated return on assets of 8% and our actual return on assets of 5% ($0.9 billion); and revisions to the life expectancy of participants and other adjustments to assumptions.
During 2010, we recorded net pre-tax severance, pension and benefits charges of $3.1 billion. The charges during 2010 included remeasure-ment losses of $0.6 billion, for our pension and postretirement plans in accordance with our accounting policy to recognize actuarial gains and losses in the year in which they occur. Additionally, in 2010, we reached an agreement with certain unions on temporary enhancements to the separation programs contained in their existing collective bargaining agreements. These temporary enhancements were intended to help address a previously declared surplus of employees and to help reduce the need for layoffs. Accordingly, we recorded severance, pension and benefits charges associated with approximately 11,900 union-repre-sented employees who volunteered for the incentive offer. These charges included $1.2 billion for severance for the 2010 separation programs mentioned above and a planned workforce reduction of approximately 2,500 employees in 2011. In addition, we recorded $1.3 billion for pension and postretirement curtailment losses and special termination benefits due to the workforce reductions.
During 2009, we recorded net pre-tax severance, pension and benefits charges of $1.4 billion. These charges were primarily comprised of pen-sion and postretirement curtailment losses and special termination benefits of $1.9 billion; $0.9 billion for workforce reductions of approxi-mately 17,600 employees, 4,200 of whom were separated during late 2009 and the remainder in 2010; and remeasurement gains of $1.4 bil-lion for our pension and postretirement plans in accordance with our accounting policy to recognize actuarial gains and losses in the year in which they occur.
Merger Integration and Acquisition Related Charges
During 2010, we recorded pre-tax merger integration charges of $0.9 billion primarily related to the Alltel acquisition. These charges were primarily due to the decommissioning of overlapping cell sites, preacqui-sition contingencies, handset conversions and trade name amortization.
During 2009, we recorded pre-tax merger integration and acquisition related charges of $1.2 billion. These charges primarily related to the Alltel acquisition and were comprised of trade name amortization, re-branding initiatives and handset conversions. The charges during 2009 were also comprised of transaction fees and costs associated with the acquisition, including fees related to the credit facility that was entered into and uti-lized to complete the acquisition.
ManageMent’S diScuSSion and analySiS oF Financial condition and ReSultS oF opeRationS continued

40
Cash Flows Used In Investing Activities
Capital ExpendituresCapital expenditures continue to be our primary use of capital resources as they facilitate the introduction of new products and services, enhance responsiveness to competitive challenges and increase the operating efficiency and productivity of our networks. We are directing our capital spending primarily toward higher growth markets.
Capital expenditures, including capitalized software, were as follows:
(dollars in millions)Years Ended December 31, 2011 2010 2009
Verizon Wireless $ 8,973 $ 8,438 $ 7,152 Wireline 6,399 7,269 8,892 Other 872 751 828 $ 16,244 $ 16,458 $ 16,872 Total as a percentage of revenue 14.7% 15.4% 15.7%
The increase in capital expenditures at Verizon Wireless during 2011 and 2010 was primarily due to the increased investment in the capacity of our wireless EV-DO network, as well as the build-out of our 4G LTE network. The decrease in capital expenditures at Wireline during 2011 and 2010 was primarily due to capital expenditures in 2010 related to the local exchangebusinessandrelatedactivitiesthatwerespunofftoFrontier,aswellaslowercapitalexpendituresrelatedtothebuild-outofFiOS.
AcquisitionsDuring 2011, 2010 and 2009, we invested $2.0 billion, $1.4 billion and $6.0 billion, respectively, in acquisitions of licenses, investments and businesses.
• During April 2011, we paid approximately $1.4 billion for the equity of Terremark, which was partially offset by $0.1 billion of cash acquired (see“Acquisitions andDivestitures”). See“CashFlowsFromFinancingActivities”belowregardingthedebtobligationsofTerremarkthatwererepaidduringMay2011.Inaddition,during2011,weacquiredvariouswireless licenses and markets as well as a provider of cloud software technology for cash consideration that was not significant.
• On August 23, 2010, Verizon Wireless acquired the net assets and relatedcustomersofsixoperatingmarketsinLouisianaandMississippiin a transaction with AT&T Inc. for cash consideration of $0.2 billion.
• On January 9, 2009, Verizon Wireless paid approximately $5.9 billion for the equity of Alltel, which was partially offset by $1.0 billion of cash acquiredatclosing.See“CashFlowsFromFinancingActivities”belowregarding the debt obligations assumed in connection with the acqui-sition of Alltel.
DispositionsDuring 2010, we received cash proceeds of $2.6 billion in connection with the sale of the Alltel DivestitureMarkets (see“Acquisitions andDivestitures”).
Other, netDuring 2011, Other, net primarily included proceeds related to the sales of long-term investments, which were not significant to our consolidated statements of income.
COnsOlidated finanCial COnditiOn
(dollars in millions)Years Ended December 31, 2011 2010 2009
Cash Flows Provided By (Used In) Operating activities $ 29,780 $ 33,363 $ 31,390 Investing activities (17,250) (15,054) (23,156) Financingactivities (5,836) (13,650) (16,007)Increase (Decrease) In Cash and
Cash Equivalents $ 6,694 $ 4,659 $ (7,773)
We use the net cash generated from our operations to fund network expansion and modernization, repay external financing, pay dividends, repurchase Verizon common stock from time to time and invest in new businesses. While our current liabilities typically exceed current assets, our sources of funds, primarily from operations and, to the extent necessary, from external financing arrangements, are sufficient to meet ongoing operating and investing requirements. We expect that our capital spending requirements will continue to be financed primarily through internally generated funds. Debt or equity financing may be needed to fund additional development activities or to maintain an appropriate capital structure to ensure our financial flexibility. Our cash and cash equivalents are primarily held domestically in diversified accounts and are invested to maintain principal and liquidity. Accordingly, we do not have significant exposure to foreign currency fluctuations.
The volatility in world debt and equity markets has not had a significant impact on our ability to access external financing. Our available external financing arrangements include the issuance of commercial paper, credit available under credit facilities and other bank lines of credit, vendor financing arrangements, issuances of registered debt or equity securities and privately-placed capital market securities. As of December 31, 2011, we had a shelf registration available for the issuance of debt or equity securities with an aggregate offering price of up to $3.15 billion.
OnFebruary7,2012,wefiledanewshelfregistrationstatementfortheissuance of debt or equity securities with an aggregate offering price of up to $10 billion. In connection with this filing, the previous shelf reg-istration statement was terminated. We may also issue short-term debt through an active commercial paper program and have a $6.2 billion credit facility to support such commercial paper issuances.
Cash Flows Provided By Operating Activities
Our primary source of funds continues to be cash generated from opera-tions, primarily of Verizon Wireless. Net cash provided by operating activities during 2011 decreased by $3.6 billion compared to 2010 pri-marily due to purchases for wireless devices, cash flows from divested operations(see“AcquisitionsandDivestitures”)andhigherpensionplancontributions. Net cash provided by operating activities during 2011 and 2010 included net distributions received from Vodafone Omnitel of $0.4 billion in each year.
Net cash provided by operating activities during 2010 increased by $2.0 billion compared to 2009 primarily due to higher operating cash flows at Verizon Wireless, changes in working capital related in part to man-agement of inventory and the timing of tax payments. Partially offsetting these increases were lower operating cash flows at Wireline, as well as a lower net distribution from Vodafone Omnitel.
ManageMent’S diScuSSion and analySiS oF Financial condition and ReSultS oF opeRationS continued

41
In 2010, Verizon Wireless exercised its right to redeem the outstanding $1.0 billion of aggregate floating rate notes due June 2011 at a redemp-tion price of 100% of the principal amount of the notes, plus accrued and unpaid interest through the date of redemption. In addition, during 2010, Verizon Wireless repaid the remaining $4.0 billion of borrowings that were outstandingundera$4.4billionThree-YearTermLoanFacilityAgreementwithamaturitydateofSeptember2011(Three-YearTermLoanFacility).Asthere were no borrowings outstanding under this facility, it was cancelled.
2009During 2009, Verizon issued $1.8 billion of 6.35% Notes due 2019 and $1.0 billion of 7.35% Notes due 2039, resulting in cash proceeds of $2.7 billion, net of discounts and issuance costs, which was used to reduce our commercial paper borrowings, repay maturing debt and for gen-eral corporate purposes. In January 2009, Verizon utilized a $0.2 billion floating rate vendor financing facility. During 2009, we redeemed $0.1 billion of 6.8% Verizon New Jersey Inc. Debentures, $0.3 billion of 6.7% and $0.2 billion of 5.5% Verizon California Inc. Debentures and $0.2 billion of 5.875% Verizon New England Inc. Debentures. In April 2009, $0.5 bil-lion of 7.51% GTE Corporation Debentures matured and were repaid. In addition, during 2009, $0.5 billion floating rate Notes due 2009 and $0.1 billion of 8.23% Verizon Notes matured and were repaid.
During 2009, Verizon Wireless raised capital to fund the acquisition of Alltel.
• On January 9, 2009, Verizon Wireless borrowed $12.4 billion under a $17.0 billion credit facility (Bridge Facility) in order to complete theacquisition of Alltel and repay a portion of the approximately $24 bil-lion of Alltel debt assumed. Verizon Wireless used cash generated from operations and the net proceeds from the sale of the notes in private placementsissuedinFebruary2009,May2009andJune2009,whicharedescribedbelowtorepaytheborrowingsundertheBridgeFacility.The Bridge Facility and the commitments under the Bridge Facilityhave been terminated.
• InFebruary2009,VerizonWirelessandVerizonWirelessCapitalLLCco-issued $4.3 billion aggregate principal amount of three and five-year fixed rate notes in a private placement resulting in cash proceeds of $4.2 billion, net of discounts and issuance costs.
• In May 2009, VerizonWireless and VerizonWireless Capital LLC co-issued $4.0 billion aggregate principal amount of two-year fixed and floating rate notes in a private placement resulting in cash proceeds of approximately $4.0 billion, net of discounts and issuance costs.
• In June 2009, Verizon Wireless issued $1.0 billion aggregate principal amount of floating rate notes due 2011. As described above, during 2010 these notes were repaid.
• In August 2009, Verizon Wireless repaid $0.4 billion of borrowings that were outstanding under theThree-YearTerm Loan Facility, reducingthe outstanding borrowings under this facility to $4.0 billion as of December 31, 2009. As described above, during 2010 this facility was repaid in full.
During November 2009, Verizon Wireless and Verizon Wireless Capital LLC, completed an exchange offer to exchange the privately placed notes issued inNovember2008,andFebruaryandMay2009, fornewnotes with similar terms.
Other, netThe change in Other, net financing activities during 2011 compared to the prior year was primarily driven by lower distributions to Vodafone, which owns a 45% noncontrolling interest in Verizon Wireless. The change in Other, net financing activities during 2010 compared to 2009 was primarily driven by higher distributions to Vodafone.
Cash Flows From Financing Activities
We seek to maintain a mix of fixed and variable rate debt to lower bor-rowing costs within reasonable risk parameters and to protect against earnings and cash flow volatility resulting from changes in market condi-tions. During 2011, 2010 and 2009, net cash used in financing activities was $5.8 billion, $13.7 billion and $16.0 billion, respectively.
2011During 2011, proceeds from long-term borrowings totaled $11.1 billion, which was primarily used to repay outstanding debt, redeem higher interest bearing debt maturing in the near term and for other general corporate purposes.
During 2011, $0.5 billion of 5.35% Verizon Communications Notes matured and were repaid, and we utilized $0.3 billion under fixed rate vendor financing facilities.
DuringMarch2011,weissued$6.25billionaggregateprincipalamountof fixed and floating rate notes at varying maturities resulting in cash pro-ceeds of approximately $6.19 billion, net of discounts and issuance costs. The net proceeds were used for the repayment of commercial paper and other general corporate purposes, as well as to redeem $2.0 billion aggre-gate principal amount of telephone subsidiary debt during April 2011.
The debt obligations of Terremark that were outstanding at the time of its acquisition by Verizon were repaid during the second quarter of 2011.
During November 2011, we issued $4.6 billion aggregate principal amount of fixed notes at varying maturities resulting in cash proceeds of approximately $4.55 billion, net of discounts and issuance costs. During November 2011, the net proceeds were used to redeem $1.6 billion aggregate principal amount of Verizon Communications notes and $1.9 billion aggregate principal amount of telephone subsidiary debt. The remaining net proceeds were used for the repayment of commercial paperandothergeneralcorporatepurposes.See“OtherItems”regardingthe debt redemption costs incurred in connection with the aforemen-tioned redemptions.
During December 2011, we repaid $0.9 billion upon maturity for the €0.7 billion of 7.625% Verizon Wireless Notes, and the related cross currency swapwassettled.DuringMay2011,$4.0billionVerizonWirelesstwo-yearfixed and floating rate notes matured and were repaid.
During January 2012, $1.0 billion of 5.875% Verizon New Jersey Inc. Debenturesmaturedandwererepaid.DuringFebruary2012,$0.8billionof 5.25% Verizon Wireless Notes matured and were repaid.
2010During 2010, Verizon received approximately $3.1 billion in cash in con-nection with the completion of the spin-off and merger of Spinco (see “AcquisitionsandDivestitures”).Thisspecialcashpaymentwassubse-quently used to redeem $2.0 billion of 7.25% Verizon Communications Notes due December 2010 at a redemption price of 102.7% of the prin-cipal amount of the notes, plus accrued and unpaid interest through the date of redemption, as well as other short-term borrowings. During 2010, $0.3 billion of 6.125% and $0.2 billion of 8.625% Verizon New York Inc. Debentures, $0.2 billion of 6.375% Verizon North Inc. Debentures and $0.2 billion of 6.3% Verizon Northwest Inc. Debentures matured and were repaid. In addition, during 2010 Verizon repaid $0.2 billion of floating rate vendor financing debt.
ManageMent’S diScuSSion and analySiS oF Financial condition and ReSultS oF opeRationS continued

42
requirements. Securities ratings assigned by rating organizations are expressions of opinion and are not recommendations to buy, sell, or hold securities. A securities rating is subject to revision or withdrawal at any time by the assigning rating organization. Each rating should be evalu-ated independently of any other rating.
CovenantsOur credit agreements contain covenants that are typical for large, investment grade companies. These covenants include requirements to pay interest and principal in a timely fashion, pay taxes, maintain insur-ance with responsible and reputable insurance companies, preserve our corporate existence, keep appropriate books and records of financial transactions, maintain our properties, provide financial and other reports to our lenders, limit pledging and disposition of assets and mergers and consolidations, and other similar covenants.
We and our consolidated subsidiaries are in compliance with all debt covenants.
Increase (Decrease) In Cash and Cash Equivalents
Our Cash and cash equivalents at December 31, 2011 totaled $13.4 bil-lion, a $6.7 billion increase compared to Cash and cash equivalents at December 31, 2010 for the reasons discussed above. Our Cash and cash equivalents at December 31, 2010 totaled $6.7 billion, a $4.7 billion increase compared to Cash and cash equivalents at December 31, 2009 for the reasons discussed above.
As of December 31, 2011, Verizon Wireless cash and cash equivalents and debt outstanding totaled $12.3 billion and $11.6 billion, respectively.
Free Cash Flow Free cash flow is a non-GAAP financial measure that managementbelievesisusefultoinvestorsandotherusersofVerizon’sfinancialinfor-mationinevaluatingcashavailabletopaydebtanddividends.Freecashflow is calculated by subtracting capital expenditures from net cash provided by operating activities. The following table reconciles net cash providedbyoperatingactivitiestoFreecashflow:
(dollars in millions)Years Ended December 31, 2011 2010 2009
Net cash provided by operating activities $ 29,780 $ 33,363 $ 31,390 Less Capital expenditures (including
capitalized software) 16,244 16,458 16,872 Free cash flow $ 13,536 $ 16,905 $ 14,518
The changes in free cash flow during 2011, 2010 and 2009 were a result of the factors described in connection with net cash provided by oper-ating activities and capital expenditures above.
Employee Benefit Plan Funded Status and Contributions
We operate numerous qualified and nonqualified pension plans and other postretirement benefit plans. These plans primarily relate to our domestic business units. During 2011 and 2009, we contributed $0.4 bil-lion and $0.2 billion, respectively, to our qualified pension plans. During 2010, contributions to our qualified pension plans were not significant. We also contributed $0.1 billion to our nonqualified pension plans in 2011, 2010 and 2009, respectively.
In an effort to reduce the risk of our portfolio strategy and better align assets with liabilities, we are shifting our strategy to one that is more liability driven, where cash flows from investments better match pro-jected benefit payments but result in lower asset returns. We intend to
InJuly2011,theBoardofRepresentativesofVerizonWirelessdeclaredadistribution to its owners, payable on January 31, 2012 in proportion to their partnership interests on that date, in the aggregate amount of $10 billion. As a result, during January 2012, Vodafone Group Plc received a cash payment of $4.5 billion and the remainder of the distribution was received by Verizon.
DividendsDuring 2011, we paid $5.6 billion in dividends compared to $5.4 billion in 2010 and $5.3 billion in 2009. As in prior periods, dividend payments were a significant use of capital resources. The Verizon Board of Directors determines the appropriateness of the level of our dividend payments on a periodic basis by considering such factors as long-term growth opportunities, internal cash requirements and the expectations of our shareowners. During the third quarter of 2011, the Board increased our quarterly dividend payment 2.6% to $.50 per share from $.4875 per share inthesameperiodof2010.ThisisthefifthconsecutiveyearthatVerizon’sBoard of Directors has approved a quarterly dividend increase. During the third quarter of 2010, the Board increased our quarterly dividend pay-ment 2.6% to $.4875 per share from $.475 per share in the same period of 2009. During the third quarter of 2009, the Board increased our dividend payments 3.3%.
Credit FacilityAs of December 31, 2011, the unused borrowing capacity under a $6.2 billion three-year credit facility with a group of major financial institu-tions was approximately $6.1 billion. On April 15, 2011, we amended this facility primarily to reduce fees and borrowing costs and extend the maturity date to October 15, 2014. The credit facility does not require us to comply with financial covenants or maintain specified credit ratings, and it permits us to borrow even if our business has incurred a mate-rial adverse change. We use the credit facility to support the issuance of commercial paper, for the issuance of letters of credit and for general corporate purposes.
Verizon’s ratioofnetdebt toConsolidatedAdjustedEBITDAwas1.2xat December 31, 2011 and 1.3x at December 31, 2010. Consolidated Adjusted EBITDA excludes the effects of non-operational items (see “OtherItems”).
Common StockCommon stock has been used from time to time to satisfy some of the fundingrequirementsofemployeeandshareownerplans.OnFebruary3,2011, the Board of Directors replaced the current share buyback program with a new program for the repurchase of up to 100 million common sharesterminatingnolaterthanthecloseofbusinessonFebruary28,2014. The Board also determined that no additional shares were to be purchased under the prior program.
During the first quarter of 2009, we entered into a privately negotiated prepaid forward agreement for 14 million shares of Verizon common stock at a cost of approximately $0.4 billion. We terminated the prepaid forward agreement with respect to 5 million of the shares during the fourth quarter of 2009 and 9 million of the shares in the first quarter of 2010, which resulted in the delivery of those shares to Verizon.
There were no repurchases of common stock during 2011, 2010 or 2009.
Credit RatingsThe debt securities of Verizon Communications and its subsidiaries con-tinue to be accorded high ratings by the three primary rating agencies.
Although a one-level ratings downgrade would not be expected to sig-nificantly impact our access to capital, it could increase both the cost of refinancing existing debt and the cost of financing any new capital
ManageMent’S diScuSSion and analySiS oF Financial condition and ReSultS oF opeRationS continued

43
Leasing Arrangements
We are the lessor in leveraged and direct financing lease agreements for commercial aircraft and power generating facilities, which comprise the majority of our leasing portfolio along with telecommunications equipment, real estate property and other equipment. These leases have remaining terms of up to 39 years as of December 31, 2011. In addition, we lease space on certain of our cell towers to other wireless carriers. Minimumleasepaymentsreceivablerepresentunpaidrentals,lessprin-cipal and interest on third-party nonrecourse debt relating to leveraged lease transactions. Since we have no general liability for this debt, which is secured by a senior security interest in the leased equipment and rentals, the related principal and interest have been offset against the minimum lease payments receivable in accordance with GAAP. All recourse debt is reflected in our consolidated balance sheets.
reduce the likelihood that assets will decline at a time when liabilities increase (referred to as liability hedging), with the goal to reduce the risk of underfunding to the plan and its participants and beneficiaries. Based on the revised strategy and the funded status of the plans at December 31, 2011, we expect to make a minimum required qualified pension plan contribution of $1.3 billion in 2012. Nonqualified pension contributions are estimated to be approximately $0.2 billion in 2012.
Contributions to our other postretirement benefit plans generally relate to payments for benefits on an as-incurred basis since the other post-retirement benefit plans do not have funding requirements similar to the pension plans. We contributed $1.4 billion, $1.2 billion and $1.6 bil-lion to our other postretirement benefit plans in 2011, 2010 and 2009, respectively. Contributions to our other postretirement benefit plans are estimated to be approximately $1.5 billion in 2012.
ManageMent’S diScuSSion and analySiS oF Financial condition and ReSultS oF opeRationS continued
Off Balance Sheet Arrangements and Contractual Obligations
Contractual Obligations and Commercial CommitmentsThe following table provides a summary of our contractual obligations and commercial commitments at December 31, 2011. Additional detail about these items is included in the notes to the consolidated financial statements.
(dollars in millions) Payments Due By Period
Contractual Obligations TotalLess than
1 year 1–3 years 3–5 yearsMorethan
5 years
Long-term debt(1) $ 52,866 $ 2,848 $ 12,320 $ 5,252 $ 32,446 Capital lease obligations(2) 352 67 117 75 93 Total long-term debt, including current maturities 53,218 2,915 12,437 5,327 32,539 Interest on long-term debt(1) 36,353 2,993 5,327 4,667 23,366 Operating leases(2) 12,389 2,004 3,337 2,302 4,746 Purchase obligations(3) 51,120 22,829 24,560 3,124 607 Income tax audit settlements(4) 163 163 – – – Other long-term liabilities(5) 3,219 3,219 – – – Total contractual obligations $ 156,462 $ 34,123 $ 45,661 $ 15,420 $ 61,258
(1) Items included in long-term debt with variable coupon rates are described in Note 8 to the consolidated financial statements. (2) See Note 7 to the consolidated financial statements. (3) The purchase obligations reflected above are primarily commitments to purchase handsets and peripherals, equipment, software, programming and network services, and marketing activities,
which will be used or sold in the ordinary course of business. These amounts do not represent our entire anticipated purchases in the future, but represent only those items for which we are contractuallycommitted.Wealsopurchaseproductsandservicesasneededwithnofirmcommitment.Forthisreason,theamountspresentedinthistablealonedonotprovideareliableindicator of our expected future cash outflows or changes in our expected cash position (see Note 16 to the consolidated financial statements).
(4) Income tax audit settlements include gross unrecognized tax benefits of $0.1 billion and related gross interest and penalties of $0.1 billion as determined under the accounting standard relating to the uncertainty in income taxes. We are not able to make a reliable estimate of when the unrecognized tax benefits balance of $3.0 billion and related interest and penalties will be settled with the respective taxing authorities until issues or examinations are further developed (see Note 12 to the consolidated financial statements).
(5) Other long-term liabilities include estimated postretirement benefit and qualified pension plan contributions (see Note 11 to the consolidated financial statements).
Guarantees
In connection with the execution of agreements for the sale of businesses and investments, Verizon ordinarily provides representations and warran-ties to the purchasers pertaining to a variety of nonfinancial matters, such as ownership of the securities being sold, as well as financial losses (see Note 16 to the consolidated financial statements).
During 2011, we guaranteed the debentures and first mortgage bonds of our operating telephone company subsidiaries. As of December 31, 2011, $6.4 billion principal amount of these obligations remain outstanding.
Each guarantee will remain in place for the life of the obligation unless terminated pursuant to its terms, including the operating telephone company no longer being a wholly-owned subsidiary of Verizon. We also guarantee the debt obligations of GTE Corporation that were issued and outstanding prior to July 1, 2003. As of December 31, 2011, $1.7 billion principal amount of these obligations remain outstanding (see Note 8 to the consolidated financial statements).
As of December 31, 2011 letters of credit totaling approximately $0.1 bil-lion, which were executed in the normal course of business and support several financing arrangements and payment obligations to third parties, were outstanding (see Note 16 to the consolidated financial statements).

44
Interest Rate SwapsWe have entered into domestic interest rate swaps to achieve a targeted mix of fixed and variable rate debt. We principally receive fixed rates and payvariableratesbasedonLIBOR,resultinginanetincreaseordecreaseto Interest expense. These swaps are designated as fair value hedges and hedge against changes in the fair value of our debt portfolio. We record the interest rate swaps at fair value on our consolidated balance sheets as assets and liabilities. Changes in the fair value of the interest rate swaps due to changes in interest rates are recorded to Interest expense, which are offset by changes in the fair value of the debt. The fair value of these contracts was $0.6 billion at December 31, 2011 and $0.3 billion at December 31, 2010 and is primarily included in Other assets and Long-term debt. As of December 31, 2011, the total notional amount of these interest rate swaps was $7.0 billion.
Foreign Currency Translation
The functional currency for our foreign operations is primarily the local currency. The translation of income statement and balance sheet amounts of our foreign operations into U.S. dollars is recorded as cumu-lative translation adjustments, which are included in Accumulated other comprehensive loss in our consolidated balance sheets. Gains and losses on foreign currency transactions are recorded in the consolidated state-ments of income in Other income and (expense), net. At December 31, 2011, our primary translation exposure was to the British Pound Sterling, the Euro and the Australian Dollar.
Cross Currency SwapsDuring 2008, Verizon Wireless entered into cross currency swaps des-ignated as cash flow hedges to exchange approximately $2.4 billion of British Pound Sterling and Euro-denominated debt into U.S. dollars and to fix our future interest and principal payments in U.S. dollars, as well as mitigate the impact of foreign currency transaction gains or losses. During December 2011, we repaid $0.9 billion upon maturity for the €0.7 billion of 7.625% Verizon Wireless Notes. The settlement of the related cross currency swap did not have a material impact on our financial statements. The fair value of the outstanding swaps, primarily included in Other assets, was approximately $0.1 billion at December 31, 2011 and December 31, 2010, respectively. During 2011, the pretax loss recognized in Other comprehensive income was not significant. During 2010, a pre-tax loss of $0.2 billion was recognized in Other comprehensive income. A portion of these gains and losses recognized in Other comprehensive income was reclassified to Other income and (expense), net to offset the related pretax foreign currency transaction gain or loss on the underlying debt obligations.
market risk
We are exposed to various types of market risk in the normal course of business, including the impact of interest rate changes, foreign cur-rency exchange rate fluctuations, changes in investment, equity and commodity prices and changes in corporate tax rates. We employ risk management strategies, which may include the use of a variety of deriva-tives including cross currency swaps, foreign currency and prepaid forwards and collars, interest rate and commodity swap agreements and interest rate locks. We do not hold derivatives for trading purposes.
It is our general policy to enter into interest rate, foreign currency and other derivative transactions only to the extent necessary to achieve our desired objectives in limiting our exposure to various market risks. Our objectives include maintaining a mix of fixed and variable rate debt to lower borrowing costs within reasonable risk parameters and to protect against earnings and cash flow volatility resulting from changes in market conditions. We do not hedge our market risk exposure in a manner that would completely eliminate the effect of changes in interest rates and foreign exchange rates on our earnings. We do not expect that our net income, liquidity and cash flows will be materially affected by these risk management strategies.
Interest Rate Risk
We are exposed to changes in interest rates, primarily on our short-term debt and the portion of long-term debt that carries floating interest rates. As of December 31, 2011, more than three-fourths in aggregate principal amount of our total debt portfolio consisted of fixed rate indebtedness, including the effect of interest rate swap agreements des-ignated as hedges. The impact of a 100 basis point change in interest rates affecting our floating rate debt would result in a change in annual interest expense, including our interest rate swap agreements that are designated as hedges, of approximately $0.1 billion. The interest rates on our existing long-term debt obligations are unaffected by changes to our credit ratings.
The table that follows summarizes the fair values of our long-term debt, including current maturities, and interest rate swap derivatives as of December 31, 2011 and 2010. The table also provides a sensitivity anal-ysis of the estimated fair values of these financial instruments assuming 100-basis-point upward and downward shifts in the yield curve. Our sen-sitivity analysis does not include the fair values of our commercial paper and bank loans, if any, because they are not significantly affected by changes in market interest rates.
(dollars in millions)
At December 31, 2011 FairValue
FairValue assuming
+ 100 basis point shift
FairValue assuming- 100 basis point shift
Long-term debt and related derivatives $ 61,870 $ 58,117 $ 66,326 At December 31, 2010
Long-term debt and related derivatives $ 58,591 $ 55,427 $ 62,247
ManageMent’S diScuSSion and analySiS oF Financial condition and ReSultS oF opeRationS continued

45
Critical Accounting Estimates
A summary of the critical accounting estimates used in preparing our financial statements is as follows:
• Wireless licenses and Goodwill are a significant component of our con-solidated assets. Both our wireless licenses and goodwill are treated as indefinite-lived intangible assets and, therefore are not amortized, but rather are tested for impairment annually in the fourth fiscal quarter, unless there are events or changes in circumstances during an interim period that indicates these assets may not be recoverable. We believe our estimates and assumptions are reasonable and represent appro-priate marketplace considerations as of the valuation date. We do not believe that reasonably likely adverse changes in our assumptions and estimates would result in an impairment charge as of our latest impair-ment testing date. However, if there is a substantial and sustained adverse decline in our operating profitability, we may have impairment charges in future years. Any such impairment charge could be material to our results of operations and financial condition.
Wireless Licenses The carrying value of our wireless licenses was approximately $73.3
billion as of December 31, 2011. We aggregate our wireless licenses into one single unit of accounting, as we utilize our wireless licenses on an integrated basis as part of our nationwide wireless network. Our wireless licenses provide us with the exclusive right to utilize certain radio frequency spectrum to provide wireless communication services. There are currently no legal, regulatory, contractual, competitive, eco-nomic or other factors that limit the useful life of our wireless licenses. Our impairment test consists of comparing the estimated fair value of our wireless licenses to the aggregated carrying amount as of the test date. If the estimated fair value of our wireless licenses is less than the aggregated carrying amount of the wireless licenses then an impair-ment charge is recognized. Our annual impairment tests for 2011, 2010 and 2009 indicated that the fair value significantly exceeded the carrying value and, therefore, did not result in an impairment.
We estimate the fair value of our wireless licenses using a direct income based valuation approach. This approach uses a discounted cash flow analysis to estimate what a marketplace participant would be willing to pay to purchase the aggregated wireless licenses as of the valuation date. As a result we are required to make significant estimates about future cash flows specifically associated with our wireless licenses, an appropriate discount rate based on the risk associated with those estimated cash flows and assumed terminal value and growth rates. We consider current and expected future economic conditions, cur-rent and expected availability of wireless network technology and infrastructure and related equipment and the costs thereof as well as other relevant factors in estimating future cash flows. The discount rate represents our estimate of the weighted average cost of capital (or expectedreturn,“WACC”)thatamarketplaceparticipantwouldrequireas of the valuation date. We develop the discount rate based on our consideration of the cost of debt and equity of a group of guideline companies as of the valuation date. Accordingly, our discount rate incorporates our estimate of the expected return a marketplace partici-pant would require as of the valuation date, including the risk premium associated with the current and expected economic conditions as of the valuation date. The terminal value growth rate represents our esti-mateofthemarketplace’slong-termgrowthrate.
Goodwill At December 31, 2011, the balance of our goodwill was approximately
$23.4 billion, of which $18.0 billion was in our Wireless segment and $5.4 billion was in our Wireline segment. Determining whether an impairment has occurred requires the determination of fair value of each respective reporting unit. Our operating segments, Verizon Wireless and Wireline, are deemed to be our reporting units for purposes of goodwill impairment testing. The fair value of Verizon Wireless and Wireline exceeded their carrying value. Accordingly, our annual impairment tests for 2011, 2010 and 2009 did not result in an impairment.
The fair value of the reporting unit is calculated using a market approach and a discounted cash flow method. The market approach includes the use of comparative multiples to corroborate discounted cash flow results. The discounted cash flow method is based on the present value of two components — projected cash flows and a terminal value. The terminal value represents the expected normalized future cash flows of the reporting unit beyond the cash flows from the discrete projection period. The fair value of the reporting unit is calculated based on the sum of the present value of the cash flows from the discrete period and the present value of the terminal value. The estimated cash flows are discounted using a rate that represents our WACC.
• We maintain benefit plans for most of our employees, including, for certain employees, pension and other postretirement benefit plans. At December 31, 2011, in the aggregate, pension plan benefit obliga-tions exceeded the fair value of pension plan assets, which will result in higher future pension plan expense. Other postretirement benefit plans have larger benefit obligations than plan assets, resulting in expense. Significant benefit plan assumptions, including the discount rate used, the long-term rate of return on plan assets and health care trend rates are periodically updated and impact the amount of benefit plan income, expense, assets and obligations. A sensitivity analysis of the impact of changes in these assumptions on the benefit obligations and expense (income) recorded, as well as on the funded status due to an increase or a decrease in the actual versus expected return on plan assets as of December31,2011andfortheyearthenendedpertainingtoVerizon’spension and postretirement benefit plans is provided in the table below.
(dollars in millions)
Percentage point
change
Increase (decrease) at
December 31, 2011*
Pension plans discount rate +0.50 $ (1,525) -0.50 1,682
Rateofreturnonpensionplanassets +1.00 (247) -1.00 247
Postretirement plans discount rate +0.50 (1,654) -0.50 1,855
Rateofreturnonpostretirement plan assets +1.00 (27)
-1.00 27
Health care trend rates +1.00 3,422 -1.00 (2,768)
* In determining its pension and other postretirement obligation, the Company used a 5.0% discount rate. The rate was selected to approximate the composite interest rates available on a selection of high-quality bonds available in the market at December 31, 2011. The bonds selected had maturities that coincided with the time periods during which benefits payments are expected to occur, were non-callable and available in sufficient quantities to ensure marketability (at least $0.3 billion par outstanding).
ManageMent’S diScuSSion and analySiS oF Financial condition and ReSultS oF opeRationS continued
CritiCal aCCOunting estimates and reCent aCCOunting standards
46
Recent Accounting Standards
DuringMay2011,anaccountingstandardupdateregardingfairvaluemeasurement was issued to provide a consistent definition of fair value and ensure that the fair value measurement and disclosure requirementsaresimilarbetweenU.S.GAAPandInternationalFinancialReportingStandards.Thisstandardupdatealsochangescertainfairvaluemeasurement principles and enhances the disclosure requirements particularly for Level 3 fair value measurements. We will adopt this standard update during the first quarter of 2012. The adoption of this standard update is not expected to have a significant impact on our consolidated financial statements.
In June 2011, an accounting standard update regarding the presenta-tion of comprehensive income was issued to increase the prominence of items reported in other comprehensive income. The update requires thatallnonownerchangesinstockholders’equitybepresentedeitherina single continuous statement of comprehensive income or in two sepa-rate, but consecutive statements. This standard update is effective during the first quarter of 2012. The adoption of this standard is not expected to have a significant impact on our consolidated financial statements.
In September 2011, an accounting standard update regarding testing of goodwill for impairment was issued. This standard update gives compa-nies the option to perform a qualitative assessment to first assess whether the fair value of a reporting unit is less than its carrying amount. If an entity determines it is not more likely than not that the fair value of the reporting unit is less than its carrying amount, then performing the two-step impair-ment test is unnecessary. This standard update is effective during the first quarter of 2012. The adoption of this standard is not expected to have a significant impact on our consolidated financial statements.
aCquisitiOns and divestitures
Terremark Worldwide, Inc.During April 2011, we acquired Terremark for $19 per share in cash. Closing and other direct acquisition-related costs totaled approximately $13millionafter-tax.Theacquisitionwascompletedviaa“short-form”merger under Delaware law through which Terremark became a wholly ownedsubsidiaryofVerizon.TheacquisitionenhancedVerizon’sofferingsto business and government customers globally.
Telephone Access Line Spin-offOn July 1, 2010, after receiving regulatory approval, we completed the spin-off of the shares of a newly formed subsidiary of Verizon (Spinco) to VerizonstockholdersandthemergerofSpincowithFrontier.SpincohelddefinedassetsandliabilitiesthatwereusedinVerizon’slocalexchangebusinesses and related activities in 14 states. The total value of the trans-action to Verizon and its stockholders was approximately $8.6 billion.
Alltel Divestiture MarketsAs a condition of the regulatory approvals to complete the acquisition of Alltel Corporation in January 2009, Verizon Wireless was required to divest overlapping properties in 105 operating markets in 24 states (Alltel DivestitureMarkets).Duringthesecondquarterof2010,AT&TMobilityacquired 79 of the 105 Alltel DivestitureMarkets, including licensesand network assets, for approximately $2.4 billion in cash, and Atlantic Tele-Network, Inc.acquiredtheremaining26AlltelDivestitureMarkets,including licenses and network assets, for $0.2 billion in cash.
See Note 2 to the consolidated financial statements for additional infor-mation relating to the above acquisitions and divestitures.
• Our current and deferred income taxes, and associated valuation allow-ances, are impacted by events and transactions arising in the normal course of business as well as in connection with the adoption of new accounting standards, changes in tax laws and rates, acquisitions and dispositions of businesses and non-recurring items. As a global com-mercial enterprise, our income tax rate and the classification of income taxes can be affected by many factors, including estimates of the timing and realization of deferred income tax assets and the timing and amount of income tax payments. We account for tax benefits taken or expected to be taken in our tax returns in accordance with the accounting standard relating to the uncertainty in income taxes, which requires the use of a two-step approach for recognizing and measuring tax benefits taken or expected to be taken in a tax return. We review and adjust our liability for unrecognized tax benefits based on our best judgment given the facts, circumstances, and information available at each reporting date. To the extent that the final outcome of these tax positions is different than the amounts recorded, such differences may impact income tax expense and actual tax payments. We recognize any interest and penalties accrued related to unrecognized tax benefits in income tax expense. Actual tax payments may materially differ from estimated liabilities as a result of changes in tax laws as well as unan-ticipated transactions impacting related income tax balances.
• Our Plant, property and equipment balance represents a significant component of our consolidated assets. We record plant, property and equipment at cost. Depreciation expense on our local telephone operations is principally based on the composite group remaining life method and straight-line composite rates, which provides for the rec-ognition of the cost of the remaining net investment in local telephone plant, less anticipated net salvage value, over the remaining asset lives. An increase or decrease of 50 basis points to the composite rates of this class of assets would result in an increase or decrease of approxi-mately $0.6 billion to depreciation expense based on year-end plant balances at December 31, 2011. We depreciate other plant, property and equipment on a straight-line basis over the estimated useful life of the assets. We expect that a one-year increase in estimated useful lives of our plant, property and equipment that we depreciate on a straight line basis would result in a decrease to our 2011 depreciation expense of $1.2 billion and that a one-year decrease would result in an increase of approximately $1.6 billion in our 2011 depreciation expense.
ManageMent’S diScuSSion and analySiS oF Financial condition and ReSultS oF opeRationS continued

47
Other faCtOrs that may affeCt future results
Regulatory and Competitive Trends
Competition and Regulation Technological, regulatory and market changes have provided Verizon both new opportunities and challenges. These changes have allowed Verizon to offer new types of services in an increasingly competitive market. At the same time, they have allowed other service providers to broaden the scope of their own competitive offerings. Current and potential competitors for network services include other telephone companies, cable companies, wireless service providers, foreign telecom-munications providers, satellite providers, electric utilities, Internet service providers, providers of VoIP services, and other companies that offer net-workservicesusingavarietyoftechnologies.Manyofthesecompanieshave a strong market presence, brand recognition and existing customer relationships, all of which contribute to intensifying competition and may affectourfuturerevenuegrowth.Manyofourcompetitorsalsoremainsubject to fewer regulatory constraints than us.
We are unable to predict definitively the impact that the ongoing changes in the telecommunications industry will ultimately have on our business, results of operations or financial condition. The financial impact will depend on several factors, including the timing, extent and success of competition in our markets, the timing and outcome of various regula-tory proceedings and any appeals, and the timing, extent and success of our pursuit of new opportunities.
FCC RegulationTheFCChasjurisdictionoverourinterstatetelecommunicationsservicesand other matters under the Communications Act of 1934, as amended (Communications Act). The Communications Act generally provides that we may not charge unjust or unreasonable rates, or engage in unreason-able discrimination when we are providing services as a common carrier, and regulates some of the rates, terms and conditions under which we providecertainservices.TheFCCalsohasadoptedregulationsgoverningvarious aspects of our business including: (i) use and disclosure of cus-tomer proprietary network information; (ii) telemarketing; (iii) assignment of telephone numbers to customers; (iv) provision to law enforcement agencies of the capability to obtain call-identifying information and call content information from calls pursuant to lawful process; (v) accessi-bility of services and equipment to individuals with disabilities if readily achievable; (vi) interconnection with the networks of other carriers; and (vii)customers’abilitytokeep(or“port”)theirtelephonenumberswhenswitching to another carrier. In addition, we pay various fees to support otherFCCprograms,suchas theuniversal serviceprogramdiscussedbelow. Changes to these mandates, or the adoption of additional man-dates, could require us to make changes to our operations or otherwise increase our costs of compliance.
BroadbandTheFCCpreviouslyadoptedaseriesofordersthatimposelesserregu-latory requirements on broadband services and facilities than apply to narrowband or traditional telephone services. With respect to wireline facilities,theFCCdeterminedthatcertainunbundlingrequirementsthatapply to narrowband facilities of local exchange carriers do not apply to broadband facilities such as fiber to the premise loops and packet switches.Withrespecttoservices,theFCCconcludedthatbothwirelineand wireless broadband Internet access services qualify as largely dereg-ulated information services. Separately, certain of our wireline broadband services sold primarily to larger business customers were largely deregu-lated when our forbearance petition was deemed granted by operation of law. The latter relief has been upheld on appeal, but is subject to a continuingchallengebeforetheFCC.
InDecemberof2010,theFCCadoptedso-called“netneutrality”rulesgov-erning broadband Internet access services that it describes as intended to preserve the openness of the Internet. These new rules, which took effect in November 2011 and are subject to a pending appeal, require providers of broadband Internet access to publicly disclose information relating to theperformanceandtermsof itsservices.For“fixed”services,therulesprohibit blocking lawful content, applications, services or non-harmful devices. The rules also prohibit unreasonable discrimination in transmit-tinglawfultrafficoveraconsumer’sbroadbandInternetaccessservice.For“mobile”services,therulesprohibitblockingaccesstolawfulwebsitesorblockingapplicationsthatcompetewiththeprovider’svoiceorvideotelephonyservices.Therestrictionsaresubject to“reasonablenetworkmanagement.”Therulesalsoestablishacomplaintprocess,andstatethattheFCCwillcontinuetomonitordevelopmentstodeterminewhethertoimpose further regulations.
VideoTheFCChasabodyofrulesthatapplytocableoperatorsunderTitleVIofthe Communications Act of 1934, and these rules also generally apply to telephone companies that provide cable services over their networks. In addition, the Act generally requires companies that provide cable service overacablesystemtoobtaina localcablefranchise,andtheFCChasadopted rules that interpret and implement this requirement.
Interstate Access Charges and Intercarrier CompensationIn2011,theFCCissuedabroadorderchangingtheframeworkfortheinterstate and intrastate switched access per-minute rates that carriers charge each other for the exchange of voice traffic. The new rules will gradually reduce to zero the rates that Verizon pays to other carriers and the rates that Verizon charges other carriers. This order also established a per-minute intercarrier compensation rate applicable to the exchange of Voice over IP traffic regardless of whether such traffic is intrastate or interstate. This order is subject to certain pending reconsideration peti-tions and appeals.
TheFCC’scurrentrulesforspecialaccessservicesprovideforpricingflex-ibility and ultimately the removal of services from price regulation when prescribedcompetitive thresholds aremet.More thanhalfof specialaccessrevenuesarenowremovedfrompriceregulation.TheFCCcur-rently has a rulemaking proceeding underway to determine whether and how these rules should be modified.
Universal ServiceTheFCChasadoptedabodyofrulesimplementingtheuniversalserviceprovisions of the Telecommunications Act of 1996, including provisions to support rural and non-rural high-cost areas, low income subscribers, schoolsandlibrariesandruralhealthcare.TheFCC’srulesrequiretele-communications companies including Verizon to pay into the Universal ServiceFund(USF),whichthenmakesdistributionsinsupportofthepro-grams.UnderthebroadorderissuedbytheFCCin2011,thefocusoftheUSFwillbegraduallyshiftedfromsupportofvoiceservicestosupportofbroadbandservices.TheFCCisalsocurrentlyconsideringotherchangesto the rules governing contributions to the fund. Any change in the cur-rent rules could result in a change in the contribution that Verizon and others must make and that would have to be collected from customers, orintheamountsthattheseprovidersreceivefromtheUSF.
Unbundling of Network ElementsUnder Section 251 of the Telecommunications Act of 1996, incumbent local exchange carriers are required to provide competing carriers with access to components of their network on an unbundled basis, known asUNEs,wherecertain statutory standardsare satisfied.TheFCChas
ManageMent’S diScuSSion and analySiS oF Financial condition and ReSultS oF opeRationS continued

48
adopted rules defining the network elements that must be made avail-able, including criteria for determining whether high-capacity loops, transport or dark fiber transport must be unbundled in individual wire centers. The Telecommunications Act of 1996 also adopted a cost-based pricingstandardfortheseUNEs,whichtheFCCinterpretedasallowingittoimposeapricingstandardknownas“totalelementlongrunincre-mentalcost”or“TELRIC.”
Wireless ServicesTheFCCregulatesthelicensing,construction,operation,acquisitionandtransfer of wireless communications systems, including the systems that Verizon Wireless operates, pursuant to the Communications Act, other legislation,andtheFCC’srules.TheFCCandCongresscontinuouslycon-sider changes to these laws and rules. Adoption of new laws or rules may raise the cost of providing service or require modification of Verizon Wireless’businessplansoroperations.
To use the radio frequency spectrum, wireless communications systems mustbelicensedbytheFCCtooperatethewirelessnetworkandmobiledevices in assigned spectrum segments.VerizonWireless holds FCClicenses to operate in several different radio services, including the cel-lular radiotelephone service, personal communications service, wireless communications service, and point-to-point radio service. The technical and service rules, the specific radio frequencies and amounts of spectrum Verizon Wireless holds, and the sizes of the geographic areas it is autho-rized to operate in, vary for each of these services. However, all of the licenses Verizon Wireless holds allow it to use spectrum to provide a wide range of mobile and fixed communications services, including both voice and data services, and Verizon Wireless operates a seamless network that utilizesthoselicensestoprovideservicestocustomers.BecausetheFCCissues licenses for only a fixed time, generally 10 years, Verizon Wireless mustperiodicallyseekrenewalofthoselicenses.AlthoughtheFCChasroutinelyrenewedallofVerizonWireless’licensesthathavecomeupforrenewal to date, challenges could be brought against the licenses in the future. If a wireless license were revoked or not renewed upon expira-tion, Verizon Wireless would not be permitted to provide services on the licensed spectrum in the area covered by that license.
TheFCChasalso imposedspecificmandatesoncarriers thatoperatewirelesscommunicationssystems,whichincreaseVerizonWireless’costs.These mandates include requirements that Verizon Wireless: (i) meet specific construction and geographic coverage requirements during the license term; (ii) meet technical operating standards that, among other things, limit the radio frequency radiation from mobile devices andantennas;(iii)deploy“Enhanced911”wirelessservicesthatprovidethewirelesscaller’snumber,locationandotherinformationtoastateorlocal public safety agency that handles 911 calls; (iv) provide roaming services to other wireless service providers; and (v) comply with regula-tions for the construction of transmitters and towers that, among other things, restrict siting of towers in environmentally sensitive locations and in places where the towers would affect a site listed or eligible for listing ontheNationalRegisterofHistoricPlaces.Changestothesemandatescould require Verizon Wireless to make changes to operations or increase its costs of compliance. In its November 4, 2008 order approving Verizon Wireless’acquisitionofAlltel,theFCCadoptedconditionsthat imposeadditional requirements on Verizon Wireless in its provision of Enhanced 911 services and roaming services.
The Communications Act imposes restrictions on foreign ownership of U.S.wirelesssystems.TheFCChasapprovedtheinterestthatVodafoneGroup Plc holds, through various of its subsidiaries, in Verizon Wireless. TheFCCmayneedtoapproveanyincreaseinVodafone’sinterestortheacquisition of an ownership interest by other foreign entities. In addition, aspartoftheFCC’sapprovalofVodafone’sownershipinterest,VerizonWireless, Verizon and Vodafone entered into an agreement with the
U.S.DepartmentofDefense,DepartmentofJusticeandFederalBureauof Investigation which imposes national security and law enforce-ment-related obligations on the ways in which Verizon Wireless stores information and otherwise conducts its business.
Verizon Wireless anticipates that it will need additional spectrum to meet future demand. It can meet spectrum needs by purchasing licenses or leasing spectrum from other licensees, or by acquiring new spectrum licensesfromtheFCC.UndertheCommunicationsAct,beforeVerizonWireless can acquire a license from another licensee in order to expand its coverage or its spectrum capacity in a particular area, it must file an applicationwith theFCC,andtheFCCcangrant theapplicationonlyafter a period for public notice and comment. This review process can delay acquisition of spectrum needed to expand services, and can result in conditions on the purchaser that can impact its costs and business plans.TheCommunicationsAct also requires the FCC to awardnewlicenses for most commercial wireless services through a competitive bidding process in which spectrum is awarded to bidders in an auction. Verizon Wireless has participated in spectrum auctions to acquire licenses forradiospectruminvariousbands.Mostrecently,VerizonWirelesspar-ticipatedintheFCC’sauctionofspectruminthe700MHzband,andwasthehighbidderon109licensesinthe700MHzband.TheFCCgrantedallof those licenses to Verizon Wireless on November 26, 2008.
TheFCCalsoadoptedservicerulesthatwill imposecostsonlicenseesthatacquirethe700MHzbandspectrumeitherthroughauctionorbypurchasing such spectrum from other companies. These rules include minimum coverage mandates by specific dates during the license terms, and,forapproximatelyone-thirdofthespectrum,knownasthe“CBlock,”“openaccess” requirements,whichgenerally require licenseesof thatspectrum to allow customers to use devices and applications of their choice on the LTE network we are deploying on that spectrum, including those obtained from sources other than us or our distributors or dealers, subject to certain technical limitations established by us. Verizon Wireless holdstheCBlock700MHzlicensescoveringtheentireUnitedStates.Inadoptingits“netneutrality”rulesdiscussedabove,theFCCstatedthatthenewrulesoperate independently fromthe“openaccess” require-ments that continue to apply to the C Block licensees.
The FCC is also conducting several proceedings to exploremakingadditional spectrum available for licensed and/or unlicensed use. These proceedingscouldincreaseradiointerferencetoVerizonWireless’opera-tions from other spectrum users and could impact the ways in which it uses spectrum, the capacity of that spectrum to carry traffic, and the value of that spectrum.
State Regulation and Local ApprovalsTelephone OperationsState public utility commissions regulate our telephone operations with respect to certain telecommunications intrastate matters. Our com-petitive local exchange carrier and long distance operations are lightly regulated the same as other similarly situated carriers. Our incumbent local exchange operations (California, Connecticut, Delaware, the District ofColumbia,Florida,Maryland,Massachusetts,NewJersey,NewYork,NorthCarolina,Pennsylvania,RhodeIsland,TexasandVirginia)aresubjectto various levels of pricing flexibility, deregulation, detariffing, and service quality standards. None of the states are subject to earnings regulation.
VideoCompanies that provide cable service over a cable system are typically subject to state and/or local cable television rules and regulations. As noted above, cable operators generally must obtain a local cable fran-chise from each local unit of government prior to providing cable service in that local area. Some states have enacted legislation that enables cable operators to apply for, and obtain, a single cable franchise at the
ManageMent’S diScuSSion and analySiS oF Financial condition and ReSultS oF opeRationS continued

49
state, rather than local, level. To date, Verizon has applied for and received state-issuedfranchises inCalifornia,Florida,NewJersey,Texasandtheunincorporated areas of Delaware. We also have obtained authoriza-tionfromthestatecommissioninRhodeIslandtoprovidecableservicein certain areas in that state, have obtained required state commission approvals for our local franchises in New York, and will need to obtain additional state commission approvals in these states to provide cable service in additional areas. Virginia law provides us the option of entering a given franchise area using state standards if local franchise negotiations are unsuccessful.
Wireless ServicesThe rapid growth of the wireless industry has led to efforts by some state legislatures and state public utility commissions to regulate the industry in ways that may impose additional costs on Verizon Wireless. The Communications Act generally preempts regulation by state and local governments of the entry of, or the rates charged by, wireless carriers, but doesnotprohibitstatesfromregulatingtheother“termsandconditions”of wireless service. While numerous state commissions do not currently have jurisdiction over wireless services, state legislatures may decide to grant them such jurisdiction, and those commissions that already have authority to impose regulations on wireless carriers may adopt new rules.
State efforts to regulate wireless services have included proposals to regulate customer billing, termination of service, trial periods for service, advertising, the use of handsets while driving, reporting requirements for system outages and the availability of broadband wireless services. Wireless tower and antenna facilities are also subject to state and local zoning and land use regulation, and securing approvals for new or modi-fied tower or antenna sites is often a lengthy and expensive process.
Verizon Wireless (as well as AT&T and Sprint-Nextel) is a party to an Assurance of Voluntary Compliance (AVC) with 33 State Attorneys General.TheAVC,whichgenerallyreflectedVerizonWireless’practicesatthe time it was entered into in July 2004, obligates the company to dis-close certain rates and terms during a sales transaction, to provide maps depicting coverage, and to comply with various requirements regarding advertising, billing, and other practices.
Environmental Matters
During 2003, under a government-approved plan, remediation com-menced at the site of a former Sylvania facility in Hicksville, New York thatprocessednuclear fuelrods inthe1950sand1960s.Remediationbeyond original expectations proved to be necessary and a reassessment of the anticipated remediation costs was conducted. A reassessment of costs related to remediation efforts at several other former facilities was also undertaken. In September 2005, the Army Corps of Engineers (ACE) accepted theHicksville site into theFormerlyUtilizedSitesRemedialAction Program. This may result in the ACE performing some or all of the remediation effort for the Hicksville site with a corresponding decrease in costs to Verizon. To the extent that the ACE assumes responsibility for remedial work at the Hicksville site, an adjustment to a reserve pre-viously established for the remediation may be made. Adjustments to the reserve may also be made based upon actual conditions discovered during the remediation at this or any other site requiring remediation.
CautiOnary statement COnCerning fOrward-lOOking statements
In this report we have made forward-looking statements. These state-ments are based on our estimates and assumptions and are subject to risksanduncertainties.Forward-lookingstatementsincludetheinforma-tion concerning our possible or assumed future results of operations. Forward-looking statements also include thoseprecededor followedbythewords“anticipates,”“believes,”“estimates,”“hopes”orsimilarexpres-sions.Forthosestatements,weclaimtheprotectionofthesafeharborforforward-looking statements contained in the Private Securities Litigation ReformActof1995.
The following important factors, along with those discussed elsewhere in this report could affect future results and could cause those results to differ materially from those expressed in the forward-looking statements:
• adverse conditions in the U.S. and international economies; • competition in our markets; • material adverse changes in labor matters, including labor negotiations
or additional organizing activity, and any resulting financial and/or operational impact;
• material changes in available technology; • anydisruptionofourkeysuppliers’provisioningofproductsorservices;• significant increases in benefit plan costs or lower investment returns
on plan assets;• breaches of network or information technology security, natural disas-
ters or terrorist attacks or existing or future litigation and any resulting financial impact not covered by insurance;
• technology substitution;• an adverse change in the ratings afforded our debt securities by
nationally accredited ratings organizations or adverse conditions in the credit markets impacting the cost, including interest rates, and/or availability of financing;
• any changes in the regulatory environments in which we operate, including any increase in restrictions on our ability to operate our networks;
• the timing, scope and financial impact of our deployment of broad-band technology;
• changes in our accounting assumptions that regulatory agencies, including the SEC, may require or that result from changes in the accounting rules or their application, which could result in an impact on earnings;
• our ability to complete acquisitions and dispositions; and• the inability to implement our business strategies.
ManageMent’S diScuSSion and analySiS oF Financial condition and ReSultS oF opeRationS continued