selected statistics on puerto rico’s external trade 2013gis.jp.pr.gov/externo_econ/estadisticas...
TRANSCRIPT


Junta de Planifi cación Planning Board
Estadísticas Seleccionadas del Comercio Exterior de Puerto Rico 2013 Selected Statistics on Puerto Rico’s External Trade 2013
i
Estadísticas Seleccionadas del Comercio Exterior de Puerto RicoSelected Statistics on Puerto Rico’s External Trade
2013
Plan Luis García PelattiPresidente - Chairman
Dr. Julio Hernández CorreaDirector – Director
Programa de Planifi caciónEconómica y Social
Program of Economicand Social Planning
Sr. Juan Cruz Urbina
Director – DirectorSubprograma de Análisis EconómicoSubprogram of Economic Analysis
Grupo de Trabajo - Staff
Analistas - Analysts
Tablas y Gráfi casTables and Graphs
Gerardo Sánchez DuvergéWilliam Galindo Irizarry
Glorimar Morales Rivera
Artista Gráfi co - Graphic ArtistNancy Más Marrero
ESTADO LIBRE ASOCIADO DE PUERTO RICOOFICINA DEL GOBERNADORJUNTA DE PLANIFICACIÓN
COMMONWEALTH OF PUERTO RICO OFFICE OF THE GOVERNOR
PLANNING BOARD
Marzo - March 2013

Junta de Planifi cación Planning Board
Estadísticas Seleccionadas del Comercio Exterior de Puerto Rico 2013 Selected Statistics on Puerto Rico’s External Trade 2013
ii

Junta de Planifi cación Planning Board
Estadísticas Seleccionadas del Comercio Exterior de Puerto Rico 2013 Selected Statistics on Puerto Rico’s External Trade 2013
iii
TABLA DE CONTENIDOTable of contents
Página - Page
Prefacio – Preface .............................................................................................................................................................................................. iii
El sistema de las estadísticas del comercio exterior de Puerto Rico y defi niciones - Puerto Rico’s external trade data system and defi nitions .... 1
Tablas - Tables1 Comercio exterior de Puerto Rico - Puerto Rico’s external trade ............................................................................................................... 9
2 Balance comercial por región geográfi ca total - Trade balance by total geographic región ..................................................................... 10
3 Balance comercial por región geográfi ca y país - Trade balance by geographic region and country ...................................................... 12
4 Exportaciones e importaciones: países más importantes - Exports and imports: main countries ............................................................ 20
5 Importaciones registradas de países extranjeros por trato arancelario - Recorded imports from foreign countries by tariff treatment ... 21
6 Exportaciones de mercancía registrada por Sistema de Clasifi cación Industrial de América del Norte (SCIAN) -
Exports of recorded merchandise by North American Industrial Classifi cation System (NAICS) ............................................................ 23
7 Importaciones de mercancía registrada por Sistema de Clasifi cación Industrial de América del Norte (SCIAN) -
Imports of recorded merchandise by North American Industrial Classifi cation System (NAICS) ............................................................ 24
8 Balance comercial por Sistema de Clasifi cación Industrial de América del Norte (SCIAN) - Trade balance by
North American Industrial Classifi cation System (NAICS) ....................................................................................................................... 25
9 Principales exportaciones e importaciones por Sistema de Clasifi cación Industrial de América del Norte (SCIAN) -
Main exports and imports by North American Industrial Classifi cation System (NAICS) ........................................................................ 28
10 Clasifi cación económica de las importaciones registradas - Economic classifi cation of recorded imports .............................................. 30
11 Clasifi cación económica de las importaciones ajustadas - Economic classifi cation of adjusted imports ................................................. 31
12 Origen del movimiento de las exportaciones registradas a países extranjeros - Origin of recorded exports’ movement
to foreign countries .................................................................................................................................................................................. 32

Junta de Planifi cación Planning Board
Estadísticas Seleccionadas del Comercio Exterior de Puerto Rico 2013 Selected Statistics on Puerto Rico’s External Trade 2013
iv
Gráfi cas – Graphs1 Comercio exterior de Puerto Rico - Puerto Rico's external trade ............................................................................................................. 41
2 Exportaciones registradas - Recorded exports ........................................................................................................................................ 42
3 Importaciones registradas - Recorded imports ......................................................................................................................................... 43
4 Balance comercial - Trade balance .......................................................................................................................................................... 44
5 Exportaciones registradas a países extranjeros por región geográfi ca total - Recorded exports to foreign countries by total geographic
región ....................................................................................................................................................................................................... 45
6 Importaciones registradas de países extranjeros por región geográfi ca total - Recorded imports from foreign countries by total
geographic región .................................................................................................................................................................................... 46
7 Comercio con los países extranjeros en acuerdos comerciales de Estados Unidos - Commerce with the foreign countries in
United Statres trade agreements .............................................................................................................................................................. 47
8 Comercio con países de los acuerdos comerciales en América Central y el Caribe - Commerce with countries of trade agreements in
Central America and the Caribbean ......................................................................................................................................................... 48
9 Comercio con los países de la Unión Europea - Trade with the European Union countries .................................................................... 49
10 Comercio con los países de las organizaciones internacionales seleccionadas - Trade with countries of selected international
organizations ........................................................................................................................................................................................... 50
11 Principales exportaciones registradas por Sistema de Clasifi cación Industrial de América del Norte (SCIAN) - Main recorded exports by
North American Industrial Classifi cation System (NAICS) ........................................................................................................................ 51
12 Principales importaciones registradas por Sistema de Clasifi cación Industrial de América del Norte (SCIAN) - Main recorded imports by North American Industrial Classifi cation System (NAICS) ....................................................................................5213 Importaciones registradas de países extranjeros por trato arancelario - Recorded imports from foreign countries
by tariff treatment ...................................................................................................................................................................53
14 Clasifi cación económica de las importaciones registradas - Economic classifi cation of recorded imports .............................54
15 Clasifi cación económica de las importaciones ajustadas - Economic classifi cation of adjusted imports ................................55
Junta de Planifi cación Planning Board
Estadísticas Seleccionadas del Comercio Exterior de Puerto Rico 2013 Selected Statistics on Puerto Rico’s External Trade 2013
v
PREFACIO
La Junta de Planifi cación es la agencia ofi cial encargada de divulgar las estadísticas sobre el comercio exterior de Puerto Rico. Por tal razón se publica el documento Estadísticas Seleccionadas del Comercio Exterior de Puerto Rico, para proveer y hacer más accesible al público esta información especializada de importancia para el país. El mismo sirve de complemento a los datos presentados tanto en Balanza de Pagos de Puerto Rico (para un mejor entendimiento de la importancia que tiene el sector externo en nuestra economía), como en el External Trade Statistics, en Balance Comercial de Puerto Rico por País y por Sistema de Clasifi cación Industrial de América del Norte (SCIAN) y en Apéndice Estadístico del Informe Económico al Gobernador y a la Asamblea Legislativa.
Las estadísticas presentadas se refi eren sólo al comercio de mercancía, no de servicios. La publicación está dividida en tres secciones. En la primera se provee información sobre el sistema de comercio exterior de Puerto Rico y las principales defi niciones para benefi cio de los usuarios. Se sugiere al lector que comience con esta sección para conocer las bases conceptuales de las defi niciones que se utilizan en esta publicación. La segunda sección es un conjunto de tablas, mientras que la tercera comprende una serie de gráfi cas, incluyendo en ambas secciones una descripción de las exportaciones e importaciones, de acuerdo a criterios de clasifi cación de importancia: región geográfi ca, trato arancelario, clasifi cación industrial, principales productos y mercados y otros.

Junta de Planifi cación Planning Board
Estadísticas Seleccionadas del Comercio Exterior de Puerto Rico 2013 Selected Statistics on Puerto Rico’s External Trade 2013
vi
PREFACE
The Puerto Rico Planning Board is the agency responsible of issuing Puerto Rico’s external trade statistics. For this reason we publish Selected Statistics on Puerto Rico’s External Trade, in order to provide and make more accessible specialized information to the public. It contains supplementary information to the data presented in Balance of Payments of Puerto Rico (for a better understanding of the external sector’s importance in our economy), as well as External Trade Statistics, in Puerto Rico Trade Balance by Country and by North American System of Industry Classifi cation (NAICS), and in Statistical Appendix of the Economic Report to the Governor and to the Legislative Assembly.
The statistics presented refer only to merchandise, not services. The publication is divided in three sections. The fi rst section provides information on Puerto Rico’s external trade data system and defi nitions, for the benefi t of the users. We suggest the reader starts with this section in order to understand the conceptual basis of the defi nitions being used throughout this report. The second section is a chart set, while the third section is a graph series, both of them comprising a description of exports and imports according to important classifi cation criteria: geographic region; tariff treatment; industrial classifi cation; main products and markets; and others.

Junta de Planifi cación Planning Board
Estadísticas Seleccionadas del Comercio Exterior de Puerto Rico 2013 Selected Statistics on Puerto Rico’s External Trade 2013
vii
EL SISTEMA DE LAS ESTADISTICAS
DEL COMERCIO EXTERIOR DE PUERTO RICO Y DEFINICIONES

Junta de Planifi cación Planning Board
Estadísticas Seleccionadas del Comercio Exterior de Puerto Rico 2013 Selected Statistics on Puerto Rico’s External Trade 2013
8

Junta de Planifi cación Planning Board
Estadísticas Seleccionadas del Comercio Exterior de Puerto Rico 2013 Selected Statistics on Puerto Rico’s External Trade 2013
1
Introducción
El sistema de las estadísticas del comercio exterior de Puerto Rico incorpora todas las transacciones de mercancía entre Puerto Rico y Estados Unidos, Islas Vírgenes de los Estados Unidos y países extranjeros. Esta información es recopilada por el Negociado del Censo de los Estados Unidos. El Subprograma de Análisis Económico de la Junta de Planifi cación de Puerto Rico recibe mensualmente la información a través de medios electrónicos. Esta contiene estadísticas detalladas de las transacciones por artículo, medio de transportación, peso, valor, cantidad y país. Las cifras se procesan de acuerdo a las necesidades específi cas de información solicitada. Existen tres clasifi caciones básicas: Estados Unidos, países extranjeros e Islas Vírgenes (EE.UU.). Puerto Rico está incluido dentro del sistema aduanero y arancelario de Estados Unidos. La Ofi cina de Datos de Comercio Exterior de Puerto Rico, bajo el Negociado del Censo federal, comenzó operaciones en enero de 1992. Esta orienta y aclara a las compañías en Puerto Rico todos los procedimientos que conlleva embarcar mercancía a Estados Unidos y a países extranjeros.
Embarques entre Puerto Rico y Estados Unidos
A todas las compañías se les requiere llenar una forma conocida como Declaración de Embarques de los Exportadores (SED, por sus siglas en inglés), de la cual se obtienen los datos estadísticos. Esta se somete a una de las ofi cinas de Aduana de los Estados Unidos en San Juan, Ponce o Mayagüez. Esto se hace tanto para las exportaciones como para las importaciones. El valor está basado en el precio de transacción incluyendo fl etes internos, seguros y otros cargos pertenecientes al punto de embarque, y se conoce como valor "FAS", por sus siglas en inglés (free alongside ship). No debe incluir
fl ete marítimo, seguros u otros cargos que se incurran más allá del punto de embarque.
Comercio con países extranjeros
La información para las exportaciones de Puerto Rico con países extranjeros se toma de los formularios Declaración de Embarques de los Exportadores, que se llenan en el punto de embarcación. El valor del embarque está basado en el precio de transacción incluyendo fl etes internos, seguros y otros cargos hasta el lugar de embarcación. La mercancía en tránsito enviada a través de Puerto Rico, desde un país extranjero a otro, no se considera como una exportación. La mercancía importada, que ha tenido el visto bueno de Aduana y es reexportada sin otro proceso, se clasifi ca separadamente como exportaciones de mercancía extranjera, pero se incluye como parte de las exportaciones y se clasifi ca de acuerdo a los manuales ofi ciales.
El país de destino es defi nido como el lugar donde la mercancía va a ser consumida o usada, procesada o para manufactura fi nal. Si el exportador no tiene la información o la misma no está defi nida como último destino, se acredita para propósitos estadísticos al país al cual es consignada.
En las importaciones para consumo, la información es recopilada según las regulaciones aduaneras sometidas por los importadores a una de las ofi cinas de Aduana de los Estados Unidos en San Juan, Ponce o Mayagüez. Las mismas incluyen importaciones para consumo directo más las retiradas de los almacenes de adeudo gubernamentales y no gubernamentales. Se excluye mercancía devuelta por las Fuerzas Armadas de los Estados Unidos para su propio uso. Desde el 1982 las estadísticas de importaciones se presentan en términos del valor
EL SISTEMA DE LAS ESTADISTICAS DEL COMERCIO EXTERIOR DE PUERTO RICO Y DEFINICIONES

Junta de Planifi cación Planning Board
Estadísticas Seleccionadas del Comercio Exterior de Puerto Rico 2013 Selected Statistics on Puerto Rico’s External Trade 2013
2
aduanero, el cual se defi ne como el precio pagado por la mercancía cuando es vendida para exportación a los Estados Unidos, excluyendo los cargos de aduana norteamericana, fl etes, seguros y otros cargos incurridos al llevar la mercancía a los Estados Unidos. Antes del 1982, las importaciones eran presentadas como valor "FAS" defi nido como el valor de la transacción de las importaciones en el punto de embarcación extranjero.
Embarques entre Puerto Rico y las Islas Vírgenes (EE.UU.)
En las exportaciones a Islas Vírgenes (EE.UU.) la información se obtiene de los formularios Declaración de Embarques de los Exportadores que se someten a las ofi cinas de Aduanas de los Estados Unidos al momento de embarcar la mercancía. Se incluyen los embarques a través de todos los medios de transportación. El valor es el precio de transacción incluyendo los fl etes locales, seguros y otros cargos al lugar de envío.
En el caso de las importaciones, la información está basada en la declaración de importación que la Ofi cina de Aduana de los Estados Unidos en Puerto Rico le requiere a los importadores. El valor es el aduanero, esto es, el de la importación al ser tasada por la aduana de los Estados Unidos. La información de los artículos es sometida de acuerdo a las clasifi caciones del Departamento de Comercio de los Estados Unidos.
Clasifi caciones
Como parte del sistema de aduana de los Estados Unidos, los sistemas usados en la clasifi cación de los artículos son iguales a los de Estados Unidos: Manual de Clasifi cación B para las exportaciones e importaciones hacia o desde Estados Unidos y el Manual Armónico Arancelario Anotado para las importaciones de países extranjeros. Ambos sistemas se basan en la Descripción de Artículos Armonizados y en el Sistema de Códigos.
Fuentes de información de las estadísticas de comercio exterior
La edición anual de External Trade Statistics es la publicación básica que presenta las estadísticas de comercio exterior de Puerto Rico. Esta incluye un detalle por artículo y país usando el Sistema Armónico (SA). Las tablas resúmenes son incluidas en el Apéndice Estadístico del Informe Económico al Gobernador y a la Asamblea Legislativa, la Balanza de Pagos de Puerto Rico y en otras publicaciones. También se preparan tabulaciones e informes internos (mensuales y acumulados) en los cuales la información se clasifi ca por regiones o artículos, por área geográfi ca o país. La información es mantenida en el Programa de Sistemas de Información de la Junta de Planifi cación. Los informes son generados según las necesidades de los usuarios. La información publicada está basada en el año fi scal, esto es, de julio a junio.
Introduction
The external trade data system of Puerto Rico incorporates all transactions of merchandise between Puerto Rico and the United States, U.S. Virgin Islands, and foreign countries. The U.S. Bureau of the Census compiles this information. Currently, the Subprogram of Economic Analysis of the Puerto Rico Planning Board receives the information monthly by electronic media, containing detailed statistics of the transactions by commodity, mean of transportation, weight, value, quantity, and country. This data is processed according to our specifi c needs of information in different types of tabulations. There are three basic geographic classifi cations: United States, foreign countries, and the U.S. Virgin Islands. Puerto Rico is included within the U.S. Customs and tariff systems. The Puerto Rico Trade Data Offi ce, under the U.S. Bureau of the Census, began operations in January 1992. It guides and clarifi es companies in Puerto Rico on the necessary proceedings in the shipment of merchandise to the United States and foreign countries.

Junta de Planifi cación Planning Board
Estadísticas Seleccionadas del Comercio Exterior de Puerto Rico 2013 Selected Statistics on Puerto Rico’s External Trade 2013
3
Shipments between Puerto Rico and the United States
The statistics are obtained from a special form required to all companies, known as a Shipper's Export Declaration form (SED). For shipments from Puerto Rico to the United States, this form must be submitted to one of the U.S. Customs offi ces in San Juan, Ponce or Mayagüez. At the same time, a similar form must accompany all shipments from the U.S. to Puerto Rico. The value is based on the transaction price including inland freight, insurance and other charges to the border point or seaport. It is classifi ed as free alongside ship (FAS) value at the port of embarkation. It should not include ocean freight, marine insurance, or other charges incurred beyond the port of embarkation.
Trade with foreign countries
The information on exports from Puerto Rico is obtained from the SED's fi led out by the exporters at the port of embarkation. The value of the shipment is based on the transaction price including inland freight, insurance, and other charges to the place of embarkation. Merchandise in transit shipped through Puerto Rico from one foreign country to another is not considered as an export. Imported merchandise which has cleared customs and which is re-exported without further processing, is classifi ed separately as exports of foreign merchandise, but included as part of exports and classifi ed according to the offi cial schedules.
Country of destination is defined as the place where the merchandise is to be consumed or used, either in further processing or final manufacturing. In the event the exporter does not have enough or definite information as to the ultimate destination of the shipment, it is credited for statistical purposes to the country to which it is consigned.
In the case of imports for direct consumption, the information is based on regular U.S. Custom’s entries of merchandise fi led out by the importers at one of the U.S. Customs Offi ces in San Juan, Ponce or Mayagüez. It includes imports for direct consumption plus withdrawals from bonded warehouses, government as well as non-governmental. U.S. goods returned by the U.S. Armed Forces for their own use are excluded. Since 1982, import data is presented in terms of customs value, defi ned as the price paid for merchandise exported to the U.S., excluding U.S. import duties, freight, insurance and other charges incurred in bringing the merchandise to the United States. Before 1982, import data was presented as FAS value, which was defi ned as the transaction value of imports at the foreign port of embarkation.
Shipments between Puerto Rico and the U.S. Virgin Islands
In the case of exports to the U.S. Virgin Islands, the information comes from the SED's fi led at the U.S. Customs Offi ce at the time the merchandise is shipped. Shipments by all means of transportation are included. The value is based on the transaction price including inland freight, insurance, and other charges to the place of shipment.
Regarding imports, the information is based on the import entry form which importers are required to fi le at the U.S. Customs Offi ce in San Juan. The value shown is the customs value, which is the value of imports as appraised by U.S. Customs. Commodity information is reported according to the classifi cation schedules of the U.S. Department of Commerce.
Classifi cations
As part of the U.S. Customs system, the commodity classifi cation systems used are the same as in the United States: Schedule B for
PUERTO RICO'S EXTERNAL TRADE DATA SYSTEM AND DEFINITIONS

Junta de Planifi cación Planning Board
Estadísticas Seleccionadas del Comercio Exterior de Puerto Rico 2013 Selected Statistics on Puerto Rico’s External Trade 2013
4
exports and imports to or from the United States, and the Harmonized Tariff Schedule Annotated for imports from foreign countries. Both systems are based on the Harmonized Commodity Description and the Coding System.
Sources of information of external trade statistics
The annual report External Trade Statistics is the basic publication in which Puerto Rico's trade data is presented to the public. It includes a detailed set of statistics by commodity and country using
the HS. Summary tables for each fiscal year are included in the Statistical Appendix of the Economic Report to the Governor and to the Legislative Assembly, in the Selected Statistics on Puerto Rico’s External Trade, in the Balance of Payments of Puerto Rico, and in other publications. In addition, there are internal reports or tabulations in which trade is classified by region or commodity, by geographic area or by country, and presented in a monthly and accumulated form. This information is maintained in the Program of Information Systems of the Planning Board. The reports are generated as needed. The published information is on a fiscal year basis, from July to June.
Junta de Planifi cación Planning Board
Estadísticas Seleccionadas del Comercio Exterior de Puerto Rico 2013 Selected Statistics on Puerto Rico’s External Trade 2013
5
TablasTables

Junta de Planifi cación Planning Board
Estadísticas Seleccionadas del Comercio Exterior de Puerto Rico 2013 Selected Statistics on Puerto Rico’s External Trade 2013
6
Junta de Planifi cación Planning Board
Estadísticas Seleccionadas del Comercio Exterior de Puerto Rico 2013 Selected Statistics on Puerto Rico’s External Trade 2013
7
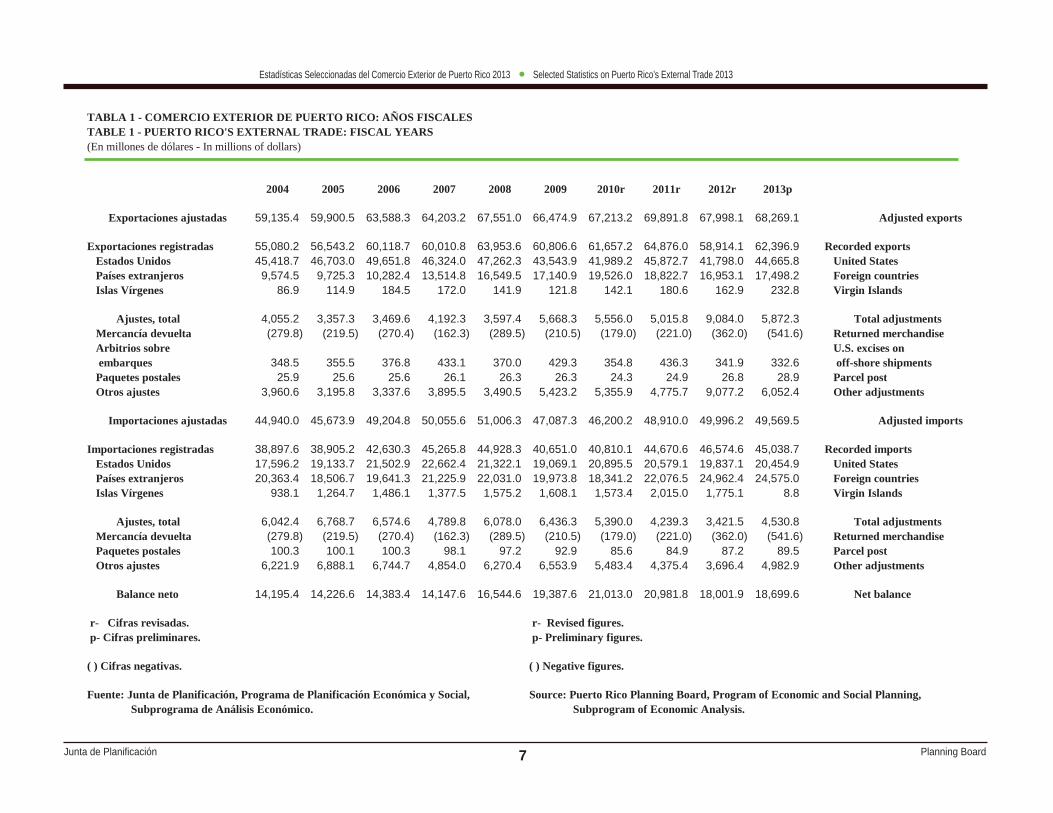
TABLA 1 - COMERCIO EXTERIOR DE PUERTO RICO: AÑOS FISCALES TABLE 1 - PUERTO RICO'S EXTERNAL TRADE: FISCAL YEARS (En millones de dólares - In millions of dollars)
2004 2005 2006 2007 2008 2009 2010r 2011r 2012r 2013p
Exportaciones ajustadas 59,135.4 59,900.5 63,588.3 64,203.2 67,551.0 66,474.9 67,213.2 69,891.8 67,998.1 68,269.1 Adjusted exports
Exportaciones registradas 55,080.2 56,543.2 60,118.7 60,010.8 63,953.6 60,806.6 61,657.2 64,876.0 58,914.1 62,396.9 Recorded exports Estados Unidos 45,418.7 46,703.0 49,651.8 46,324.0 47,262.3 43,543.9 41,989.2 45,872.7 41,798.0 44,665.8 United States Países extranjeros 9,574.5 9,725.3 10,282.4 13,514.8 16,549.5 17,140.9 19,526.0 18,822.7 16,953.1 17,498.2 Foreign countries Islas Vírgenes 86.9 114.9 184.5 172.0 141.9 121.8 142.1 180.6 162.9 232.8 Virgin Islands
Ajustes, total 4,055.2 3,357.3 3,469.6 4,192.3 3,597.4 5,668.3 5,556.0 5,015.8 9,084.0 5,872.3 Total adjustments Mercancía devuelta (279.8) (219.5) (270.4) (162.3) (289.5) (210.5) (179.0) (221.0) (362.0) (541.6) Returned merchandise Arbitrios sobre U.S. excises on embarques 348.5 355.5 376.8 433.1 370.0 429.3 354.8 436.3 341.9 332.6 off-shore shipments Paquetes postales 25.9 25.6 25.6 26.1 26.3 26.3 24.3 24.9 26.8 28.9 Parcel post Otros ajustes 3,960.6 3,195.8 3,337.6 3,895.5 3,490.5 5,423.2 5,355.9 4,775.7 9,077.2 6,052.4 Other adjustments
Importaciones ajustadas 44,940.0 45,673.9 49,204.8 50,055.6 51,006.3 47,087.3 46,200.2 48,910.0 49,996.2 49,569.5 Adjusted imports
Importaciones registradas 38,897.6 38,905.2 42,630.3 45,265.8 44,928.3 40,651.0 40,810.1 44,670.6 46,574.6 45,038.7 Recorded imports Estados Unidos 17,596.2 19,133.7 21,502.9 22,662.4 21,322.1 19,069.1 20,895.5 20,579.1 19,837.1 20,454.9 United States Países extranjeros 20,363.4 18,506.7 19,641.3 21,225.9 22,031.0 19,973.8 18,341.2 22,076.5 24,962.4 24,575.0 Foreign countries Islas Vírgenes 938.1 1,264.7 1,486.1 1,377.5 1,575.2 1,608.1 1,573.4 2,015.0 1,775.1 8.8 Virgin Islands
Ajustes, total 6,042.4 6,768.7 6,574.6 4,789.8 6,078.0 6,436.3 5,390.0 4,239.3 3,421.5 4,530.8 Total adjustments Mercancía devuelta (279.8) (219.5) (270.4) (162.3) (289.5) (210.5) (179.0) (221.0) (362.0) (541.6) Returned merchandise Paquetes postales 100.3 100.1 100.3 98.1 97.2 92.9 85.6 84.9 87.2 89.5 Parcel post Otros ajustes 6,221.9 6,888.1 6,744.7 4,854.0 6,270.4 6,553.9 5,483.4 4,375.4 3,696.4 4,982.9 Other adjustments
Balance neto 14,195.4 14,226.6 14,383.4 14,147.6 16,544.6 19,387.6 21,013.0 20,981.8 18,001.9 18,699.6 Net balance
r- Cifras revisadas. r- Revised figures. p- Cifras preliminares. p- Preliminary figures.
( ) Cifras negativas. ( ) Negative figures.
Fuente: Junta de Planificación, Programa de Planificación Económica y Social, Source: Puerto Rico Planning Board, Program of Economic and Social Planning, Subprograma de Análisis Económico. Subprogram of Economic Analysis.

Junta de Planifi cación Planning Board
Estadísticas Seleccionadas del Comercio Exterior de Puerto Rico 2013 Selected Statistics on Puerto Rico’s External Trade 2013
8
TABLA 2 - BALANCE COMERCIAL POR REGION GEOGRAFICA TOTAL: AÑOS FISCALESTABLE 2 - TRADE BALANCE BY TOTAL GEOGRAPHIC REGION: FISCAL YEARS(En millones de dólares - In millions of dollars)
2004 2005 2006 2007 2008 2009 2010 2011 2012 2013
Exportaciones registradas 55,080.2 56,543.2 60,118.7 60,010.8 63,953.6 60,806.6 61,657.2 64,876.0 58,914.1 62,396.9 Recorded exports
Estados Unidos 45,418.7 46,703.0 49,651.8 46,324.0 47,262.3 43,543.9 41,989.2 45,872.7 41,798.0 44,665.8 United StatesIslas Vírgenes 86.9 114.9 184.5 172.0 141.9 121.8 142.1 180.6 162.9 232.8 Virgin IslandsPaíses extranjeros 9,574.5 9,725.3 10,282.4 13,514.8 16,549.4 17,140.9 19,526.0 18,822.6 16,953.1 17,498.2 Foreign countries Africa 60.0 29.2 32.5 70.5 32.3 24.1 16.4 16.6 13.4 23.4 Africa América Central 91.9 152.0 263.1 288.7 238.1 101.3 164.9 178.4 294.5 312.2 Central America América del Norte 368.5 351.4 328.5 380.0 531.7 362.7 342.2 548.0 604.3 439.1 North America América del Sur 173.6 255.8 168.2 241.7 409.7 292.2 287.7 538.9 315.6 404.2 South America Asia 1,715.7 1,346.8 1,750.7 2,124.5 2,265.8 2,291.2 2,821.3 3,753.1 3,833.6 3,245.0 Asia Australia y el Pacífico 89.4 167.9 148.1 282.9 313.7 264.5 428.5 276.5 238.3 229.9 Australia and the Pacific Caribe 1,037.3 1,225.1 1,340.5 1,432.7 1,699.5 1,209.5 881.3 775.3 689.7 725.8 Caribbean Europa 6,038.0 6,197.2 6,250.9 8,693.8 11,058.5 12,595.5 14,583.7 12,735.8 10,963.8 12,118.7 Europe
Importaciones registradas 38,897.6 38,905.2 42,630.2 45,265.8 44,928.3 40,651.0 40,810.1 44,670.6 46,574.6 45,038.7 Recorded imports
Estados Unidos 17,596.2 19,133.7 21,502.9 22,662.4 21,322.1 19,069.1 20,895.5 20,579.1 19,837.1 20,454.9 United StatesIslas Vírgenes 938.1 1,264.7 1,486.1 1,377.5 1,575.2 1,608.1 1,573.4 2,015.0 1,775.1 8.8 Virgin IslandsPaíses extranjeros 20,363.4 18,506.7 19,641.3 21,225.9 22,031.0 19,973.8 18,341.2 22,076.5 24,962.4 24,575.0 Foreign countries Africa 164.6 300.5 945.3 1,513.9 2,407.0 595.5 267.8 237.9 826.1 517.6 Africa América Central 224.0 239.7 267.1 310.3 332.3 299.5 262.3 255.9 273.5 260.3 Central America América del Norte 645.2 500.3 626.3 620.7 808.9 698.3 640.3 1,066.4 1,055.8 1,339.3 North America América del Sur 1,578.4 2,169.6 1,670.3 1,715.1 1,889.4 1,312.7 1,303.6 985.7 2,062.3 2,014.0 South America Asia 3,712.6 3,417.2 3,424.8 3,355.0 3,565.9 4,516.6 5,053.3 6,379.2 7,263.2 7,391.5 Asia Australia y el Pacífico 17.1 24.1 44.7 32.0 35.3 41.3 38.8 33.1 62.1 32.1 Australia and the Pacific Caribe 984.2 1,075.2 1,105.7 975.7 1,148.4 1,181.8 1,342.9 1,704.9 930.7 1,230.1 Caribbean Europa 13,037.4 10,780.1 11,557.0 12,703.3 11,843.7 11,328.1 9,432.3 11,413.4 12,488.6 11,790.1 Europe
(Continúa - Continue)

Junta de Planifi cación Planning Board
Estadísticas Seleccionadas del Comercio Exterior de Puerto Rico 2013 Selected Statistics on Puerto Rico’s External Trade 2013
9
TABLA 2 - BALANCE COMERCIAL POR REGION GEOGRAFICA TOTAL: AÑOS FISCALES (CONT.)TABLE 2 - TRADE BALANCE BY TOTAL GEOGRAPHIC REGION: FISCAL YEARS (CONT.)(En millones de dólares - In millions of dollars)
2004 2005 2006 2007 2008 2009 2010 2011 2012 2013
Balance comercial 16,182.6 17,638.0 17,488.4 14,745.0 19,025.3 20,155.6 20,847.1 20,205.3 12,339.5 17,358.2 Trade balance
Estados Unidos 27,822.6 27,569.3 28,148.9 23,661.6 25,940.1 24,474.8 21,093.6 25,293.6 21,960.9 24,210.9 United StatesIslas Vírgenes (851.1) (1,149.8) (1,301.6) (1,205.4) (1,433.3) (1,486.3) (1,431.3) (1,834.4) (1,612.2) 224.0 Virgin IslandsPaíses extranjeros (10,788.8) (8,781.4) (9,358.9) (7,711.1) (5,481.5) (2,832.9) 1,184.7 (3,253.9) (8,009.2) (7,076.8) Foreign countries Africa (104.6) (271.3) (912.8) (1,443.3) (2,374.6) (571.5) (251.4) (221.4) (812.7) (494.3) Africa América Central (132.1) (87.7) (4.0) (21.6) (94.2) (198.2) (97.4) (77.4) 21.1 51.9 Central America América del Norte (276.7) (148.9) (297.9) (240.7) (277.2) (335.6) (298.1) (518.4) (451.6) (900.2) North America América del Sur (1,404.8) (1,913.8) (1,502.1) (1,473.4) (1,479.8) (1,020.5) (1,015.9) (446.8) (1,746.7) (1,609.8) South America Asia (1,996.8) (2,070.4) (1,674.1) (1,230.5) (1,300.1) (2,225.4) (2,232.0) (2,626.1) (3,429.7) (4,146.5) Asia Australia y el Pacífico 72.3 143.8 103.4 250.9 278.4 223.1 389.7 243.4 176.2 197.8 Australia and the Pacific Caribe 53.2 149.9 234.8 457.0 551.1 27.7 (461.6) (929.5) (241.0) (504.3) Caribbean Europa (6,999.4) (4,583.0) (5,306.1) (4,009.5) (785.2) 1,267.4 5,151.4 1,322.4 (1,524.8) 328.6 Europe
( ) Cifras negativas. ( ) Negative figures.
Fuente: Junta de Planificación, Programa de Planificación Económica y Social, Source: Puerto Rico Planning Board, Program of Economic and Social Planning, Subprograma de Análisis Económico. Subprogram of Economic Analysis.

Junta de Planifi cación Planning Board
Estadísticas Seleccionadas del Comercio Exterior de Puerto Rico 2013 Selected Statistics on Puerto Rico’s External Trade 2013
10
TABLA 3 - BALANCE COMERCIAL POR REGION GEOGRAFICA Y PAIS: AÑOS FISCALES TABLE 3 - TRADE BALANCE BY GEOGRAPHIC REGION AND COUNTRY: FISCAL YEARS(En dólares - In dollars)
2012 2013Balance Balance
Exportaciones Importaciones Comercial Exportaciones Importaciones Comercial(Exports) (Imports) (Trade Balance) (Exports) (Imports) (Trade Balance)
Total 58,914,110,415 46,574,609,853 12,339,500,562 62,396,869,044 45,038,703,766 17,358,165,278 Total
Estados Unidos 41,798,043,761 19,837,137,010 21,960,906,751 44,665,838,116 20,454,933,566 24,210,904,550 United StatesIslas Vírgenes 162,923,197 1,775,083,609 (1,612,160,412) 232,808,247 8,797,056 224,011,191 Virgin IslandsPaíses extranjeros 16,953,143,457 24,962,389,234 (8,009,245,777) 17,498,222,681 24,574,973,144 (7,076,750,463) Foreign countries
Africa 13,421,555 826,142,399 (812,720,844) 23,360,431 517,624,599 (494,264,168) Africa
Angola 371,727 0 371,727 0 0 0 Angola Argelia 13,602 0 13,602 0 0 0 Algeria Burundi 149,029 0 149,029 0 0 0 Burundi Camerún 0 77,557,491 (77,557,491) 0 40,452,036 (40,452,036) Cameroon Chad 0 267,976,783 (267,976,783) 0 137,926,382 (137,926,382) Chad Congo 0 304,729,194 (304,729,194) 0 173,116,656 (173,116,656) Congo Congo, Rep. Democrática Congo, Democratic Rep. del (antigua Zaire) 6,460 1,734,430 (1,727,970) 23,283 1,924,315 (1,901,032) of the (former Zaire) Côte d'Ivoire Côte d'Ivoire (Costa de Marfil) 7,100 23,960,137 (23,953,037) 25,000 22,670,268 (22,645,268) (Ivory Coast) Egipto 5,999,265 432,424 5,566,841 10,647,965 301,493 10,346,472 Egypt Etiopía 0 486,907 (486,907) 0 671,655 (671,655) Ethiopia Gabón 0 0 0 0 34,899,575 (34,899,575) Gabon Ghana 0 0 0 8,590 0 8,590 Ghana Guinea Ecuatorial 0 15,083,303 (15,083,303) 0 1,551,395 (1,551,395) Equatorial Guinea
(Continúa - Continue)

Junta de Planifi cación Planning Board
Estadísticas Seleccionadas del Comercio Exterior de Puerto Rico 2013 Selected Statistics on Puerto Rico’s External Trade 2013
11
TABLA 3 - BALANCE COMERCIAL POR REGION GEOGRAFICA Y PAIS: AÑOS FISCALES (CONT.)TABLE 3 - TRADE BALANCE BY GEOGRAPHIC REGION AND COUNTRY: FISCAL YEARS (CONT.)(En dólares - In dollars)
2012 2013Balance Balance
Exportaciones Importaciones Comercial Exportaciones Importaciones Comercial(Exports) (Imports) (Trade Balance) (Exports) (Imports) (Trade Balance)
Kenya 83,984 176,071 (92,087) 122,881 61,458 61,423 Kenya Liberia 905,135 0 905,135 0 0 0 Liberia Libia 412,507 0 412,507 682,856 1,578,610 (895,754) Libya Madagascar 0 282,184 (282,184) 0 6,686 (6,686) Madagascar Malawi 0 1,330,084 (1,330,084) 0 159,845 (159,845) Malawi Mali 3,551 14,172 (10,621) 0 0 0 Mali Marruecos 224,798 748,679 (523,881) 59,390 712,313 (652,923) Morocco Mauricio 0 3,377,730 (3,377,730) 0 0 0 Mauritius Mayote 0 0 0 9,283 0 9,283 Mayotte Mozambique 22,977 0 22,977 3,960 0 3,960 Mozambique Namibia 22,625 0 22,625 0 14,420 (14,420) Namibia Nigeria 19,225 110,357,482 (110,338,257) 2,436,715 98,615,919 (96,179,204) Nigeria Santa Helena 0 0 0 2,595 0 2,595 Saint Helena Santo Tomé y Príncipe 2,750 0 2,750 0 0 0 Sao Tome and Principe Seychelles 0 3,450 (3,450) 0 13,550 (13,550) Seychelles Sierra Leona 0 0 0 9,489 0 9,489 Sierra Leone Sudáfrica, Rep. de 3,783,578 17,489,618 (13,706,040) 6,973,453 2,445,402 4,528,051 South Africa, Rep. of Swazilandia 217,756 192,800 24,956 154,104 8,397 145,707 Swaziland Tanzanía 0 156,691 (156,691) 0 357,509 (357,509) Tanzania Territorios Británicos British Indian del Océano Indico 59,840 0 59,840 15,489 0 15,489 Ocean Territories Togo 0 0 0 0 0 0 Togo Túnez 1,112,655 52,769 1,059,886 2,185,378 136,715 2,048,663 Tunisia Uganda 2,991 0 2,991 0 0 0 Uganda
(Continúa - Continue)
Junta de Planifi cación Planning Board
Estadísticas Seleccionadas del Comercio Exterior de Puerto Rico 2013 Selected Statistics on Puerto Rico’s External Trade 2013
12
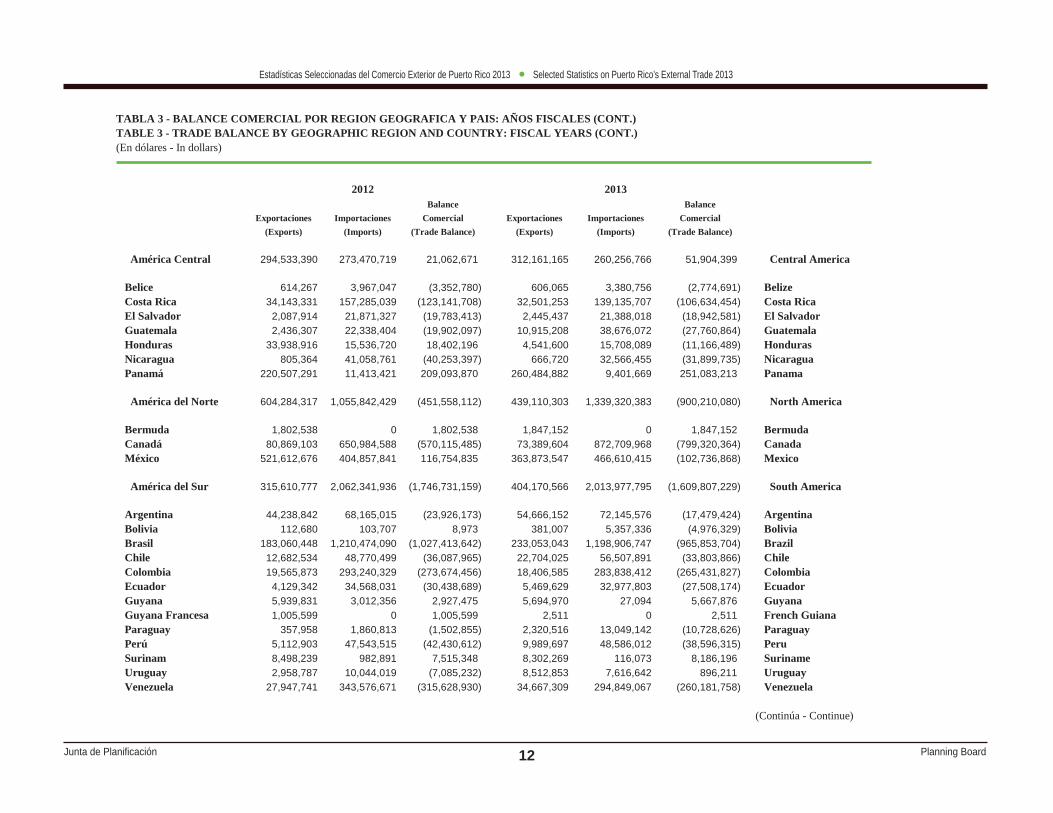
TABLA 3 - BALANCE COMERCIAL POR REGION GEOGRAFICA Y PAIS: AÑOS FISCALES (CONT.)TABLE 3 - TRADE BALANCE BY GEOGRAPHIC REGION AND COUNTRY: FISCAL YEARS (CONT.)(En dólares - In dollars)
2012 2013Balance Balance
Exportaciones Importaciones Comercial Exportaciones Importaciones Comercial(Exports) (Imports) (Trade Balance) (Exports) (Imports) (Trade Balance)
América Central 294,533,390 273,470,719 21,062,671 312,161,165 260,256,766 51,904,399 Central America
Belice 614,267 3,967,047 (3,352,780) 606,065 3,380,756 (2,774,691) Belize Costa Rica 34,143,331 157,285,039 (123,141,708) 32,501,253 139,135,707 (106,634,454) Costa Rica El Salvador 2,087,914 21,871,327 (19,783,413) 2,445,437 21,388,018 (18,942,581) El Salvador Guatemala 2,436,307 22,338,404 (19,902,097) 10,915,208 38,676,072 (27,760,864) Guatemala Honduras 33,938,916 15,536,720 18,402,196 4,541,600 15,708,089 (11,166,489) Honduras Nicaragua 805,364 41,058,761 (40,253,397) 666,720 32,566,455 (31,899,735) Nicaragua Panamá 220,507,291 11,413,421 209,093,870 260,484,882 9,401,669 251,083,213 Panama
América del Norte 604,284,317 1,055,842,429 (451,558,112) 439,110,303 1,339,320,383 (900,210,080) North America
Bermuda 1,802,538 0 1,802,538 1,847,152 0 1,847,152 Bermuda Canadá 80,869,103 650,984,588 (570,115,485) 73,389,604 872,709,968 (799,320,364) Canada México 521,612,676 404,857,841 116,754,835 363,873,547 466,610,415 (102,736,868) Mexico
América del Sur 315,610,777 2,062,341,936 (1,746,731,159) 404,170,566 2,013,977,795 (1,609,807,229) South America
Argentina 44,238,842 68,165,015 (23,926,173) 54,666,152 72,145,576 (17,479,424) Argentina Bolivia 112,680 103,707 8,973 381,007 5,357,336 (4,976,329) Bolivia Brasil 183,060,448 1,210,474,090 (1,027,413,642) 233,053,043 1,198,906,747 (965,853,704) Brazil Chile 12,682,534 48,770,499 (36,087,965) 22,704,025 56,507,891 (33,803,866) Chile Colombia 19,565,873 293,240,329 (273,674,456) 18,406,585 283,838,412 (265,431,827) Colombia Ecuador 4,129,342 34,568,031 (30,438,689) 5,469,629 32,977,803 (27,508,174) Ecuador Guyana 5,939,831 3,012,356 2,927,475 5,694,970 27,094 5,667,876 Guyana Guyana Francesa 1,005,599 0 1,005,599 2,511 0 2,511 French Guiana Paraguay 357,958 1,860,813 (1,502,855) 2,320,516 13,049,142 (10,728,626) Paraguay Perú 5,112,903 47,543,515 (42,430,612) 9,989,697 48,586,012 (38,596,315) Peru Surinam 8,498,239 982,891 7,515,348 8,302,269 116,073 8,186,196 Suriname Uruguay 2,958,787 10,044,019 (7,085,232) 8,512,853 7,616,642 896,211 Uruguay Venezuela 27,947,741 343,576,671 (315,628,930) 34,667,309 294,849,067 (260,181,758) Venezuela
(Continúa - Continue)

Junta de Planifi cación Planning Board
Estadísticas Seleccionadas del Comercio Exterior de Puerto Rico 2013 Selected Statistics on Puerto Rico’s External Trade 2013
13
TABLA 3 - BALANCE COMERCIAL POR REGION GEOGRAFICA Y PAIS: AÑOS FISCALES (CONT.)TABLE 3 - TRADE BALANCE BY GEOGRAPHIC REGION AND COUNTRY: FISCAL YEARS (CONT.)(En dólares - In dollars)
2012 2013Balance Balance
Exportaciones Importaciones Comercial Exportaciones Importaciones Comercial(Exports) (Imports) (Trade Balance) (Exports) (Imports) (Trade Balance)
Asia 3,833,565,036 7,263,246,869 (3,429,681,833) 3,245,002,055 7,391,537,064 (4,146,535,009) Asia
Arabia Saudita 24,064,502 181,935 23,882,567 36,313,664 115,733 36,197,931 Saudi Arabia Bahrein 9,518 0 9,518 4,545 0 4,545 Bahrain Bangladesh 191,342 1,062,411 (871,069) 215,322 1,284,611 (1,069,289) Bangladesh Birmania (Myanmar) 0 0 0 219,911 0 219,911 Burma (Myanmar) Brunei 0 0 0 60,748 0 60,748 Brunei Camboya 116,094 586,760 (470,666) 95,280 994,655 (899,375) Cambodia Cisjordania 7,510 0 7,510 25,000 0 25,000 West Bank Corea, Rep. de Korea, Republic of (Corea del Sur) 148,930,288 235,732,439 (86,802,151) 96,773,834 251,987,349 (155,213,515) (South Korea) China (Taiwán) 211,022,163 63,004,945 148,017,218 210,670,471 56,670,944 153,999,527 China (Taiwan) China, República China, People's Popular de 639,513,165 827,782,431 (188,269,266) 602,191,463 855,023,473 (252,832,010) Republic of Emiratos Arabes United Arab Unidos 12,219,604 5,424,085 6,795,519 13,606,556 93,923,518 (80,316,962) Emirates Filipinas 1,667,138 16,009,944 (14,342,806) 2,339,146 12,182,068 (9,842,922) Philippines Georgia 296,507 127,609 168,898 3,274,203 10,263 3,263,940 Georgia Hong Kong 608,945,020 5,893,264 603,051,756 459,780,484 4,376,209 455,404,275 Hong Kong India 38,886,489 201,812,406 (162,925,917) 40,628,904 173,701,357 (133,072,453) India Indonesia 10,960,927 44,319,927 (33,359,000) 4,485,692 77,737,555 (73,251,863) Indonesia Irán 344,335 0 344,335 572,256 0 572,256 Iran Iraq 215,500 0 215,500 172,282 0 172,282 Iraq Israel 17,206,926 18,501,002 (1,294,076) 19,302,361 12,462,195 6,840,166 Israel Japón 1,731,406,114 1,792,816,379 (61,410,265) 1,495,949,828 1,875,954,047 (380,004,219) Japan Jordania 183,567 53,358 130,209 349,614 2,039 347,575 Jordan
(Continúa - Continue)

Junta de Planifi cación Planning Board
Estadísticas Seleccionadas del Comercio Exterior de Puerto Rico 2013 Selected Statistics on Puerto Rico’s External Trade 2013
14
TABLA 3 - BALANCE COMERCIAL POR REGION GEOGRAFICA Y PAIS: AÑOS FISCALES (CONT.)TABLE 3 - TRADE BALANCE BY GEOGRAPHIC REGION AND COUNTRY: FISCAL YEARS (CONT.)(En dólares - In dollars)
2012 2013Balance Balance
Exportaciones Importaciones Comercial Exportaciones Importaciones Comercial(Exports) (Imports) (Trade Balance) (Exports) (Imports) (Trade Balance)
Kuwait 1,404,700 0 1,404,700 585,882 0 585,882 Kuwait Laos 0 14,935 (14,935) 0 89,536 (89,536) Laos Líbano 170,467 0 170,467 177,667 0 177,667 Lebanon Macao 60,678 327,236 (266,558) 0 428,620 (428,620) Macau Malasia 17,273,545 52,824,668 (35,551,123) 15,307,426 41,383,844 (26,076,418) Malaysia Nepal 57,090 0 57,090 110,650 11,101 99,549 Nepal Omán 872,167 462,641 409,526 21,493 3,165,622 (3,144,129) Oman Pakistán 3,346,927 3,805,533 (458,606) 4,092,312 4,910,070 (817,758) Pakistan Qatar 67,799 79,828 (12,029) 189,716 80,390 109,326 Qatar Singapur 313,629,435 3,922,743,042 (3,609,113,607) 193,982,517 3,861,604,381 (3,667,621,864) Singapore Sri Lanka 1,138,354 820,325 318,029 468,371 585,370 (116,999) Sri Lanka Tailandia 30,935,949 37,537,642 (6,601,693) 33,130,067 32,512,687 617,380 Thailand Vietnam 18,421,216 31,322,124 (12,900,908) 9,889,985 30,339,427 (20,449,442) Vietnam Yemén 0 0 0 14,405 0 14,405 Yemen
Australia y el Pacífico 238,283,546 62,062,428 176,221,118 229,854,740 32,055,743 197,798,997 Australia and the Pacific
Australia 236,306,915 25,400,232 210,906,683 226,509,906 22,672,371 203,837,535 Australia Fiji 0 14,043,742 (14,043,742) 0 8,859,323 (8,859,323) Fiji Isla Tokelau 0 128,987 (128,987) 0 0 0 Tokelau Island Islas Cocos 15,000 0 15,000 90,800 0 90,800 Cocos Island Islas Marshall 20,677 0 20,677 5,085 0 5,085 Marshall Island Kiribati 0 0 0 8,473 0 8,473 Kiribati Nueva Zelanda 1,931,654 2,171,867 (240,213) 3,240,476 524,049 2,716,427 New Zealand Papua Nueva Guinea 9,300 20,317,600 (20,308,300) 0 0 0 Papua New Guinea
(Continúa - Continue)

Junta de Planifi cación Planning Board
Estadísticas Seleccionadas del Comercio Exterior de Puerto Rico 2013 Selected Statistics on Puerto Rico’s External Trade 2013
15
TABLA 3 - BALANCE COMERCIAL POR REGION GEOGRAFICA Y PAIS: AÑOS FISCALES (CONT.)TABLE 3 - TRADE BALANCE BY GEOGRAPHIC REGION AND COUNTRY: FISCAL YEARS (CONT.)(En dólares - In dollars)
2012 2013Balance Balance
Exportaciones Importaciones Comercial Exportaciones Importaciones Comercial(Exports) (Imports) (Trade Balance) (Exports) (Imports) (Trade Balance)
Caribe 689,672,793 930,673,859 (241,001,066) 725,842,111 1,230,121,021 (504,278,910) Caribbean
Anguila 3,116,583 145,867 2,970,716 3,566,820 98,923 3,467,897 Anguilla Antigua y Barbuda 7,023,605 296,288 6,727,317 9,719,198 399,792 9,319,406 Antigua and Barbuda Aruba 19,266,846 46,516,346 (27,249,500) 13,451,917 136,521 13,315,396 Aruba Bahamas 10,757,817 9,903,953 853,864 9,957,956 45,114,521 (35,156,565) Bahamas Barbados 14,990,639 817,398 14,173,241 15,108,485 472,645 14,635,840 Barbados Cuba 107,750 0 107,750 194,950 0 194,950 Cuba Curaçao 16,041,795 17,021,851 (980,056) 14,916,066 191,269,447 (176,353,381) Curaçao Dominica 3,173,513 101,138 3,072,375 4,154,695 147,959 4,006,736 Dominica Granada 5,666,513 169,182 5,497,331 1,954,998 26,100 1,928,898 Grenada Guadalupe 10,753,044 144,995 10,608,049 6,301,290 145,587 6,155,703 Guadeloupe Haití 4,687,825 1,258,038 3,429,787 4,903,009 293,289 4,609,720 Haiti Islas Caimán 1,919,221 0 1,919,221 1,890,394 14,175 1,876,219 Cayman Islands Islas Turcas y Caicas 353,368 0 353,368 277,784 0 277,784 Turks and Caicos Islands Islas Vírgenes British Virgin Británicas 23,993,291 207,490 23,785,801 27,141,591 380,178 26,761,413 Islands Jamaica 31,556,239 3,885,775 27,670,464 32,233,630 392,928 31,840,702 Jamaica Martinica 1,180,138 297,442 882,696 4,549,345 23,783 4,525,562 Martinique Montserrat 949,520 71,004 878,516 1,390,170 57,626 1,332,544 Montserrat República Dominicana 446,933,853 568,753,999 (121,820,146) 482,475,463 514,728,173 (32,252,710) Dominican Republic San Cristóbal y Nieves 11,281,709 2,311,217 8,970,492 12,963,923 104,636 12,859,287 Saint Christopher and Nevis San Vicente y las Saint Vincent and the Granadinas 3,751,297 45,987 3,705,310 2,055,165 25,417 2,029,748 Grenadines Santa Lucía 5,201,709 528,180 4,673,529 5,136,755 39,007 5,097,748 Saint Lucia Sint Maarten 30,300,616 882,880 29,417,736 37,892,592 966,773 36,925,819 Sint Maarten Trinidad y Tabago 36,665,902 277,314,829 (240,648,927) 33,605,915 475,283,541 (441,677,626) Trinidad and Tobago
(Continúa - Continue)
Junta de Planifi cación Planning Board
Estadísticas Seleccionadas del Comercio Exterior de Puerto Rico 2013 Selected Statistics on Puerto Rico’s External Trade 2013
16
TABLA 3 - BALANCE COMERCIAL POR REGION GEOGRAFICA Y PAIS: AÑOS FISCALES (CONT.)TABLE 3 - TRADE BALANCE BY GEOGRAPHIC REGION AND COUNTRY: FISCAL YEARS (CONT.)(En dólares - In dollars)
2012 2013Balance Balance
Exportaciones Importaciones Comercial Exportaciones Importaciones Comercial(Exports) (Imports) (Trade Balance) (Exports) (Imports) (Trade Balance)
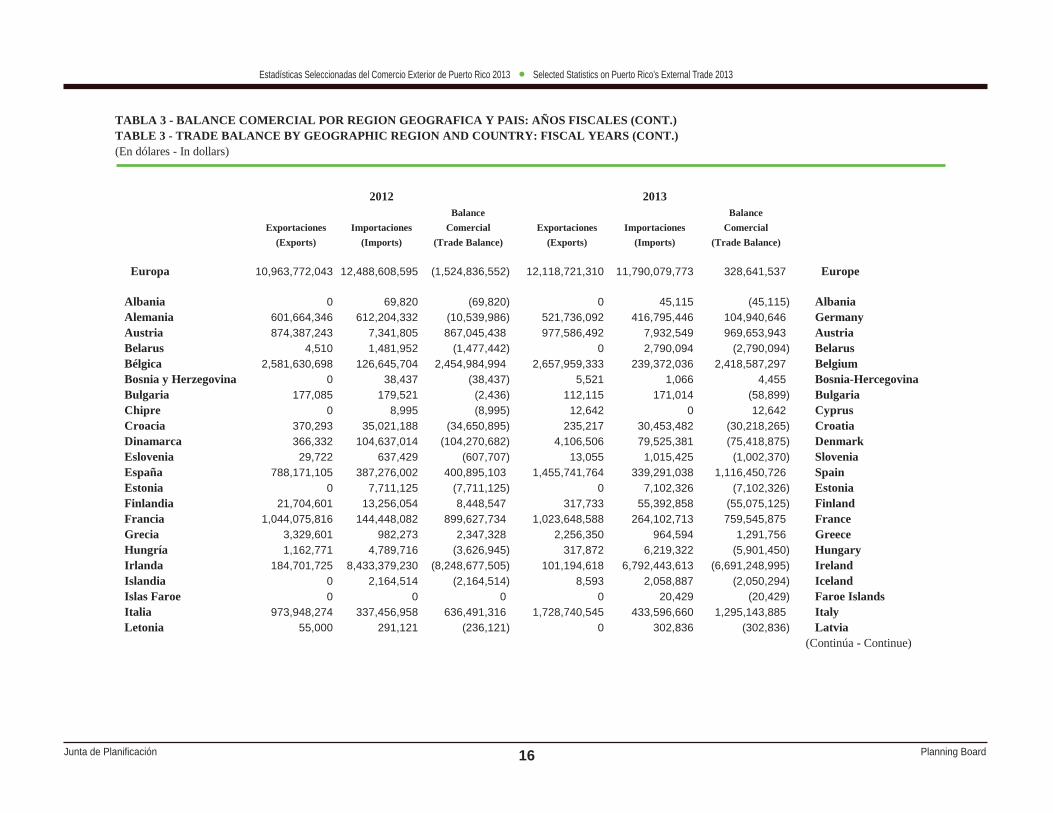
Europa 10,963,772,043 12,488,608,595 (1,524,836,552) 12,118,721,310 11,790,079,773 328,641,537 Europe
Albania 0 69,820 (69,820) 0 45,115 (45,115) Albania Alemania 601,664,346 612,204,332 (10,539,986) 521,736,092 416,795,446 104,940,646 Germany Austria 874,387,243 7,341,805 867,045,438 977,586,492 7,932,549 969,653,943 Austria Belarus 4,510 1,481,952 (1,477,442) 0 2,790,094 (2,790,094) Belarus Bélgica 2,581,630,698 126,645,704 2,454,984,994 2,657,959,333 239,372,036 2,418,587,297 Belgium Bosnia y Herzegovina 0 38,437 (38,437) 5,521 1,066 4,455 Bosnia-Hercegovina Bulgaria 177,085 179,521 (2,436) 112,115 171,014 (58,899) Bulgaria Chipre 0 8,995 (8,995) 12,642 0 12,642 Cyprus Croacia 370,293 35,021,188 (34,650,895) 235,217 30,453,482 (30,218,265) Croatia Dinamarca 366,332 104,637,014 (104,270,682) 4,106,506 79,525,381 (75,418,875) Denmark Eslovenia 29,722 637,429 (607,707) 13,055 1,015,425 (1,002,370) Slovenia España 788,171,105 387,276,002 400,895,103 1,455,741,764 339,291,038 1,116,450,726 Spain Estonia 0 7,711,125 (7,711,125) 0 7,102,326 (7,102,326) Estonia Finlandia 21,704,601 13,256,054 8,448,547 317,733 55,392,858 (55,075,125) Finland Francia 1,044,075,816 144,448,082 899,627,734 1,023,648,588 264,102,713 759,545,875 France Grecia 3,329,601 982,273 2,347,328 2,256,350 964,594 1,291,756 Greece Hungría 1,162,771 4,789,716 (3,626,945) 317,872 6,219,322 (5,901,450) Hungary Irlanda 184,701,725 8,433,379,230 (8,248,677,505) 101,194,618 6,792,443,613 (6,691,248,995) Ireland Islandia 0 2,164,514 (2,164,514) 8,593 2,058,887 (2,050,294) Iceland Islas Faroe 0 0 0 0 20,429 (20,429) Faroe Islands Italia 973,948,274 337,456,958 636,491,316 1,728,740,545 433,596,660 1,295,143,885 Italy Letonia 55,000 291,121 (236,121) 0 302,836 (302,836) Latvia
(Continúa - Continue)
Junta de Planifi cación Planning Board
Estadísticas Seleccionadas del Comercio Exterior de Puerto Rico 2013 Selected Statistics on Puerto Rico’s External Trade 2013
17
TABLA 3 - BALANCE COMERCIAL POR REGION GEOGRAFICA Y PAIS: AÑOS FISCALES (CONT.)TABLE 3 - TRADE BALANCE BY GEOGRAPHIC REGION AND COUNTRY: FISCAL YEARS (CONT.)(En dólares - In dollars)
2012 2013Balance Balance
Exportaciones Importaciones Comercial Exportaciones Importaciones Comercial(Exports) (Imports) (Trade Balance) (Exports) (Imports) (Trade Balance)
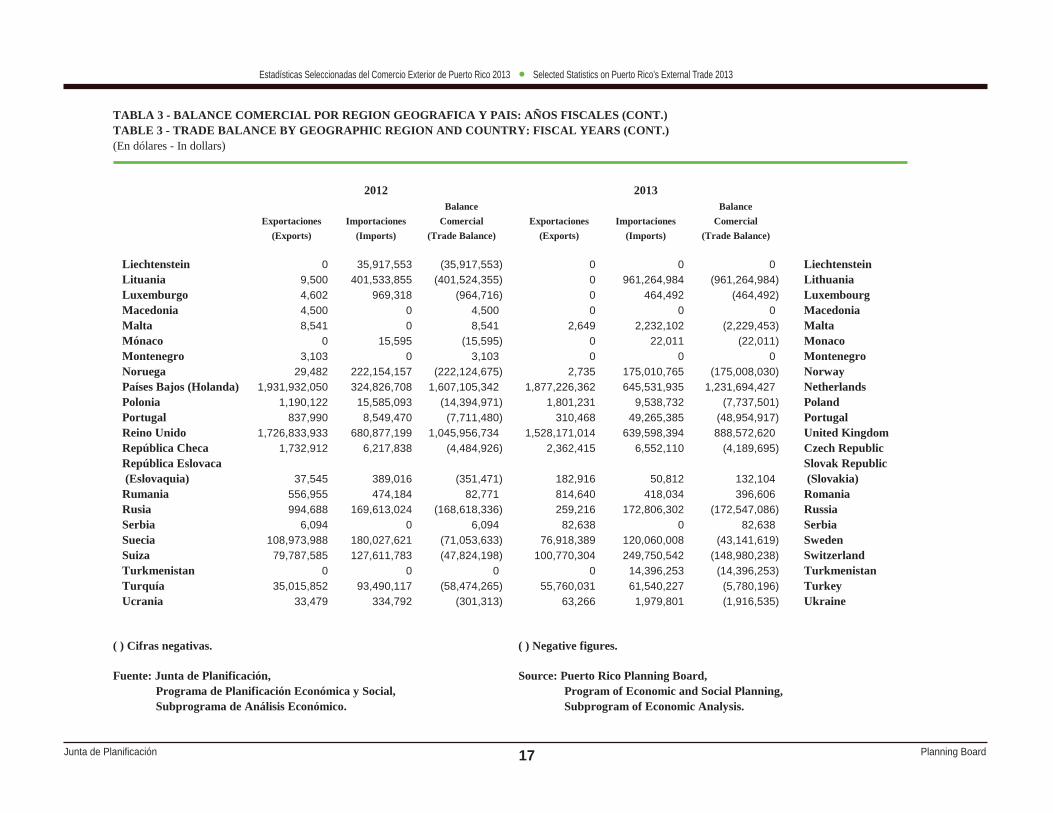
Liechtenstein 0 35,917,553 (35,917,553) 0 0 0 Liechtenstein Lituania 9,500 401,533,855 (401,524,355) 0 961,264,984 (961,264,984) Lithuania Luxemburgo 4,602 969,318 (964,716) 0 464,492 (464,492) Luxembourg Macedonia 4,500 0 4,500 0 0 0 Macedonia Malta 8,541 0 8,541 2,649 2,232,102 (2,229,453) Malta Mónaco 0 15,595 (15,595) 0 22,011 (22,011) Monaco Montenegro 3,103 0 3,103 0 0 0 Montenegro Noruega 29,482 222,154,157 (222,124,675) 2,735 175,010,765 (175,008,030) Norway Países Bajos (Holanda) 1,931,932,050 324,826,708 1,607,105,342 1,877,226,362 645,531,935 1,231,694,427 Netherlands Polonia 1,190,122 15,585,093 (14,394,971) 1,801,231 9,538,732 (7,737,501) Poland Portugal 837,990 8,549,470 (7,711,480) 310,468 49,265,385 (48,954,917) Portugal Reino Unido 1,726,833,933 680,877,199 1,045,956,734 1,528,171,014 639,598,394 888,572,620 United Kingdom República Checa 1,732,912 6,217,838 (4,484,926) 2,362,415 6,552,110 (4,189,695) Czech Republic República Eslovaca Slovak Republic (Eslovaquia) 37,545 389,016 (351,471) 182,916 50,812 132,104 (Slovakia) Rumania 556,955 474,184 82,771 814,640 418,034 396,606 Romania Rusia 994,688 169,613,024 (168,618,336) 259,216 172,806,302 (172,547,086) Russia Serbia 6,094 0 6,094 82,638 0 82,638 Serbia Suecia 108,973,988 180,027,621 (71,053,633) 76,918,389 120,060,008 (43,141,619) Sweden Suiza 79,787,585 127,611,783 (47,824,198) 100,770,304 249,750,542 (148,980,238) Switzerland Turkmenistan 0 0 0 0 14,396,253 (14,396,253) Turkmenistan Turquía 35,015,852 93,490,117 (58,474,265) 55,760,031 61,540,227 (5,780,196) Turkey Ucrania 33,479 334,792 (301,313) 63,266 1,979,801 (1,916,535) Ukraine
( ) Cifras negativas. ( ) Negative figures.
Fuente: Junta de Planificación, Source: Puerto Rico Planning Board, Programa de Planificación Económica y Social, Program of Economic and Social Planning, Subprograma de Análisis Económico. Subprogram of Economic Analysis.

Junta de Planifi cación Planning Board
Estadísticas Seleccionadas del Comercio Exterior de Puerto Rico 2013 Selected Statistics on Puerto Rico’s External Trade 2013
18
TABLA 4 - EXPORTACIONES E IMPORTACIONES: PAISES MAS IMPORTANTES *: AÑOS FISCALESTABLE 4 - EXPORTS AND IMPORTS: MAIN COUNTRIES *: FISCAL YEARS(En millones de dólares - In millions of dollars)
2004 2005 2006 2007 2008 2009 2010 2011 2012 2013
Exportaciones registradas, total 55,080.2 56,543.2 60,118.7 60,010.8 63,953.6 60,806.6 61,657.2 64,876.0 58,914.1 62,396.9 Recorded exports, total
Estados Unidos 45,418.7 46,703.0 49,651.8 46,324.0 47,262.3 43,543.9 41,989.2 45,872.7 41,798.0 44,665.8 United StatesBélgica 1,276.7 1,335.5 1,464.1 2,013.9 2,588.1 2,283.5 2,251.2 2,869.4 2,581.6 2,658.0 BelgiumPaíses Bajos (Holanda) 1,777.4 1,800.6 2,356.7 2,763.8 2,587.1 2,678.1 2,878.3 2,488.9 1,931.9 1,877.2 NetherlandsItalia 340.9 414.9 216.3 90.7 209.7 206.3 345.5 721.2 973.9 1,728.7 ItalyReino Unido 461.0 749.2 693.8 935.0 489.9 518.4 1,095.6 1,257.0 1,726.8 1,528.2 United KingdomJapón 298.8 303.9 458.3 526.6 688.0 784.4 878.4 1,121.8 1,731.4 1,495.9 JapanEspaña 92.5 114.2 70.2 353.6 1,198.5 1,876.8 1,201.1 1,552.8 788.2 1,455.7 SpainFrancia 717.4 693.5 410.2 358.8 459.7 775.6 917.3 1,079.7 1,044.1 1,023.6 FranceAustria 0.8 0.8 1.2 1.2 106.4 0.7 600.9 395.4 874.4 977.6 AustriaChina, República Popular de 79.7 53.7 73.7 129.7 261.2 127.3 412.3 669.5 639.5 602.2 China, People's Republic of
Subtotal 50,463.8 52,169.4 55,396.2 53,497.3 55,851.0 52,795.1 52,569.6 58,028.2 54,089.9 58,013.1 Subtotal Por ciento 91.6 92.3 92.1 89.1 87.3 86.8 85.3 89.4 91.8 93.0 Per cent
Importaciones registradas, total 38,897.6 38,905.2 42,630.2 45,265.8 44,928.3 40,651.0 40,810.1 44,670.6 46,574.6 45,038.7 Recorded imports, total
Estados Unidos 17,596.2 19,133.7 21,502.9 22,662.4 21,322.1 19,069.1 20,895.5 20,579.1 19,837.1 20,454.9 United StatesIrlanda 9,928.1 7,716.8 7,950.2 9,492.6 8,352.9 8,185.7 6,316.9 8,011.8 8,433.4 6,792.4 IrelandSingapur 1,241.1 956.7 592.7 612.2 720.5 1,588.8 1,929.2 2,839.4 3,922.7 3,861.6 SingaporeJapón 1,639.2 1,544.8 1,834.9 1,661.3 1,642.9 1,541.7 1,742.3 2,101.1 1,792.8 1,876.0 JapanBrasil 480.0 689.9 676.4 672.9 747.1 392.1 482.8 406.3 1,210.5 1,198.9 BrazilLituania 0.9 20.4 23.4 25.8 54.4 77.3 162.3 349.7 401.5 961.3 LithuaniaCanadá 286.9 224.9 323.4 337.4 526.6 394.8 311.4 687.4 651.0 872.7 CanadaChina, República Popular de 401.0 434.6 566.7 644.9 672.2 755.6 691.6 807.2 827.8 855.0 China, People's Republic ofPaíses Bajos (Holanda) 157.9 215.1 241.6 204.0 277.5 171.3 146.5 356.8 324.8 645.5 NetherlandsReino Unido 651.4 524.5 513.4 409.4 325.9 531.0 616.8 508.3 680.9 639.6 United Kingdom
Subtotal 32,382.7 31,461.5 34,225.6 36,722.9 34,642.0 32,707.3 33,295.2 36,647.3 38,082.6 38,158.0 Subtotal Por ciento 83.3 80.9 80.3 81.1 77.1 80.5 81.6 82.0 81.8 84.7 Per cent
* De acuerdo al año fiscal 2013. * According to fiscal year 2013.
Fuente: Junta de Planificación, Programa de Planificación Económica y Social, Source: Puerto Rico Planning Board, Program of Economic and Social Planning, Subprograma de Análisis Económico. Subprogram of Economic Analysis.

Junta de Planifi cación Planning Board
Estadísticas Seleccionadas del Comercio Exterior de Puerto Rico 2013 Selected Statistics on Puerto Rico’s External Trade 2013
19
TABLA 5 - IMPORTACIONES REGISTRADAS DE PAISES EXTRANJEROS POR TRATO ARANCELARIO: AÑOS FISCALESTABLE 5 - RECORDED IMPORTS FROM FOREIGN COUNTRIES BY TARIFF TREATMENT: FISCAL YEARS(En dólares - In dollars)
2004 2005 2006 2007 2008 2009 2010 2011 2012 2013
Total 20,363,354,978 18,506,725,056 19,641,276,573 21,225,939,250 22,030,961,119 19,973,804,706 18,341,223,893 22,076,529,672 24,962,389,234 24,574,973,144 Total
Nación Más Favorecida 7,575,479,034 7,896,871,854 8,560,978,658 8,275,733,741 8,459,797,690 7,732,662,794 7,662,793,534 8,631,114,985 10,877,354,888 12,316,446,650 Most Favored Nation
Especial 12,787,875,944 10,609,853,202 11,080,297,915 12,950,205,509 13,571,163,429 12,241,141,912 10,678,430,359 13,445,414,687 14,085,034,346 12,258,526,494 Special Acuerdo de Comercio en Agreement on Trade in Aeronave Civil 0 100,225,177 100,530,246 210,163 2,044,602 90,616 0 0 26,558 79,463 Civil Aircraft Acuerdo de Comercio en Agreement on Trade in Productos Farmacéuticos 11,248,058,042 8,834,481,126 9,646,358,778 10,721,248,548 10,166,789,889 10,986,309,962 9,669,844,752 12,144,562,611 12,549,230,824 10,183,937,229 Pharmaceutical Products Acuerdo de Libre Comercio United States - Australia Estados Unidos - Australia 0 0 4,662,733 6,293,444 9,908,896 3,050,903 1,307,703 1,656,777 1,068,621 5,307,542 Free Trade Agreement Acuerdo de Libre Comercio United States - Chile Estados Unidos - Chile 11,665,769 613,052 9,621,451 46,034,875 35,450,965 20,341,874 34,276,382 64,991,967 33,130,037 40,768,964 Free Trade Agreement Acuerdo de Libre Comercio United States - Morocco Estados Unidos - Marruecos 0 0 11,374 302,835 286,504 127,549 80,574 42,813 42,063 4,110 Free Trade Agreement Acuerdo de Libre Comercio United States - Dominican Estados Unidos - República Republic-Central America Dominicana-América Central 0 0 3,412,498 153,802,179 375,137,837 330,906,912 343,778,293 362,113,019 371,976,428 372,982,021 Free Trade Agreement Acuerdo de Libre Comercio United States - Singapore Estados Unidos - Singapur 347,547 72,066 1,715,345 762,756 35,876,943 1,306,243 2,305,175 5,218,927 5,412,580 3,523,884 Free Trade Agreement Area de Libre Comercio United States - Israel Estados Unidos - Israel 4,762,581 5,294,049 6,877,029 7,594,169 8,165,799 26,144,864 10,248,491 9,176,133 9,795,180 8,395,912 Free Trade Area Código de trato libre de impuestos Duty-Free treatment code for para productos de Cisjordania, products of the West Bank, Franja de Gaza o de una zona Gaza Strip, or a Qualifying industrial 0 0 148,646 177,451 4,028,315 194,400 174,501 2,434,420 325,939 72,838 Industrial Zone Concesiones de la Ronda de Uruguay Round Concessions Uruguay sobre Químicos o on Intermediate Chemicals Tintes Intermediarios 186,520 0 0 22,028 18,744 3,603 3,200 0 0 51,530 or Dyes Ley de Comercio en Productos Automotive Products Automotrices 3,201 43,475 36,206 2,504 2,800 2,782 0 0 0 Trade Act Ley de Crecimiento y Oportunidad African Growth and de Africa 78,790,306 75,738,135 231,612,309 1,018,290,961 2,050,063,608 169,096,811 23,299,932 19,403,537 113,655,872 102,332,542 Opportunity Act
(Continúa - Continue)

Junta de Planifi cación Planning Board
Estadísticas Seleccionadas del Comercio Exterior de Puerto Rico 2013 Selected Statistics on Puerto Rico’s External Trade 2013
20
TABLA 5 - IMPORTACIONES REGISTRADAS DE PAISES EXTRANJEROS POR TRATO ARANCELARIO: AÑOS FISCALES (CONT.)TABLE 5 - RECORDED IMPORTS FROM FOREIGN COUNTRIES BY TARIFF TREATMENT: FISCAL YEARS (CONT.)(En dólares - In dollars)
2004 2005 2006 2007 2008 2009 2010 2011 2012 2013
Ley de Implementación del United States - Colombia Acuerdo de Promoción Comercial Trade Promotion Agreement Estados Unidos - Colombia 0 0 0 0 0 0 0 0 13,230,589 55,783,515 Implementation Act Ley de Implementación del United States - Panama Acuerdo de Promoción Comercial Trade Promotion Agreement Estados Unidos - Panamá 0 0 0 0 0 0 0 0 0 1,128,534 Implementation Act Ley de Implementación del United States - Peru Acuerdo de Promoción Comercial Trade Promotion Agreement Estados Unidos - Perú 0 0 0 0 0 2,626,151 17,817,699 25,518,105 23,693,950 31,153,058 Implementation Act Ley de Implementación del United States - Oman Acuerdo de Promoción de Libre Free Trade Agreement Comercio Estados Unidos - Omán 0 0 0 0 0 32,912 103,141 1,902,530 436,961 2,171,430 Implementation Act Ley de Implementación del United States - Korea Area de Libre Comercio Free Trade Area Estados Unidos - Corea 0 0 0 0 0 0 0 0 42,917,959 229,093,008 Implementation Act Ley de Implementación del United States - Jordan Area de Libre Comercio Free Trade Area Estados Unidos - Jordania 0 0 0 5,390 95,958 0 32,696 0 0 0 Implementation Act Ley de Preferencias Arancelarias Andean Trade Andinas o Ley de Promoción Preference Act or Comercial Andina y Erradicación Andean Trade Promotion de la Droga 437,825,090 675,976,930 241,429,473 216,569,260 124,761,534 124,193,752 87,873,506 53,503,719 47,732,332 24,267,909 and Drug Eradication Act Ley de Sociedad de Comercio US - Caribbean Basin Trade Estados Unidos - Cuenca del Caribe 142,738,296 139,224,316 89,444,507 42,412,030 753,460 8,159,928 2,768,238 4,142,337 6,294,575 522,337 Partnership Act Ley para la Recuperación Económica Caribbean Basin Economic de la Cuenca del Caribe 348,020,603 329,546,810 301,426,098 227,566,371 65,793,775 45,327,375 19,155,197 17,708,743 16,435,524 9,841,261 Recovery Act Sistema Generalizado de Generalized System of Preferencias 189,347,160 284,212,176 195,439,397 187,920,748 152,187,336 106,682,367 107,131,906 139,509,993 141,526,558 133,009,718 Preferences Tratado de Libre Comercio North American Free Trade de América del Norte 326,130,829 164,425,890 247,571,825 320,989,797 539,796,464 416,542,908 358,228,973 593,529,056 708,101,796 1,054,099,689 Agreement
Fuente: Junta de Planificación, Programa de Planificación Económica y Social, Source: Puerto Rico Planning Board, Program of Economic and Social Planning, Subprograma de Análisis Económico. Subprogram of Economic Analysis.

Junta de Planifi cación Planning Board
Estadísticas Seleccionadas del Comercio Exterior de Puerto Rico 2013 Selected Statistics on Puerto Rico’s External Trade 2013
21
( )SCIAN / NAICS 2004 2005 2006 2007 2008 2009 2010 2011 2012 2013
EXPORTACIONES REGISTRADAS, TOTAL 55,080.2 56,543.2 60,118.7 60,010.8 63,953.6 60,806.6 61,657.2 64,876.0 58,914.1 62,396.9 RECORDED EXPORTS, TOTAL
11 Agricultura, silvicultura, pesca y caza 40.6 39.0 40.7 37.2 45.6 38.9 50.3 41.2 52.7 58.2 Agriculture, forestry, fishing and hunting
21 Minería 2.7 5.1 21.8 3.7 5.5 13.4 54.4 17.9 11.9 28.6 Mining
31-33 Manufactura 54,601.7 56,022.9 59,542.1 59,378.1 63,229.9 60,098.4 60,056.6 62,875.2 58,164.6 61,674.2 Manufacturing311 Alimentos 2,663.8 3,626.0 3,956.2 3,751.5 4,468.2 3,597.5 3,611.3 3,980.4 3,670.4 4,080.8 Food312 Productos de bebidas y de tabaco 338.8 383.3 376.8 359.6 474.4 493.6 500.1 356.0 285.9 247.0 Beverage and tobacco products
313-314 Textiles 125.9 99.9 68.1 78.4 87.4 84.6 66.7 141.3 128.7 140.6 Textiles315 Ropa 316.9 376.1 334.3 208.2 116.5 129.4 103.4 108.6 89.2 90.0 Apparel316 Cuero y productos afines 101.9 136.5 94.5 93.5 108.2 109.2 63.9 60.8 42.5 46.4 Leather and allied products321 Productos de madera 23.0 19.2 21.0 22.0 29.6 23.2 21.6 21.6 18.5 22.0 Wood products322 Papel 27.0 26.1 22.8 26.9 28.2 36.0 37.3 33.0 33.1 35.5 Paper323 Imprenta 15.5 13.3 23.2 23.7 20.7 20.2 15.9 12.0 9.8 12.0 Printing324 Productos de petróleo y de carbón 476.2 741.0 749.8 951.4 1,585.0 505.9 170.4 83.0 68.1 157.5 Petroleum and coal products325 Químicos 37,632.6 37,191.0 38,618.9 39,587.8 45,662.2 45,762.8 46,536.0 48,763.7 44,488.3 47,967.4 Chemicals
3254 Farmacéuticos y medicinas 35,196.7 34,712.2 35,970.3 36,567.9 42,182.7 41,983.5 42,492.7 43,224.0 40,848.0 43,887.0 Pharmaceuticals and medicines326 Productos de plástico y de goma 127.4 107.6 111.1 150.5 92.1 123.5 112.2 125.3 132.5 136.8 Plastics and rubber products327 Productos de minerales no metálicos 73.2 85.0 52.4 71.0 67.5 58.4 55.5 51.4 45.8 52.2 Nonmetallic mineral products331 Metales primarios 75.1 86.4 151.1 184.3 182.9 211.0 306.2 562.6 974.0 186.5 Primary metals332 Productos fabricados de metal 81.1 56.5 59.5 64.1 72.6 65.9 92.3 89.0 86.9 79.0 Fabricated metal products333 Maquinaria 614.6 708.9 786.2 712.2 635.9 557.1 639.0 743.3 729.3 799.9 Machinery334 Productos de computadora y electrónicos 7,145.9 7,090.9 7,452.1 6,885.0 4,083.5 3,197.2 2,511.1 2,005.4 1,575.1 1,481.4 Computer and electronic products
3341 Computadoras y equipo periférico 4,969.8 4,144.8 3,838.6 4,023.0 2,274.0 1,596.6 962.6 815.0 440.5 433.2 Computers and peripheral equipment335 Equipos eléctricos, enseres Electrical equipment, appliance,
y componentes 1,213.2 1,123.3 1,362.6 1,281.4 1,558.3 1,241.7 876.9 872.2 1,023.9 1,064.4 and component336 Equipo de transportación 292.9 134.3 129.7 132.4 138.1 168.4 233.6 283.6 237.4 272.2 Transportation equipment337 Muebles y productos relacionados 10.2 6.9 7.4 5.6 8.9 11.3 7.5 7.9 7.7 9.4 Furniture and related products339 Manufactura miscelánea 3,246.5 4,010.7 5,164.4 4,788.6 3,809.7 3,701.8 4,095.8 4,574.2 4,517.4 4,793.1 Miscellaneous manufacturing
3391 Equipos y materiales de uso médico 3,165.6 3,913.2 4,993.8 4,675.2 3,732.6 3,649.6 4,053.1 4,539.9 4,481.6 4,758.7 Medical equipment and supplies
Otros sectores (1) 435.2 476.2 514.1 591.8 672.6 655.8 1,495.9 1,941.7 684.9 635.8 Other sectors (1)
(1) Incluye servicios de reparación y mercancía no clasificada. (1) Includes repair services and merchandise not classified.Nota: La clasificación de mercancía registrada de acuerdo al Sistema de Clasificación Industrial Note: The classification of recorded merchandise according to the North American Industrial de América del Norte no equivale necesariamente a la Clasificación Industrial Uniforme. Classification System does not necessarily equals the Standard Industrial Classification.Fuente: Junta de Planificación, Programa de Planificación Económica y Social, Source: Puerto Rico Planning Board, Program of Economic and Social Planning, Subprograma de Análisis Económico. Subprogram of Economic Analysis.
TABLA 6 - EXPORTACIONES DE MERCANCIA REGISTRADA POR SISTEMA DE CLASIFICACION INDUSTRIAL DE AMERICA DEL NORTE (SCIAN): AÑOS FISCALES TABLE 6 - EXPORTS OF RECORDED MERCHANDISE BY NORTH AMERICAN INDUSTRIAL CLASSIFICATION SYSTEM (NAICS): FISCAL YEARS (En millones de dólares - In millions of dollars)

Junta de Planifi cación Planning Board
Estadísticas Seleccionadas del Comercio Exterior de Puerto Rico 2013 Selected Statistics on Puerto Rico’s External Trade 2013
22
SCIAN / NAICS 2004 2005 2006 2007 2008 2009 2010 2011 2012 2013
IMPORTACIONES REGISTRADAS,TOTAL 38,897.6 38,905.2 42,630.2 45,265.8 44,928.3 40,651.0 40,810.1 44,670.6 46,574.6 45,038.7 RECORDED IMPORTS,TOTAL
11 Agricultura, silvicultura, pesca y caza 460.9 496.3 492.4 459.6 519.2 521.7 511.3 539.6 530.7 548.5 Agriculture, forestry, fishing and hunting
21 Minería 945.9 1,347.4 1,231.0 1,510.0 2,457.3 546.1 407.4 424.1 604.8 801.7 Mining
31-33 Manufactura 36,408.6 35,921.3 39,808.4 42,259.4 40,779.0 38,605.5 38,517.3 42,250.6 44,284.8 42,356.3 Manufacturing311 Alimentos 2,052.2 2,162.7 2,380.4 2,440.6 2,627.7 2,955.6 2,987.8 3,178.5 3,385.2 3,317.1 Food312 Productos de bebidas y de tabaco 368.2 424.8 450.4 448.1 428.9 454.3 470.2 466.9 480.3 494.7 Beverage and tobacco products
313-314 Textiles 318.3 351.7 352.4 351.4 244.7 327.4 338.2 384.3 401.3 289.6 Textiles315 Ropa 570.0 602.1 653.2 604.2 541.1 554.0 501.8 508.7 563.8 629.3 Apparel316 Cuero y productos afines 234.6 266.8 313.1 289.7 279.6 278.8 241.0 297.6 266.6 296.9 Leather and allied products321 Productos de madera 155.8 152.5 143.0 137.6 124.6 120.2 104.2 121.0 117.1 114.0 Wood products322 Papel 509.9 594.7 568.9 577.2 568.8 593.5 580.2 578.7 574.1 555.2 Paper323 Imprenta 211.3 184.1 186.2 183.8 190.5 169.0 161.9 153.8 149.1 130.7 Printing324 Productos de petróleo y de carbón 2,070.0 2,924.5 3,962.1 4,152.8 5,169.8 4,714.0 4,952.5 5,738.8 6,603.4 5,872.6 Petroleum and coal products325 Químicos 19,289.3 17,086.8 19,089.0 21,675.9 19,337.5 18,146.4 18,066.1 20,022.9 20,573.5 19,496.2 Chemicals
3251 Químicos básicos 3,285.7 3,211.2 3,543.1 4,150.3 3,286.5 3,282.4 3,249.7 4,428.5 3,917.7 3,469.9 Basic chemicals3254 Farmacéuticos y medicinas 15,191.9 12,967.6 14,467.3 16,494.7 15,065.9 13,591.2 13,761.7 14,476.8 15,503.0 13,409.4 Pharmaceuticals and medicines326 Productos de plástico y de goma 547.9 613.9 698.8 773.8 859.5 911.6 911.9 1,017.3 958.1 888.8 Plastics and rubber products327 Productos de minerales no metálicos 242.6 290.3 308.2 289.6 260.3 254.3 218.0 215.6 224.3 222.4 Nonmetallic mineral products331 Metales primarios 410.2 491.3 485.8 620.0 592.3 580.6 452.6 870.3 708.2 722.9 Primary metals332 Productos fabricados de metal 492.0 481.9 690.2 626.3 527.2 461.6 413.4 442.4 507.7 486.6 Fabricated metal products333 Maquinaria 1,133.5 1,111.2 1,267.8 1,266.0 1,199.1 1,122.4 1,039.4 1,048.6 1,183.5 1,150.5 Machinery334 Productos de computadora y electrónicos 3,105.4 2,833.8 2,707.5 2,932.8 2,986.2 2,829.2 2,604.1 2,398.4 2,415.4 2,350.8 Computer and electronic products335 Equipos eléctricos, enseres Electrical equipment, appliance,
y componentes 776.4 805.6 958.8 1,052.9 1,041.7 878.0 832.0 904.5 952.3 904.4 and component336 Equipo de transportación 2,355.5 2,786.2 2,674.3 1,922.3 1,909.3 1,478.2 1,841.6 2,002.6 2,271.7 2,490.9 Transportation equipment
3361 Vehículos de motor 2,090.2 2,454.8 2,325.0 1,608.7 1,647.8 1,204.9 1,535.0 1,713.3 1,965.3 1,996.8 Motor vehicles337 Muebles y productos relacionados 275.9 300.4 290.8 296.5 284.6 264.3 248.5 249.3 253.1 298.0 Furniture and related products339 Manufactura miscelánea 1,289.6 1,456.0 1,627.5 1,617.9 1,605.6 1,512.0 1,552.0 1,650.2 1,696.3 1,644.7 Miscellaneous manufacturing
Otros sectores (1) 1,082.2 1,140.2 1,098.4 1,036.8 1,172.8 977.6 1,374.1 1,456.3 1,154.4 1,332.3 Other sectors (1)
(1) Incluye servicios de reparación y mercancía no clasificada. (1) Includes repair services and merchandise not classified.Nota: La clasificación de mercancía registrada de acuerdo al Sistema de Clasificación Industrial Note: The classification of recorded merchandise according to the North American Industrial de América del Norte no equivale necesariamente a la Clasificación Industrial Uniforme. Classification System does not necessarily equals the Standard Industrial Classification.Fuente: Junta de Planificación, Programa de Planificación Económica y Social, Source: Puerto Rico Planning Board, Program of Economic and Social Planning, Subprograma de Análisis Económico. Subprogram of Economic Analysis.
TABLA 7 - IMPORTACIONES DE MERCANCIA REGISTRADA POR SISTEMA DE CLASIFICACION INDUSTRIAL DE AMERICA DEL NORTE (SCIAN): AÑOS FISCALES TABLE 7 - IMPORTS OF RECORDED MERCHANDISE BY NORTH AMERICAN INDUSTRIAL CLASSIFICATION SYSTEM (NAICS): FISCAL YEARS (En millones de dólares - In millions of dollars)
Junta de Planifi cación Planning Board
Estadísticas Seleccionadas del Comercio Exterior de Puerto Rico 2013 Selected Statistics on Puerto Rico’s External Trade 2013
23
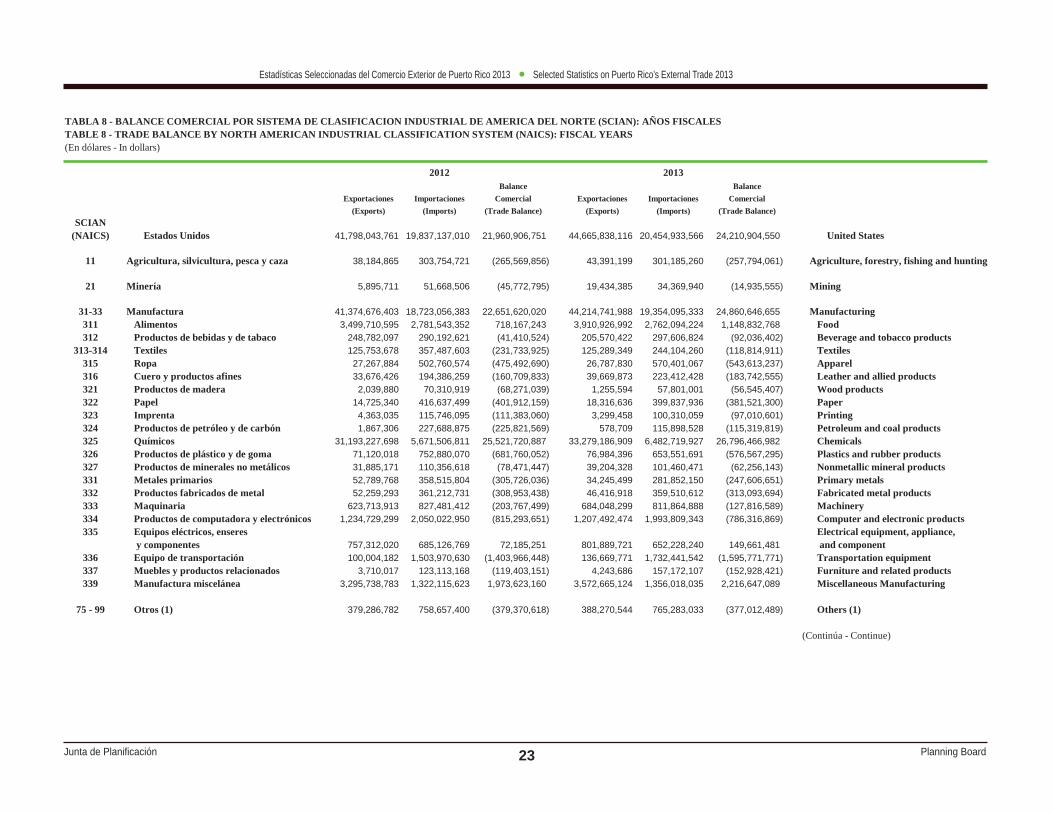
TABLA 8 - BALANCE COMERCIAL POR SISTEMA DE CLASIFICACION INDUSTRIAL DE AMERICA DEL NORTE (SCIAN): AÑOS FISCALESTABLE 8 - TRADE BALANCE BY NORTH AMERICAN INDUSTRIAL CLASSIFICATION SYSTEM (NAICS): FISCAL YEARS(En dólares - In dollars)
2012 2013Balance Balance
Exportaciones Importaciones Comercial Exportaciones Importaciones Comercial(Exports) (Imports) (Trade Balance) (Exports) (Imports) (Trade Balance)
SCIAN(NAICS) Estados Unidos 41,798,043,761 19,837,137,010 21,960,906,751 44,665,838,116 20,454,933,566 24,210,904,550 United States
11 Agricultura, silvicultura, pesca y caza 38,184,865 303,754,721 (265,569,856) 43,391,199 301,185,260 (257,794,061) Agriculture, forestry, fishing and hunting
21 Minería 5,895,711 51,668,506 (45,772,795) 19,434,385 34,369,940 (14,935,555) Mining
31-33 Manufactura 41,374,676,403 18,723,056,383 22,651,620,020 44,214,741,988 19,354,095,333 24,860,646,655 Manufacturing311 Alimentos 3,499,710,595 2,781,543,352 718,167,243 3,910,926,992 2,762,094,224 1,148,832,768 Food312 Productos de bebidas y de tabaco 248,782,097 290,192,621 (41,410,524) 205,570,422 297,606,824 (92,036,402) Beverage and tobacco products
313-314 Textiles 125,753,678 357,487,603 (231,733,925) 125,289,349 244,104,260 (118,814,911) Textiles315 Ropa 27,267,884 502,760,574 (475,492,690) 26,787,830 570,401,067 (543,613,237) Apparel316 Cuero y productos afines 33,676,426 194,386,259 (160,709,833) 39,669,873 223,412,428 (183,742,555) Leather and allied products321 Productos de madera 2,039,880 70,310,919 (68,271,039) 1,255,594 57,801,001 (56,545,407) Wood products322 Papel 14,725,340 416,637,499 (401,912,159) 18,316,636 399,837,936 (381,521,300) Paper323 Imprenta 4,363,035 115,746,095 (111,383,060) 3,299,458 100,310,059 (97,010,601) Printing324 Productos de petróleo y de carbón 1,867,306 227,688,875 (225,821,569) 578,709 115,898,528 (115,319,819) Petroleum and coal products325 Químicos 31,193,227,698 5,671,506,811 25,521,720,887 33,279,186,909 6,482,719,927 26,796,466,982 Chemicals326 Productos de plástico y de goma 71,120,018 752,880,070 (681,760,052) 76,984,396 653,551,691 (576,567,295) Plastics and rubber products327 Productos de minerales no metálicos 31,885,171 110,356,618 (78,471,447) 39,204,328 101,460,471 (62,256,143) Nonmetallic mineral products331 Metales primarios 52,789,768 358,515,804 (305,726,036) 34,245,499 281,852,150 (247,606,651) Primary metals332 Productos fabricados de metal 52,259,293 361,212,731 (308,953,438) 46,416,918 359,510,612 (313,093,694) Fabricated metal products333 Maquinaria 623,713,913 827,481,412 (203,767,499) 684,048,299 811,864,888 (127,816,589) Machinery334 Productos de computadora y electrónicos 1,234,729,299 2,050,022,950 (815,293,651) 1,207,492,474 1,993,809,343 (786,316,869) Computer and electronic products335 Equipos eléctricos, enseres Electrical equipment, appliance,
y componentes 757,312,020 685,126,769 72,185,251 801,889,721 652,228,240 149,661,481 and component336 Equipo de transportación 100,004,182 1,503,970,630 (1,403,966,448) 136,669,771 1,732,441,542 (1,595,771,771) Transportation equipment337 Muebles y productos relacionados 3,710,017 123,113,168 (119,403,151) 4,243,686 157,172,107 (152,928,421) Furniture and related products339 Manufactura miscelánea 3,295,738,783 1,322,115,623 1,973,623,160 3,572,665,124 1,356,018,035 2,216,647,089 Miscellaneous Manufacturing
75 - 99 Otros (1) 379,286,782 758,657,400 (379,370,618) 388,270,544 765,283,033 (377,012,489) Others (1)
(Continúa - Continue)

Junta de Planifi cación Planning Board
Estadísticas Seleccionadas del Comercio Exterior de Puerto Rico 2013 Selected Statistics on Puerto Rico’s External Trade 2013
24
TABLA 8 - BALANCE COMERCIAL POR SISTEMA DE CLASIFICACION INDUSTRIAL DE AMERICA DEL NORTE (SCIAN): AÑOS FISCALES (CONT.)TABLE 8 - TRADE BALANCE BY NORTH AMERICAN INDUSTRIAL CLASSIFICATION SYSTEM (NAICS): FISCAL YEARS (CONT.)(En dólares - In dollars)
2012 2013Balance Balance
Exportaciones Importaciones Comercial Exportaciones Importaciones Comercial(Exports) (Imports) (Trade Balance) (Exports) (Imports) (Trade Balance)
SCIAN(NAICS) Países extranjeros 16,953,143,457 24,962,389,234 (8,009,245,777) 17,498,222,681 24,574,973,144 (7,076,750,463) Foreign countries
11 Agricultura, silvicultura, pesca y caza 12,923,236 226,929,266 (214,006,030) 14,304,437 247,267,810 (232,963,373) Agriculture, forestry, fishing and hunting
21 Minería 2,274,738 553,101,255 (550,826,517) 4,441,252 767,302,371 (762,861,119) Mining
31-33 Manufactura 16,632,599,878 23,791,995,770 (7,159,395,892) 17,232,426,546 22,998,692,027 (5,766,265,481) Manufacturing311 Alimentos 151,697,358 603,654,773 (451,957,415) 151,497,011 555,008,437 (403,511,426) Food312 Productos de bebidas y de tabaco 35,176,888 190,094,198 (154,917,310) 39,139,060 197,094,166 (157,955,106) Beverage and tobacco products
313-314 Textiles 2,367,534 43,769,992 (41,402,458) 15,164,878 45,505,718 (30,340,840) Textiles315 Ropa 61,240,387 61,059,914 180,473 62,821,391 58,881,435 3,939,956 Apparel316 Cuero y productos afines 3,321,417 72,202,565 (68,881,148) 1,528,050 73,437,759 (71,909,709) Leather and allied products321 Productos de madera 10,030,256 46,773,768 (36,743,512) 12,374,843 56,180,729 (43,805,886) Wood products322 Papel 17,775,520 157,504,486 (139,728,966) 15,648,055 155,333,785 (139,685,730) Paper323 Imprenta 5,327,736 33,311,626 (27,983,890) 8,382,125 30,346,068 (21,963,943) Printing324 Productos de petróleo y de carbón 64,289,190 4,607,291,340 (4,543,002,150) 52,690,132 5,753,366,656 (5,700,676,524) Petroleum and coal products325 Químicos 13,264,323,031 14,900,874,096 (1,636,551,065) 14,668,233,569 13,013,443,329 1,654,790,240 Chemicals326 Productos de plástico y de goma 56,811,944 205,211,511 (148,399,567) 57,856,882 235,245,544 (177,388,662) Plastics and rubber products327 Productos de minerales no metálicos 9,186,491 113,924,681 (104,738,190) 7,296,977 120,917,302 (113,620,325) Nonmetallic mineral products331 Metales primarios 916,636,353 349,660,366 566,975,987 148,755,923 441,080,588 (292,324,665) Primary metals332 Productos fabricados de metal 23,602,487 146,438,352 (122,835,865) 28,186,115 127,011,311 (98,825,196) Fabricated metal products333 Maquinaria 92,477,666 355,952,104 (263,474,438) 107,700,846 338,660,856 (230,960,010) Machinery334 Productos de computadora y electrónicos 337,162,957 365,367,690 (28,204,733) 266,515,304 357,002,531 (90,487,227) Computer and electronic products335 Equipos eléctricos, enseres Electrical equipment, appliance,
y componentes 254,761,800 267,116,726 (12,354,926) 257,617,691 252,186,775 5,430,916 and component336 Equipo de transportación 105,517,653 767,680,398 (662,162,745) 114,322,704 758,419,508 (644,096,804) Transportation equipment337 Muebles y productos relacionados 2,312,989 129,937,170 (127,624,181) 3,859,661 140,854,708 (136,995,047) Furniture and related products339 Manufactura miscelánea 1,218,580,221 374,170,014 844,410,207 1,212,835,329 288,714,822 924,120,507 Miscellaneous Manufacturing
75 - 99 Otros (1) 305,345,605 390,362,943 (85,017,338) 247,050,446 561,710,936 (314,660,490) Others (1)
(Continúa - Continue)

Junta de Planifi cación Planning Board
Estadísticas Seleccionadas del Comercio Exterior de Puerto Rico 2013 Selected Statistics on Puerto Rico’s External Trade 2013
25
TABLA 8 - BALANCE COMERCIAL POR SISTEMA DE CLASIFICACION INDUSTRIAL DE AMERICA DEL NORTE (SCIAN): AÑOS FISCALES (CONT.)TABLE 8 - TRADE BALANCE BY NORTH AMERICAN INDUSTRIAL CLASSIFICATION SYSTEM (NAICS): FISCAL YEARS (CONT.)(En dólares - In dollars)
2012 2013Balance Balance
Exportaciones Importaciones Comercial Exportaciones Importaciones Comercial(Exports) (Imports) (Trade Balance) (Exports) (Imports) (Trade Balance)
SCIAN(NAICS) Islas Vírgenes 162,923,197 1,775,083,609 (1,612,160,412) 232,808,247 8,797,056 224,011,191 Virgin Islands
11 Agricultura, silvicultura, pesca y caza 1,556,784 0 1,556,784 506,023 3,000 503,023 Agriculture, forestry, fishing and hunting
21 Minería 3,752,311 0 3,752,311 4,735,768 0 4,735,768 Mining
31-33 Manufactura 157,363,290 1,769,717,449 (1,612,354,159) 227,042,548 3,490,828 223,551,720 Manufacturing311 Alimentos 18,988,492 3,000 18,985,492 18,410,590 0 18,410,590 Food312 Productos de bebidas y de tabaco 1,912,847 6,455 1,906,392 2,281,049 4,685 2,276,364 Beverage and tobacco products
313-314 Textiles 606,804 0 606,804 129,068 0 129,068 Textiles315 Ropa 698,709 0 698,709 423,243 0 423,243 Apparel316 Cuero y productos afines 5,462,047 0 5,462,047 5,160,377 0 5,160,377 Leather and allied products321 Productos de madera 6,466,349 0 6,466,349 8,413,360 0 8,413,360 Wood products322 Papel 640,810 0 640,810 1,526,427 0 1,526,427 Paper323 Imprenta 140,026 0 140,026 297,314 0 297,314 Printing324 Productos de petróleo y de carbón 1,955,111 1,768,455,534 (1,766,500,423) 104,185,350 3,373,503 100,811,847 Petroleum and coal products325 Químicos 30,742,184 1,133,457 29,608,727 19,948,788 44,898 19,903,890 Chemicals326 Productos de plástico y de goma 4,617,190 0 4,617,190 1,988,092 6,128 1,981,964 Plastics and rubber products327 Productos de minerales no metálicos 4,694,387 0 4,694,387 5,704,530 0 5,704,530 Nonmetallic mineral products331 Metales primarios 4,540,008 12,000 4,528,008 3,499,898 0 3,499,898 Primary metals332 Productos fabricados de metal 11,018,864 0 11,018,864 4,411,569 44,100 4,367,469 Fabricated metal products333 Maquinaria 13,145,853 59,364 13,086,489 8,139,969 9,317 8,130,652 Machinery334 Productos de computadora y electrónicos 3,208,175 0 3,208,175 7,428,335 2,457 7,425,878 Computer and electronic products335 Equipos eléctricos, enseres Electrical equipment, appliance,
y componentes 11,823,148 25,515 11,823,148 4,913,552 0 4,913,552 and component336 Equipo de transportación 31,895,520 0 31,877,081 21,250,350 0 21,248,110 Transportation equipment337 Muebles y productos relacionados 1,705,581 18,439 1,701,896 1,341,183 2,240 1,337,683 Furniture and related products339 Manufactura miscelánea 3,101,185 3,685 3,101,185 7,589,504 3,500 7,589,504 Miscellaneous Manufacturing
75 - 99 Otros (1) 250,812 5,366,160 (5,115,348) 523,908 5,303,228 (4,779,320) Others (1)
(1) Incluye servicios de reparación y mercancía no clasificada. (1) Includes repair services and merchandise not classified.Nota: La clasificación de mercancía registrada de acuerdo al Sistema de Clasificación Industrial Note: The classification of recorded merchandise according to the North American Industrial de América del Norte no equivale necesariamente a la Clasificación Industrial Uniforme. Classification System does not necessarily equals the Standard Industrial Classification.Fuente: Junta de Planificación, Programa de Planificación Económica y Social, Source: Puerto Rico Planning Board, Program of Economic and Social Planning, Subprograma de Análisis Económico. Subprogram of Economic Analysis.

Junta de Planifi cación Planning Board
Estadísticas Seleccionadas del Comercio Exterior de Puerto Rico 2013 Selected Statistics on Puerto Rico’s External Trade 2013
26
TABLA 9 - PRINCIPALES EXPORTACIONES E IMPORTACIONES POR SISTEMA DE CLASIFICACION INDUSTRIAL DE AMERICA DEL NORTE (SCIAN) *: AÑOS FISCALESTABLE 9 - MAIN EXPORTS AND IMPORTS BY NORTH AMERICAN INDUSTRY CLASSIFICATION SYSTEM (NAICS) *: FISCAL YEARS
(En millones de dólares - In millions of dollars)
2008 2009 2010 2011 2012 2013SCIAN
(NAICS) Exportaciones registradas 63,953.6 60,806.6 61,657.2 64,876.0 58,914.1 62,396.9 Recorded exports
311930 Extractos y emulsiones para dar sabor 4,125.9 3,210.4 3,210.9 3,562.9 3,267.0 3,798.0 Flavoring extracts & syrups325199 Químicos orgánicos básicos, todos los otros 2,460.6 2,803.4 2,924.3 4,216.6 2,499.2 3,119.4 All other basic organic chemicals325411 Drogas y vitaminas medicinales y botánicas 4,874.1 3,815.4 3,405.7 4,248.8 4,907.7 6,509.9 Medicinal and botanical drugs and vitamins325412 Preparados farmacéuticos 34,667.6 32,642.3 31,691.0 34,787.3 31,708.7 24,916.4 Pharmaceutical preparations325414 Productos biológicos, excepto de diagnóstico 2,641.1 5,525.9 7,396.0 4,187.9 4,231.6 12,264.6 Biological products, except diagnostic333415 Equipo de aire acondicionado y calefacción 269.3 239.7 277.3 375.7 425.1 430.6 Air-conditioning and warm air heating equipment
y equipo de refrigeración comercial e industrial and commercial and industrial refrigeration equipment334510 Dispositivos electromédicos y de electroterapia 1,057.6 937.0 936.7 576.3 576.8 623.4 Electromedical and electrotherapeutic apparatus335313 Equipos y dispositivos conmutadores Switchgear and switchboard
de electricidad 1,235.4 865.8 521.2 487.3 567.5 619.8 apparatus339112 Artículos médico quirúrgicos 1,493.7 1,612.1 1,675.7 1,989.7 2,028.9 2,070.4 Surgical and medical instrument339113 Enseres y artículos quirúrgicos 1,996.7 1,841.2 2,186.9 2,244.4 2,096.4 2,376.1 Surgical appliance and supplies
Subtotal 54,821.9 53,493.1 54,225.6 56,676.9 52,308.7 56,728.6 Subtotal Por ciento 85.7 88.0 87.9 87.4 88.8 90.9 Per cent
(Continúa - Continue)

Junta de Planifi cación Planning Board
Estadísticas Seleccionadas del Comercio Exterior de Puerto Rico 2013 Selected Statistics on Puerto Rico’s External Trade 2013
27
TABLA 9 - PRINCIPALES EXPORTACIONES E IMPORTACIONES POR SISTEMA DE CLASIFICACION INDUSTRIAL DE AMERICA DEL NORTE (SCIAN) *: AÑOS FISCALES (CONT.)TABLE 9 - MAIN EXPORTS AND IMPORTS BY NORTH AMERICAN INDUSTRY CLASSIFICATION SYSTEM (NAICS) *: FISCAL YEARS (CONT.)
(En millones de dólares - In millions of dollars)
2008 2009 2010 2011 2012 2013SCIAN
(NAICS) Importaciones registradas 44,928.3 40,651.0 40,810.1 44,670.6 46,574.6 45,038.7 Recorded imports
311611 Productos de carne (excepto avícolas) 508.8 568.5 551.8 594.9 665.0 625.2 Meat products (except poultry)324110 Productos de refinería de petróleo 5,161.0 4,708.2 4,945.9 5,731.9 6,596.8 5,865.4 Petroleum refinery products325199 Químicos orgánicos básicos, todos los otros 3,116.8 3,147.8 3,115.0 4,284.8 3,747.1 3,447.2 All other basic organic chemicals325411 Drogas y vitaminas medicinales y botánicas 9,843.7 9,865.2 8,603.1 10,326.2 11,217.2 10,417.0 Medicinal and botanical drugs and vitamins325412 Preparados farmacéuticos 4,621.9 2,813.7 3,276.2 3,062.4 3,281.5 2,781.1 Pharmaceutical preparations325414 Productos biológicos, excepto de diagnóstico 600.4 912.3 1,882.4 1,088.2 1,004.2 1,394.5 Biological products, except diagnostic334220 Equipo de difusión de radio y televisión Radio and television broadcasting
y equipo de comunicación inalámbrica 443.1 501.8 510.4 558.8 619.3 612.7 and wireless communications equipment336111 Automóviles y vehículos livianos de motor, Automobiles and light duty motor vehicles,
incluyendo chasis 1,516.2 1,120.2 1,390.6 1,569.5 1,797.9 2,003.8 including chassis339112 Artículos médico quirúrgicos 689.0 680.9 631.5 676.5 674.8 624.6 Surgical and medical instrument339113 Enseres y artículos quirúrgicos 476.5 432.6 532.2 561.6 571.5 587.6 Surgical appliance and supplies
Subtotal 26,977.2 24,751.3 25,439.1 28,454.8 30,175.3 28,359.1 Subtotal Por ciento 60.0 60.9 62.3 63.7 64.8 63.0 Per cent
* De acuerdo al año fiscal 2013. * According to fiscal year 2013.
Nota: La clasificación de mercancía registrada de acuerdo al Sistema de Note: The classification of recorded merchandise according to the América del Norte no equivale necesariamente a la Clasificación North American Industry Classification System does not Industrial Uniforme. necessarily equals the Standard Industrial Classification.
Fuente: Junta de Planificación, Source: Puerto Rico Planning Board, Programa de Planificación Económica y Social, Program of Economic and Social Planning, Subprograma de Análisis Económico. Subprogram of Economic Analysis.
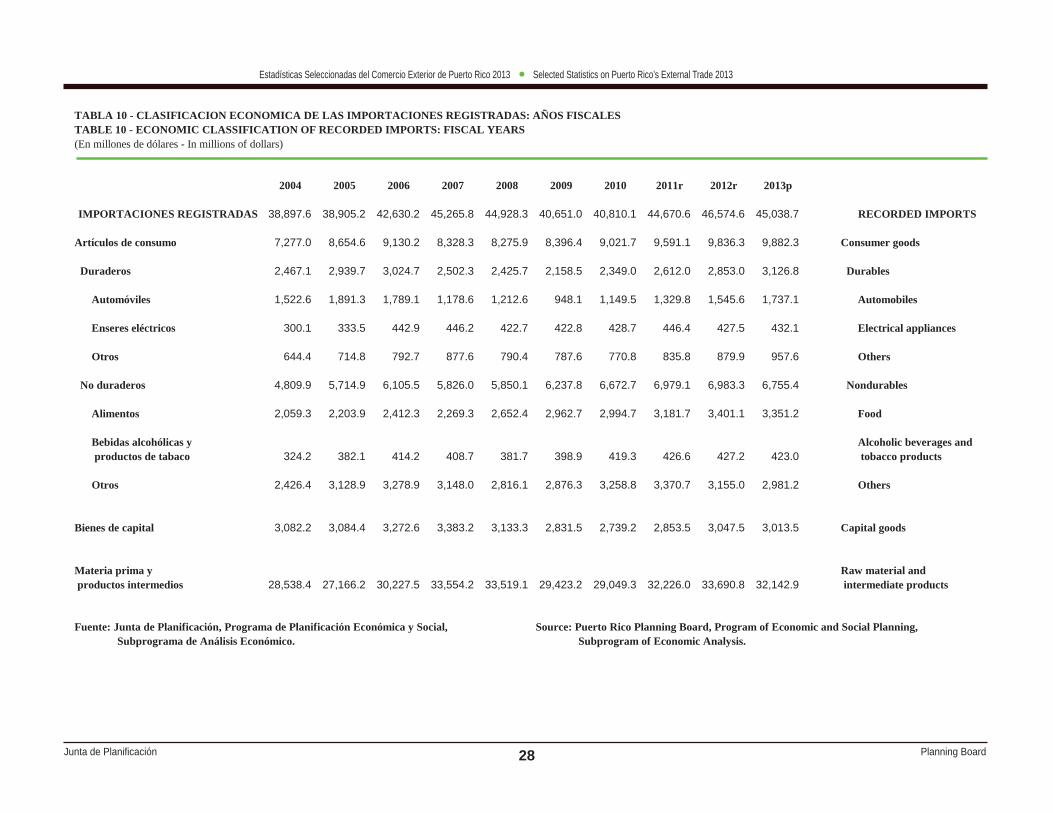
Junta de Planifi cación Planning Board
Estadísticas Seleccionadas del Comercio Exterior de Puerto Rico 2013 Selected Statistics on Puerto Rico’s External Trade 2013
28
TABLA 10 - CLASIFICACION ECONOMICA DE LAS IMPORTACIONES REGISTRADAS: AÑOS FISCALES TABLE 10 - ECONOMIC CLASSIFICATION OF RECORDED IMPORTS: FISCAL YEARS (En millones de dólares - In millions of dollars)
2004 2005 2006 2007 2008 2009 2010 2011r 2012r 2013p
IMPORTACIONES REGISTRADAS 38,897.6 38,905.2 42,630.2 45,265.8 44,928.3 40,651.0 40,810.1 44,670.6 46,574.6 45,038.7 RECORDED IMPORTS
Artículos de consumo 7,277.0 8,654.6 9,130.2 8,328.3 8,275.9 8,396.4 9,021.7 9,591.1 9,836.3 9,882.3 Consumer goods
Duraderos 2,467.1 2,939.7 3,024.7 2,502.3 2,425.7 2,158.5 2,349.0 2,612.0 2,853.0 3,126.8 Durables
Automóviles 1,522.6 1,891.3 1,789.1 1,178.6 1,212.6 948.1 1,149.5 1,329.8 1,545.6 1,737.1 Automobiles
Enseres eléctricos 300.1 333.5 442.9 446.2 422.7 422.8 428.7 446.4 427.5 432.1 Electrical appliances
Otros 644.4 714.8 792.7 877.6 790.4 787.6 770.8 835.8 879.9 957.6 Others
No duraderos 4,809.9 5,714.9 6,105.5 5,826.0 5,850.1 6,237.8 6,672.7 6,979.1 6,983.3 6,755.4 Nondurables
Alimentos 2,059.3 2,203.9 2,412.3 2,269.3 2,652.4 2,962.7 2,994.7 3,181.7 3,401.1 3,351.2 Food
Bebidas alcohólicas y Alcoholic beverages and productos de tabaco 324.2 382.1 414.2 408.7 381.7 398.9 419.3 426.6 427.2 423.0 tobacco products
Otros 2,426.4 3,128.9 3,278.9 3,148.0 2,816.1 2,876.3 3,258.8 3,370.7 3,155.0 2,981.2 Others
Bienes de capital 3,082.2 3,084.4 3,272.6 3,383.2 3,133.3 2,831.5 2,739.2 2,853.5 3,047.5 3,013.5 Capital goods
Materia prima y Raw material and productos intermedios 28,538.4 27,166.2 30,227.5 33,554.2 33,519.1 29,423.2 29,049.3 32,226.0 33,690.8 32,142.9 intermediate products
Fuente: Junta de Planificación, Programa de Planificación Económica y Social, Source: Puerto Rico Planning Board, Program of Economic and Social Planning, Subprograma de Análisis Económico. Subprogram of Economic Analysis.

Junta de Planifi cación Planning Board
Estadísticas Seleccionadas del Comercio Exterior de Puerto Rico 2013 Selected Statistics on Puerto Rico’s External Trade 2013
29
TABLA 11 - CLASIFICACION ECONOMICA DE LAS IMPORTACIONES AJUSTADAS: AÑOS FISCALES TABLE 11 - ECONOMIC CLASSIFICATION OF ADJUSTED IMPORTS: FISCAL YEARS (En millones de dólares - In millions of dollars)
2004 2005 2006 2007 2008 2009 2010r 2011r 2012r 2013p
IMPORTACIONES AJUSTADAS * 44,940.0 45,673.9 49,204.8 50,055.6 51,006.3 47,087.3 46,200.2 48,910.0 49,896.2 48,983.6 ADJUSTED IMPORTS *
Artículos de consumo 7,179.2 8,551.3 9,033.4 8,261.1 8,179.6 8,299.7 8,916.4 9,310.6 9,480.8 9,348.0 Consumer goods
Duraderos 2,370.9 2,837.1 2,928.0 2,435.1 2,329.5 2,061.9 2,243.6 2,234.1 2,399.2 2,503.4 Durables
Automóviles 1,427.5 1,789.4 1,692.5 1,111.3 1,116.5 851.5 1,044.1 1,172.9 1,453.8 1,655.3 Automobiles
Enseres eléctricos 300.1 333.5 442.9 446.1 422.7 422.8 428.7 446.4 427.5 432.1 Electrical appliances
Otros 643.3 714.2 792.6 877.6 790.4 787.6 770.8 614.8 517.9 416.0 Others
No duraderos 4,808.3 5,714.2 6,105.4 5,826.0 5,850.1 6,237.8 6,672.7 7,076.6 7,081.6 6,844.5 Nondurables
Alimentos 2,059.2 2,203.9 2,412.3 2,269.3 2,652.4 2,962.7 2,994.6 3,195.5 3,413.4 3,353.6 Food
Bebidas alcohólicas y Alcoholic beverages and productos de tabaco 322.7 382.1 414.1 408.7 381.7 398.9 419.3 426.6 427.2 423.0 tobacco products
Otros 2,426.4 3,128.2 3,278.9 3,148.0 2,816.0 2,876.3 3,258.8 3,454.5 3,241.1 3,067.9 Others
Bienes de capital 3,081.9 3,084.1 3,272.6 3,383.2 3,133.3 2,831.5 2,739.1 2,853.5 3,047.5 3,013.5 Capital goods
Materia prima y Raw material and productos intermedios 34,679.2 34,038.5 36,899.1 38,411.2 39,693.4 35,956.1 34,544.9 36,745.8 37,367.9 36,622.1 intermediate products
r- Cifras revisadas. r- Revised figures.p- Cifras preliminares. p- Preliminary figures.
* Al valor de las importaciones de mercancía registrada se le hacen ajustes * Recorded merchandise imports are adjusted by: parcel post, por concepto de: paquetes postales, equipo de oficina para alquiler, office equipment for rent, motion picture films, returned películas cinematográficas, mercancía devuelta, mercancía sin registrar, merchandise, unrecorded merchandise, automobiles, and crude oil and automóviles y derechos de igualación de costos de las refinerías de petróleo y nafta. naphtha entitlements.
Fuente: Junta de Planificación, Programa de Planificación Económica y Social, Source: Puerto Rico Planning Board, Program of Economic and Social Planning, Subprograma de Análisis Económico. Subprogram of Economic Analysis.
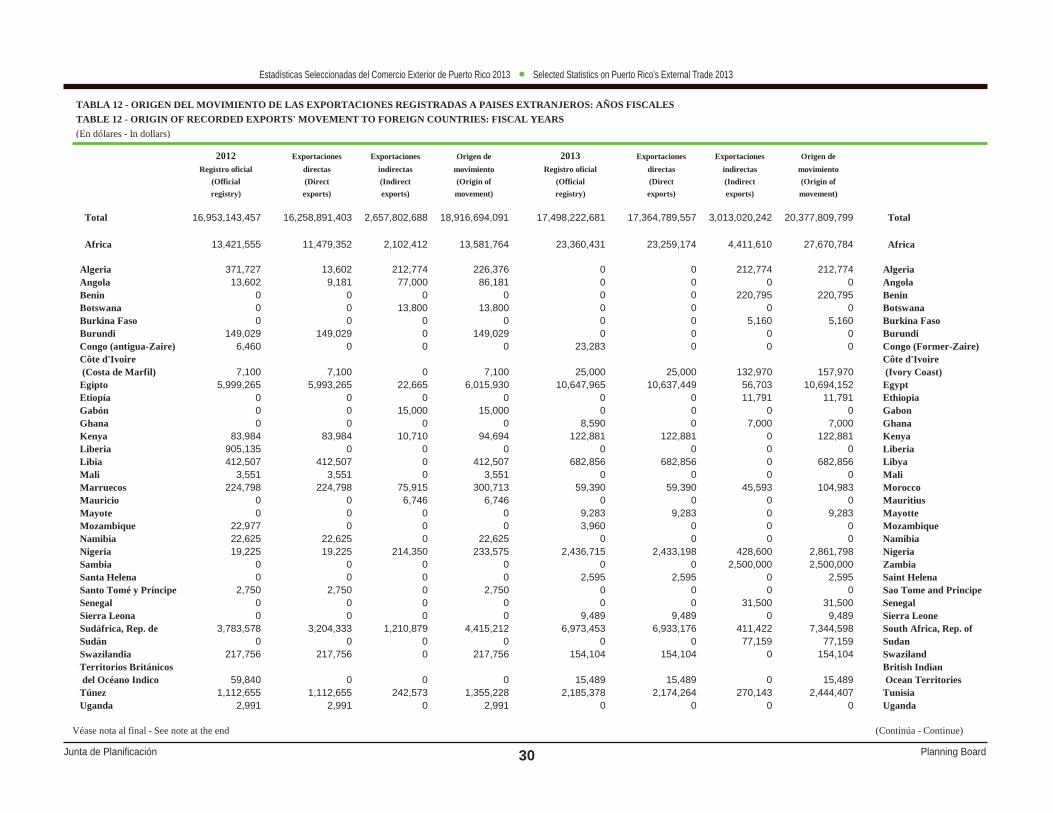
Junta de Planifi cación Planning Board
Estadísticas Seleccionadas del Comercio Exterior de Puerto Rico 2013 Selected Statistics on Puerto Rico’s External Trade 2013
30
2012 Exportaciones Exportaciones Origen de 2013 Exportaciones Exportaciones Origen deRegistro oficial directas indirectas movimiento Registro oficial directas indirectas movimiento
(Official (Direct (Indirect (Origin of (Official (Direct (Indirect (Origin ofregistry) exports) exports) movement) registry) exports) exports) movement)
Total 16,953,143,457 16,258,891,403 2,657,802,688 18,916,694,091 17,498,222,681 17,364,789,557 3,013,020,242 20,377,809,799 Total
Africa 13,421,555 11,479,352 2,102,412 13,581,764 23,360,431 23,259,174 4,411,610 27,670,784 Africa
Algeria 371,727 13,602 212,774 226,376 0 0 212,774 212,774 Algeria Angola 13,602 9,181 77,000 86,181 0 0 0 0 Angola Benin 0 0 0 0 0 0 220,795 220,795 Benin Botswana 0 0 13,800 13,800 0 0 0 0 Botswana Burkina Faso 0 0 0 0 0 0 5,160 5,160 Burkina Faso Burundi 149,029 149,029 0 149,029 0 0 0 0 Burundi Congo (antigua-Zaire) 6,460 0 0 0 23,283 0 0 0 Congo (Former-Zaire) Côte d'Ivoire Côte d'Ivoire (Costa de Marfil) 7,100 7,100 0 7,100 25,000 25,000 132,970 157,970 (Ivory Coast) Egipto 5,999,265 5,993,265 22,665 6,015,930 10,647,965 10,637,449 56,703 10,694,152 Egypt Etiopía 0 0 0 0 0 0 11,791 11,791 Ethiopia Gabón 0 0 15,000 15,000 0 0 0 0 Gabon Ghana 0 0 0 0 8,590 0 7,000 7,000 Ghana Kenya 83,984 83,984 10,710 94,694 122,881 122,881 0 122,881 Kenya Liberia 905,135 0 0 0 0 0 0 0 Liberia Libia 412,507 412,507 0 412,507 682,856 682,856 0 682,856 Libya Mali 3,551 3,551 0 3,551 0 0 0 0 Mali Marruecos 224,798 224,798 75,915 300,713 59,390 59,390 45,593 104,983 Morocco Mauricio 0 0 6,746 6,746 0 0 0 0 Mauritius Mayote 0 0 0 0 9,283 9,283 0 9,283 Mayotte Mozambique 22,977 0 0 0 3,960 0 0 0 Mozambique Namibia 22,625 22,625 0 22,625 0 0 0 0 Namibia Nigeria 19,225 19,225 214,350 233,575 2,436,715 2,433,198 428,600 2,861,798 Nigeria Sambia 0 0 0 0 0 0 2,500,000 2,500,000 Zambia Santa Helena 0 0 0 0 2,595 2,595 0 2,595 Saint Helena Santo Tomé y Príncipe 2,750 2,750 0 2,750 0 0 0 0 Sao Tome and Principe Senegal 0 0 0 0 0 0 31,500 31,500 Senegal Sierra Leona 0 0 0 0 9,489 9,489 0 9,489 Sierra Leone Sudáfrica, Rep. de 3,783,578 3,204,333 1,210,879 4,415,212 6,973,453 6,933,176 411,422 7,344,598 South Africa, Rep. of Sudán 0 0 0 0 0 0 77,159 77,159 Sudan Swazilandia 217,756 217,756 0 217,756 154,104 154,104 0 154,104 Swaziland Territorios Británicos British Indian del Océano Indico 59,840 0 0 0 15,489 15,489 0 15,489 Ocean Territories Túnez 1,112,655 1,112,655 242,573 1,355,228 2,185,378 2,174,264 270,143 2,444,407 Tunisia Uganda 2,991 2,991 0 2,991 0 0 0 0 Uganda
Véase nota al final - See note at the end (Continúa - Continue)
TABLA 12 - ORIGEN DEL MOVIMIENTO DE LAS EXPORTACIONES REGISTRADAS A PAISES EXTRANJEROS: AÑOS FISCALESTABLE 12 - ORIGIN OF RECORDED EXPORTS' MOVEMENT TO FOREIGN COUNTRIES: FISCAL YEARS(En dólares - In dollars)

Junta de Planifi cación Planning Board
Estadísticas Seleccionadas del Comercio Exterior de Puerto Rico 2013 Selected Statistics on Puerto Rico’s External Trade 2013
31
2012 Exportaciones Exportaciones Origen de 2013 Exportaciones Exportaciones Origen deRegistro oficial directas indirectas movimiento Registro oficial directas indirectas movimiento
(Official (Direct (Indirect (Origin of (Official (Direct (Indirect (Origin ofregistry) exports) exports) movement) registry) exports) exports) movement)
América Central 294,533,390 294,200,220 9,433,316 303,633,536 312,161,165 310,897,184 13,081,057 323,978,241 Central America
Belice 614,267 614,267 503,877 1,118,144 606,065 606,065 156,119 762,184 Belize Costa Rica 34,143,331 33,903,130 779,525 34,682,655 32,501,253 31,412,929 1,910,007 33,322,936 Costa Rica El Salvador 2,087,914 2,060,013 462,857 2,522,870 2,445,437 2,390,932 509,718 2,900,650 El Salvador Guatemala 2,436,307 2,423,439 481,727 2,905,166 10,915,208 10,908,958 3,158,269 14,067,227 Guatemala Honduras 33,938,916 33,934,264 583,145 34,517,409 4,541,600 4,533,775 5,639,761 10,173,536 Honduras Nicaragua 805,364 805,364 163,984 969,348 666,720 666,720 56,367 723,087 Nicaragua Panamá 220,507,291 220,459,743 6,458,201 226,917,944 260,484,882 260,377,805 1,650,816 262,028,621 Panama
América del Norte 604,284,317 599,231,168 1,166,015,599 1,765,246,767 439,110,303 432,861,710 1,062,371,456 1,495,233,166 North America
Bermuda 1,802,538 1,775,516 1,327,528 3,103,044 1,847,152 1,826,865 1,787,916 3,614,781 Bermuda Canadá 80,869,103 76,308,097 1,032,042,225 1,108,350,322 73,389,604 67,550,808 926,322,411 993,873,219 Canada México 521,612,676 521,147,555 132,645,846 653,793,401 363,873,547 363,484,037 134,261,129 497,745,166 Mexico
América del Sur 315,610,777 266,471,314 97,475,061 363,946,375 404,170,566 345,102,520 171,689,718 516,792,238 South America
Argentina 44,238,842 37,006,578 45,840,869 82,847,447 54,666,152 44,539,552 59,685,467 104,225,019 Argentina Bolivia 112,680 109,320 31,840 141,160 381,007 381,007 288,604 669,611 Bolivia Brasil 183,060,448 144,569,111 14,717,529 159,286,640 233,053,043 186,983,757 39,488,800 226,472,557 Brazil Chile 12,682,534 12,682,534 4,442,121 17,124,655 22,704,025 22,632,199 3,355,167 25,987,366 Chile Colombia 19,565,873 19,523,073 19,238,867 38,761,940 18,406,585 18,321,924 54,610,714 72,932,638 Colombia Ecuador 4,129,342 3,990,777 956,039 4,946,816 5,469,629 4,974,620 634,931 5,609,551 Ecuador Guyana 5,939,831 5,055,357 762,970 5,818,327 5,694,970 5,449,558 767,898 6,217,456 Guyana Guyana Francesa 1,005,599 0 0 0 2,511 0 0 0 French Guiana Paraguay 357,958 187,958 55,977 243,935 2,320,516 2,320,516 36,861 2,357,377 Paraguay Perú 5,112,903 4,994,757 599,117 5,593,874 9,989,697 9,971,242 719,095 10,690,337 Peru Surinam 8,498,239 8,466,237 680,896 9,147,133 8,302,269 8,247,339 561,121 8,808,460 Suriname Uruguay 2,958,787 2,958,787 230,872 3,189,659 8,512,853 6,915,389 1,568,970 8,484,359 Uruguay Venezuela 27,947,741 26,926,825 9,917,964 36,844,789 34,667,309 34,365,417 9,972,090 44,337,507 Venezuela
Véase nota al final - See note at the end (Continúa - Continue)
TABLA 12 - ORIGEN DEL MOVIMIENTO DE LAS EXPORTACIONES REGISTRADAS A PAISES EXTRANJEROS: AÑOS FISCALES (CONT.)TABLE 12 - ORIGIN OF RECORDED EXPORTS' MOVEMENT TO FOREIGN COUNTRIES: FISCAL YEARS (CONT.)(En dólares - In dollars)

Junta de Planifi cación Planning Board
Estadísticas Seleccionadas del Comercio Exterior de Puerto Rico 2013 Selected Statistics on Puerto Rico’s External Trade 2013
32
TABLA 12 - ORIGEN DEL MOVIMIENTO DE LAS EXPORTACIONES REGISTRADAS A PAISES EXTRANJEROS: AÑOS FISCALES (CONT.)TABLE 12 - ORIGIN OF RECORDED EXPORTS' MOVEMENT TO FOREIGN COUNTRIES: FISCAL YEARS (CONT.)(En dólares - In dollars)
2012 Exportaciones Exportaciones Origen de 2013 Exportaciones Exportaciones Origen deRegistro oficial directas indirectas movimiento Registro oficial directas indirectas movimiento
(Official (Direct (Indirect (Origin of (Official (Direct (Indirect (Origin ofregistry) exports) exports) movement) registry) exports) exports) movement)
Asia 3,833,565,036 3,818,697,575 269,471,235 4,088,168,810 3,245,002,055 3,232,351,297 446,847,418 3,679,198,715 Asia
Afganistán 0 0 105,000 105,000 0 0 9,600 9,600 Afghanistan Arabia Saudita 24,064,502 23,981,064 459,762 24,440,826 36,313,664 36,227,020 873,445 37,100,465 Saudi Arabia Azerbaiyán 0 0 63,893 63,893 0 0 0 0 Azerbaijan Bahrein 9,518 9,518 38,839 48,357 4,545 4,545 23,900 28,445 Bahrain Bangladesh 191,342 191,342 7,740 199,082 215,322 215,322 0 215,322 Bangladesh Birmania (Myanmar) 0 0 82,438 82,438 219,911 219,911 51,304 271,215 Burma (Myanmar) Brunei Darusalaam 0 0 0 0 60,748 55,440 0 55,440 Brunei Darussalam Camboya 116,094 116,094 0 116,094 95,280 95,280 0 95,280 Cambodia Cisjordania 7,510 0 0 0 25,000 25,000 0 25,000 West Bank Corea, Rep. de Korea, Republic of (Corea del Sur) 148,930,288 146,495,705 2,631,861 149,127,566 96,773,834 94,979,377 4,934,447 99,913,824 (South Korea) China (Taiwán) 211,022,163 210,207,987 5,886,207 216,094,194 210,670,471 210,545,234 2,356,272 212,901,506 China (Taiwan) China, República China, People's Popular de 639,513,165 633,586,448 44,238,733 677,825,181 602,191,463 597,558,679 83,469,542 681,028,221 Republic of Emiratos Arabes United Arab Unidos 12,219,604 11,301,362 963,599 12,264,961 13,606,556 11,848,713 7,363,691 19,212,404 Emirates Filipinas 1,667,138 1,632,513 2,113,494 3,746,007 2,339,146 2,332,922 2,300,849 4,633,771 Philippines Georgia 296,507 296,507 0 296,507 3,274,203 3,274,203 10,740 3,284,943 Georgia Hong Kong 608,945,020 607,569,083 4,374,201 611,943,284 459,780,484 459,568,774 8,493,901 468,062,675 Hong Kong India 38,886,489 38,514,121 17,835,427 56,349,548 40,628,904 40,344,023 11,976,834 52,320,857 India Indonesia 10,960,927 10,800,045 6,613,019 17,413,064 4,485,692 4,482,994 4,300,131 8,783,125 Indonesia Irán 344,335 344,335 0 344,335 572,256 572,256 113,837 686,093 Iran Iraq 215,500 215,500 41,413 256,913 172,282 172,282 6,716 178,998 Iraq Israel 17,206,926 16,703,313 2,046,212 18,749,525 19,302,361 18,503,628 370,978 18,874,606 Israel Japón 1,731,406,114 1,730,600,608 110,227,088 1,840,827,696 1,495,949,828 1,495,419,251 249,882,147 1,745,301,398 Japan Jordania 183,567 183,567 27,973 211,540 349,614 349,614 464,416 814,030 Jordan
Véase nota al final - See note at the end (Continúa - Continue)
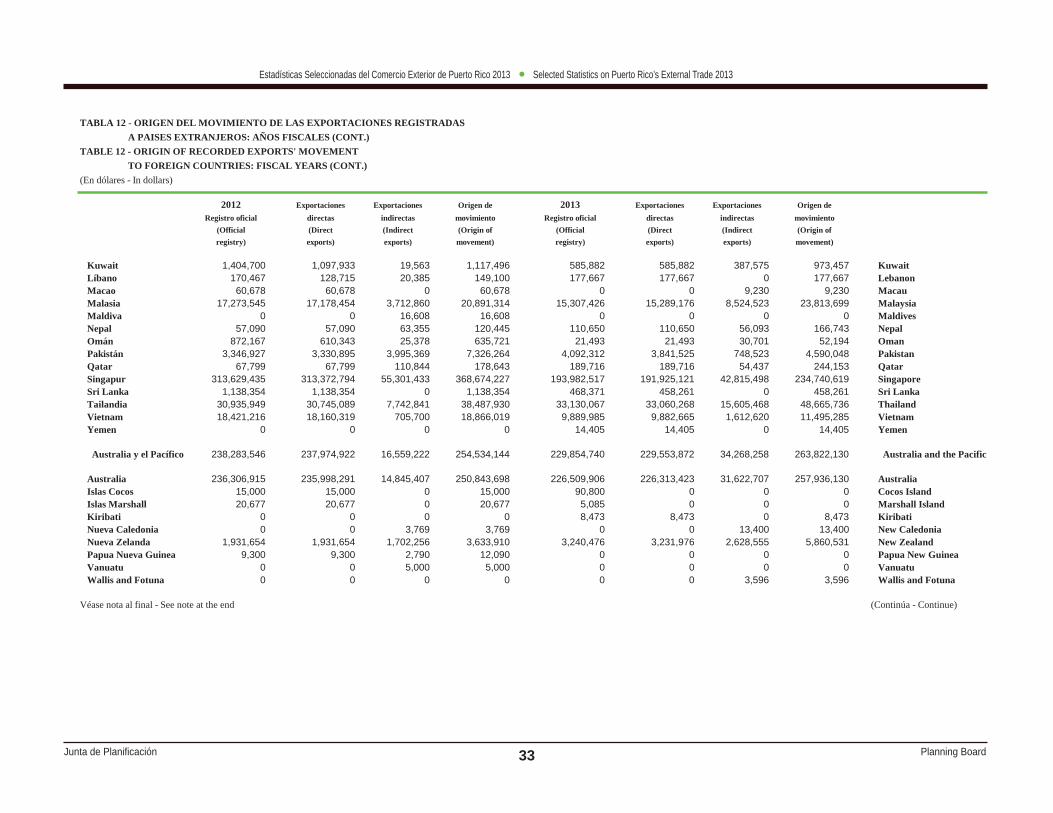
Junta de Planifi cación Planning Board
Estadísticas Seleccionadas del Comercio Exterior de Puerto Rico 2013 Selected Statistics on Puerto Rico’s External Trade 2013
33
TABLA 12 - ORIGEN DEL MOVIMIENTO DE LAS EXPORTACIONES REGISTRADAS A PAISES EXTRANJEROS: AÑOS FISCALES (CONT.)TABLE 12 - ORIGIN OF RECORDED EXPORTS' MOVEMENT TO FOREIGN COUNTRIES: FISCAL YEARS (CONT.)(En dólares - In dollars)
2012 Exportaciones Exportaciones Origen de 2013 Exportaciones Exportaciones Origen deRegistro oficial directas indirectas movimiento Registro oficial directas indirectas movimiento
(Official (Direct (Indirect (Origin of (Official (Direct (Indirect (Origin ofregistry) exports) exports) movement) registry) exports) exports) movement)
Kuwait 1,404,700 1,097,933 19,563 1,117,496 585,882 585,882 387,575 973,457 Kuwait Líbano 170,467 128,715 20,385 149,100 177,667 177,667 0 177,667 Lebanon Macao 60,678 60,678 0 60,678 0 0 9,230 9,230 Macau Malasia 17,273,545 17,178,454 3,712,860 20,891,314 15,307,426 15,289,176 8,524,523 23,813,699 Malaysia Maldiva 0 0 16,608 16,608 0 0 0 0 Maldives Nepal 57,090 57,090 63,355 120,445 110,650 110,650 56,093 166,743 Nepal Omán 872,167 610,343 25,378 635,721 21,493 21,493 30,701 52,194 Oman Pakistán 3,346,927 3,330,895 3,995,369 7,326,264 4,092,312 3,841,525 748,523 4,590,048 Pakistan Qatar 67,799 67,799 110,844 178,643 189,716 189,716 54,437 244,153 Qatar Singapur 313,629,435 313,372,794 55,301,433 368,674,227 193,982,517 191,925,121 42,815,498 234,740,619 Singapore Sri Lanka 1,138,354 1,138,354 0 1,138,354 468,371 458,261 0 458,261 Sri Lanka Tailandia 30,935,949 30,745,089 7,742,841 38,487,930 33,130,067 33,060,268 15,605,468 48,665,736 Thailand Vietnam 18,421,216 18,160,319 705,700 18,866,019 9,889,985 9,882,665 1,612,620 11,495,285 Vietnam Yemen 0 0 0 0 14,405 14,405 0 14,405 Yemen
Australia y el Pacífico 238,283,546 237,974,922 16,559,222 254,534,144 229,854,740 229,553,872 34,268,258 263,822,130 Australia and the Pacific
Australia 236,306,915 235,998,291 14,845,407 250,843,698 226,509,906 226,313,423 31,622,707 257,936,130 Australia Islas Cocos 15,000 15,000 0 15,000 90,800 0 0 0 Cocos Island Islas Marshall 20,677 20,677 0 20,677 5,085 0 0 0 Marshall Island Kiribati 0 0 0 0 8,473 8,473 0 8,473 Kiribati Nueva Caledonia 0 0 3,769 3,769 0 0 13,400 13,400 New Caledonia Nueva Zelanda 1,931,654 1,931,654 1,702,256 3,633,910 3,240,476 3,231,976 2,628,555 5,860,531 New Zealand Papua Nueva Guinea 9,300 9,300 2,790 12,090 0 0 0 0 Papua New Guinea Vanuatu 0 0 5,000 5,000 0 0 0 0 Vanuatu Wallis and Fotuna 0 0 0 0 0 0 3,596 3,596 Wallis and Fotuna
Véase nota al final - See note at the end (Continúa - Continue)
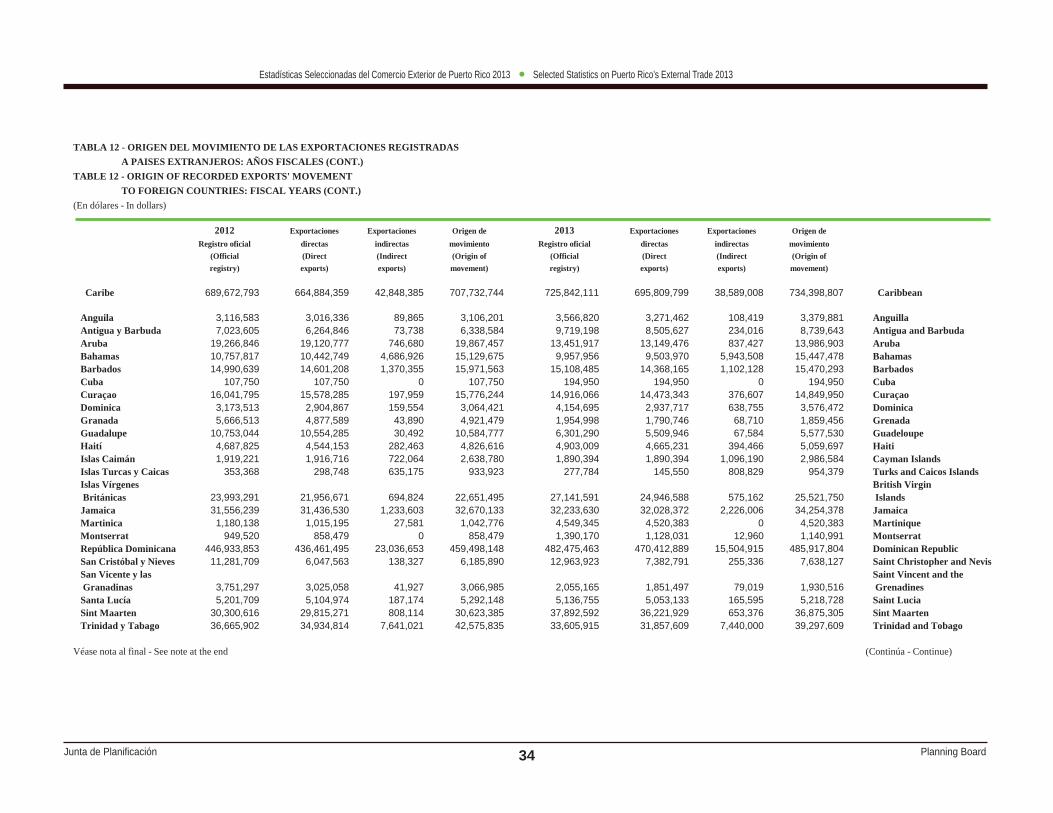
Junta de Planifi cación Planning Board
Estadísticas Seleccionadas del Comercio Exterior de Puerto Rico 2013 Selected Statistics on Puerto Rico’s External Trade 2013
34
TABLA 12 - ORIGEN DEL MOVIMIENTO DE LAS EXPORTACIONES REGISTRADAS A PAISES EXTRANJEROS: AÑOS FISCALES (CONT.)TABLE 12 - ORIGIN OF RECORDED EXPORTS' MOVEMENT TO FOREIGN COUNTRIES: FISCAL YEARS (CONT.)(En dólares - In dollars)
2012 Exportaciones Exportaciones Origen de 2013 Exportaciones Exportaciones Origen deRegistro oficial directas indirectas movimiento Registro oficial directas indirectas movimiento
(Official (Direct (Indirect (Origin of (Official (Direct (Indirect (Origin ofregistry) exports) exports) movement) registry) exports) exports) movement)
Caribe 689,672,793 664,884,359 42,848,385 707,732,744 725,842,111 695,809,799 38,589,008 734,398,807 Caribbean
Anguila 3,116,583 3,016,336 89,865 3,106,201 3,566,820 3,271,462 108,419 3,379,881 Anguilla Antigua y Barbuda 7,023,605 6,264,846 73,738 6,338,584 9,719,198 8,505,627 234,016 8,739,643 Antigua and Barbuda Aruba 19,266,846 19,120,777 746,680 19,867,457 13,451,917 13,149,476 837,427 13,986,903 Aruba Bahamas 10,757,817 10,442,749 4,686,926 15,129,675 9,957,956 9,503,970 5,943,508 15,447,478 Bahamas Barbados 14,990,639 14,601,208 1,370,355 15,971,563 15,108,485 14,368,165 1,102,128 15,470,293 Barbados Cuba 107,750 107,750 0 107,750 194,950 194,950 0 194,950 Cuba Curaçao 16,041,795 15,578,285 197,959 15,776,244 14,916,066 14,473,343 376,607 14,849,950 Curaçao Dominica 3,173,513 2,904,867 159,554 3,064,421 4,154,695 2,937,717 638,755 3,576,472 Dominica Granada 5,666,513 4,877,589 43,890 4,921,479 1,954,998 1,790,746 68,710 1,859,456 Grenada Guadalupe 10,753,044 10,554,285 30,492 10,584,777 6,301,290 5,509,946 67,584 5,577,530 Guadeloupe Haití 4,687,825 4,544,153 282,463 4,826,616 4,903,009 4,665,231 394,466 5,059,697 Haiti Islas Caimán 1,919,221 1,916,716 722,064 2,638,780 1,890,394 1,890,394 1,096,190 2,986,584 Cayman Islands Islas Turcas y Caicas 353,368 298,748 635,175 933,923 277,784 145,550 808,829 954,379 Turks and Caicos Islands Islas Vírgenes British Virgin Británicas 23,993,291 21,956,671 694,824 22,651,495 27,141,591 24,946,588 575,162 25,521,750 Islands Jamaica 31,556,239 31,436,530 1,233,603 32,670,133 32,233,630 32,028,372 2,226,006 34,254,378 Jamaica Martinica 1,180,138 1,015,195 27,581 1,042,776 4,549,345 4,520,383 0 4,520,383 Martinique Montserrat 949,520 858,479 0 858,479 1,390,170 1,128,031 12,960 1,140,991 Montserrat República Dominicana 446,933,853 436,461,495 23,036,653 459,498,148 482,475,463 470,412,889 15,504,915 485,917,804 Dominican Republic San Cristóbal y Nieves 11,281,709 6,047,563 138,327 6,185,890 12,963,923 7,382,791 255,336 7,638,127 Saint Christopher and Nevis San Vicente y las Saint Vincent and the Granadinas 3,751,297 3,025,058 41,927 3,066,985 2,055,165 1,851,497 79,019 1,930,516 Grenadines Santa Lucía 5,201,709 5,104,974 187,174 5,292,148 5,136,755 5,053,133 165,595 5,218,728 Saint Lucia Sint Maarten 30,300,616 29,815,271 808,114 30,623,385 37,892,592 36,221,929 653,376 36,875,305 Sint Maarten Trinidad y Tabago 36,665,902 34,934,814 7,641,021 42,575,835 33,605,915 31,857,609 7,440,000 39,297,609 Trinidad and Tobago
Véase nota al final - See note at the end (Continúa - Continue)

Junta de Planifi cación Planning Board
Estadísticas Seleccionadas del Comercio Exterior de Puerto Rico 2013 Selected Statistics on Puerto Rico’s External Trade 2013
35
TABLA 12 - ORIGEN DEL MOVIMIENTO DE LAS EXPORTACIONES REGISTRADAS A PAISES EXTRANJEROS: AÑOS FISCALES (CONT.)TABLE 12 - ORIGIN OF RECORDED EXPORTS' MOVEMENT TO FOREIGN COUNTRIES: FISCAL YEARS (CONT.)(En dólares - In dollars)
2012 Exportaciones Exportaciones Origen de 2013 Exportaciones Exportaciones Origen deRegistro oficial directas indirectas movimiento Registro oficial directas indirectas movimiento
(Official (Direct (Indirect (Origin of (Official (Direct (Indirect (Origin ofregistry) exports) exports) movement) registry) exports) exports) movement)
Europa 10,963,772,043 10,365,952,493 1,053,897,458 11,419,849,951 12,118,721,310 12,094,954,001 1,241,761,717 13,336,715,718 Europe
Alemania 601,664,346 599,099,490 14,915,268 614,014,758 521,736,092 519,219,996 4,203,470 523,423,466 Germany Austria 874,387,243 874,383,579 17,224 874,400,803 977,586,492 977,573,142 11,920 977,585,062 Austria Belarus 4,510 4,510 16,000 20,510 0 0 0 0 Belarus Bélgica 2,581,630,698 2,581,484,145 45,882,793 2,627,366,938 2,657,959,333 2,657,679,537 48,960,293 2,706,639,830 Belgium Bosnia y Herzegovina 0 0 0 0 5,521 5,521 127,986 133,507 Bosnia-Hercegovina Bulgaria 177,085 177,085 7,900 184,985 112,115 112,115 4,000 116,115 Bulgaria Chipre 0 0 0 0 12,642 12,642 0 12,642 Cyprus Ciudad del Vaticano 0 0 0 0 0 0 4,400 4,400 Vatican City Croacia 370,293 351,147 13,085 364,232 235,217 235,217 2,592 237,809 Croatia Dinamarca 366,332 287,959 58,757 346,716 4,106,506 4,087,454 131,209 4,218,663 Denmark Eslovenia 29,722 24,912 3,422 28,334 13,055 13,055 84,278 97,333 Slovenia España 788,171,105 788,129,953 994,756 789,124,709 1,455,741,764 1,455,532,667 726,067 1,456,258,734 Spain Finlandia 21,704,601 21,694,701 67,677 21,762,378 317,733 314,753 0 314,753 Finland Francia 1,044,075,816 1,043,584,772 6,835,221 1,050,419,993 1,023,648,588 1,023,601,257 35,353,245 1,058,954,502 France Grecia 3,329,601 3,273,323 21,414 3,294,737 2,256,350 2,242,910 151,603 2,394,513 Greece Hungría 1,162,771 1,162,771 519,083 1,681,854 317,872 317,872 1,392,508 1,710,380 Hungary Irlanda 184,701,725 184,074,677 6,003,644 190,078,321 101,194,618 100,982,660 91,536,566 192,519,226 Ireland Islandia 0 0 0 0 8,593 8,593 0 8,593 Iceland Italia 973,948,274 973,837,463 322,770,588 1,296,608,051 1,728,740,545 1,728,587,397 258,195,393 1,986,782,790 Italy Letonia 55,000 55,000 0 55,000 0 0 0 0 Latvia Lituania 9,500 9,500 112,500 122,000 0 0 3,121 3,121 Lithuania Luxemburgo 4,602 4,602 0 4,602 0 0 335,430 335,430 Luxembourg Macedonia 4,500 0 0 0 0 0 0 0 Macedonia Malta 8,541 8,541 118,102 126,643 2,649 2,649 369,230 371,879 Malta Montenegro 3,103 3,103 0 3,103 0 0 0 0 Montenegro Noruega 29,482 3,500 260,226 263,726 2,735 2,735 17,612 20,347 Norway Países Bajos (Holanda) 1,931,932,050 1,929,462,619 296,670,243 2,226,132,862 1,877,226,362 1,870,901,176 487,185,754 2,358,086,930 Netherlands
Véase nota al final - See note at the end (Continúa - Continue)
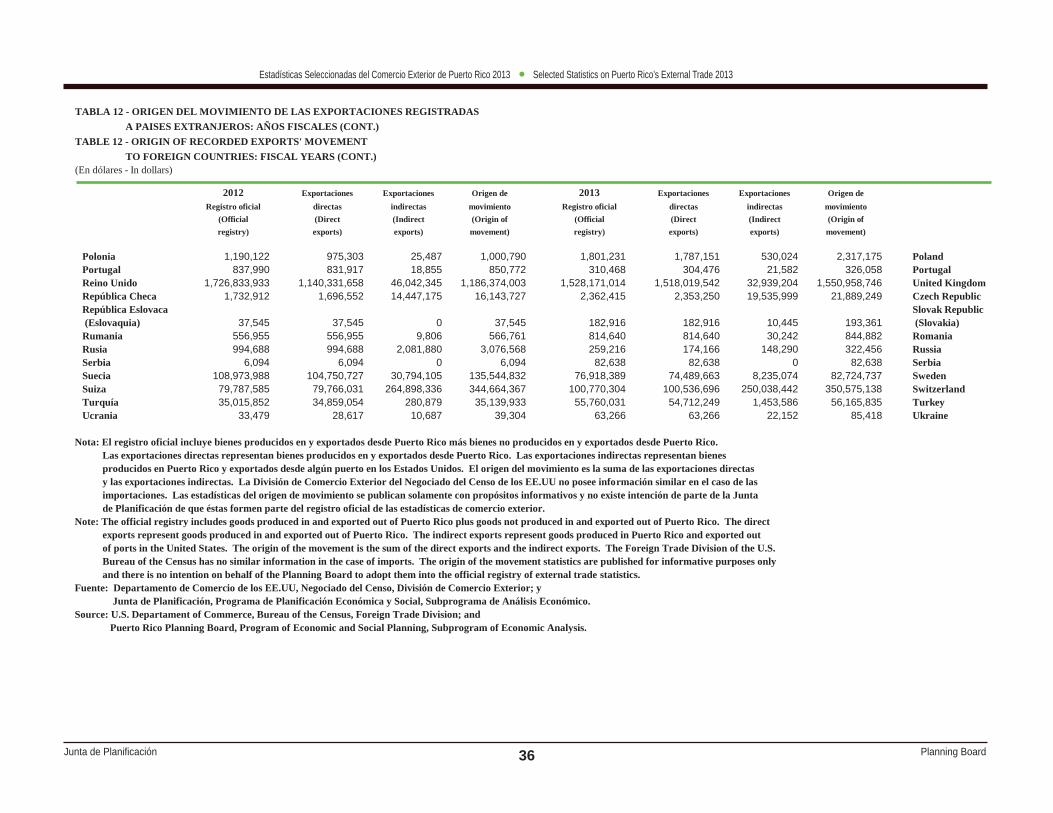
Junta de Planifi cación Planning Board
Estadísticas Seleccionadas del Comercio Exterior de Puerto Rico 2013 Selected Statistics on Puerto Rico’s External Trade 2013
36
2012 Exportaciones Exportaciones Origen de 2013 Exportaciones Exportaciones Origen deRegistro oficial directas indirectas movimiento Registro oficial directas indirectas movimiento
(Official (Direct (Indirect (Origin of (Official (Direct (Indirect (Origin ofregistry) exports) exports) movement) registry) exports) exports) movement)
Polonia 1,190,122 975,303 25,487 1,000,790 1,801,231 1,787,151 530,024 2,317,175 Poland Portugal 837,990 831,917 18,855 850,772 310,468 304,476 21,582 326,058 Portugal Reino Unido 1,726,833,933 1,140,331,658 46,042,345 1,186,374,003 1,528,171,014 1,518,019,542 32,939,204 1,550,958,746 United Kingdom República Checa 1,732,912 1,696,552 14,447,175 16,143,727 2,362,415 2,353,250 19,535,999 21,889,249 Czech Republic República Eslovaca Slovak Republic (Eslovaquia) 37,545 37,545 0 37,545 182,916 182,916 10,445 193,361 (Slovakia) Rumania 556,955 556,955 9,806 566,761 814,640 814,640 30,242 844,882 Romania Rusia 994,688 994,688 2,081,880 3,076,568 259,216 174,166 148,290 322,456 Russia Serbia 6,094 6,094 0 6,094 82,638 82,638 0 82,638 Serbia Suecia 108,973,988 104,750,727 30,794,105 135,544,832 76,918,389 74,489,663 8,235,074 82,724,737 Sweden Suiza 79,787,585 79,766,031 264,898,336 344,664,367 100,770,304 100,536,696 250,038,442 350,575,138 Switzerland Turquía 35,015,852 34,859,054 280,879 35,139,933 55,760,031 54,712,249 1,453,586 56,165,835 Turkey Ucrania 33,479 28,617 10,687 39,304 63,266 63,266 22,152 85,418 Ukraine
Nota: El registro oficial incluye bienes producidos en y exportados desde Puerto Rico más bienes no producidos en y exportados desde Puerto Rico. Las exportaciones directas representan bienes producidos en y exportados desde Puerto Rico. Las exportaciones indirectas representan bienes producidos en Puerto Rico y exportados desde algún puerto en los Estados Unidos. El origen del movimiento es la suma de las exportaciones directas y las exportaciones indirectas. La División de Comercio Exterior del Negociado del Censo de los EE.UU no posee información similar en el caso de las importaciones. Las estadísticas del origen de movimiento se publican solamente con propósitos informativos y no existe intención de parte de la Junta de Planificación de que éstas formen parte del registro oficial de las estadísticas de comercio exterior.Note: The official registry includes goods produced in and exported out of Puerto Rico plus goods not produced in and exported out of Puerto Rico. The direct exports represent goods produced in and exported out of Puerto Rico. The indirect exports represent goods produced in Puerto Rico and exported out of ports in the United States. The origin of the movement is the sum of the direct exports and the indirect exports. The Foreign Trade Division of the U.S. Bureau of the Census has no similar information in the case of imports. The origin of the movement statistics are published for informative purposes only and there is no intention on behalf of the Planning Board to adopt them into the official registry of external trade statistics.Fuente: Departamento de Comercio de los EE.UU, Negociado del Censo, División de Comercio Exterior; y Junta de Planificación, Programa de Planificación Económica y Social, Subprograma de Análisis Económico.Source: U.S. Departament of Commerce, Bureau of the Census, Foreign Trade Division; and Puerto Rico Planning Board, Program of Economic and Social Planning, Subprogram of Economic Analysis.
TABLA 12 - ORIGEN DEL MOVIMIENTO DE LAS EXPORTACIONES REGISTRADAS A PAISES EXTRANJEROS: AÑOS FISCALES (CONT.)TABLE 12 - ORIGIN OF RECORDED EXPORTS' MOVEMENT TO FOREIGN COUNTRIES: FISCAL YEARS (CONT.)(En dólares - In dollars)

Junta de Planifi cación Planning Board
Estadísticas Seleccionadas del Comercio Exterior de Puerto Rico 2013 Selected Statistics on Puerto Rico’s External Trade 2013
37
GráficasGraphs

Junta de Planifi cación Planning Board
Estadísticas Seleccionadas del Comercio Exterior de Puerto Rico 2013 Selected Statistics on Puerto Rico’s External Trade 2013
38

Junta de Planifi cación Planning Board
Estadísticas Seleccionadas del Comercio Exterior de Puerto Rico 2013 Selected Statistics on Puerto Rico’s External Trade 2013
39
GRAFICA 1 - COMERCIO EXTERIOR DE PUERTO RICO: AÑOS FISCALESGRAPH 1 – PUERTO RICO’S EXTERNAL TRADE: FISCAL YEARS
(En millones de dólares – In millions of dollars)
010,00020,00030,00040,00050,00060,00070,00080,000
2004 2005 2006 2007 2008 2009 2010 2011 2012 2013
Exportaciones ajustadas - Adjusted exportsImportaciones ajustadas - Adjusted importsBalance - Balance

Junta de Planifi cación Planning Board
Estadísticas Seleccionadas del Comercio Exterior de Puerto Rico 2013 Selected Statistics on Puerto Rico’s External Trade 2013
40
GRAFICA 2 - EXPORTACIONES REGISTRADAS: AÑOS FISCALESGRAPH 2 - RECORDED EXPORTS: FISCAL YEARS
(En millones de dólares – In millions of dollars)
05,000
10,00015,00020,00025,00030,00035,00040,00045,00050,00055,000
2004 2005 2006 2007 2008 2009 2010 2011 2012 2013
Estados Unidos - United StatesPaíses extranjeros - Foreign countriesIslas Vírgenes - Virgin Islands

Junta de Planifi cación Planning Board
Estadísticas Seleccionadas del Comercio Exterior de Puerto Rico 2013 Selected Statistics on Puerto Rico’s External Trade 2013
41
GRAFICA 3 - IMPORTACIONES REGISTRADAS: AÑOS FISCALESGRAPH 3 - RECORDED IMPORTS: FISCAL YEARS
(En millones de dólares – In millions of dollars)
02,0004,0006,0008,000
10,00012,00014,00016,00018,00020,00022,00024,00026,000
2004 2005 2006 2007 2008 2009 2010 2011 2012 2013
Estados Unidos - United StatesPaíses extranjeros - Foreign countriesIslas Vírgenes - Virgin Islands

Junta de Planifi cación Planning Board
Estadísticas Seleccionadas del Comercio Exterior de Puerto Rico 2013 Selected Statistics on Puerto Rico’s External Trade 2013
42
GRAFICA 4 - BALANCE COMERCIAL: AÑOS FISCALESGRAPH 4 - TRADE BALANCE: FISCAL YEARS
(En millones de dólares – In millions of dollars)
-15,000-10,000-5,000
05,000
10,00015,00020,00025,00030,000
2004 2005 2006 2007 2008 2009 2010 2011 2012 2013
Estados Unidos - United StatesPaíses extranjeros - Foreign countriesIslas Vírgenes - Virgin Islands

Junta de Planifi cación Planning Board
Estadísticas Seleccionadas del Comercio Exterior de Puerto Rico 2013 Selected Statistics on Puerto Rico’s External Trade 2013
43
GRAFICA 5 - EXPORTACIONES REGISTRADAS A PAISES EXTRANJEROS POR REGION GEOGRAFICA TOTAL*GRAPH 5 - RECORDED EXPORTS TO FOREIGN COUNTRIES BY TOTAL GEOGRAPHIC REGION*
Año fiscal 2013 - Fiscal year 2013
América Central -Central America
2%
América del Norte -North America
3%
América del Sur -South America
2%
Asia19%
Caribe - Caribbean4%
Europa - Europe69% Otros ** - Others **
1%
* No incluye los Estados Unidos. - Does not include the United States.
** Africa, Australia y el Pacífico. - Africa, Australia and the Pacific.

Junta de Planifi cación Planning Board
Estadísticas Seleccionadas del Comercio Exterior de Puerto Rico 2013 Selected Statistics on Puerto Rico’s External Trade 2013
44
GRAFICA 6 - IMPORTACIONES REGISTRADAS A PAISES EXTRANJEROS POR REGION GEOGRAFICA TOTAL*GRAPH 6 - RECORDED IMPORTS TO FOREIGN COUNTRIES BY TOTAL GEOGRAPHIC REGION*
Año fiscal 2013 - Fiscal year 2013
América Central -Central America
1%
América del Norte -North America
6%
América del Sur -South America
8%Asia
30%
Caribe - Caribbean5%
Europa - Europe48% Otros ** - Others **
2%
* No incluye los Estados Unidos. - Does not include the United States.
** Africa, Australia y el Pacífico. - Africa, Australia and the Pacific.

Junta de Planifi cación Planning Board
Estadísticas Seleccionadas del Comercio Exterior de Puerto Rico 2013 Selected Statistics on Puerto Rico’s External Trade 2013
45
GRAFICA 7 - COMERCIO CON LOS PAISES EXTRANJEROS EN ACUERDOS COMERCIALES DE ESTADOS UNIDOS:AÑOS FISCALES
GRAPH 7 - COMMERCE WITH THE FOREIGN COUNRIES IN UNITED STATES TRADE AGREEMENTS:FISCAL YEARS
(En millones de dólares – In millions of dollars)
336.8
406.0 440.6 461.1
361.8
535.7527.9 520.3 533.5
750.8
826.8762.2
545.6602.5
437.3
1,066.4 1,055.8
1,339.3
0
200
400
600
800
1,000
1,200
1,400
2011 2012 2013 2011 2012 2013
ICC - CBI (1) RD-CAFTA - DR-CAFTA (2) TLCAN - NAFTA (3)
Exportaciones registradas - Recorded exports Importaciones registradas - Recorded imports
(1) Iniciativa para la Cuenca del Caribe: Antigua y Barbuda, Aruba, Bahamas, Barbados, Belice, Dominica, Granada, Guyana, Haití, Islas Vírgenes Británicas, Jamaica, Montserrat, Panamá, San Cristóbal y Nieves, San Vicente y las Granadinas, Santa Lucía y Trinidad y Tabago.Caribbean Basin Initiative: Antigua & Barbuda, Netherland , Aruba, Bahamas, Barbados, Belize, Dominica, Grenada, Guyana, Haiti,British Virgin Islands, Jamaica, Montserrat, Panama, Saint Christopher & Nevis, Saint Vincent & the Grenadines, Saint Lucia, and Trinidad & Tobago.
(2) Acuerdo de Libre Comercio Estados Unidos - República Dominicana-América Central: Costa Rica, El Salvador, Guatemala, Honduras, Nicaragua y República DominicanaUnited States – Dominican Republic-Central America Free Trade Agreement: Costa Rica, El Salvador, Guatemala, Honduras, Nicaragua, and Dominican Republic.
(3) Tratado de Libre Comercio de América del Norte: Canadá y México. North American Free Trade Agreement: Canada and Mexico.

Junta de Planifi cación Planning Board
Estadísticas Seleccionadas del Comercio Exterior de Puerto Rico 2013 Selected Statistics on Puerto Rico’s External Trade 2013
46
GRAFICA 8 - COMERCIO CON PAISES DE LOS ACUERDOS COMERCIALES EN AMERICA CENTRAL Y EL CARIBE: AÑOS FISCALESGRAPH 8 - COMMERCE WITH COUNTRIES OF TRADE AGREEMENTS IN CENTRAL AMERICA AND THE CARIBBEAN: FISCAL YEARS
(En millones de dólares – In millions of dollars)
481.3
258.7333.6
607.2
1,634.21,591.9
25.5 28.9 34.2
297.0
375.5370.8
173.8 150.8 147.8
454.2
304.7
525.9
0
200
400
600
800
1,000
1,200
1,400
1,600
1,800
2011 2012 2013 2011 2012 2013
Mercosur (1)Comunidad Andina de Naciones (2) - Andean Community of Nations (2)CARICOM (3)
Exportaciones registradas - Recorded exports Importaciones registradas - Recorded imports
(1) Argentina, Bolivia, Brasil, Paraguay, Uruguay y Venezuela. - Argentina, Bolivia, Brazil, Paraguay, Uruguay, and Venezuela.
(2) Bolivia, Colombia, Ecuador y Perú . - Bolivia, Colombia, Ecuador, and Peru.
(3) Antigua y Barbuda, Bahamas, Barbados, Belice, Dominica, Granada, Guyana, Haití, Jamaica, Montserrat, San Cristóbal y Nieves, San Vicente y las Granadinas, Santa Lucía, Suriname, y Trinidad y Tabago.
Antigua & Barbuda, Bahamas, Barbados, Belize, Dominica, Grenada, Guyana, Haiti, Jamaica, Montserrat, Saint Christopher & Nevis, Saint Vincent & the Grenadines, Saint Lucia, Suriname
and Trinidad & Tobago.

Junta de Planifi cación Planning Board
Estadísticas Seleccionadas del Comercio Exterior de Puerto Rico 2013 Selected Statistics on Puerto Rico’s External Trade 2013
47
GRAFICA 9 - COMERCIO CON LOS PAISES DE LA UNION EUROPEA: AÑOS FISCALESGRAPH 9 - TRADE WITH THE EUROPEAN UNION COUNTRIES: FISCAL YEARS
(En millones de dólares – In millions of dollars)
12,6
02.6
10,8
47.9
11,9
61.8
11,0
31.0
11,8
35.7
11,1
09.7
2,000
4,000
6,000
8,000
10,000
12,000
14,000
16,000
2011 2012 2013 2011 2012 2013
Exportaciones registradas - Recorded exports Importaciones registradas - Recorded imports
Alemania, Austria, Bélgica, Bulgaria, Chipre, Croacia, Dinamarca, Eslovenia, España, Estonia, Finlandia, Francia, Grecia, Hungría, Irlanda, Italia, Letonia, Lituania,
Luxemburgo, Malta, Países Bajos (Holanda), Polonia, Portugal, Reino Unido, República Checa, República Eslovaca, Rumania y Suecia.
Germany, Austria, Belgium, Bulgaria, Cyprus, Croatia, Denmark, Slovenia, Spain, Estonia, Finland, France, Greece, Hungary, Ireland, Italy, Latvia, Lithuania,
Luxembourg, Malta, Netherlands, Poland, Portugal, United Kingdom, Czech Repubilc, Slovak Republic, Romania, and Sweden.

Junta de Planifi cación Planning Board
Estadísticas Seleccionadas del Comercio Exterior de Puerto Rico 2013 Selected Statistics on Puerto Rico’s External Trade 2013
48
GRAFICA 10 - COMERCIO CON LOS PAISES DE LAS ORGANIZACIONESINTERNACIONALES SELECCIONADAS: AÑOS FISCALES
GRAPH 10 - TRADE WITH COUNTRIES OF SELECTEDINTERNATIONAL ORGANIZATIONS: FISCAL YEARS
(En millones de dólares – In millions of dollars)
50,3
11.1
46,3
90.3
48,9
47.0
28,0
18.4
28,2
36.8
29,1
95.1
53,9
28.7
49,4
15.7
52,3
67.4
27,2
84.8
26,5
90.5
27,5
15.0
60,6
30.6
55,5
10.5 53
,082
.3
34,9
89.5
34,8
60.0
34,6
17.5
10,000
15,000
20,000
25,000
30,000
35,000
40,000
45,000
50,000
55,000
60,000
65,000
2011 2012 2013 2011 2012 2013
FCEAP - APEF (1) G-20 (2) OCDE - OECD (3)
Exportaciones registradas - Recorded exports Importaciones registradas - Recorded imports
(1) Foro de Cooperación Económica Asia-Pacífico: Australia, Brunei Darusalaam, Canadá, Chile, China (Taiwán), China (Rep. Popular de), Corea (Rep. de), Estados Unidos, Filipinas, Hong Kong,
Indonesia, Japón, Malasia, México, Nueva Zelanda, Papua Nueva Guinea, Perú, Rusia, Singapur, Tailandia y Vietnam.
Asia-Pacific Economic Forum: Australia, Brunei Darusalaam, Canada, Chile, China (Taiwan), China (People's Rep. of), Korea (Rep. of), United States, Philippines, Hong Kong,
Indonesia, Japan, Malaysia, Mexico, New Zealand, Papua New Guinea, Perú, Russia, Singapore, Thailand, and Vietnam.
(2) Grupo de los Veinte: Alemania, Arabia Saudita, Argentina, Australia, Brasil, Canadá, China (Rep. Popular de), Corea (Rep. de), Estados Unidos, Francia, India, Indonesia, Italia, Japón, México,
Reino Unido, Rusia, Sudáfrica (Rep. de) y Turquía.
Ground of Twenty: Germany, Saudi Arabia, Argentina, Australia, Brazil, Canada, China (People's Rep. of), Korea (Rep. of), United States, France, India, Indonesia, Italy, Japan, Mexico, United Kingdom,
Russia, South Africa (Rep. of), and Turkey.
(3) Organización para la Cooperación y Desarrollo Económico: Alemania, Australia, Austria, Bélgica, Canadá, Chile, Corea (Rep. de), Dinamarca, Eslovenia, España, Estados Unidos, Estonia, Finlandia, Francia, Grecia,
Hungría, Irlanda, Islandia, Israel, Italia, Japón, Luxemburgo, México, Noruega, Nueva Zelanda, Países Bajos (Holanda), Polonia, Portugal, Reino Unido, Rep. Checa, Rep. Eslovaca, Suecia ,Suiza y Turquía.
Organization for Economic Cooperation and Development: Germany, Australia, Austria, Belgium, Canada, Chile, Korea (Rep. of), Denmark, Slovenia, Spain, United States, Estonia, Finland, France, Greece, Hungary,
Ireland, Iceland, Israel, Italy, Japan, Luxembourg, Mexico, Norway, New Zealand, Netherlands, Poland, Portugal, United Kingdom, Czech Rep., Slovak Rep., Sweden, Switzerland, and Turkey.

Junta de Planifi cación Planning Board
Estadísticas Seleccionadas del Comercio Exterior de Puerto Rico 2013 Selected Statistics on Puerto Rico’s External Trade 2013
49
GRAFICA 11 - PRINCIPALES EXPORTACIONES REGISTRADAS* POR SISTEMA DE CLASIFICACION INDUSTRIAL DE AMERICA DEL NORTE (SCIAN): AÑOS FISCALES
GRAPH 11 - MAIN RECORDED EXPORTS* BY NORTH AMERICAN INDUSTRIAL CLASSIFICATION (NAICS): FISCAL YEARS
(En millones de dólares – In millions of dollars)
05,000
10,00015,00020,00025,00030,00035,000
2006 2007 2008 2009 2010 2011 2012 2013
SCIAN - NAICS 325411 SCIAN - NAICS 325412 SCIAN - NAICS 325414
•De acuerdo al año fiscal 2013 - According to fiscal year 2013.
325411: Drogas y vitaminas medicinales y botánicas - Medicinal and botanical drugs and vitamins.
325412: Preparados farmacéuticos - Pharmaceutical preparations.
325414: Productos biológicos, excepto de diagnóstico - Biological products, except diagnostic.
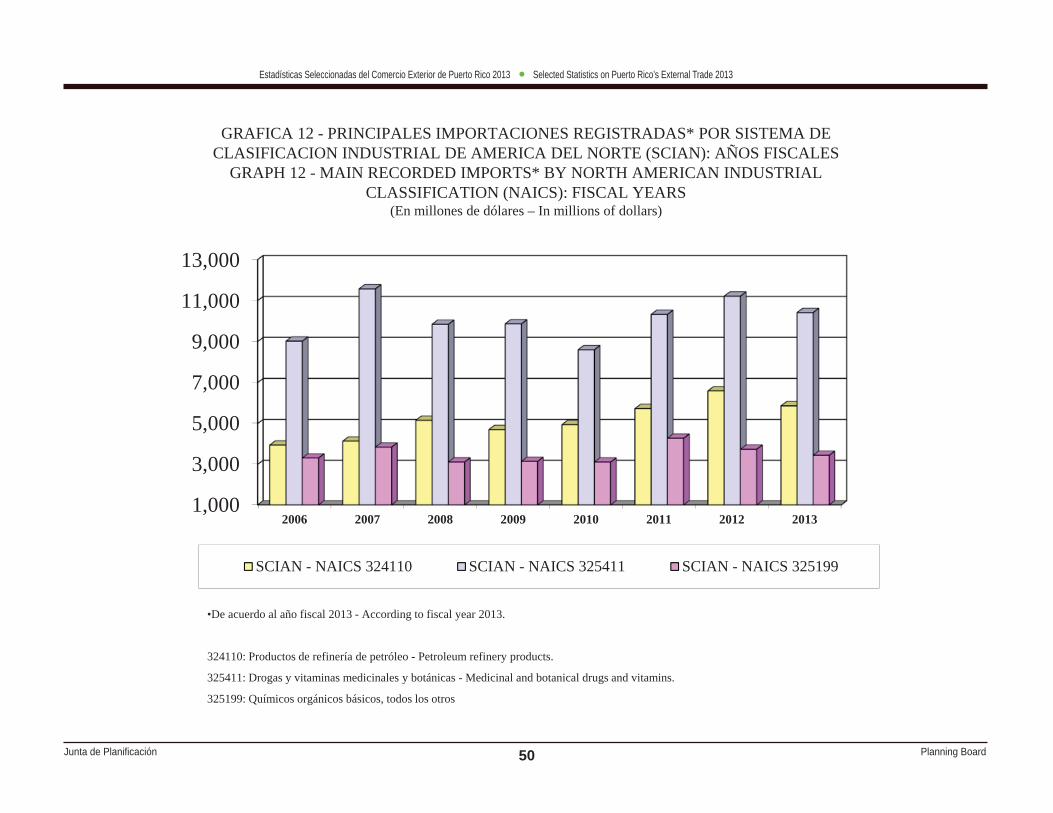
Junta de Planifi cación Planning Board
Estadísticas Seleccionadas del Comercio Exterior de Puerto Rico 2013 Selected Statistics on Puerto Rico’s External Trade 2013
50
GRAFICA 12 - PRINCIPALES IMPORTACIONES REGISTRADAS* POR SISTEMA DE CLASIFICACION INDUSTRIAL DE AMERICA DEL NORTE (SCIAN): AÑOS FISCALES
GRAPH 12 - MAIN RECORDED IMPORTS* BY NORTH AMERICAN INDUSTRIAL CLASSIFICATION (NAICS): FISCAL YEARS
(En millones de dólares – In millions of dollars)
1,000
3,000
5,000
7,000
9,000
11,000
13,000
2006 2007 2008 2009 2010 2011 2012 2013
SCIAN - NAICS 324110 SCIAN - NAICS 325411 SCIAN - NAICS 325199
•De acuerdo al año fiscal 2013 - According to fiscal year 2013.
324110: Productos de refinería de petróleo - Petroleum refinery products.
325411: Drogas y vitaminas medicinales y botánicas - Medicinal and botanical drugs and vitamins.
325199: Químicos orgánicos básicos, todos los otros

Junta de Planifi cación Planning Board
Estadísticas Seleccionadas del Comercio Exterior de Puerto Rico 2013 Selected Statistics on Puerto Rico’s External Trade 2013
51
GRAFICA 13 - IMPORTACIONES REGISTRADAS DE PAISES EXTRANJEROS POR TRATO ARANCELARIOGRAPH 13 - RECORDED IMPORTS FROM FOREIGN COUNTRIES BY TARIFF TREATMENT
Año fiscal 2013 – Fiscal year 2013
Acuerdo de Comercio en Productos Farmacéuticos - Agreement on Trade in Pharmaceutical Products
41%
Nación Más Favorecida -Most Favored Nation
50%
Acuerdo de Libre Comercio Estados Unidos - República Dominicana -América Central United
States - Dominican Republic - Central
America Free Trade Agreement
2%
Tratado de Libre Comercio de América del Norte - North American Free Trade Agreement
4%
Otros * - Others *3%
•Ver Tabla 5 – See Table 5.

Junta de Planifi cación Planning Board
Estadísticas Seleccionadas del Comercio Exterior de Puerto Rico 2013 Selected Statistics on Puerto Rico’s External Trade 2013
52
GRAFICA 14 - CLASIFICACION ECONOMICA DE LAS IMPORTACIONES REGISTRADAS: AÑOS FISCALES
GRAPH 14 - ECONOMIC CLASSIFICATION OF RECORDED IMPORTS: FISCAL YEARS(En millones de dólares – In millions of dollars)
05,000
10,00015,00020,00025,00030,00035,00040,00045,00050,000
2004 2005 2006 2007 2008 2009 2010 2011 2012 2013
Materia prima y productos intermedios - Raw material and intermediate goods
Bienes de capital - Capital goods
Artículos de consumo - Consumer goods

Junta de Planifi cación Planning Board
Estadísticas Seleccionadas del Comercio Exterior de Puerto Rico 2013 Selected Statistics on Puerto Rico’s External Trade 2013
53
GRAFICA 15 - CLASIFICACION ECONOMICA DE LAS IMPORTACIONES AJUSTADAS *: AÑOS FISCALESGRAFICA 15 - CLASIFICACION ECONOMICA DE LAS IMPORTACIONES AJUSTADAS *: FISCAL YEARS
(En millones de dólares – In millions of dollars)
05,000
10,00015,00020,00025,00030,00035,00040,00045,00050,00055,000
2004 2005 2006 2007 2008 2009 2010 2011 2012 2013
Materia prima y productos intermedios - Raw material and intermediate goods
Bienes de capital - Capital goods
Artículos de consumo - Consumer goods
* Al valor de las importaciones de mercancía registrada se le hacen ajustes por concepto de: paquetes postales, equipo de oficina para alquiler, películas
cinematográficas, mercancía devuelta, mercancía sin registrar, automóviles y derechos de igualación de costos de las refinerías de petróleo y nafta.
* Recorded merchandise imports are adjusted by: parcel post, office equipment for rent, motion picture films, returned merchandise, unrecorded
merchandise, automobiles, and crude oil and naphtha entitlements.

Junta de Planifi cación Planning Board
Estadísticas Seleccionadas del Comercio Exterior de Puerto Rico 2013 Selected Statistics on Puerto Rico’s External Trade 2013
54