selecting the solutioncuyahoga.qualitycampus.com/guides/com_000_01873.pdf · 2020-03-05 · pugh...
TRANSCRIPT

1
Online Student Guide
OpusWorks 2019, All Rights Reserved
Selecting the Solution

2
Table of Contents
LEARNING OBJECTIVES ....................................................................................................................................3
INTRODUCTION ..................................................................................................................................................3 SELECTING A SOLUTION................................................................................................................................................................ 3 ROI .................................................................................................................................................................................................... 3 CLASSIFYING SAVINGS ................................................................................................................................................................... 3 GENERATING SOLUTIONS ............................................................................................................................................................. 4 BRAINSTORMING/AFFINITY DIAGRAM ..................................................................................................................................... 4 NOMINAL GROUP TECHNIQUE .................................................................................................................................................... 5 CURRENT REALITY TREE ............................................................................................................................................................. 5 FUTURE REALITY TREE ................................................................................................................................................................ 6 POTENTIAL SOLUTION TABLE ..................................................................................................................................................... 7 BENEFIT/EFFORT MATRIX .......................................................................................................................................................... 8
PUGH MATRIX .....................................................................................................................................................8 PUGH MATRIX - EVALUATING SOLUTIONS ............................................................................................................................... 8 PUGH MATRIX - IMPORTANCE RATING & CONCEPT SELECTION ........................................................................................ 9 PUGH MATRIX - SUM OF POSITIVES ........................................................................................................................................... 9 PUGH MATRIX - SUM OF NEGATIVES ......................................................................................................................................... 9 PUGH MATRIX - SUM OF SAMES............................................................................................................................................... 10 PUGH MATRIX - WEIGHTED SUM ............................................................................................................................................ 10
RISK ASSESSMENT .......................................................................................................................................... 11 RISK ASSESSMENT - FORCE FIELD ANALYSIS ....................................................................................................................... 11 RISK ASSESSMENT - SOLUTION ANALYSIS ............................................................................................................................ 11 RISK ASSESSMENT – FMEA ..................................................................................................................................................... 12 IMPLEMENTATION PLAN ........................................................................................................................................................... 13
© 2019 by OpusWorks. All rights reserved. August, 2019
Terms of Use
This guide can only be used by those with a paid license to the corresponding course in the e-Learning curriculum produced and distributed by OpusWorks. No part of this Student Guide may be altered, reproduced, stored, or transmitted in any form by any means without the prior written permission of OpusWorks.
Trademarks
All terms mentioned in this guide that are known to be trademarks or service marks have been appropriately capitalized.
Comments
Please address any questions or comments to your distributor or to OpusWorks at [email protected].

3
Learning Objectives
Upon completion of this course, student will be able to:
• Examine the process of selecting a solution for an improvement project • Discuss how potential savings affect a project’s Return On Investment (or ROI) • Describe the purpose and application of common tools used to generate and analyze potential
solutions and to assess risk • Explain how all these components come together in the implementation plan
Introduction
Selecting a Solution
During the Define, Measure, and Analyze phases of an improvement project, the team does a lot of work to assess process problems. All its work comes together during the Improve phase. First, the team uses the information gathered to creatively generate potential solutions. It then evaluates the alternate solutions, assesses the risks, and makes its selection. Once it has selected a solution, the team must develop a solid implementation plan and be ready to address any organizational resistance that may occur.
ROI
A project’s ROI, which is its savings divided by its costs, is a key factor in selecting a solution. But accurately measuring a project’s ROI is not always easy. More often than not, teams underestimate it by failing to accurately quantify all benefits or savings.
Remember, project savings can come in many forms, including cost reduction, incremental revenue, and cost avoidance. To accurately estimate a project’s ROI, the team must capture all the potential savings. When calculating project cost, it should look at such things as personnel, technology, supplies, and facilities used to develop and implement the project plan.
Next, we will examine two types of savings.
Classifying Savings
Savings can be classified into two main categories, “hard” savings and “soft” savings. Let’s take a look at each.
Hard savings are savings that have a direct impact on an organization’s bottom line. A reduction of rework by ten percent is an example of a hard savings.

4
Soft savings are savings that are non-tangible. Being non-tangible, however, does not make them any less important than hard savings. Things like cost avoidance, or saving a portion of a person’s time without reducing the expense associated with that time are examples of non-tangible savings. Increased customer satisfaction is an example of a soft savings. It may not directly affect a project’s ROI calculation, but without it an organization will not be competitive in the marketplace because it will lose market share and revenue will decrease.
Generating Solutions
The team’s first step toward selecting a solution is to generate ideas for potential solutions. To prepare, the team gathers the essential process information it documented during the Define, Measure, and Analyze phases of the improvement project. Documentation may include such things as process maps, Cause and Effect diagrams, and Failure Mode and Effect Analysis (or FMEA) forms.
This information, along with project goals, performance targets, customer requirements, benchmarking ideas, discoveries made during the analysis, and best practices, contribute to a good body of knowledge for generating ideas.
The team may use several tools, such as brainstorming, Nominal Group Technique (or NGT), and the Future Reality Tree to accumulate ideas and form workable solutions. Next, we will examine these tools in more detail.
Brainstorming/Affinity Diagram
When generating ideas for potential solutions, the team must look for ways to get maximum benefit from its actions. Brainstorming is an effective technique for sparking creative thinking and generating innovative ideas.
During a brainstorming session, the team should follow some key guidelines. First, it should clarify the objectives of the brainstorming activity to ensure everyone knows the intended outcome. When assembling the brainstorming group, the team should include other people and stakeholders who have an interest in the process. During the session, participants
should not judge, criticize, or comment on ideas. Rather, they should listen to and build on the ideas of others, abandon assumptions, and think of new ideas.
Once the team has created its list of ideas for improving the process, its next challenge is to turn the ideas into real solutions.
5
To begin, the team narrows down the list of potential solutions, combines them with others, and redefines them as needed. To do this, the team uses an Affinity Diagram and multi-voting techniques, such as the Nominal Group Technique (NGT).
Nominal Group Technique
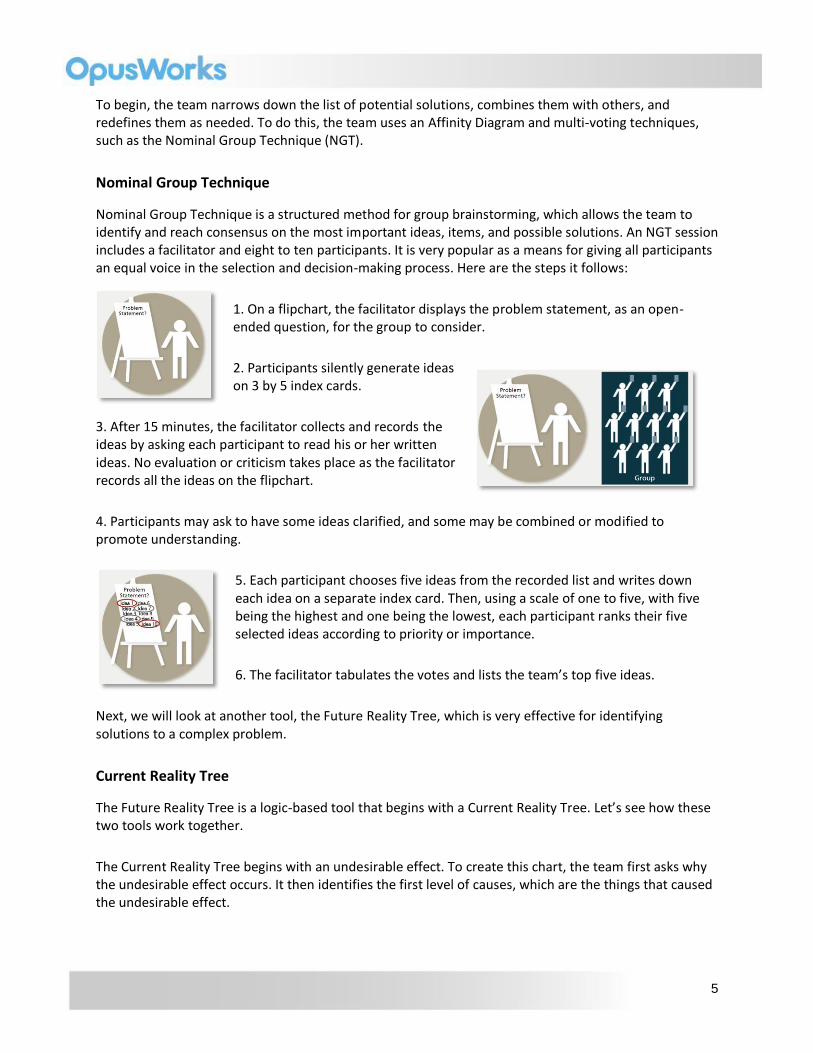
Nominal Group Technique is a structured method for group brainstorming, which allows the team to identify and reach consensus on the most important ideas, items, and possible solutions. An NGT session includes a facilitator and eight to ten participants. It is very popular as a means for giving all participants an equal voice in the selection and decision-making process. Here are the steps it follows:
1. On a flipchart, the facilitator displays the problem statement, as an open-ended question, for the group to consider.
2. Participants silently generate ideas on 3 by 5 index cards.
3. After 15 minutes, the facilitator collects and records the ideas by asking each participant to read his or her written ideas. No evaluation or criticism takes place as the facilitator records all the ideas on the flipchart.
4. Participants may ask to have some ideas clarified, and some may be combined or modified to promote understanding.
5. Each participant chooses five ideas from the recorded list and writes down each idea on a separate index card. Then, using a scale of one to five, with five being the highest and one being the lowest, each participant ranks their five selected ideas according to priority or importance.
6. The facilitator tabulates the votes and lists the team’s top five ideas.
Next, we will look at another tool, the Future Reality Tree, which is very effective for identifying solutions to a complex problem.
Current Reality Tree
The Future Reality Tree is a logic-based tool that begins with a Current Reality Tree. Let’s see how these two tools work together.
The Current Reality Tree begins with an undesirable effect. To create this chart, the team first asks why the undesirable effect occurs. It then identifies the first level of causes, which are the things that caused the undesirable effect.

6
Next, the team tests each cause by putting it into the sentence, “if CAUSE, then EFFECT.” It uses this technique to identify additional causes and conditional causes until the statement is correct all the time.
The team continues to brainstorm the causes and conditional causes until it gets to the root causes. Recall that a root cause is the lowest point in the cause-and-effect chain that can be affected by human interaction. Let’s look at an example.
Here, the team is analyzing a process where a part in stock was labeled with the wrong part number. It identifies the first level of causes as “Labeled wrong at supplier” and “No incoming inspection or verification.”
It then drills down into the cause-and-effect chain to see why the part was incorrectly labeled. It arrives at the following two root causes: 1) The buyers maintain their own specification files; and 2) There is no formal specification change process. Similarly, the team drills down the other branch of the Current Reality Tree to see why there was no incoming inspection or verification. It identifies the root cause as, “Commodity parts do not require inspection.”
Future Reality Tree
With the Current Reality Tree complete, the team moves on to the Future Reality Tree. The intent of the Future Reality Tree is is to turn the undesirable effect into a desirable effect. It is similar in structure to the Current Reality Tree, but with new proposed actions, policies, and behaviors injected into it. It creates a vision of the “future reality” of the system, which can be demonstrated logically. In order for the future to unfold differently from the present, some change in what’s currently happening must be initiated.
Let’s continue with our previous example to see how to create the Future Reality Tree.
First the team begins by rewording the undesirable effect into a desired effect. In this case, "Part in stock labeled with wrong part number” is rewritten as “Parts in stock are labeled correctly.”
The team begins at the bottom of the diagram and defines actions, or injections, which will eliminate the root causes. They decide that creating a central filing point for specs would ensure that buyers draw specs from central files and

7
do not maintain their own files. This injection is inserted into the chart which changes the current reality to “Buyers draw specs from central files”. It also inserts an injection to implement a notification and distribution process.
With both of these injections in place the team determines if next level will be changed into a desirable condition. In this case there is still a risk that the wrong spec could be included with the purchase order, so the team includes another injection to assign a person responsible to ensure the file system is up to date. If the correct specs are included with the purchase order, then the supplier will have up-to-date specifications.
This activity of inserting injections where needed and rewording the current situation continues upward towards the desired effect. Each successive layer of effects should move you closer to your desired effect of parts in stock being labeled correctly.
Potential Solution Table
Once the team has identified all injections, it lists them in a Potential Solution table. It then rates each one according the the benefit it can bring and the effort it will require in terms of time, cost, and resources.
In this example, the team lists the three injections detailed previously, along with a few others, and rates each for Effort and Benefit. Using a scale of one to nine, the team uses midpoint scores of two, five, and eight for low, medium, and high respectively, unless more resolution is needed. If you look at item number two, for example, you will see a score of four for Effort, rather than a midpoint score. That’s because the team got into a discussion about the amount of effort needed to create a central filing point for specs. It came to a consensus that a low-medium score of four would be most appropriate. Similarly, additional resolution was needed to score the Benefit for item number two and the Effort for item number three.

8
Benefit/Effort Matrix
After completing the Potential Solution table, the team creates a Benefit/Effort Matrix. This tool is used for comparing the benefit versus the effort of each potential solution.
The team uses the information from the Potential Solutions chart to create the Benefit/Effort Matrix. It takes the numbers assigned to each solution and plots them according to their Benefit and Effort score. As you can see, the graph is divided into three zones. The first zone represents “quick wins.” These are highly desirable opportunities that require fairly low effort in relation to the benefits. The second zone represents desirable opportunities, which are high impact, but could involve more complex processes. The third zone represents the opportunities that are least desirable, due to high effort and low benefit.
Pugh Matrix
Pugh Matrix - Evaluating Solutions
Once the team has generated a list of potential solutions, its next step is to determine which solutions are most practical to implement. The Pugh Matrix is helpful for evaluating solutions. It is a type of Solution Design Matrix that shows how alternative solutions compare with the existing process in meeting defined criteria.
In this example, the team is using a Pugh Matrix to compare its existing process with a proposed new design and a benchmark design used by XYZ Company. To create the matrix, the team lists each design in one of the columns across the top. In the first column, it lists the key criteria it gathered from the project charter, process map, fishbone diagram, and other tools.

9
The last column shows the importance rating of each of the key criteria items. In this example, the team has established a rating scale of one to five, with one being not important and five being very important. Next, the team fills in these values.
Pugh Matrix - Importance Rating & Concept Selection
To begin, the team rates the existing design, or status quo, by assigning zeros for all criteria. This is the baseline to which it will compare all other designs. Next, for each of the other designs listed, the team rates each criteria as better, same, or worse than the existing design, using the legend of plus one, zero, and minus one, respectively.
Once the team has completed the ratings, the next step is to compile the data.
Pugh Matrix - Sum of Positives
The team uses the bottom section of the matrix to compile the data. To begin, it completes the Sum of Positives row by adding all the plus ones under each design. In this example, the Sum of Positives for the new design is three; for the XYZ design, it is two. Because all criteria for the existing design are assigned a value of zero, its Sum of Positives will also be zero. For each design, the team enters the Sum of Positives in the space provided.
Pugh Matrix - Sum of Negatives
Next, the team completes the Sum of Negatives row by adding all the negative ones for each design and entering the values in the space provided. Note that this number will be a negative sum. For example, the Sum of Negatives for the new design is negative two, and for the XYZ design, it is negative one. Again, the existing design will have a value of zero.

10
Pugh Matrix - Sum of Sames
The team completes the Sum of Sames in the same way, counting the number of zeros for each design. It enters one for the new design and three for the XYZ design. For the existing design, it enters a value of six.
Pugh Matrix - Weighted Sum
The team has now completed the Sum of Positives, Sum of Negatives, and Sum of Sames for each design. However, it still does not have enough data to determine which design is better. To make this determination, the team cannot simply look at the the Sum of Positives and Negatives for each design. That’s because not all the criteria have the same level of importance. To determine which design is the best, it needs to analyze the data in relation to the Importance Ratings. To do this, the team computes the Weighted Sum of Positives and the Weighted Sum of Negatives. Let’s see how this works.
To compute the Weighted Sum of Positives for each design, the team multiplies each plus one in the design’s column by the Importance Rating of the corresponding criteria. It then adds up the total. For example, to calculate the Weighted Sum of Positives for the new design, the team takes the plus one from the Supplier Delivery Time criteria, and multiplies it by its Importance Rating of four. One times four equals four.
Then it goes to the next plus one, for Customer Name 100% Complete, and multiplies it by the Importance Rating of three. One times three equals three. It does the same for the plus one of Customer Experience. One times four equals four. Adding these three totals together, the team arrives at a Weighted Sum of Positives of eleven. It enters this value in the space provided.
The team repeats these steps for the XYZ design, arriving at a value of nine. It enters nine in the space provided.

11
For the Existing Design, the team enters a value of zero. The team computes the Weighted Sum of Negatives in the same way. It multiplies the Importance Rating times each negative one, and sums up the total. It computes the totals for each design, and enters negative ten for the new design; zero for the existing design; and negative two for the XYZ design.
Risk Assessment
Risk Assessment - Force Field Analysis
Up to now, the team has used a variety of tools and techniques to generate ideas and analyze potential solutions. Now the time has come to select the best solution to optimize the process and maximize ROI. Now we will look at three valuable tools the team can use to assess risk. We begin with Force Field Analysis.
Force Field Analysis helps the team make decisions and evaluate the pros and cons of a situation or a proposal. It helps the team analyze the forces for and against a change in order to determine the best course of action. Let’s see how it works.
Using a white board or flip chart, the team describes its plan or proposal for change in a box in the middle. It lists the Forces For Change in a column on the left side, and the Forces Against Change in a column on the right. Force Field Analysis is a good brainstorming tool. It helps the team understand and strengthen the forces for change and evaluate and reduce, or eliminate, the forces against change.
Risk Assessment - Solution Analysis
For a more detailed look at potential solutions, the team can use Solution Analysis. To create this chart, the team lists the solutions, plans, actions, or tasks. For each one, it identifies potential problems and likely causes, along with preventive actions and contingent actions. Preventive actions eliminate the problem, while contingent actions are used when the problem occurs or could occur and must be avoided.

12
In this example, part of the project solution is to implement a new remote client in a call center. The team identifies potential problems, then ranks them for severity and likelihood. The likely causes, preventive actions, and contingent actions it identifies will help the team determine the actions needed for a smooth implementation.
Risk Assessment – FMEA
Failure Mode and Effect Analysis (or FMEA) is another helpful tool for assessing risk. It is useful for more complex processes, when a check or inspection activity is included. For example, it is often used in manufacturing to assess risks of a new or redesigned process.
13
Implementation Plan
Once the team has selected the solution, it must compile the results and create an implementation plan. Implementation involves executing the process improvements developed throughout the life of the project. The implementation plan is a communications tool that clearly describes the new or changed process to stakeholders and the rest of the organization. It provides details about what it is, why it is needed, how the change will be implemented, and expected outcomes. Let’s take a look at the components of the plan.
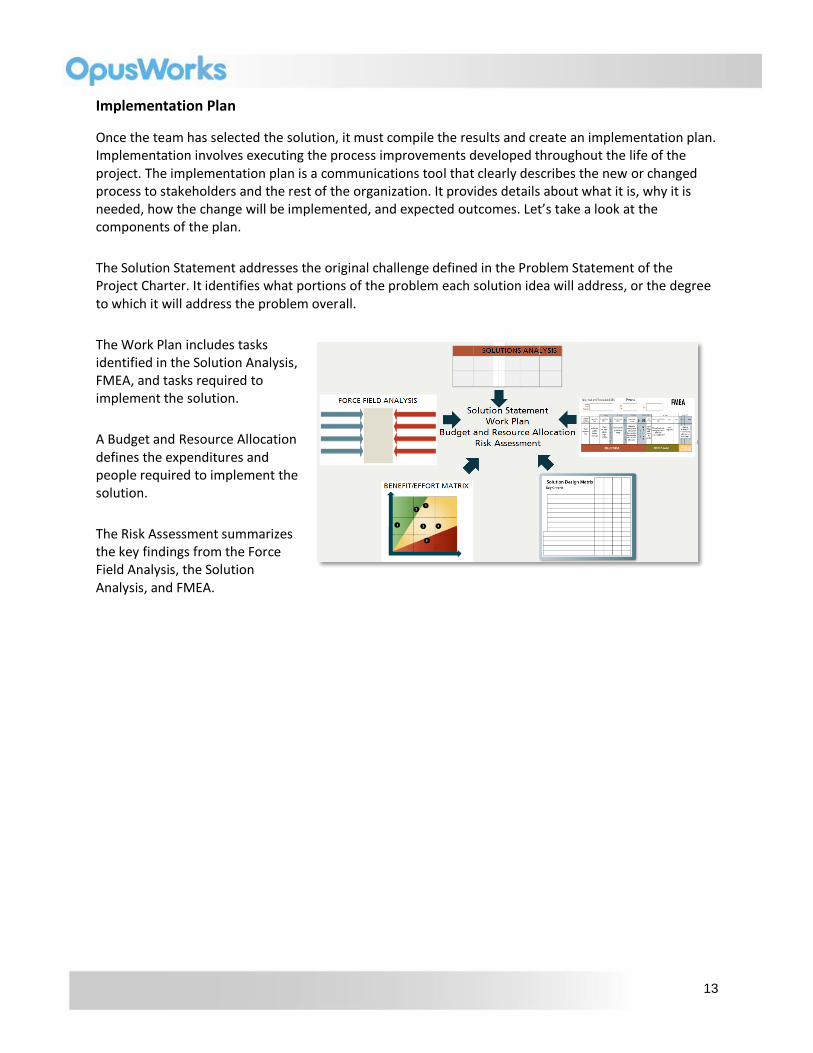
The Solution Statement addresses the original challenge defined in the Problem Statement of the Project Charter. It identifies what portions of the problem each solution idea will address, or the degree to which it will address the problem overall.
The Work Plan includes tasks identified in the Solution Analysis, FMEA, and tasks required to implement the solution.
A Budget and Resource Allocation defines the expenditures and people required to implement the solution.
The Risk Assessment summarizes the key findings from the Force Field Analysis, the Solution Analysis, and FMEA.