selective attention in exchange rate forecasting
TRANSCRIPT

8901 2021 February 2021
Selective Attention in Exchange Rate Forecasting Svatopluk Kapounek, Zuzana Kučerová, Evžen Kočenda
Impressum:
CESifo Working Papers ISSN 2364-1428 (electronic version) Publisher and distributor: Munich Society for the Promotion of Economic Research - CESifo GmbH The international platform of Ludwigs-Maximilians University’s Center for Economic Studies and the ifo Institute Poschingerstr. 5, 81679 Munich, Germany Telephone +49 (0)89 2180-2740, Telefax +49 (0)89 2180-17845, email [email protected] Editor: Clemens Fuest https://www.cesifo.org/en/wp An electronic version of the paper may be downloaded · from the SSRN website: www.SSRN.com · from the RePEc website: www.RePEc.org · from the CESifo website: https://www.cesifo.org/en/wp
CESifo Working Paper No. 8901
Selective Attention in Exchange Rate Forecasting
Abstract We analyze the exchange rate forecasting performance under the assumption of selective attention. Although currency markets react to a variety of different information, we hypothesize that market participants process only a limited amount of information. Our analysis includes more than 100,000 news articles relevant to the six most-traded foreign exchange currency pairs for the period of 1979–2016. We employ a dynamic model averaging approach to reduce model selection uncertainty and to identify time-varying probability to include regressors in our models. Our results show that smaller sizes models accounting for the presence of selective attention offer improved fitting and forecasting results. Specifically, we document a growing impact of foreign trade and monetary policy news on the euro/dollar exchange rate following the global financial crisis. Overall, our results point to the existence of selective attention in the case of most currency pairs. JEL Codes: F330, G410, C110. Keywords: exchange rate, selective attention, news, forecasting, dynamic model averaging.
Svatopluk Kapounek Department of Finance
Mendel University Brno / Czech Republic [email protected]
Zuzana Kučerová Department of Finance
Mendel University Brno / Czech Republic
Evžen Kočenda Institute of Economic Studies
Charles University Prague / Czech Republic
[email protected] We benefited from comments and suggestions made by Jesus Crespo-Cuaresma, Makram El-Shagi, Jarko Fidrmuc, Tomáš Holub, Roman Horváth, an anonymous referee, and participants of several presentations. The research support by the Czech Science Foundation grant No. 20-11769S is gratefully acknowledged. Kočenda ackowledges hospitality of the Kyoto Institute of Economic Research. The usual disclaimer applies.

1. Introduction
The drivers of movements in exchange rates have been the subject of intensive research
since the collapse of the Bretton Woods system (Dornbusch, 1976; Frenkel, 1976; Bilson,
1978; Frankel, 1979 and 1984; Taylor, 1995; Frankel and Rose, 1995) and economic
fundamentals, along with supply and demand forces, were often shown to be the primary
influence in this regard (Engel and West, 2005) when compared with a random walk
(Meese and Rogoff, 1983). Advancements in modeling and estimation techniques along
with data availability further brought attention to new explanatory variables such as news,
sentiment, uncertainty, and online searches (Bloom, 2009 and 2014; Égert and Kočenda,
2014; Jurado et al., 2015; Caporale et al., 2017; Kočenda and Moravcová, 2018;
Wilcoxson et al., 2020).
We target this particular area and contribute to the debate by exploring how
variances in exchange rates can be better explained by focusing on attention that market
players pay to specific events or policy changes resulting from news announcements.
Furthermore, we also argue that the sheer amount of news available creates information
overload and the focus of market participants becomes selective (Akerlof, 1991; Carr,
2004; Galai and Sade, 2006; Karlsson et al., 2009).
In the spirit of Kahneman (1973), and based on the prediction performance of our
model, our model-driven evidence approach suggests that attention is selective when we
narrow our variable set to predictors evidenced as being informative. Both issues are
addressed in more detail in the literature review, where they are put into perspective
alongside existing theoretical and empirical works. Based on analyzing the exchange rates
between the key world currencies and a very large set of explanatory variables, we show
that models of smaller sizes with selected types of variables offer better forecast
performance than larger models. In this respect, selective attention is shown to play an
important role. The above approach as well as results represent the key novelties with
which we contribute to the related literature.
In our analysis, we accentuate the issue of information overload and hypothesize
that economic agents are overwhelmed by the extent of information they receive,
primarily from online sources. Market participants use various channels and devices to
obtain information but concurrently, they are equipped with only limited attention and a
restricted ability to process data, as noted by Shannon (1948) and, more recently, by Sims
(2003, 2006). Festré and Garrouste (2015) discussed the selective attention psychology

that leads to less than optimal outcomes. However, empirical research incorporating the
notion of a limited amount of information being accepted by market participants is
limited.1
For our analysis, we chose the exchange rates between the United States dollar
(USD) and the Australian dollar (AUD), Canadian dollar (CAD), British pound (GBP),
Euro (EUR), Japanese yen (JPY), and New Zealand dollar (NZD). Our selection was
motivated by the fact that these currencies represent the entire foreign exchange (FOREX)
market well, since they are globally the most actively traded currencies and have for a set
time accounted for more than two-thirds of the global FOREX turnover by currency pair
(BIS, 2016; Antonakakis, 2012). These currencies also experience substantial volatility
and asymmetry spillovers in their propagation (Baruník et al., 2017) and are, thus, good
representatives for analyzing large exchange rate movements and the factors influencing
them.
We hypothesize that large exchange rate fluctuations can, to a significant extent,
be explained by reactions stemming from the attention paid to news announcements. To
do so, we constructed several indices based on more than 100,000 published news articles
about economic activity, monetary policy, price development, and foreign trade related
to the countries representing selected currency pairs. Furthermore, we used Google
queries to capture the extent of attention paid to news relevant to our selected currencies.
Finally, we used the Chicago Board Options Exchange (CBOE) volatility index (VIX) as
a measure of uncertainty present in the market.
We contribute to the literature in two specific ways. First, in our empirical
assessment, we explore differences in exchange rate forecasting performance between
models containing only macroeconomic fundamentals and those that include factors
related to attention. We also employ different estimation techniques (time-varying
parameter vector auto-regressive (TVP-VAR) model, dynamic model averaging (DMA),
and dynamic model selection (DMS)) and perform several robustness checks. Second,
based on this approach, we provide robust evidence that considering selective attention
improves forecasting results. Our results delivered several detailed findings but some
1 From a psychological point of view, there is room for discussion about selective attention when economic agents decide to accept only a limited amount of information. Such a decision does not lead to optimal behaviour and the agents involved instead behave inattentively. For a detailed review of theoretical and empirical papers concerning the economics of attention, see Festré and Garrouste (2015).

specific outcomes stood out; e.g., interest rate differential exhibited a decreasing impact
on most of the currency pairs, while portfolio rebalancing after the global financial crisis2
(GFC), represented by stock returns, influenced only the USD, Euro, and the AUD. The
Euro/USD exchange rate reacted sensitively to news articles about foreign trade and
monetary policy issues. Overall, however, our results point to the existence of selective
attention in the case of the all analyzed currency pairs.
The remainder of this paper is structured as follows. Section two reviews the
literature concerning determinants of exchange rate movements and selective attention.
Section three introduces data and the methods used. Section four compares differences
and estimation errors between our basic and attention models, and time-varying
probability for including regressors in the models; robustness analysis employing
different estimation techniques is presented in section five. We provide brief conclusions
in section six.
2. Literature review
The forecasting ability of exchange rate models was partly undermined by the “Meese–
Rogoff Puzzle” (Meese and Rogoff, 1983), which argued that a random walk model
provided no worse predictions than time series models including macroeconomic
variables. As a result, the relationship between exchange rate models and macroeconomic
fundamentals was interrupted to a certain degree, a state characterized by an exchange
rate disconnect puzzle. According to Sims (1998, p. 344), the “actual behavior of
macroeconomic aggregates shows a combination of real and nominal sluggishness [and
therefore] macroeconomists should rethink their commitment to modeling behavior as
continuous dynamic optimization, with delays and inertia represented as emerging from
adjustment costs”. However, advanced modeling methods, new data sources providing
rich datasets, new explanatory variables such as news, sentiment, and uncertainty, and
processes of integration and globalization enable connecting exchange rates with
macroeconomic fundamentals and additional new variables, and improve the quality of
the forecasts of these models, which in turn can better explain exchange rate fluctuations
in turbulent market environments.
2 The global financial crisis (GFC) refers to a sever worldwide financial crisis between mid 2007 and early 2009.

Attention
An investor’s attention is a real phenomenon in the internet era characterized by the next-
to-unlimited amount of information available. The theory of behavioral attention is
closely connected with uncertainty as many economic agents make decisions involving a
degree of uncertainty and risk. Having formulated information theory, Shannon (1948)
stated that people have a limited capacity for working with information and news, even
though this information is freely available. Shannon (1948) also emphasized the value of
information in the transmission of messages. A limited capacity to process information
can be illustrated by consumers who are less satisfied, less confident, and more confused
due to an overload of online information (Lee and Lee, 2004). In this regard, attention
should be considered as a scarce cognitive source with specific subjective rules for its
allocation. In this sense, the rational inattention of economic agents causes them to be
deliberately inattentive to some news as they simply are not able to absorb all news
available to them. The theory of rational inattention is discussed by Sims (2003, 2006,
2010), who mentions the problem of limited attention among economic agents who are
unable to absorb all news and make sense of it in times of information overload.
The psychological stream of literature focuses on the problem of selective
attention or selection exposure hypothesis, i.e., when economic agents pay attention to a
limited amount of information or simply ignore some of it. As Carr (2004) states, agents
manage the excessive volume of information in a way where they prioritize selected
information to process it. This means that they do not behave rationally; rather, they select
what information they respond to and what they ignore. The reason for this may be that
agents do not adopt optimal decision-making because of procrastination and obedience,
and subsequently make selective and incorrect decisions (Akerlof, 1991). Alternatively,
the information may be assessed as threatening (Caplin, 2003) or negative (Karlsson et
al., 2009) and, as a result, agents refuse to collect additional information. This
phenomenon is sometimes called the ostrich effect, which is defined by Galai and Sade
(2006, p. 2741) as behavior produced when investors try to avoid “apparently risky
situations by pretending they do not exist”. As such, financial investors look for
information differently in periods of financial booms compared with downturns. These
differences are characterized, e.g., by the existence of delays in information-seeking
processes. Alternatively, investors pay more attention to their portfolios and tend to look
for information when financial markets are rising in particular, while they ignore

information when markets are in a downturn and they may face potential losses (Karls-
son et al., 2009). Furthermore, a growing body of literature on attention adopts Bayes’
rules (Schwartzstein, 2014; Whiteley and Sahani, 2012; Mirza et al., 2019) and the
cognitive role of the Bayesian model averaging approach (FitzGerald et al., 2014).
Concerning this particular literature, we show that attention is selective when agents
narrow their attention to predictors believed to be informative, relative to a prediction
performance (Kahneman, 1973).
Uncertainty and its measures
We deal with both news and uncertainty in our models, as both phenomena increase the
role of selective attention among market participants. The phenomenon of uncertainty
again became a popular research topic after the GFC and the subsequent economic
recession. According to Bloom (2009, 2014), uncertainty can have an impact on output,
employment, and FOREX rate expectations and its volatility, particularly in recessions
or negative economic performance.
There is an understandable variation in approaches for how to measure
uncertainty, with no single or objective measure denoted as better than others.
Researchers use various proxies to capture volatility or the dispersion of macroeconomic,
microeconomic, and financial variables, e.g., the VIX index (the CBOE volatility index)
to measure the market’s expectation of future volatility in US equity markets. A second
possible proxy is the appearance of specific words in newspapers, other publications, and
in the media in general, as the media functions as an important actor for conveying news
to uncertain economic agents (Bloom, 2014; Égert and Kočenda, 2014; Jurado et al.,
2015; Caporale et al., 2017; Griffith et al., 2019). In this respect, Beckmann and Czudaj
(2017) studied the impact of economic policy uncertainty on the exchange rate
expectations in the US and found that announcements and uncertainty concerning policy
decisions were important determinants of exchange rate expectations. Therefore,
uncertainty, together with economic policy, may serve as a proxy for unobservable
components not included in former theoretical model expectations (see the “scapegoat”
theory defined by Bacchetta and van Wincoop, 2013).
Another interesting proxy for uncertainty may be the frequency of newspaper
articles containing specific words such as “uncertain/uncertainty” and
“economy/economics”, among others (Baker et al., 2016). However, Jurado et al. (2015)

emphasized that these proxies may not be well connected to economic uncertainty and
provide a new measure of uncertainty derived from macroeconomic activity. In this sense,
they do not study the volatility or dispersion of selected individual variables per se; rather,
they attempt to discover whether the predictability of the economy (common variations
in uncertainty across a time series) is less or more uncertain. Jurado et al. identified three
main episodes of macroeconomic uncertainty in the post-war period (1973–1974, 1981–
1982, and 2007–2009) and concluded that this general uncertainty was lower than
individual uncertainty (based on individual variables).
Finally, there is also a new possibility for expressing uncertainty in the era of
unlimited information and data availability, i.e., the use of Google Trends data. This tool
measures investor attention based on the intensity of Google searches, i.e., it focuses on
the receiver of the news rather than on the sender (the media) of said news. Reed and
Ankouri (2019) confirm that Google Trends data serve as information about people’s
interest for a given currency. Koop and Onorante (2019) cast several macroeconomic
variables using US data and confirmed that the inclusion of Google Trends data improved
the forecast performance of general macroeconomic aggregates and that using these data
in the form of model probabilities rather than regressors can help identify structural
changes in the trend behavior of macroeconomic variables, and deal with forecasts
following a crisis. Wilcoxson et al. (2020) analyzed Google queries in the process of
forecasting exchange rates, confirming that Google Trends data can help to increase the
predictive power of exchange rate models. Smith (2012) tested whether Google data can
predict the volatility of exchange rates and argued that these data have a degree of
predictive power beyond standard models. Kristoufek (2015) studied the dynamic
relationship between the price of BitCoin and search queries on Google Trends and
Wikipedia, and found a strong bidirectional correlation between these variables that may
affect the frequent bubbles connected with the fluctuation of BitCoin price. Yang et al.
(2020) focus on China and confirm that Baidu search volume index serves as a factor of
investors’ attention. Seabold and Coppola (2015) focus on FOREX markets and found
that the use of Google Trends data improved the quality of forecasting by approximately
20 percent. Goddard et al. (2015) verified the relationship between investor attention and
the dynamics of currency prices using a Google search volume index for main currency
pairs and found that changes in investor attention were associated with changes in the
holdings of the largest traders in FOREX markets when the causality ran mainly from
investor attention to market volatility. Employing Google Trends data in an extended

vector autoregressive model of the Polish zloty, Chojnowski and Dybka (2017) included
sentiment data from the credit, financial, and price markets that support the evidence
indicating the better forecasting power of this model compared with a model based only
on fundamental macroeconomic variables or the random walk model. Bulut (2018) used
internet search data from Google Trends to capture an information set of decision-makers
and concluded that the use of Google Search data concerning current macroeconomic
variables, and nowcasting of these variables, should be considered an alternative for
proper testing of exchange rate de-termination models because of the presence of a lag in
the availability of the official data to market participants. Accordingly, Bulut (2018)
suggests using Google Trends data to now-cast the future exchange rate movement. Bulut
and Dogan (2018) used Google Trends data for the forecasting of the USD–Turkish Lira
exchange rate using two structural models (purchasing power parity and a monetary
model) and found that these out-of-sample forecasts performed better compared with a
random walk model. Finally, Wu et al. (2019) confirm that investor attention, expressed
by Google search volume index, plays a role in the spread of financial contagion among
currency markets through the novel channel of investor attention.
3. Data and methods
3.1 Data: Sources and assembly
We analyzed the forecasting performance of the FOREX models that involved exchange
rates for the USD with respect to the six most-traded currencies (CAD, JPY, AUD, EUR,
GBP, and NZD) using quarterly log returns in the period from 1979Q1–2016Q4.3 We
used four groups of exchange rate predictors.4 First, following Taylor (1995), we defined
mainstream macroeconomic imbalances based on inflation differential (consumer price
indexes), interest rate differential (three-month interbank interest rate), a monetary and
portfolio balance model (M1 monetary aggregates, real gross domestic product, and trade
balances).
3 All exchange rates are quoted against the U.S. dollar, i.e., one unit of a currency in terms of the U.S. dollar. This is a typical approach in the forex literature – any potential domestic (U.S.) shocks are integrated into all currency quotes.
4 We use publicly available data sources: XE.COM, OECD, Eurostat, FRED, CBOE, Yahoo Finance, and Bloomberg Database. Detailed descriptions of all the regressors are provided in the Appendix, Table A1. All the analyzed time series are transformed by log differences.
Second, we argue that foreign currency demand is significantly affected by
expectations about future volatility (uncertainty) and portfolio rebalancing, particularly
after the GFC beginning in 2007. Therefore, in our models, we included relevant VIX
indices (EUVIX, JYVIX, and BPVIX) and stock market return differentials (DAX,
Nikkei 225, FTSE 250, SMI PR, TSX, ASX 200, NZX 50)5.
Third, we focus on the impact of attention that reflects the attractiveness of the
topics related to the selected currency pairs. To do so, we used Google Searches, which
provided information about the search intensity of selected phrases (Search Volume Index
of internet search queries in a range from 0 to 100 provided by Google Trends database)6.
Fourth, we focus on news about macroeconomic fundamentals related to selected
currency pairs. Following Baker et al. (2016), we developed indices calculated as counts
of news articles related to four different categories: economic activity, money, price, and
trade. We used data from the Proquest Database, which included more than 315 million
news articles at the time related to analyzed currency in 3500 English-language
newspapers. For each currency pair, we created five indices: (1) output (keywords:
“GDP”, “output”, “recession”, “production”) yielding 21,400 articles; (2) money
(keywords: “money”, “interest rate”, “monetary”, “central bank”) yielding 55,700
articles; (3) price (keywords: “price”, “inflation”, “deflation”, “CPI”) yielding 33,00
articles; (4) trade (keywords: “trade”, “export”, “import”) yielding 25,200 articles; (5)
total (all keywords) yielding 100,500 articles. We excluded all news including the
keywords “US”, “USA” or “United States” to avoid the impact of news on the domestic
(US) economy; this step correctly isolated the impact of news relevant to the economies
of the six currencies being researched.
3.2 Methods: Estimation and assessment
We assumed the time-varying reactions of exchange rates to the market information and
macroeconomic fundamentals with possible endogeneity biases. Moreover, we
hypothesized that market participants were overwhelmed by information and that they
5 All selected stock market indices were transformed to differentials of their log returns against S&P 500.
6 The normalized search query index at a given point in time is a ratio of the total search volume for each query to the total number of all search queries. We use keywords “Australian Dollar,” “Canadian Dollar,” “British Pound,” “Euro,” “Japanese Yen,” “New Zealand Dollar,” “United States Dollar,” with emphasis on the searches in the category “Currency.”
paid time-varying selective attention to predictors. The information overload and limited
amount of time and effort to process information increases inefficiencies at the forex
markets because economic agents attend to a limited amount of information or they
simply ignore some of them. In this context, we define selective attention as actions
emphasizing importance of specific information followed by information-selection
behavior of the market participants.
In terms of modeling, it is generally agreed that large models do not serve as an
effective way to forecast exchange rate movements (Beckmann et al., 2020). A solution
to this problem might be selecting more parsimonious model but such approach per se
does not reflect model selection uncertainty. To account for such model selection
uncertainty, we employ Bayesian approach that allows to incorporate prior information
about the regressors included into the model. In this manner we also reflect model
selection uncertainty resulting from the market participant selective attention. In terms of
the methodological approach, selective attention resting on prior information can be
effectively captured by employing dynamic model averaging (DMA) and dynamic model
selection (DMS) approaches that both reflect Bayesian perspective (Koop and Korobilis,
2012; Koop and Onorante, 2019) and in effect they mimic time-varying information
selection that is akin to selective attention.
Based on the assumptions and reasoning outlined above, we employed both
dynamic model averaging (DMA) and dynamic model selection (DMS) approaches.
Formally, we estimated time-varying posterior probability to include selected regressors
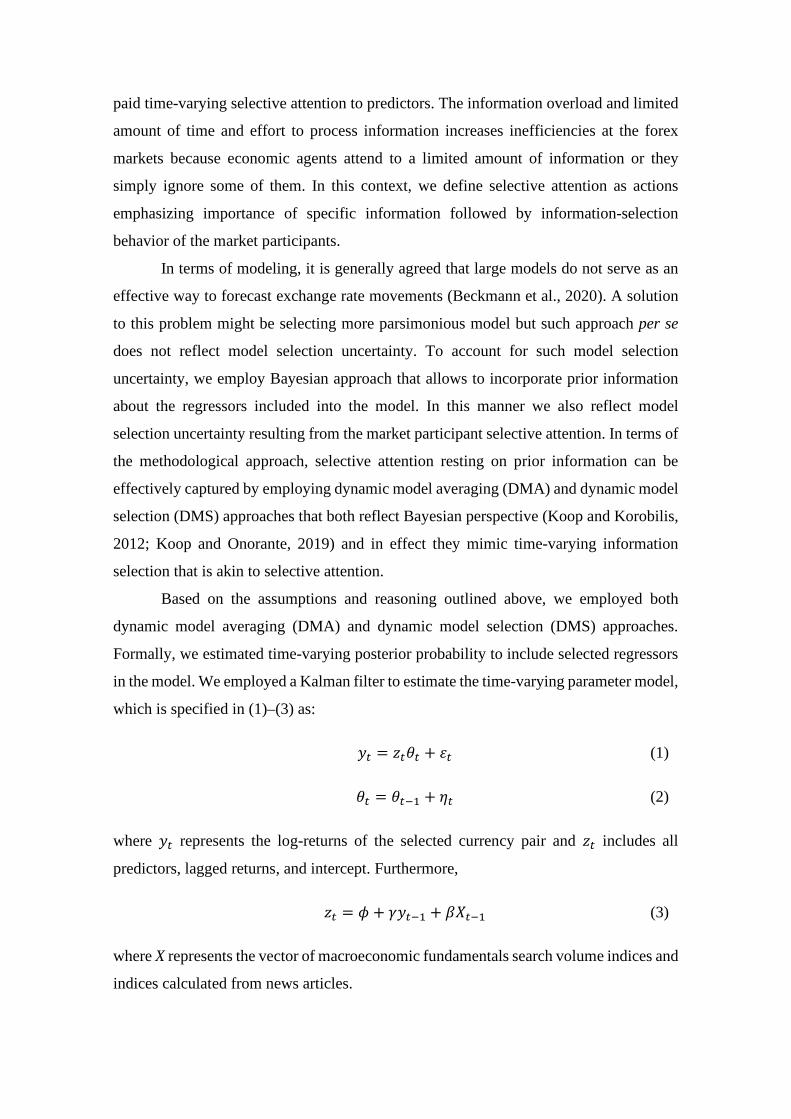
in the model. We employed a Kalman filter to estimate the time-varying parameter model,
which is specified in (1)–(3) as:
𝑦𝑦𝑡𝑡 = 𝑧𝑧𝑡𝑡𝜃𝜃𝑡𝑡 + 𝜀𝜀𝑡𝑡 (1)
𝜃𝜃𝑡𝑡 = 𝜃𝜃𝑡𝑡−1 + 𝜂𝜂𝑡𝑡 (2)
where 𝑦𝑦𝑡𝑡 represents the log-returns of the selected currency pair and 𝑧𝑧𝑡𝑡 includes all
predictors, lagged returns, and intercept. Furthermore,
𝑧𝑧𝑡𝑡 = 𝜙𝜙 + 𝛾𝛾𝑦𝑦𝑡𝑡−1 + 𝛽𝛽𝑋𝑋𝑡𝑡−1 (3)
where X represents the vector of macroeconomic fundamentals search volume indices and
indices calculated from news articles.

We followed Koop and Korobilis (2012) and defined K models as predictors 𝑧𝑧𝑡𝑡(𝑘𝑘)
for 𝑘𝑘 = 1, … ,𝐾𝐾. Thus, 𝑧𝑧𝑡𝑡(𝑘𝑘) is a subset of 𝑧𝑧𝑡𝑡 and the set of models (1–2) is rewritten as
𝑦𝑦𝑡𝑡 = 𝑧𝑧𝑡𝑡(𝑘𝑘)𝜃𝜃𝑡𝑡
(𝑘𝑘) + 𝜖𝜖𝑡𝑡(𝑘𝑘) (4)
𝜃𝜃𝑡𝑡(𝑘𝑘) = 𝜃𝜃𝑡𝑡−1
(𝑘𝑘) + 𝜂𝜂𝑡𝑡(𝑘𝑘) (5)
for each currency pair y. Thus, we have 𝐾𝐾 = 2𝑚𝑚𝑚𝑚 models for m explanatory variables in
each model and rolling forecasts that employ an estimation of 𝜃𝜃� using data from 𝜏𝜏 − 𝜏𝜏0.
Let 𝐿𝐿𝑡𝑡 ∈ {1,2, … ,𝐾𝐾} denote the model that applies at time t, and average weighted DMA
point forecasts based on available data in 𝑡𝑡 − 1 as
𝐸𝐸(𝑦𝑦𝑡𝑡|𝑦𝑦𝑡𝑡−1) = ∑ 𝜋𝜋𝑡𝑡|𝑡𝑡−1,𝑘𝑘𝑧𝑧𝑡𝑡𝑘𝑘𝜃𝜃�𝑡𝑡−1(𝑘𝑘)𝐾𝐾
𝑘𝑘=1 (6)
where 𝜋𝜋𝑡𝑡|𝑠𝑠,𝑙𝑙 = 𝑃𝑃𝑃𝑃(𝐿𝐿𝑡𝑡 = 𝑙𝑙|𝑦𝑦𝑠𝑠). We calculate the time-varying posterior probability to
include the predictors in the model as
𝑝𝑝(Θ𝑡𝑡−1|𝑦𝑦𝑡𝑡−1) = ∑ 𝑝𝑝�𝜃𝜃𝑡𝑡−1(𝑘𝑘) �𝐿𝐿𝑡𝑡−1 = 𝑘𝑘,𝑦𝑦𝑡𝑡−1�𝑃𝑃𝑃𝑃(𝐿𝐿𝑡𝑡−1 = 𝑘𝑘|𝑦𝑦𝑡𝑡−1)𝐾𝐾
𝑘𝑘=1 , (7)
where 𝑝𝑝�𝜃𝜃𝑡𝑡−1(𝑘𝑘) �𝐿𝐿𝑡𝑡−1 = 𝑘𝑘,𝑦𝑦𝑡𝑡−1� is given by Θ𝑡𝑡−1|L𝑡𝑡−1 = 𝑘𝑘,𝑦𝑦𝑡𝑡−1.
Finally, we employed DMS based on the averaging over predictive results for
every model, selecting the highest value for 𝜋𝜋𝑡𝑡|𝑡𝑡−1,𝑘𝑘 at each point in time. Moreover, we
followed Raftery et al. (2010) to involve a forgetting factor, which implied that
observations in a specific period in the past had weight 0 < 𝜆𝜆𝑗𝑗 < 17.
In effect, we estimated a time-varying parameter vector autoregressive model
(TVP-VAR) in a standard way, as well as via the DMA and DMS procedures that form
the basis to interpret results of selective attention. In addition, and as a robustness check,
we compared the DMA and DMS results with random walk and standard TVP-VAR
models. Based on the reported mean squared forecast error (MSFE) and mean absolute
forecast error (MAFE) we show that smaller sizes models accounting for the presence of
selective attention offer improved fitting and forecasting results.
7 We follow Koop and Korobilis (2012) and set parameter 𝜆𝜆 = 0.99, which ensures that observations five years ago ≈ 80% as much weight as the last period’s observation.
4. Results
Our empirical analysis comprised two main steps. First, we considered selective attention
with respect to various predictors and showed that economic agents changed their
attention to information content as it related to a specific currency over time. Second, we
compared the forecasting performance of models including additional larger models.
Table 1 illustrates overall empirical evidence of time-varying selective attention to
different predictors, while more detailed dynamic results are presented in graphical form
later in this section. The selective attention to predictors is represented by a posterior
probability for including selected predictors in the model. We also show that economic
agents narrow their attention to different predictors believed to be informative for the
specific currency.
Table 1 illustrates changes in selective attention for three sub-periods: (1) 1980–
1984 (shortly after the European Monetary System was established in March 1979); (2)
during the period of Great Moderation (1985–2007); (3) after the (GFC) that fully took
hold in 2008 (2008–2016). We found that the average posterior probability for paying
attention to trade balances, money growth, VIX, and search indexes was below 0.65 for
all currency pairs during all selected sub-periods. We thus conclude that only inflation
differential, interest rate differential, GDP growth, stock returns, and news can serve as
appropriate predictors of the selected currency pairs. Moreover, our results indicate that
the average probability of including news in forecasting models is relevant only for the
Euro after the GFC.
Table 1. The average posterior probability of including predictors into the models.
<...Table 1...>
In addition, we provide thorough dynamic development details of the posterior
probability for each predictor. Figure 1 plots the estimates of the posterior probabilities
for individual variables that could be potentially included in the forecasting model; the
figures on the left represent estimates for macro fundamentals, volatility indices, and
stock return differences, while those on the right indicate the same for news (indices based
on article news) and searches (data from the Google Trends database).
Figure 1. Time-varying posterior probabilities of including predictors into the models.
<...Figure 1...>
Generally, the probability of inclusion in the case of past values of the exchange
rate (variable ER(t-1)) increased over time and approached almost 1 (except for
USD/GBP and USD/NZD, in which case the probability increased only before the GFC
and again in Japan in 2013 when it reached 0.9); accordingly, we can state that past
exchange rate values could fairly substantially influence the current or predicted value of
the exchange rate. In the case of the USD/EUR, the increase in probability starting with
the initiation of the Euro can be explained by the strong appreciation of the Euro relative
to the USD from 2000 to 2008 and then by the GFC. The sudden drop in probability in
the case of the USD/NZD pair in 1985 may have been caused by the change of the
exchange rate regime (from fixed to floating) in New Zealand in this year. However, the
same step, i.e., the change from fixed to floating exchange rate regime in 1983 led to a
one-year rise in the probability of ER(t-1) (and a simultaneous one-year drop in the case
of Inflation diff) in 1984 for the USD/AUD pair, before decreasing and remaining at the
same level in subsequent years (until 1997), as in the case of the USD/NZD. Thus, we
could state that the implementation of a floating regime decreased the probability of
inclusion of this variable in the forecasting models of these two currency pairs.
Interestingly, there was a higher probability increase for the USD/AUD and USD/NZD
pairs at approximately 1998, likely as a reaction to the creation of the Euro currency in
1999 and the Asian crisis of 1997 and 1998; however, it remained at a high level only for
the USD/AUD case, until the end of the period (in the USD/NDZ case, it became
extremely volatile). A strong depreciation of the AUD against the USD in 2003 also
increased the probability of the CAD/USD currency pair in this year; this situation
continued in subsequent years due to the US budget and current account deficits.
The role of interest rate differential (IR diff) was almost negligible in case of the
USD/EUR pair and was below 0.5 for the USD/AUD and CAD/USD pairs, and less for
the USD/NZD pair (except for the period 1979–1988). The only currency pair in which
this variable played a role from the beginning of the analyzed period until approximately
2003 was the JPY/USD combination; however, the probability of inclusion of IR diff
decreased systematically after 2003. For a limited time, the probability was higher in the
case of the USD/GBP pair in the second half of the 1980s, until approximately 1992,
when interest rates in the United Kingdom began decreasing, and in case of the USD/EUR
pair in 2004 and 2005 (likely as a result of a higher Federal Funds Rate, which was

initiated in June 2004 and continued until June 2006 as a reaction to rising house prices
and the first signals of a house price bubble); however, the level of probability nonetheless
very low. There were also two separate probability jumps in 1980 and 1985 for the
USD/NZD pair (which can potentially be explained by the above-mentioned switch from
a fixed to a floating exchange rate regime in 1985) with a long-term decreasing tendency
in the 1990s (and simultaneously, the increasing tendency of the ER(t-1) variable).
The important capital markets (Stock ret diff) for the USD/EUR pair is at the
highest level compared with other currency pairs (the value of probability is almost 1 for
the analyzed period, which in this case began from 1999), signaling that capital markets
played a significant role in the exchange rate movement. This variable was added to the
prediction model for this time and explained the variability of the USD/EUR exchange
rate. Interestingly, the probabilities became important in the case of USD/GBP,
USD/AUD, and USD/NZD pairs in the period following the GFC. This fact may signal
the effect of portfolio rebalancing in case of these three currency pairs during the crisis
period when traditional macroeconomic variables became less important and capital
market variables more important, as investors moved their portfolios to other capital
markets (at the time in Europe or the US) to the UK or even to smaller markets in
Australia or New Zealand (see also the results of the robustness analysis). In the case of
the JPY/USD pair, the probability continuously decreased during this period (the
probability was between 0.2 and 0.5 during the 1980s, partly as a reflection of the
financial market bubble illustrated by a strongly rising Nikkei stock price index in Japan
between 1983 and 1989, when it was eliminated by monetary policy tightening).
Gross domestic product differential (GDP diff) probabilities yielded ambiguous
results: (1) a stable probability in the case of the USD/EUR pair of approximately 0.5; (2)
a rising probability in for the USD/AUD pair throughout the period; (3) fluctuating
probabilities for the USD/GBP case in 1984, 1989–1990, and particularly after the GFC;
(4) high probability in the case of the CAD/USD pair in the period from 1985–1994,
followed by a higher probability after the GFC, too; (5) rapidly fluctuating (higher and
lower) probabilities for the USD/NZD pair during the 1980s (likely caused by economic
reforms forced by rising unemployment and economic stagnation) and an increasing
tendency since then. For the JPY/USD pair, this variable was strongly insignificant,
which is not surprising when we consider the long-term economic stagnation in Japan,
particularly from 1993–2003.
The highest level of probability for the inflation differential (Inflation diff) was
estimated for the USD/EUR pair, particularly after 2001, which may reflect the focus on
monetary policy in the Euro Area, and in the case of the USD/AUD pair (where economic
agents perceived poor results related to combating inflation, particularly in the 1980s and
1990s) showing a slightly decreasing probability after the GFC. Probabilities of
approximately 0.5 were also estimated for the JPY/USD pair (which may reflect the fact
that inflation/deflation policy in Japan remained at the center of attention of both
economic agents and policymakers) but with a decreasing tendency after the policy of
quantitative easing was implemented in 2001, which was also the case for the USD/GBP
pair. The probability rose in years preceding 1983 in for the USD/NZD pair, with the
highest values recorded having been between 8.0 and 0.95 at the end of this period, before
falling to almost 0 in 1984, before continuously growing to approximately 0.5 when
liberalization tendencies concerning monetary policy and preparation of the inflation
targeting regime’s implementation (from 1990) began in New Zealand. For the
CAD/USD case, the probability was higher during the 1980s but subsequently dropped
to a level of approximately 0.4.
Money supply differential (M1 diff) had a long-term impact on the JPY/USD
exchange rate where the probability increased in 1989 and again in 1995, likely as a result
of monetary policy tightening (after the 1980s bubble times, characterized by rising land
and stock prices) and then again in 2000 before the implementation of the unconventional
monetary policy in Japan. The first policy of quantitative easing introduced in 2001 was
replaced by comprehensive monetary easing in 2010. Then, the new policy of quantitative
and qualitative easing with yield curve control was applied in April 2013, which may
explain the drop in the probability of inclusion of the money supply variable in the
forecasting model during this period. The probability of M1 diff was higher in the
USD/AUD pair in the first half of the 1980s, but it continuously decreased after 1989
(Australia abandoned the money supply targeting regime in 1985) and particularly after
1993, when the first inflation target was set. Generally, the role of the money supply was
diminishing throughout this time for all country pairs, reflecting a deflection from the
monetary transmission mechanism (which employed a monetary base as an instrument
for influencing money supply) to the implementation of inflation targeting regimes
instead during the late 1980s and early 1990s. For the USD/EUR and USD/GBP pairs,
and from approximately 1990 also the USD/NZD pair, the probability fluctuating was
approximately 0.5. We estimated a low probability for the CAD/USD pair.
The probability of the trade balance differential (TB diff) was relatively high but
very volatile for the JPY/USD case until approximately 2005 when it dropped to almost
0. For the CAD/USD pair, a higher probability in the second half of the 1980s may have
been a reflection of a report by the McDonald Commission in 1985, followed by
negotiations of the Canada-US Free Trade Agreement, which had been prepared in 1987
and signed in January 1988. In the USD/EUR pair, the probability was not sufficiently
high and reached almost 0. The probability level was stable only for the USD/NZD pair
and was estimated at approximately 0.5. However, the probability of this variable
appeared to be volatile, with occasional jumps and drops indicated in the case of other
country pairs.
The VIX index (VIX), which represents the market’s expectation of future
volatility (generally interpreted as uncertainty), exhibited low probability. The role of
news and searches (the figures on the right) can also be assessed as ambiguous; we can
see relatively high probabilities of news in case of the USD/EUR, USD/AUD, and also
the USD/GBP and USD/NZD pairs throughout the period, and in case of the JPY/USD
pair, at the beginning of the period. Moreover, we can see a rising influence of Google
searches for the USD/NZD pair and a stable probability for the USD/GBP and CAD/USD
pairs, while a high jump was observed for the USD/AUD pair during the GFC, and a short
episode of high probability was indicated for the USD/EUR pair in 2005 and 2006 with
a subsequent decrease.
In summary, macro fundamentals were observed to play a significant role in the
exchange rate determination. However, indices calculated from the counts of newsletter
articles related to four different categories (economic activity, money, price and trade) in
a given country were also shown to be significant and were rightly included in our models
as explanatory determinants. The only two exceptions were the JPY/USD and CAD/USD
pairs, which indicated a relatively low level of inclusion probabilities throughout the
analyzed period. This result can be interpreted by the fact that Japan is often considered
a safe haven for financial investors and, as such, the role of article news and Google
searches is limited. In the case of Canada, this outcome was likely the result of either the
relatively small importance of this financial market in the world or the fact that the
Canadian dollar is recognized as a commodity currency in the shadow of its more
important neighbor.
In the next step, we focus on the forecasting performance of our models. Figure 2
shows actual and predicted exchange rate returns employing two different groups of

predictors. The first group of predictors only includes the macroeconomic fundamentals
(inflation differential, interest rate differential, money growth differential, GDP growth
differential, trade balance differential, stock returns differ-ential, and VIX). The second
group of predictors is extended for indices calculated from the counts of newsletter
articles related to four different categories (economic activity, money, price and trade) in
a given country (Proquest data-base) and searches refer to the search volume index of the
given currency names (Google Trends data-base). While the left panels in this figure plot
the data, the right panels plot the deviations between the actual and predicted values of
the individual exchange rate. Actual data were much more volatile compared with
predicted data, which could be explained by a fact mentioned by many authors, i.e., that
no prediction model can encompass all the variables influencing the exchange rate
movement.
A comparison of the forecasting performance of both models showed that
extension for news and searches convincingly decreased the absolute deviation of the
predicted values compared with actual data for all selected currency pairs.
Figure 2. Forecasting performance of model extension.
<...Figure 2...>
In case of the USD/EUR pair, the deviations were the most apparent; while the
predictions produced by the first group of predictors deviated less in the first half of the
analyzed period, the predictions of the extended group of predictors were more precise in
the second half of the period, i.e., in 2006 and particularly after the GFC (with some
occasional exceptions, e.g., 2012Q2, 2015Q4, and 2016Q2). The above findings
confirmed that the role of news and online searches had increased in recent decades. It
also supports the idea that investors are attentive to huge amount of information and that
the role of traditional macroeconomic fundamentals is decreasing. The same holds for the
USD/AUD pair and partly for the USD/NZD pair; it was observed that the deviation of
the prediction was smaller in the second half of the analyzed period and particularly after
the GFC (again with some slight exceptions). In the case of some currency pairs
(JPY/USD, USD/GBP, and CAD/USD), the situation was not as convincing and both
forecasts were almost identical, i.e., extended models did not change the quality of the
forecasting model much.
In summary, we consider selective attention and employ a dynamic model averaging
approach to reduce model selection uncertainty. Our results show significant changes of

posterior probability to select specific predictors into the models and confirm increasing
forecasting performance of extended models. The results point to the existence of
selective attention.
5. Robustness analysis
As an additional step, we checked the sensitivity of our analyses in two ways, with respect
to the detailed news grouping and based on estimation techniques.
First, we focused on possible heterogeneous selective attention to specific
macroeconomic news and differentiated among four groups of news: (1) output and
productivity; (2) money and monetary policy; (3) prices; (4) trade. Figure 3 presents
estimations of probabilities of the extended model, where the panels on the right include
probabilities for individual categories of news (output, price, money and trade) and
Google searches. The probabilities for all categories were relatively stable and very often
at the same level for almost all country pairs in the analyzed period except for the
USD/EUR pair, where the probabilities differed significantly and partly so in the case of
the USD/AUD pair. High volatility for all categories was apparent at the start of the
analyzed period in for the USD/NZD pair before economic reforms in New Zealand were
adopted. The probability of news in the “price” category was relatively volatile and high
in the case of the USD/EUR pair (particularly in 2001 and then in 2005–2010, when the
probability was higher than 0.8). News in the “money” category was also volatile for the
USD/EUR pair, however, the opposite trend (except for 2006–2008) was observed when
the probabilities rose and fell together. In 2008, the probability of Google searches
jumped to almost 1 for the USD/AUD pair, to 0.7 for the USD/NZD pair, to 0.6 for the
USD/GBP pair, or fluctuated between 0.2 and 0.45 for the CAD/USD pair. On the other
hand, the probability dropped in the years preceding 2008 in Japan, which confirmed the
fact that Japan is often regarded as an investment safe haven. We cannot say that there is
one category (compared with others) with the highest or lowest probability in this period
as the probabilities varied based on time. For example, the lowest probability for the
“output” category among other categories was estimated for the USD/EUR and JPY/USD
pairs, while the highest probability for the same category was estimated for the CAD/USD
pair. On the other hand, the highest probability for news in the “trade” category was
observed for the USD/EUR and JPY/USD pairs in the second half of the period, while it
was lowest for the CAD/USD pair from 1988. In the USD/AUD pair, the highest
probability was estimated for news in the “price” category (the probability increased
before the inflation target regime was adopted).
When we summarized the results of this step of our analysis, it became evident
that the decomposition of one general index of news into four individual categories did
not deliver any considerable refinement to our previous results, except for the USD/EUR
currency pair. Thus, we concluded that the USD/EUR exchange rate had been
significantly influenced by news about prices during the years 2006–2008, when the ECB
decided to start increasing its policy rates because their monetary analysis indicated
upward risks to price stability. Following the GFC, the impact of the news was primarily
observed for trade and output success.
Figure 3. Time-varying posterior probabilities of including predictors into the extended
models.
<...Figure 3...>
Second, we compared the forecasting performance of three different groups of
models using DMA, DMS, TVP-VAR, and random walk by reporting MAFEs and
MSFEs. We considered the same lag (1) as in the previous analyses. Our results in Table
2 show an increase in the forecasting performance of extended models (that included
article news and Google searches) when DMA and DMS methods specifically were
employed.
Table 2. Forecasting performance summary.
<...Table 2...>
To summarize the results of the analyses, the inclusion of news articles and
Google searches in the prediction models using DMA/DMS methods led to more precise
predictions for most currency pairs. Compared with the TVP-VAR approach, forecasting
errors decreased because we reduced the uncertainty of model selection following the
assumption of selective attention, and kept models to smaller sizes. We take these results
as evidence that selective attention impacted the performance of currency pair
predictions. We also showed that splitting news articles into individual groups did not
help to increase the forecasting performance of the all exchange rates, except for the
EUR/USD and JPY/USD pairs.
In order to compare the forecasting performance of individual models and to
assess its economic significance we compute relative changes in error measures (MAFE
and MSFE) of each DMA and DMS procedures with respect to the standard TVP-VAR
and random walk models; the results are reported in the Appendix Table A2. Specifically,
we report a percentage change in the values of MAFE/MSFE between two sets of models,
where the TVP-VAR or random walk are taken as a base. Thus, a positive percentage
change indicates improvement in the forecasting performance of the DMA/DMS in
comparison to TVP-VAR/random walk as it represents effective decrease in errors
measured by MAFE/MSFE; negative percentage change indicates the opposite.
Based on results in Table A2, we show a substantial improvement in forecasting
performance of both DMA and DMS procedures against the random walk model. This
finding is in accord with evidence reported by Chojnowski and Dybka (2017) who
included sentiment data in their model, and Bulut and Dogan (2018) who used Google
Trends data, and both showed that their forecasts performed better in comparison to a
random walk model. Further, both DMA and DMS models provide additional, albeit
smaller, improvement in forecasting performance against the standard TVP-VAR model,
in general. When selective attention is accounted for, The DMA/DMS exhibit
considerable percentage improvement in case of GBP and AUD, and solid improvement
in case of the CAD and NZD. Forecasting improvement for both most traded currencies
(EUR and JPY) is smaller, and in isolated cases forecasting performance slightly
weakens. This s understandable since both currencies are traded with a very thin spread
that offers only a limited room for forecasting improvement when selective attention is
accounted for. Hence, we show that exchange rates of the currencies under research are
affected by selective attention of the market participants, and reduction in the model
selection uncertainty provided by the DMA and DMS procedures exhibits improvement
in forecasting performance that is economically significant with respect to random walk
or a standard TVP-VAR model.
6. Discussion and Implications
In our paper, we contribute to the discussion about the “Meese–Rogoff Puzzle” (Meese
and Rogoff, 1983) and about the selective attention of economic agents when they face
the information overload (Akerlof, 1991; Carr, 2004; Galai and Sade, 2006; Karlsson et
al., 2009).
We employed dynamic model averaging and dynamic model selection methods
(Koop and Onorante, 2019) as convenient tools to show that economic agents experience
an information overload and exercise a time-varying selective attention with respect to
the information set available to them. Our specific results show that in terms of important
variables in exchange rate determination the traditional variables of trade balances,
money growth, or stock market volatility (VIX) seem to be less relevant than often
thought. On the other hand, other traditional factors as inflation differential, interest rate
differential, GDP growth, stock returns, and various economic news are shown to play
important role as appropriate predictors.
In addition, our results also indicate that news about economic activity, monetary
policy, price development, and foreign trade that are related to the countries represented
by the selected currency pairs vary in their influence for exchange rate determination with
respect to a currency as well as time period, but their impact is not overwhelming On the
other hand, these news represent a valuable information source for the euro/dollar
exchange rate during the post-GFC period as the average probability of including the
news in forecasting models is particularly high after the GFC. Finally, or results also show
a reasonable predictive power of the information contained in the Google Trends data
searches. Evidence on the importance of factors related to news articles and Google
Trends data searches for the successful prediction of exchange rate behavior is in line
with studies of Goddard et al. (2015), Seabold and Coppola (2015), Chojnowski and
Dybka (2017), Bulut (2018), Bulut and Dogan (2018), Reed and Ankouri (2019), or
Wilcoxson et al (2020). However, the key novelty that we put forth is the evidence
showing that attention is selective when agents narrow their attention to predictors
believed to be informative with respect to forecasting performance, the notion originally
emphasized by Kahneman (1973).
Finally, modeling procedures that reflect selective attention of agents (DMA and
DMS) produce forecasting performance that is better in terms of economic significance
than its counterparts. The result offers direct implications to include factors related to
selective attention, or attention of economic agents in general, into forex models in order
to improve their forecasting performance and help investors to produce more effective
decisions related to their forex investment portfolios as well as forex hedging strategies.
In this sense, better predictions may limit uncertainty and inclusion of the variables
relevant from the selective attention perspective might help to alleviate an “ostrich effect”
and asymmetric investors’ behavior reported by Galai and Sade (2003) or Karlsson et al.
(2009) that could also lead to improved investment decisions and reduction of their
asymmetries.
7. Conclusions
Recent empirical models explaining the determination of exchange rates often fail to
predict the future value of exchange rates, even when they include traditional theory-
based variables. In this paper, we contribute to the debate on factors that impact exchange
rate fluctuations by including factors related to the attention given to specific events or
policy changes in the form of news announcements and online searches. We followed a
relevant stream of the literature and argued that market participants suffered from
significant information overload and were prone to be rationally inattentive or selective
to only specific information.
Our approach is novel in the sense that we used both macroeconomic and online
data based on more than 100,000 published news articles about economic activity,
monetary policy, price development, and foreign trade related to the countries represented
in the selected currency pairs.
Moreover, our results point to the presence of selective attention for the all
reviewed currency pairs. We employed dynamic model averaging and dynamic model
selection methods to estimate the time-varying posterior probability as a means for
including specific predictors in our models. We confirmed significant changes in
predictor selection because economic agents narrow their attention to different predictors
believed to be informative for the specific currency. We then produced one-step-ahead
forecasts at each point in time. Our results show that considering selective attention
improves forecasting results of large models.
In addition, a comparison of our point forecasts using actual data confirmed the
importance of predictors related to news articles and Google Trends data searches. When
compared with models that included only macroeconomic fundamentals, the forecasting
performance increased after we included indices constructed from news articles and
Google Trends data searches. One of our key results also pointed at the growing impact
of foreign trade and monetary policy news on the Euro/USD exchange rate following the
GFC.
References
Akerlof, G. 1991. “Procrastination and Obedience.” The American Economic Review 81 (2): 1–19. https://www.jstor.org/stable/2006817
Antonakakis, N. 2012. “Exchange return co-movements and volatility spillovers before and after the introduction of euro.” Journal of International Financial Markets, Institutions and Money 22 (5): 1091–1109. doi: 10.1016/j.intfin.2012.05.009
Bacchetta, P., and E. van Wincoop. 2013. “On the unstable relationship between exchange rates and macroeconomic fundamentals.” Journal of International Economics 91 (1): 18–26. doi: 10.1016/j.jinteco.2013.06.001
Baker, S. R., N. Bloom, and S. J. Davis. 2016. “Measuring Economic Policy Uncertainty.” The Quarterly Journal of Economics 131 (4): 1593–1636. doi: 10.1093/qje/qjw024
Baruník, J., E. Kočenda, and L. Vácha. 2017. “Asymmetric Volatility Connectedness on Forex Markets.” Journal of International Money and Finance, 77: 39–56. doi: 10.1016/j.jimonfin.2017.06.003
Beckmann, J., G. Koop, D. Korobilis, and R. A. Schüssler. 2020. “ Exchange rate predictability and dynamic Byesian learning.“ Journal of Applied Econometrics, 35: 410–421. doi: 10.1002/jae.2761
Beckmann, J., and R. Czudaj. 2017. “Exchange rate expectations and economic policy uncertainty.” European Journal of Political Economy 47: 148–162. doi: 10.1016/j.ejpoleco.2016.06.003
Bilson, J. F. O. 1978. “The Monetary Approach to the Exchange Rate: Some Empirical Evidence.” International Monetary Fund Staff Papers 25 (1): 48–75. doi: 10.2307/3866655
BIS. 2016. “Triennial central bank survey foreign exchange turnover in April 2016.” Technical report, Bank for International Settlements (BIS). ww.bis.org/publ/rpfx16.htm
Bloom, N. 2009. “The impact of uncertainty shocks.” Econometrica 77 (3): 623–685. doi: 10.3982/ECTA6248
Bloom, N. 2014. “Fluctuations in Uncertainty.” Journal of Economic Perspectives 28 (2): 153–176. doi: 10.1257/jep.28.2.153
Bulut, L. 2018. “Google Trends and the forecasting performance of exchange rate models.” Journal of Forecasting 37 (3): 303–315. doi: 10.1002/for.2500
Bulut, L., and C. Dogan. 2018. “Google Trends and structural exchange rate models for Turkish Lira-US Dollar exchange rate.” Review of Middle East Economics and Finance 14 (2). doi: 10.1515/rmeef-2017-0026
Caplin, A. 2003. “Fear as a policy instrument.” In: Loewenstein, G., D. Read, and R. Baumeister, eds. Time and decision. New York: Russell Sage.

Caporale, G. M., F. Spagnolo, and N. Spagnolo. 2017. “Macro news and exchange rates in the BRICS.” Finance Research Letters 21: 140–143. doi: 10.1016/j.frl.2016.12.002
Carr, T. H. 2004. “A multilevel approach to selective attention: Monitoring environmental space, choosing stimuli for deep processing, and retrieving information from memory.” In: Posner, M. I., eds. Cognitive neuroscience of attention. New York: Guilford Press.
Chojnowski, M., and P. Dybka. 2017. “Is Exchange Rate Moody? Forecasting Exchange Rate with Google Trends Data.” Econometric Research in Finance 2 (1): 1–21. doi: 10.33119/ERFIN.2017.2.1.1
Dornbusch, R. 1976. “Expectations and Exchange Rate Dynamics.” Journal of Political Economy 84 (6): 1161–1176. https://www.jstor.org/stable/1831272
Égert, B., and E. Kočenda. 2014. “The impact of macro news and central bank communication on emerging European forex markets.” Economic Systems 38 (1): 73–88. doi: 10.1016/j.ecosys.2013.01.004
Engel, C., and K. D. West. 2005. “Exchange Rates and Fundamentals.” Journal of Political Economy 113 (3): 485–517. doi: 10.1086/429137
Festré, A., and P. Garrouste. 2015. “The ‘Economics of Attention’: A History of Economic Thought Perspective.” Oeconomia 5 (1): 3–36. doi: 10.4000/oeconomia.1139
FitzGerald, T. H. B., P. Schwartenbeck, M. Moutoussis, R. J. Dolan, and K. Friston. 2015. “Active inference, evidence accumulation, and the urn task.” Neural Computation 27 (2): 306–328. doi: 10.1162/NECO_a_00699
Frankel, J. A. 1979. “On the Mark: A Theory of Floating Exchange Rates Based on Real Interest Differentials.” The American Economic Review 69 (4): 610–622. https://www.jstor.org/stable/1808707
Frankel, J. A. 1984. “Tests of Monetary and Portfolio Balance Models of Exchange Rate Determination.” In: John F. O. Bilson and Richard C. Marston, eds. Exchange Rate Theory and Practice. University of Chicago Press.
Frankel, J. A., and A. K. Rose. 1995. “Empirical Research on Nominal Exchange Rates.” In: Grossman, G. M., and K. Rogoff, eds. Handbook of International Economics. Amsterdam: Elsevier.
Frenkel., J. A. 1976. “A Monetary Approach to the Exchange Rate: Doctrinal Aspects and Empirical Evidence.” The Scandinavian Journal of Economics 78 (2): 200–224. doi: 10.1007/978-1-349-03359-1_7
Galai, D., and O. Sade. 2006. “The “ostrich effect” and the relationship between the liquidity and the yields of financial assets.” The Journal of Business 79 (5): 2741–2759. doi: 10.1086/505250
Goddard, J., A. Kita, and Q. Wang. 2015. Investor Attention and FX Market Volatility. Journal of International Financial Markets, Institutions and Money 38: 79–96. doi: 10.1016/j.intfin.2015.05.001
Griffith, J., M. Najand, and J. Shen. 2020. “Emotions in the Stock Market.” Journal of Behavioral Finance 21 (1): 2020, 42–56. doi: 10.1080/15427560.2019.1588275
Jurado, K., S. C. Ludvigson, and S. Ng. 2015. “Measuring Uncertainty.” The American Economic Review 105 (3): 1177–1216. doi: 10.1257/aer.20131193
Kahneman, D. 1973. Attention and Effort. New Jersey: Prentice-Hall Englewood Cliffs.
Karlsson, N., G. Loewenstein, and D. Seppi. 2009. “The ostrich effect: Selective attention to information.” Journal of Risk and Uncertainty 38 (2): 95–115. doi: 10.1111/j.1468-2354.2012.00704.x
Kočenda, E., and M. Moravcová. 2018. “Intraday Effect of News on Emerging European Forex Markets: An Event Study Analysis.” Economic Systems 42 (4): 597–615. doi: 10.1016/j.ecosys.2018.05.003
Koop, G., and D. Korobilis. 2012. “Forecasting inflation using dynamic model averaging.” International Economic Review 53 (3): 867–886. doi: 10.1111/j.1468-2354.2012.00704.x
Koop, G., and L. Onorante. 2019. “Macroeconomic Nowcasting Using Google Probabilities.” In: Jeliazkov, I., and J. L. Tobias, eds. Topics in Identification, Limited Dependent Variables, Partial Observability, Experimentation, and Flexible Modeling: Part A (Advances in Econometrics, Vol. 40A). Emerald Publishing Limited.
Kristoufek, L. 2015. “What are the main drivers of the Bitcoin price? Evidence from wavelet coherence analysis.” PLOS ONE 10 (4): 1–15. doi: 10.1371/journal.pone.0123923
Lee, B. K., and W. N. Lee. 2004. “The effect of information overload on consumer choice quality in an on-line environment.” Psychology and Marketing 21 (3): 159–183. doi: 10.1002/mar.20000
Meese, R. A., and A. K. Rogoff. 1983. “Empirical exchange rate models of the seventies: Do they fit out of sample?” Journal of International Economics 14 (1–2): 3–24. doi: 10.1016/0022-1996(83)90017-X
Mirza, M. B., R. A. Adams, K. Friston, and T. Parr. 2019. “Introducing a Bayesian model of selective attention based on active inference.” Nature, Scientific Reports 9: 1–22. doi: 10.1038/s41598-019-50138-8
Raftery, A., M. Karny, and P. Ettler. 2010. “Online Prediction under Model Uncertainty via Dynamic Model Risk Metrics.” Technical Document, Fourth Edition. http://www.riskmetrics.com/system/files/private/td4e.pdf
Reed, M., and K. Ankouri. 2019. “Collective Perception and Exchange Rates.” Journal of Behavioral Finance 20 (1): 53–65. doi: 10.1080/15427560.2018.1461100
Schwartzstein, J. 2014. “Selective attention and learning.” Journal of the European Economic Association 16 (6): 1423–1452. doi: 10.1111/jeea.12104
Seabold, S., and A. Coppola. 2015. “Nowcasting Prices Using Google Trends: An

Application to Central America.” World Bank Policy Research Working Paper 3798. http://documents.worldbank.org/curated/en/861491467999367566/Nowcasting-prices-using-Google-trends-an-application-to-Central-America
Shannon, C. E. 1948. “A Mathematical Theory of Communication.” Bell Labs Technical Journal 27 (3): 379–423. doi: 10.1002/j.1538-7305.1948.tb01338.x
Sims, C. A. 1998. “Stickiness.” Carnegie-Rochester Conference Series on Public Policy 49: 317–356. doi: 10.1016/S0167-2231(99)00013-5
Sims, C. A. 2003. “Implications of rational inattention.” Journal of Monetary Economics 50 (3): 665–690. doi: 10.1016/S0304-3932(03)00029-1
Sims, C. A. 2006. “Rational Inattention: Beyond the Linear-Quadratic Case.” American Economic Review 96 (2): 158–163. doi: 10.1257/000282806777212431
Sims, C. A. 2010. “Rational inattention and monetary economics.” In: Friedman, B. M., and M. Woodford, eds. Handbook of Monetary Economics 3.
Smith, G. P. 2012. “Google Internet Search Activity and Volatility Prediction in the Market for Foreign Currency.” Finance Research Letters 9 (2): 103–110. doi: 10.1016/j.frl.2012.03.003
Taylor, M. P. “The Economics of Exchange Rates.“ Journal of Economic Literature 33 (1): 13–47. http://www.e-jel.org/archive/mar1995/Taylor.pdf
Yang, D., T. Ma, Y. Wang, and G. Wang. 2020. “Does Investor Attention Affect Stock Trading and Returns? Evidence from Publicly Listed Firms in China.” Journal of Behavioral Finance. doi: 10.1080/15427560.2020.1785469
Wilcoxson, J., L. Follett, and S. Severe. 2020. “Forecasting Foreign Exchange Markets Using Google Trends: Prediction Performance of Competing Models.” Journal of Behavioral Finance. doi: 10.1080/15427560.2020.1716233
Whiteley, L., and M. Sahani. 2012. “Attention in Bayesian framework.” Frontiers in Human Neuroscience 6: 1–21. doi: 10.3389/fnhum.2012.00100 Wu, Y., L. Han, and L. Yin, 2019. “Our currency, your attention: Contagion spillover of investor attention on currency returns.” Economic Modelling 80, 49-61.

Tables and Figures
Table 1. The average posterior probability of including predictors into the models.
Currency Period Predictors
Exchange rate (lag 1)
Inflation differential
Interest rate differential
GDP growth differential
Trade balance differential
M1 growth differential
Stock return differential VIX News
Google searches
EUR 2000–2007 0.696 0.901 0.178 0.490 0.115 0.582 0.910 – 0.520 0.536 2008–2016 0.944 0.972 0.014 0.435 0.015 0.505 0.989 0.052 0.883 0.340
JPY 1980–1984 0.311 0.375 0.455 0.238 0.301 0.243 0.495 – 0.616 – 1985–2007 0.313 0.620 0.690 0.124 0.548 0.555 0.130 – 0.150 0.236 2008–2016 0.661 0.374 0.316 0.211 0.128 0.475 0.410 0.011 0.171 0.070
GBP 1980–1984 0.584 0.584 0.443 0.418 0.574 0.466 – – 0.539 – 1985–2007 0.497 0.519 0.423 0.441 0.161 0.450 0.438 – 0.463 0.405 2008–2016 0.655 0.492 0.403 0.572 0.446 0.467 0.641 0.171 0.516 0.446
AUD 1980–1984 0.426 0.697 0.401 0.390 0.183 0.611 – – 0.494 – 1985–2007 0.799 0.905 0.423 0.817 0.244 0.236 0.398 – 0.722 0.403 2008–2016 0.994 0.848 0.509 0.817 0.115 0.088 0.887 – 0.652 0.560
CAD 1980–1984 0.237 0.667 0.243 0.485 0.321 0.283 0.365 – 0.134 – 1985–2007 0.340 0.608 0.231 0.566 0.416 0.212 0.434 – 0.045 0.407 2008–2016 0.924 0.422 0.138 0.653 0.165 0.205 0.410 – 0.066 0.288
NZD 1980–1984 0.404 0.700 0.462 0.638 0.500 0.520 – – 0.502 – 1985–2007 0.527 0.337 0.507 0.365 0.480 0.526 0.442 – 0.525 0.309 2008–2016 0.612 0.471 0.485 0.504 0.489 0.488 0.520 – 0.485 0.596
Note: Posterior probability of inclusion of predictors in TVP-VAR models. “News” refers to the indices calculated as counts of newsletter articles related to four different categories (economic activity, money, price and trade) in a specific country (Proquest database). Google searches represent the search volume index of the given currency names (Google Trends database).
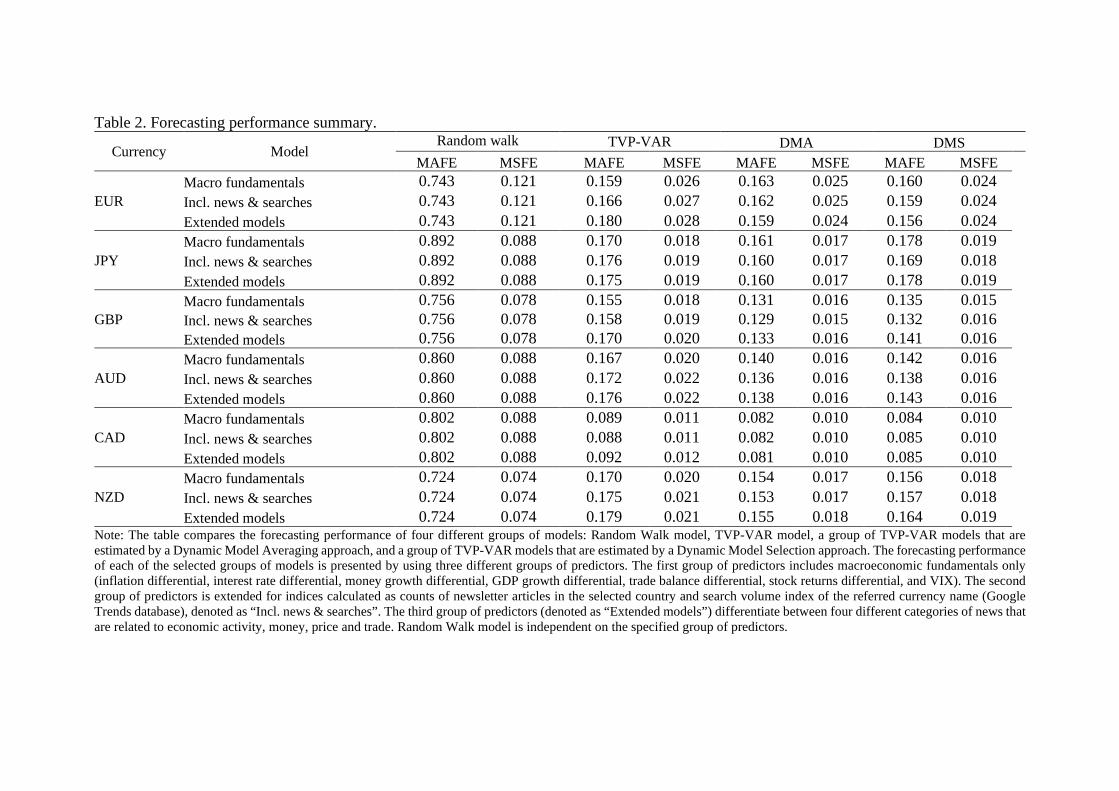
Table 2. Forecasting performance summary.
Currency Model Random walk TVP-VAR DMA DMS
MAFE MSFE MAFE MSFE MAFE MSFE MAFE MSFE
EUR Macro fundamentals 0.743 0.121 0.159 0.026 0.163 0.025 0.160 0.024 Incl. news & searches 0.743 0.121 0.166 0.027 0.162 0.025 0.159 0.024 Extended models 0.743 0.121 0.180 0.028 0.159 0.024 0.156 0.024
JPY Macro fundamentals 0.892 0.088 0.170 0.018 0.161 0.017 0.178 0.019 Incl. news & searches 0.892 0.088 0.176 0.019 0.160 0.017 0.169 0.018 Extended models 0.892 0.088 0.175 0.019 0.160 0.017 0.178 0.019
GBP Macro fundamentals 0.756 0.078 0.155 0.018 0.131 0.016 0.135 0.015 Incl. news & searches 0.756 0.078 0.158 0.019 0.129 0.015 0.132 0.016 Extended models 0.756 0.078 0.170 0.020 0.133 0.016 0.141 0.016
AUD Macro fundamentals 0.860 0.088 0.167 0.020 0.140 0.016 0.142 0.016 Incl. news & searches 0.860 0.088 0.172 0.022 0.136 0.016 0.138 0.016 Extended models 0.860 0.088 0.176 0.022 0.138 0.016 0.143 0.016
CAD Macro fundamentals 0.802 0.088 0.089 0.011 0.082 0.010 0.084 0.010 Incl. news & searches 0.802 0.088 0.088 0.011 0.082 0.010 0.085 0.010 Extended models 0.802 0.088 0.092 0.012 0.081 0.010 0.085 0.010
NZD Macro fundamentals 0.724 0.074 0.170 0.020 0.154 0.017 0.156 0.018 Incl. news & searches 0.724 0.074 0.175 0.021 0.153 0.017 0.157 0.018 Extended models 0.724 0.074 0.179 0.021 0.155 0.018 0.164 0.019
Note: The table compares the forecasting performance of four different groups of models: Random Walk model, TVP-VAR model, a group of TVP-VAR models that are estimated by a Dynamic Model Averaging approach, and a group of TVP-VAR models that are estimated by a Dynamic Model Selection approach. The forecasting performance of each of the selected groups of models is presented by using three different groups of predictors. The first group of predictors includes macroeconomic fundamentals only (inflation differential, interest rate differential, money growth differential, GDP growth differential, trade balance differential, stock returns differential, and VIX). The second group of predictors is extended for indices calculated as counts of newsletter articles in the selected country and search volume index of the referred currency name (Google Trends database), denoted as “Incl. news & searches”. The third group of predictors (denoted as “Extended models”) differentiate between four different categories of news that are related to economic activity, money, price and trade. Random Walk model is independent on the specified group of predictors.
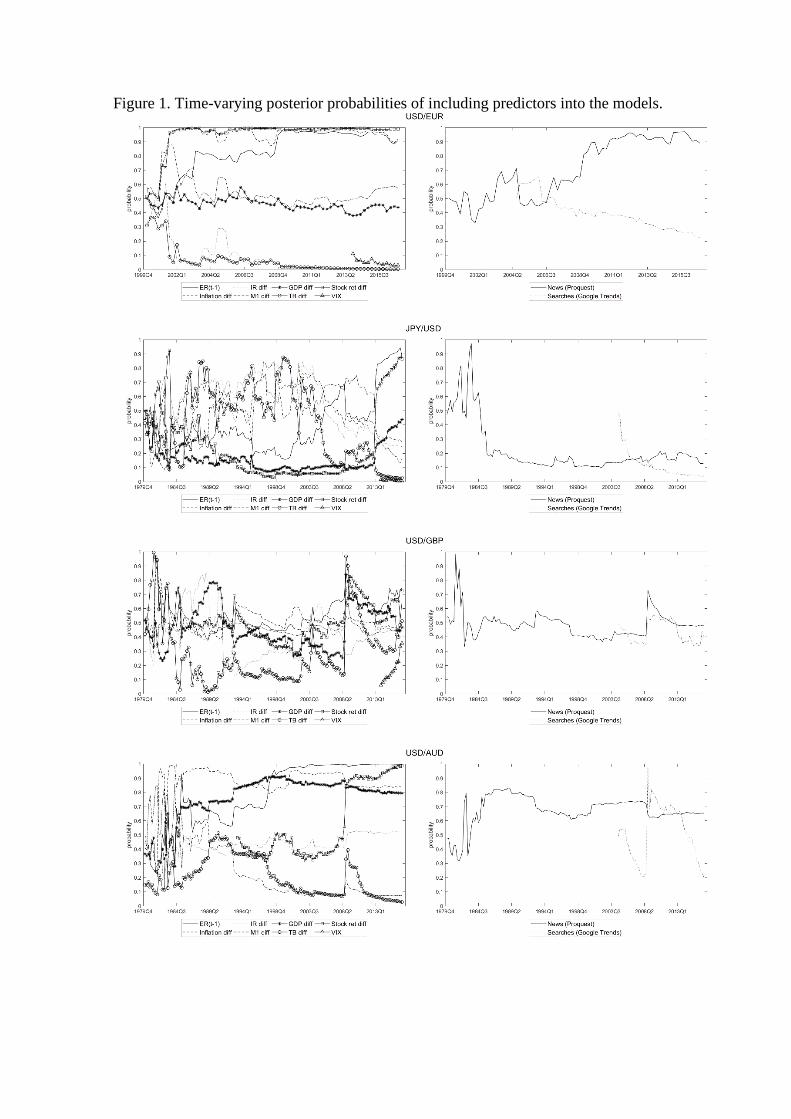
Figure 1. Time-varying posterior probabilities of including predictors into the models.
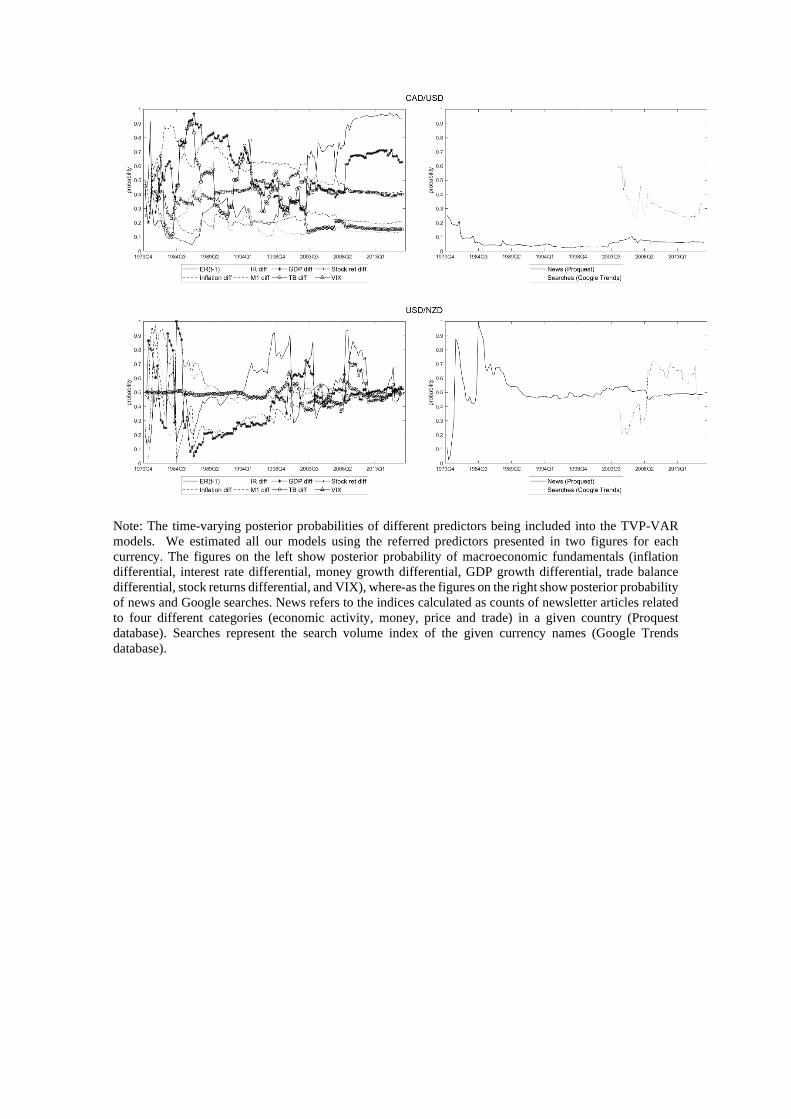
Note: The time-varying posterior probabilities of different predictors being included into the TVP-VAR models. We estimated all our models using the referred predictors presented in two figures for each currency. The figures on the left show posterior probability of macroeconomic fundamentals (inflation differential, interest rate differential, money growth differential, GDP growth differential, trade balance differential, stock returns differential, and VIX), where-as the figures on the right show posterior probability of news and Google searches. News refers to the indices calculated as counts of newsletter articles related to four different categories (economic activity, money, price and trade) in a given country (Proquest database). Searches represent the search volume index of the given currency names (Google Trends database).
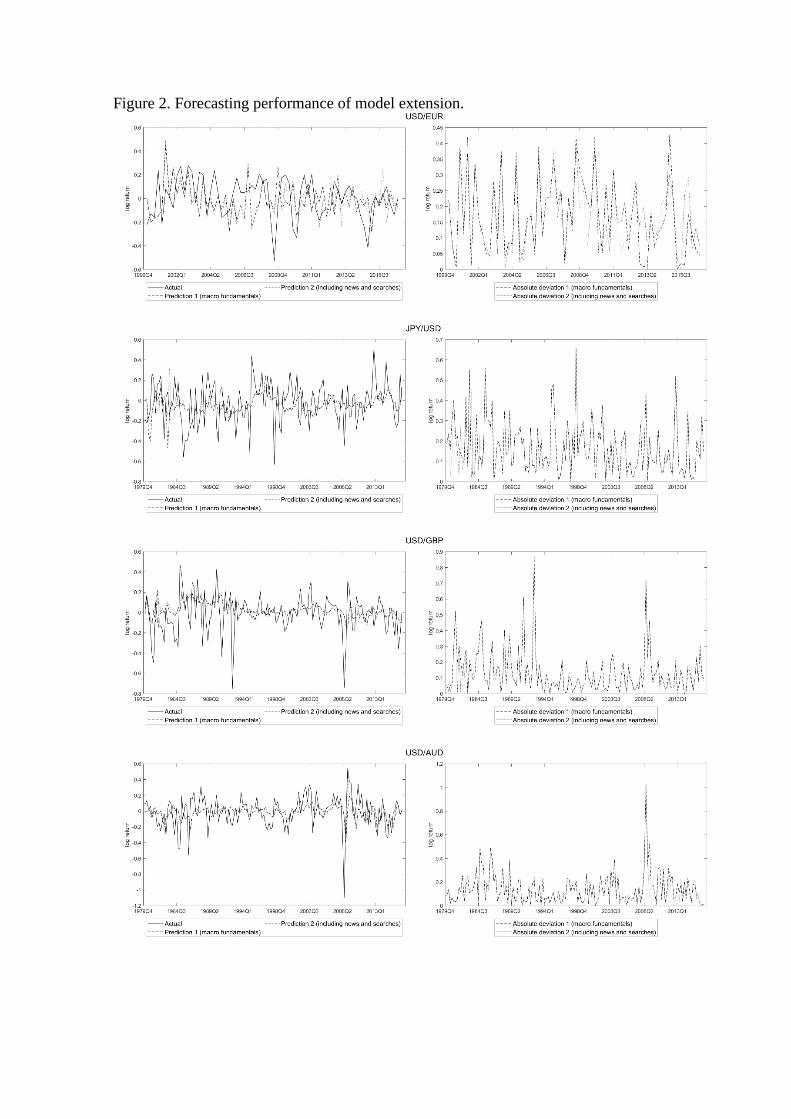
Figure 2. Forecasting performance of model extension.
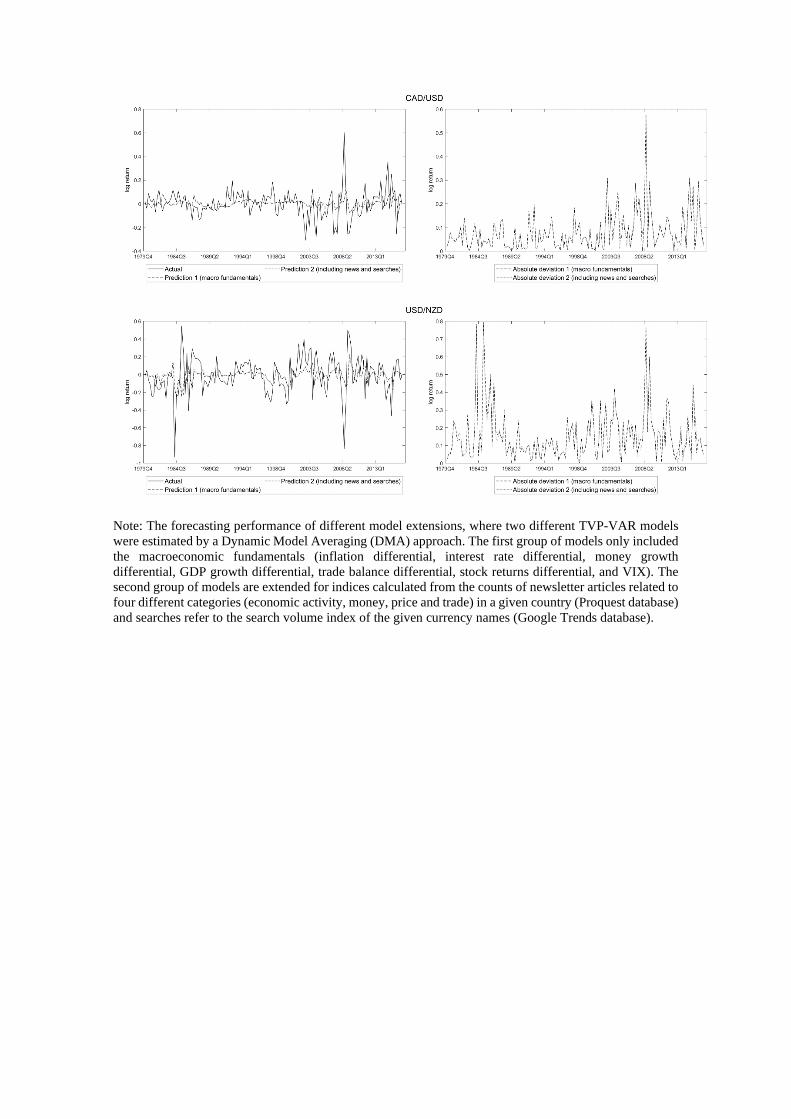
Note: The forecasting performance of different model extensions, where two different TVP-VAR models were estimated by a Dynamic Model Averaging (DMA) approach. The first group of models only included the macroeconomic fundamentals (inflation differential, interest rate differential, money growth differential, GDP growth differential, trade balance differential, stock returns differential, and VIX). The second group of models are extended for indices calculated from the counts of newsletter articles related to four different categories (economic activity, money, price and trade) in a given country (Proquest database) and searches refer to the search volume index of the given currency names (Google Trends database).

Figure 3. Time-varying posterior probabilities of including predictors into the extended models.
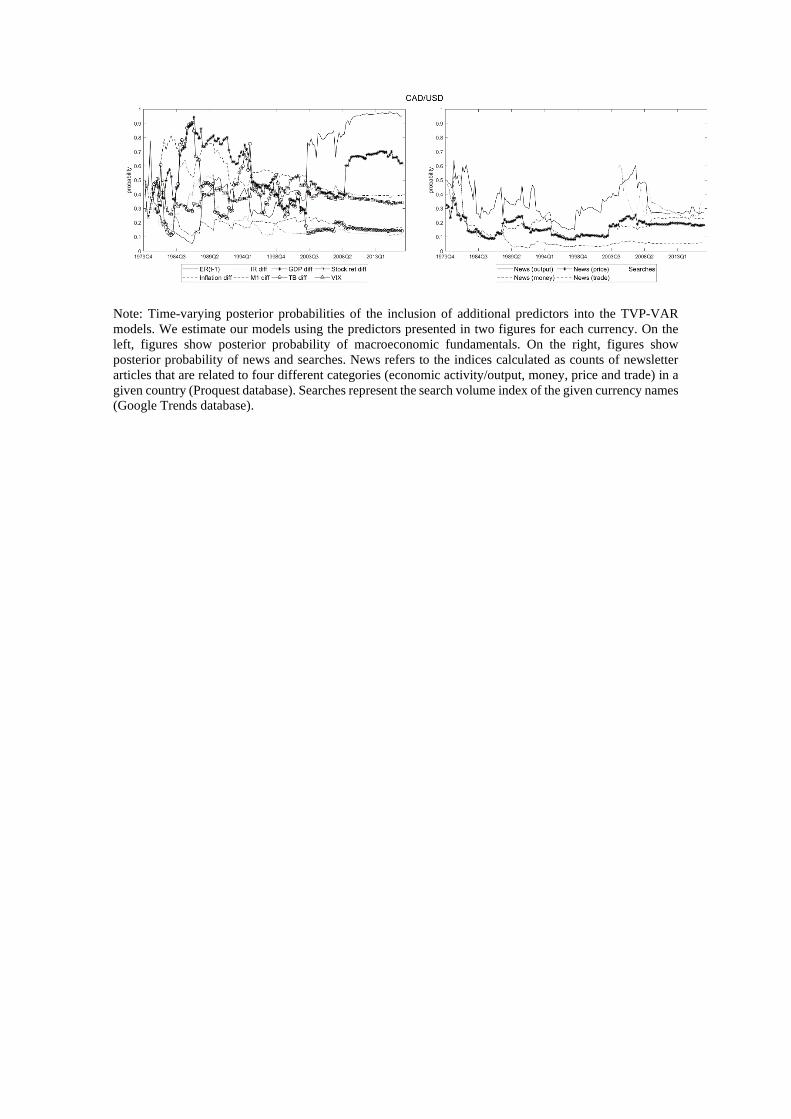
Note: Time-varying posterior probabilities of the inclusion of additional predictors into the TVP-VAR models. We estimate our models using the predictors presented in two figures for each currency. On the left, figures show posterior probability of macroeconomic fundamentals. On the right, figures show posterior probability of news and searches. News refers to the indices calculated as counts of newsletter articles that are related to four different categories (economic activity/output, money, price and trade) in a given country (Proquest database). Searches represent the search volume index of the given currency names (Google Trends database).
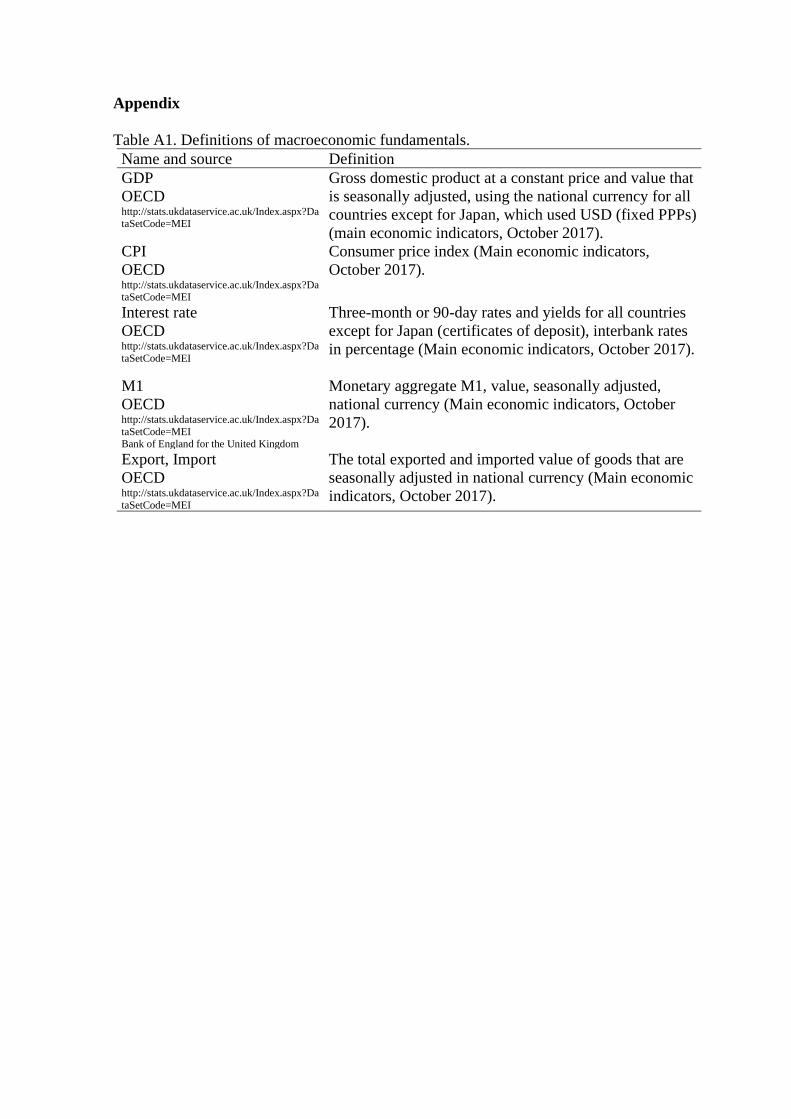
Appendix Table A1. Definitions of macroeconomic fundamentals.
Name and source Definition GDP OECD http://stats.ukdataservice.ac.uk/Index.aspx?DataSetCode=MEI
Gross domestic product at a constant price and value that is seasonally adjusted, using the national currency for all countries except for Japan, which used USD (fixed PPPs) (main economic indicators, October 2017).
CPI OECD http://stats.ukdataservice.ac.uk/Index.aspx?DataSetCode=MEI
Consumer price index (Main economic indicators, October 2017).
Interest rate OECD http://stats.ukdataservice.ac.uk/Index.aspx?DataSetCode=MEI
Three-month or 90-day rates and yields for all countries except for Japan (certificates of deposit), interbank rates in percentage (Main economic indicators, October 2017).
M1 OECD http://stats.ukdataservice.ac.uk/Index.aspx?DataSetCode=MEI Bank of England for the United Kingdom
Monetary aggregate M1, value, seasonally adjusted, national currency (Main economic indicators, October 2017).
Export, Import OECD http://stats.ukdataservice.ac.uk/Index.aspx?DataSetCode=MEI
The total exported and imported value of goods that are seasonally adjusted in national currency (Main economic indicators, October 2017).

Table A2. Forecasting performance improvement in percentage changes.
Currency Model DMA vs. random walk DMS vs. random walk DMA vs. TVP-VAR DMS vs. TVP-VAR
MAFE MSFE MAFE MSFE MAFE MSFE MAFE MSFE
EUR Macro fundamentals 78.1% 79.3% 78.5% 80.2% -2.5% 3.8% -0.6% 7.7% Incl. news & searches 78.2% 79.3% 78.6% 80.2% 2.4% 7.4% 4.2% 11.1% Extended models 78.6% 80.2% 79.0% 80.2% 11.7% 14.3% 13.3% 14.3%
JPY Macro fundamentals 82.0% 80.7% 80.0% 78.4% 5.3% 5.6% -4.7% -5.6% Incl. news & searches 82.1% 80.7% 81.1% 79.5% 9.1% 10.5% 4.0% 5.3% Extended models 82.1% 80.7% 80.0% 78.4% 8.6% 10.5% -1.7% 0.0%
GBP Macro fundamentals 82.7% 79.5% 82.1% 80.8% 15.5% 11.1% 12.9% 16.7% Incl. news & searches 82.9% 80.8% 82.5% 79.5% 18.4% 21.1% 16.5% 15.8% Extended models 82.4% 79.5% 81.3% 79.5% 21.8% 20.0% 17.1% 20.0%
AUD Macro fundamentals 83.7% 81.8% 83.5% 81.8% 16.2% 20.0% 15.0% 20.0% Incl. news & searches 84.2% 81.8% 84.0% 81.8% 20.9% 27.3% 19.8% 27.3% Extended models 84.0% 81.8% 83.4% 81.8% 21.6% 27.3% 18.8% 27.3%
CAD Macro fundamentals 89.8% 88.6% 89.5% 88.6% 7.9% 9.1% 5.6% 9.1% Incl. news & searches 89.8% 88.6% 89.4% 88.6% 6.8% 9.1% 3.4% 9.1% Extended models 89.9% 88.6% 89.4% 88.6% 12.0% 16.7% 7.6% 16.7%
NZD Macro fundamentals 78.7% 77.0% 78.5% 75.7% 9.4% 15.0% 8.2% 10.0% Incl. news & searches 78.9% 77.0% 78.3% 75.7% 12.6% 19.0% 10.3% 14.3% Extended models 78.6% 75.7% 77.3% 74.3% 13.4% 14.3% 8.4% 9.5%
Note: The table compares the forecasting performance improvement in percentage changes. Four different groups of models represent forecasting performance improvement of (1) DMA against Random walk, (2) DMS against Random walk, (3) DMA against TVP-VAR, and (4) DMS against TVP-VAR. We report a percentage change in the values of MAFE/MSFE between two sets of models, where the TVP-VAR or random walk are taken as a base. A positive percentage change indicates improvement in the forecasting performance of the DMA/DMS in comparison to TVP-VAR/random walk as it represents effective decrease in errors measured by MAFE/MSFE; negative percentage change indicates the opposite. The forecasting performance of each of the selected groups of models is presented by using three different groups of predictors. The first group of predictors includes macroeconomic fundamentals only (inflation differential, interest rate differential, money growth differential, GDP growth differential, trade balance differential, stock returns differential, and VIX). The second group of predictors is extended for indices calculated as counts of newsletter articles in the selected country and search volume index of the referred currency name (Google Trends database), denoted as “Incl. news & searches”. The third group of predictors (denoted as “Extended models”) differentiate between four different categories of news that are related to economic activity, money, price and trade. Random Walk model is independent on the specified group of predictors.