selective intra-dinucleotide interactions and ... · these test values were periodical and included...
TRANSCRIPT
Valenzuela Biol Res (2017) 50:3 DOI 10.1186/s40659-017-0112-0
REVIEW
Selective intra-dinucleotide interactions and periodicities of bases separated by K sites: a new vision and tool for phylogeny analysesCarlos Y. Valenzuela*
Abstract
Direct tests of the random or non-random distribution of nucleotides on genomes have been devised to test the hypothesis of neutral, nearly-neutral or selective evolution. These tests are based on the direct base distribution and are independent of the functional (coding or non-coding) or structural (repeated or unique sequences) properties of the DNA. The first approach described the longitudinal distribution of bases in tandem repeats under the Bose–Ein-stein statistics. A huge deviation from randomness was found. A second approach was the study of the base distribu-tion within dinucleotides whose bases were separated by 0, 1, 2… K nucleotides. Again an enormous difference from the random distribution was found with significances out of tables and programs. These test values were periodical and included the 16 dinucleotides. For example a high “positive” (more observed than expected dinucleotides) value, found in dinucleotides whose bases were separated by (3K + 2) sites, was preceded by two smaller “negative” (less observed than expected dinucleotides) values, whose bases were separated by (3K) or (3K + 1) sites. We examined mtDNAs, prokaryote genomes and some eukaryote chromosomes and found that the significant non-random inter-actions and periodicities were present up to 1000 or more sites of base separation and in human chromosome 21 until separations of more than 10 millions sites. Each nucleotide has its own significant value of its distance to neutral-ity; this yields 16 hierarchical significances. A three dimensional table with the number of sites of separation between the bases and the 16 significances (the third dimension is the dinucleotide, individual or taxon involved) gives directly an evolutionary state of the analyzed genome that can be used to obtain phylogenies. An example is provided.
Keywords: Evolutionary theories, Selective nucleotide interactions, Selective periodicities
© The Author(s) 2017. This article is distributed under the terms of the Creative Commons Attribution 4.0 International License (http://creativecommons.org/licenses/by/4.0/), which permits unrestricted use, distribution, and reproduction in any medium, provided you give appropriate credit to the original author(s) and the source, provide a link to the Creative Commons license, and indicate if changes were made. The Creative Commons Public Domain Dedication waiver (http://creativecommons.org/publicdomain/zero/1.0/) applies to the data made available in this article, unless otherwise stated.
BackgroundNearly thirty years ago we undertook the study of the distribution of bases in genomes or chromosomes inde-pendently of their location; or structural, functional, cod-ing or non-coding properties. Our aim was to answer the simple question of the neutral (random) or non-neutral (selective) distribution of nucleotides or bases taken at random from genomes, chromosomes or DNA segments, excluding those mentioned properties of genomes. The general context of this aim was to test evolutionary theories from a new global perspective: are nucleotides
within genomes neutrally or selectively distributed? We could not find studies with this approach in the scientific literature.
Searching for tandem repeats of basesThe first approach, was related to the proportion of bases and longitudinal distribution of sequences of Adenine (A), Thymine (T), Guanine (G) and Cytosine (C) that are contiguous in sets of 0 (no-base), 1, 2… J bases (tan-dem series of each base). We needed to solve the prob-lem of the expected random distribution of bases and non-bases in DNA segments. The solution we found for the distribution of nucleotides on chromosomes was the Bose–Einstein (B–E) statistics [1–4]. We applied this statistics to “bases” among “non-bases” and found that they distributed with a B–E statistics in DNA segments,
Open Access
Biological Research
*Correspondence: [email protected] Programa de Genética Humana, Instituto de Ciencias Biomédicas (ICBM), Facultad de Medicina, Universidad de Chile, Independencia 1027, Casilla 70061, Independencia, Chile

Page 2 of 14Valenzuela Biol Res (2017) 50:3
chromosomes or genomes. Bases behaved as indistin-guishable balls distributed in distinguishable boxes whose walls were given by the non-base distribution [2, 3, 5, 6]. We applied this distribution to the case of HIV-1 virus and found a huge deviation from the neutral expected distribution of bases in the whole viral “chromosome” [2, 7]. Figure 1 shows the base distribution of this virus: A is in dark blue, T in light blue, G in red and C in yel-low; non-bases are in black. The bases of the HIV-1 chro-mosome distributed far from randomness or neutrality; they appeared to be evolving co-selected or co-adapted as a whole. Some features of the mammal, primate and human genome; such as the deficiency of CpG pairs seemed to be mimicked by the HIV-1 virus. It is remark-able that bases tend to be in sequence clusters; this ten-dency is more marked in G and C than in A and T which often do not cluster or present the inverse tendency ([2], not published in other species). However, this condition needs more research.
Searching for non‑random internucleotide interactions of bases in dinucleotidesThe second approach, which is the present subject, was to study dinucleotides to see whether both bases were neu-trally or selectively distributed. To cover all the possibili-ties of interactions we took all dinucleotides whose bases were separated by 0 (contiguous), 1, 2, 3… K nucleotide sites, in an entire genome or DNA segment [2, 3, 8–13]. If N is the number of nucleotides of a genome, we have N−1 contiguous dinucleotides, N−2 dinucleotides sepa-rated by 1 site, N−3 separated by 2 sites… and N−K−1 dinucleotides separated by K sites. The possible dinucle-otides are 16, four bases (A, T, G, C) for the first, times four bases for the second nucleotide 0, 1, 2… K sites downstream. We insist on the condition that the location
of the first and second nucleotide within any nucleotide sequence, unique or repeated, dispersed or in tandem, functional, coding or non-coding and any other struc-tural properties or base sequences are; not only irrelevant for this study, but they are “intentionally” excluded from the analyses. The only included condition is the number of nucleotide sites between the two bases, but the DNA or RNA sequence between them is completely ignored; it is indirectly included as an average of all the inter-bases sequences of that genome or DNA segment.
Main textFoundation and short description of the methodFor any set of dinucleotides, taken from a genome or DNA segment; whose bases are separated by K nucleo-tide sites, we obtained a summary measure of their dif-ference from neutrality. Here, neutrality is assumed to be the random distribution of the second base in relation to the first base. The rigorous expected random propor-tion for each base is ¼ (if the four bases have the same selection coefficient the expected proportion for each is ¼ [14–16]), thus 1/16 for each dinucleotide; however, this seems to be an extreme ideal expectancy. Thus; we assumed that the neutral proportion of bases is the observed proportion in the analyzed DNA. This gives the maximal advantage to the neutral hypothesis, because if the observed frequency of the four bases is really selec-tive, this selective condition cannot be ascertained by the method that has included it into its fundamental assumptions (epistemic circularity). Then; the assumed expected dinucleotide proportion is obtained directly as the product of the frequency of the two bases (of the first and the second nucleotide, respectively; they are equal with the exception of the last nucleotides between them which are not included in the analyses). If f1A, f1T, f1G
Fig. 1 HIV-1 cDNA sequence

Page 3 of 14Valenzuela Biol Res (2017) 50:3
and f1C are the observed frequencies of the bases of the first nucleotide, f2A, f2T, f2G and f2C are the observed frequencies of the bases of the second nucleotide, and D is a generic base, the expected frequency of the dinu-cleotide is directly f1D × f2D. The expected number of dinucleotides is obtained by multiplying this expected frequency by the number of dinucleotides whose separa-tion between both bases is 0, 1, 2… K sites. The statisti-cal test to evaluate the distance to neutrality is the Chi square test (χ2) given by
∑161 [(Oi − Ei)
2/Ei], i between 1 and 16; with 9 degrees of freedom (df ) given by 3 df for the first and the second base, respectively; one df is lost in rows and columns because fA + fT + fG + fC = 1. The expected 0.05 or 5% significance level of χ2
9 is 16.9
(rounded to 17). We can obtain a χ21 value for each pair
with the respective term of the addition or its particular contribution to the total test. This is an underestimated value because it does not include the value of the com-plement to the total addition of values; this complement is always much smaller than the so calculated value and may be neglected; in this case the 5% confidence χ2
1 value
is 3.84. With this method we discovered an enormous deviation from the expected random dinucleotide pro-portion and periodicity in the value of the total deviation and in the specific deviation of each pair [2–4, 7–13].
The description of the behavior of a particular dinu-cleotide allows us to understand better the nature of this periodicity. The behavior of the two bases of a dinucleo-tide is better understood as follows: the random (neutral or nearly) expectancy of the bases predicts that the same or nearly the same number of dinucleotides occur when their bases are separated by (3K), (3K + 1) or (3K + 2) sites (there is no other neutral or nearly neutral expec-tancy because bases are chosen at random without any reference to functional or structural properties); how-ever, analyzing the M. smithii genome ([13], Table 6) we found 1,452,629 CG pairs whose bases are separated by 0–32 sites. The expected number of CG pairs whose bases are separated by (3K), (3K + 1) and (3K + 2) is then 484,209.7, but the observed numbers of pairs are: 413,392
(CG− enormously and negatively selected pairs); 579,517 (CG+ enormously and positively selected pairs); and 459,720 (CG− moderately and negatively selected pairs), respectively. The χ2
1 value due to the deviation of the
positively selected CG pairs alone is greater than 18,759, this implies a probability P < 10−1000, see the following sections. Since in the development of a new field there is possibility of hidden errors, false mathematical mod-els, program errors or other unknown errors, we should consider the history of these programs. First, these pro-grams were elaborated in BASIC nearly 30 years ago, by the author. Twenty years ago an under graduate medi-cal student, knowing the formulae, elaborated almost independently a program in Q-BASIC and a method to obtain figures from the screen. Four years ago another under-graduate student elaborated independently a pro-gram written in Java and new software to obtain figures; and finally the author developed a new program writ-ten in Python. All the programs have yielded the same results. This history suggests that the results are reliable, although we should wait for studies performed by other scientific groups.
An example may show the main elements and traits of the analysisLet us apply our analysis to a hypothetical sequence of one thousand bases with a tandem repeat “ATGC ATGC ATGC ATGC… and so on” until 250 repeats. Let us study only the first 100 dinucleotides or pairs (allowing for the shift of the end nucleotide to complete 100 pairs). With 0 separations (contiguous bases) we have only four pairs AT, TG, GC and CA each one repeated 25 times and the other 12 pairs repeated 0 times. The expected number of pairs is 6.25 for every pair, because there are 100 dinucleotides and each base occurs (randomly or neutrally) with probability 0.25. In Table 1, where we compute the χ2
9 test (for 0 site sepa-
ration), there are twelve boxes with 0 dinucleotides that are negatively selected (−){12 × (6.25 − 0)2/6.25 = 75}; and four boxes with 25 dinucleotides that are positively selected (+){4 × (6.25 − 25)2/6.25 = 225}; the total is
Table 1 The χ2
9 analysis of 100 dinucleotides of 25 ATGC tandem repeats
2° Base 0 Separation
Adenine Thymine Guanine Cytosine Total
1° Base Exp Obs Exp Obs Exp Obs Exp Obs Exp Obs
Adenine 6.25 0 6.25 25 6.25 0 6.25 0 25 25
Thymine 6.25 0 6.25 0 6.25 25 6.25 0 25 25
Guanine 6.25 0 6.25 0 6.25 0 6.25 25 25 25
Cytosine 6.25 25 6.25 0 6.25 0 6.25 0 25 25
Total 25 25 25 25 25 25 25 25 100 100

Page 4 of 14Valenzuela Biol Res (2017) 50:3
χ29= 75+ 225 = 300, a highly significant test (P < 10−15).
Let us compute for 1 site separation; the pairs are now AG, TC, GA and CT repeated 25 times and the other 12 pairs repeated 0 times; then the χ2
9 test will be again 300.
With 2 sites separation the pairs are: AC, TA, GT and CG, 25 each one and 0 the remaining pairs, the χ2
9 test will be
again 300; with 3 sites separation the pairs are AA, TT, GG and CC, 25 each and the other pairs are 0 and the test will be 300. The four sites separation is equal to the 0 site sepa-ration and the cycle is repeated n (25) times. The χ2
1 con-
tributions are given equally by the four positively selected dinucleotides (25 − 6.25)2/6.25 = 56.25 and the twelve negatively selected ones (0 − 6.25)2/6.25 = 6.25. We see that this periodic base sequence does not show a periodic value of the χ2
9 test; on the contrary the series of χ2
9 values
is invariant: 300, 300, 300, 300… This shows that periodic base sequences have nothing to do with periodicities of the χ29 value. DNA segments like the one analyzed do exist in
hundreds or thousands in any eukaryote genome which is why the global significance of a genome reaches χ2
9 values
of hundreds of thousands or even millions.Let us demonstrate that polymorphic haplotypes or
base sequences are not related to our analyses. Imagine that there are two haplotypes in the population; one hap-lotype is the tandem repeat ATGC ATGC… ×250 and the second haplotype is completely different with the tan-dem GTAC GTAC… ×250. In the second haplotype, with 0 site separation the dinucleotides are now: GT, TA, AC and CG repeated 25 times (in 100 dinucleotides) and the other 12 dinucleotides are absent; the series with bases separated by 1 site gives GA, TC, AG and CT dinucleo-tides repeated 25 times and the other 12 dinucleotides are absent, and so on for separations of 2, 3… sites. The analysis for these completely different haplotypes gives the same result 300, 300, 300, 300… This demonstrates that sequence periodicities are not related to this type of stochastic periodicity, with the exception of obvious mathematical relationships (multiple of 3 or other related mathematical functions, as we shall see in the collagen gene). There are 24 (4!) sets of four bases whose tandem repeat yields the same results. Base sequences are not rel-evant and this test is blind to them. However, this test is extremely valuable to discover systematic relationships of bases beyond their sequences (selective or non-neutral trans-sequence relationships).
The χ2
9 value measures the difference from neutrality
and fits the Wright’s adaptive peaksThe χ2
9 is a summary value of the deviation from neu-
trality of this whole genome or given DNA segment for this particular set of dinucleotides whose bases are sepa-rated by K sites. This is a measure of how distant from neutrality or how selective (non-neutral) this genome is.
Once this measure is obtained it is impossible to search for the specific sequences that are involved in it, because all the nucleotide sequences have been sent to a grind-ing machine that destroys them conserving only the site number of nucleotides to calculate the distance in nucleotide sites between two of them. We have only one selective value for that genome or DNA segment (the χ2
9
value) and one selective value (the χ21 value) for each of
the 16 classes of dinucleotides. These sets of Chi square values typify an adaptive condition or perspective of this genome or DNA segment. This adaptive condition of genomes or DNA segments coincides conceptually with a Wright adaptive peak in the adaptive landscape [3, 4, 17–19]. However, a very important conceptual differ-ence must be remarked; the Wrightian shift of the peaks in this landscape could be due to “random” drift; while in the present analyses the only possible process that can lead to such huge differences from neutrality is a series of selective non-random historical contingencies. These contingent events have been assumed non-critically to occur at random, but, evolutionary contingencies seldom occur, randomly [3].
The case of Drosophila melanogaster mtDNATable 2 shows the analysis for the mtDNA of Drosophila melanogaster (taken and adapted from [8] and [10], see the figure of base distribution in [10]). We observe the enormous deviation from neutrality of the total set of dinucleotides from 0 to 17 sites of separation. As was mentioned the significance level at 5% for the total χ2
9 is
17, and for the individual pair contribution (χ21) is 3.84.
We see χ29 values from 37 to 485 out of the range of any
current Chi square table or program. In these “out of the range values” we estimated the significance knowing that the expected Chi square value is equal to the df and the variance equal to 2df. Thus, we approximated the sig-nificance value by using the normalization (Gaussian) of the Chi square distribution according to the number of standard deviations from the mean value. With 9 df, the error included in this approximation is not large, and may be neglected. We approximated the significance by assimilating one decimal point of significance for every 2 standard deviations (a very conservative criterion) equal to 2 2
√18 = 8.49 (we rounded it to 10) over the mean (9).
The first value 485 is equivalent to 112.2 standard devia-tions (SD) from the mean; thus the significance value with probability of occurrence at random is P = 10−56.1 . The minimal value 37 gives P < 10−6 (from tables or programs). These huge values, of the deviation from neutrality of the distribution of random dinucleotides (they are replaced in this study by all the possible dinu-cleotide that is the maximum random sample) from the total mtDNA, lead to the conclusion that no neutrality or

Page 5 of 14Valenzuela Biol Res (2017) 50:3
near-neutrality is possible in this genome, as far as bases of dinucleotides separated by 0, 1,… 17 sites are con-cerned. Every base is co-adapted with every base of the remaining (residual) genome. Is this deviation restricted to 17 sites of separations? Our study showed that signifi-cant χ2
9 values were found up to 2000 and more sites of
separation [10, 13]; thus these interactions cannot be pro-duced by coding or non-coding functions or any struc-tural restrictions (this DNA has less than 20,000 bp, most of it is coding DNA and both strands are coding strands. Large separations imply that the first base is in one cod-ing segment and the second is in another coding seg-ment). We have studied the behavior of each dinucleotide and all of them show significant interaction and periodic-ity [13]. The significant interactions and periodicities are not homogeneously distributed along the chromosome; they may vary so as to find DNA segments where dinu-cleotides are randomly distributed; this heterogeneity has been studied and described [10].
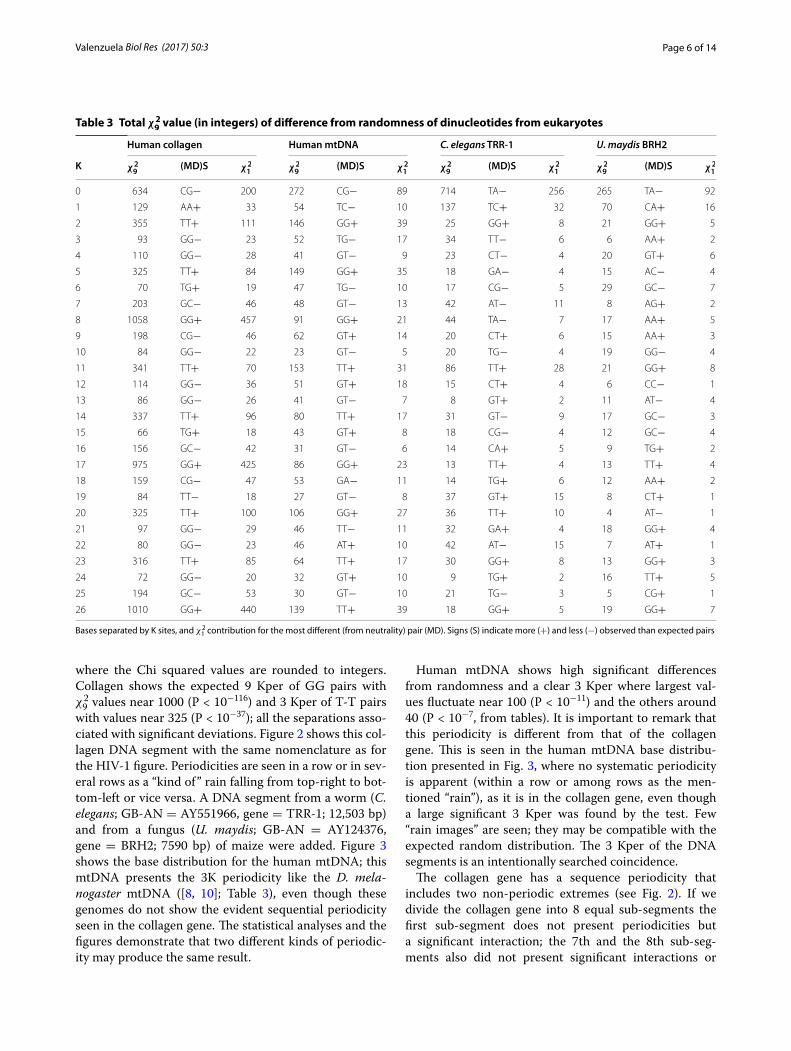
Some particular DNA segments chosen for their known organizational propertiesEukaryote DNA segmentsTable 3 shows the statistical analysis for four eukaryote DNA segments including the human mtDNA [GenBank accession number (GB-AN) = DQ523630; 16,569 bp]
chosen to be compared with the already presented D melanogaster mtDNA. The number of sites between bases (separation) ranges from 0 to 26. A collagen gene was chosen because it codes for the periodic amino acid collagen molecule. This is the collagen type I alpha 2 gene (GB-AN = NM_000089, gene = COL1A2; 5411 bp); it was chosen because of its known periodicity due to the repetition of the amino acid triplet G-X-Y, where G is glycine and X and Y are other amino acids (often proline as X and 4-hydroxy-proline as Y); thus it has a periodic-ity of 9 nucleotides, or 9 Kper, that has been maintained for 800 million years [20] and has resisted a great num-ber of mutations, some of which are known in any clini-cal genetic service [21]. This periodicity is produced because the codons for glycine are GGU, GGC, GGA and GGG; we use here the DNA that is homologous to the RNA, thus, the triplets are GGT, GGC, GGA and GGG, respectively. Proline and hydroxyproline (a post-trans-lated hydroxylated proline) are coded by the same set of codons whose “coding” DNA is CCA, CCG, CCT and CCC respectively. The codons are not distributed equally in both glycine and proline; those ending in T produce a T-3 Kper. This periodic DNA segment was chosen also to test our programs; if they work they should show the largest χ2
9 value for 9 Kper (1° GG, 2°, 3°,… 9° GG) and
a second for 3 Kper (T..T..T), as is described in Table 3
Table 2 Total χ2
9 values and its χ2
1 contribution of the most significant dinucleotide
Separations from 0 to17 sites. D. melanogaster mtDNA
Sep, number of separation sites; χ21
Co, χ21
contribution of this pair to the total χ29
value (in integers); ↑ more observed than expected pairs; ↓ less observed than expected pairs
Sep χ2
91° Pair 2° Pair 3° Pair 4° Pair 5° Pair
Pair χ2
1Co Pair χ
2
1Co Pair χ
2
1Co Pair χ
2
1Co Pair χ
2
1Co
0 485 (GG)↑ 124 (CC)↑ 113 (GT)↓ 91 (GC)↑ 50 (TT)↑ 28
1 94 (CG)↑ 36 (CC)↑ 25 (CT)↓ 12 (AG)↓ 6 (TC)↓ 4
2 405 (GG)↑ 116 (CC)↑ 106 (GC)↑ 33 (CG)↑ 25 (TG)↓ 23
3 114 (GC)↑ 23 (AA)↑ 22 (TT)↑ 15 (TA)↓ 11 (CC)↑ 9
4 47 (CG)↑ 20 (AG)↓ 8 (AT)↑ 6 (CT)↓ 4 (GT)↓ 2
5 381 (GG)↑ 139 (CC)↑ 51 (AG)↓ 32 (GC)↑ 32 (CG)↑ 30
6 87 (GC)↑ 38 (TA)↑ 14 (TC)↓ 12 (GA)↓ 6 (AA)↓ 5
7 37 (CG)↑ 17 (CT)↓ 7 (TG)↓ 3 (GG)↑ 3 (TT)↑ 2
8 375 (GG)↑ 149 (CC)↑ 45 (CG)↑ 36 (GC)↑ 29 (TG)↓ 24
9 76 (GC)↑ 34 (GA)↓ 16 (TC)↓ 12 (GG)↑ 8 (CG)↓ 2
10 49 (CG)↑ 28 (AG)↓ 6 (CT)↓ 6 (AT)↑ 4 (TA)↑ 1
11 367 (GG)↑ 144 (GC)↑ 45 (CC)↑ 35 (CG)↑ 26 (AG)↓ 23
12 65 (GC)↑ 34 (GA)↓ 13 (TC)↓ 8 (CG)↓ 3 (CA)↑ 2
13 70 (CG)↑ 38 (AG)↓ 13 (AA)↑ 5 (GC)↓ 3 (CA)↓ 2
14 310 (GG)↑ 78 (CG)↑ 48 (GC)↑ 44 (CC)↑ 32 (GA)↓ 22
15 60 (GC)↑ 34 (GA)↓ 10 (CG)↓ 6 (TC)↓ 3 (CT)↑ 2
16 52 (CG)↑ 27 (AG)↓ 12 (AA)↑ 3 (CT)↓ 2 (CA)↓ 2
17 322 (GG)↑ 91 (CG)↑ 45 (CC)↑ 40 (GC)↑ 22 (AA)↑ 22
Page 6 of 14Valenzuela Biol Res (2017) 50:3
where the Chi squared values are rounded to integers. Collagen shows the expected 9 Kper of GG pairs with χ29 values near 1000 (P < 10−116) and 3 Kper of T-T pairs
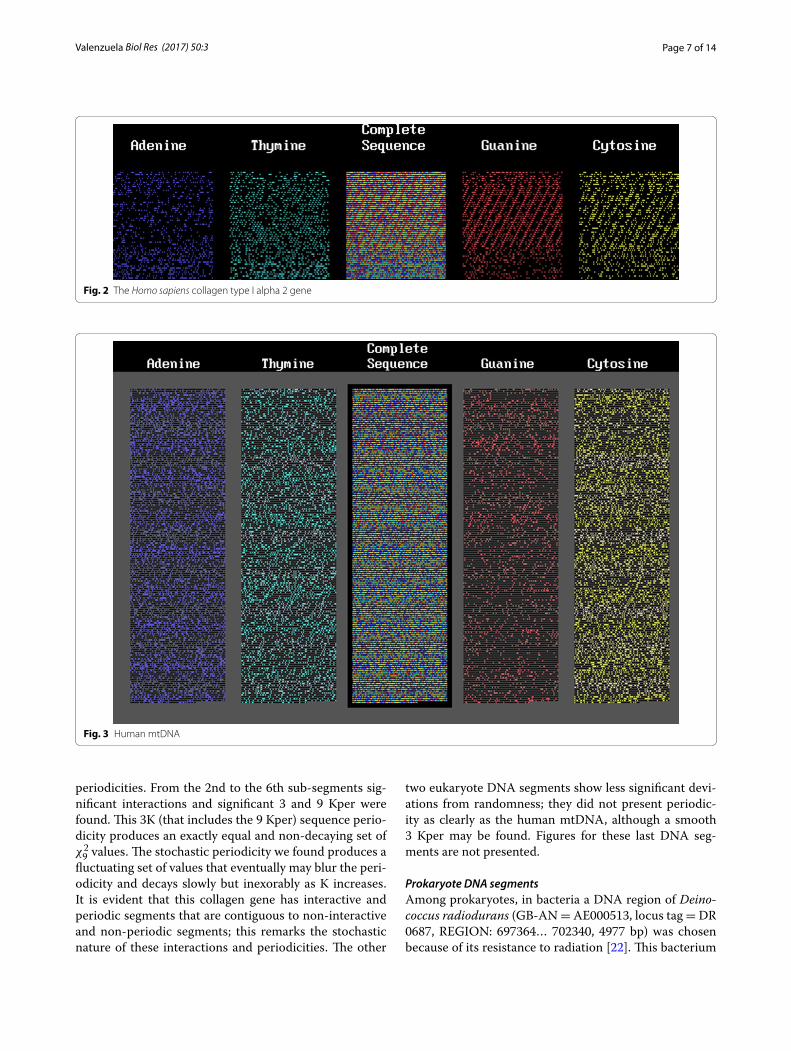
with values near 325 (P < 10−37); all the separations asso-ciated with significant deviations. Figure 2 shows this col-lagen DNA segment with the same nomenclature as for the HIV-1 figure. Periodicities are seen in a row or in sev-eral rows as a “kind of” rain falling from top-right to bot-tom-left or vice versa. A DNA segment from a worm (C. elegans; GB-AN = AY551966, gene = TRR-1; 12,503 bp) and from a fungus (U. maydis; GB-AN = AY124376, gene = BRH2; 7590 bp) of maize were added. Figure 3 shows the base distribution for the human mtDNA; this mtDNA presents the 3K periodicity like the D. mela-nogaster mtDNA ([8, 10]; Table 3), even though these genomes do not show the evident sequential periodicity seen in the collagen gene. The statistical analyses and the figures demonstrate that two different kinds of periodic-ity may produce the same result.
Human mtDNA shows high significant differences from randomness and a clear 3 Kper where largest val-ues fluctuate near 100 (P < 10−11) and the others around 40 (P < 10−7, from tables). It is important to remark that this periodicity is different from that of the collagen gene. This is seen in the human mtDNA base distribu-tion presented in Fig. 3, where no systematic periodicity is apparent (within a row or among rows as the men-tioned “rain”), as it is in the collagen gene, even though a large significant 3 Kper was found by the test. Few “rain images” are seen; they may be compatible with the expected random distribution. The 3 Kper of the DNA segments is an intentionally searched coincidence.
The collagen gene has a sequence periodicity that includes two non-periodic extremes (see Fig. 2). If we divide the collagen gene into 8 equal sub-segments the first sub-segment does not present periodicities but a significant interaction; the 7th and the 8th sub-seg-ments also did not present significant interactions or
Table 3 Total χ2
9 value (in integers) of difference from randomness of dinucleotides from eukaryotes
Bases separated by K sites, and χ21
contribution for the most different (from neutrality) pair (MD). Signs (S) indicate more (+) and less (−) observed than expected pairs
Human collagen Human mtDNA C. elegans TRR‑1 U. maydis BRH2
K χ2
9(MD)S χ
2
1χ2
9(MD)S χ
2
1χ2
9(MD)S χ
2
1χ2
9(MD)S χ
2
1
0 634 CG− 200 272 CG− 89 714 TA− 256 265 TA− 92
1 129 AA+ 33 54 TC− 10 137 TC+ 32 70 CA+ 16
2 355 TT+ 111 146 GG+ 39 25 GG+ 8 21 GG+ 5
3 93 GG− 23 52 TG− 17 34 TT− 6 6 AA+ 2
4 110 GG− 28 41 GT− 9 23 CT− 4 20 GT+ 6
5 325 TT+ 84 149 GG+ 35 18 GA− 4 15 AC− 4
6 70 TG+ 19 47 TG− 10 17 CG− 5 29 GC− 7
7 203 GC− 46 48 GT− 13 42 AT− 11 8 AG+ 2
8 1058 GG+ 457 91 GG+ 21 44 TA− 7 17 AA+ 5
9 198 CG− 46 62 GT+ 14 20 CT+ 6 15 AA+ 3
10 84 GG− 22 23 GT− 5 20 TG− 4 19 GG− 4
11 341 TT+ 70 153 TT+ 31 86 TT+ 28 21 GG+ 8
12 114 GG− 36 51 GT+ 18 15 CT+ 4 6 CC− 1
13 86 GG− 26 41 GT− 7 8 GT+ 2 11 AT− 4
14 337 TT+ 96 80 TT+ 17 31 GT− 9 17 GC− 3
15 66 TG+ 18 43 GT+ 8 18 CG− 4 12 GC− 4
16 156 GC− 42 31 GT− 6 14 CA+ 5 9 TG+ 2
17 975 GG+ 425 86 GG+ 23 13 TT+ 4 13 TT+ 4
18 159 CG− 47 53 GA− 11 14 TG+ 6 12 AA+ 2
19 84 TT− 18 27 GT− 8 37 GT+ 15 8 CT+ 1
20 325 TT+ 100 106 GG+ 27 36 TT+ 10 4 AT− 1
21 97 GG− 29 46 TT− 11 32 GA+ 4 18 GG+ 4
22 80 GG− 23 46 AT+ 10 42 AT− 15 7 AT+ 1
23 316 TT+ 85 64 TT+ 17 30 GG+ 8 13 GG+ 3
24 72 GG− 20 32 GT+ 10 9 TG+ 2 16 TT+ 5
25 194 GC− 53 30 GT− 10 21 TG− 3 5 CG+ 1
26 1010 GG+ 440 139 TT+ 39 18 GG+ 5 19 GG+ 7
Page 7 of 14Valenzuela Biol Res (2017) 50:3
periodicities. From the 2nd to the 6th sub-segments sig-nificant interactions and significant 3 and 9 Kper were found. This 3K (that includes the 9 Kper) sequence perio-dicity produces an exactly equal and non-decaying set of χ29 values. The stochastic periodicity we found produces a
fluctuating set of values that eventually may blur the peri-odicity and decays slowly but inexorably as K increases. It is evident that this collagen gene has interactive and periodic segments that are contiguous to non-interactive and non-periodic segments; this remarks the stochastic nature of these interactions and periodicities. The other
two eukaryote DNA segments show less significant devi-ations from randomness; they did not present periodic-ity as clearly as the human mtDNA, although a smooth 3 Kper may be found. Figures for these last DNA seg-ments are not presented.
Prokaryote DNA segmentsAmong prokaryotes, in bacteria a DNA region of Deino-coccus radiodurans (GB-AN = AE000513, locus tag = DR 0687, REGION: 697364… 702340, 4977 bp) was chosen because of its resistance to radiation [22]. This bacterium
Fig. 2 The Homo sapiens collagen type I alpha 2 gene
Fig. 3 Human mtDNA
Page 8 of 14Valenzuela Biol Res (2017) 50:3
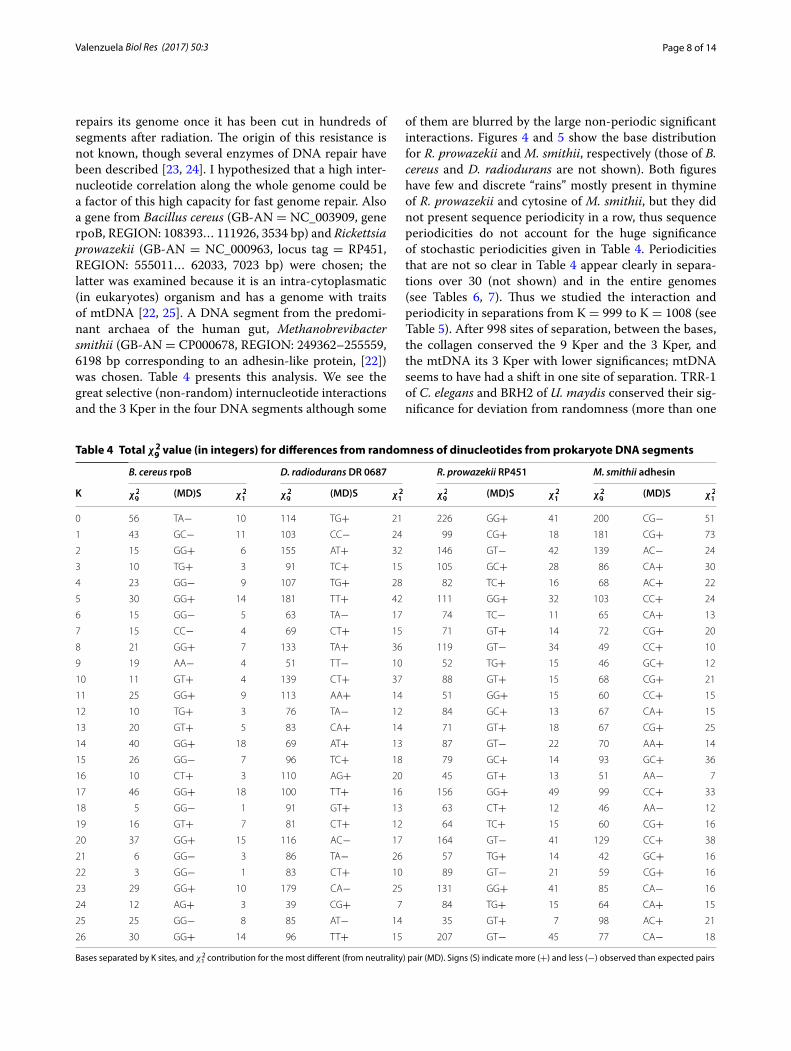
repairs its genome once it has been cut in hundreds of segments after radiation. The origin of this resistance is not known, though several enzymes of DNA repair have been described [23, 24]. I hypothesized that a high inter-nucleotide correlation along the whole genome could be a factor of this high capacity for fast genome repair. Also a gene from Bacillus cereus (GB-AN = NC_003909, gene rpoB, REGION: 108393… 111926, 3534 bp) and Rickettsia prowazekii (GB-AN = NC_000963, locus tag = RP451, REGION: 555011… 62033, 7023 bp) were chosen; the latter was examined because it is an intra-cytoplasmatic (in eukaryotes) organism and has a genome with traits of mtDNA [22, 25]. A DNA segment from the predomi-nant archaea of the human gut, Methanobrevibacter smithii (GB-AN = CP000678, REGION: 249362–255559, 6198 bp corresponding to an adhesin-like protein, [22]) was chosen. Table 4 presents this analysis. We see the great selective (non-random) internucleotide interactions and the 3 Kper in the four DNA segments although some
of them are blurred by the large non-periodic significant interactions. Figures 4 and 5 show the base distribution for R. prowazekii and M. smithii, respectively (those of B. cereus and D. radiodurans are not shown). Both figures have few and discrete “rains” mostly present in thymine of R. prowazekii and cytosine of M. smithii, but they did not present sequence periodicity in a row, thus sequence periodicities do not account for the huge significance of stochastic periodicities given in Table 4. Periodicities that are not so clear in Table 4 appear clearly in separa-tions over 30 (not shown) and in the entire genomes (see Tables 6, 7). Thus we studied the interaction and periodicity in separations from K = 999 to K = 1008 (see Table 5). After 998 sites of separation, between the bases, the collagen conserved the 9 Kper and the 3 Kper, and the mtDNA its 3 Kper with lower significances; mtDNA seems to have had a shift in one site of separation. TRR-1 of C. elegans and BRH2 of U. maydis conserved their sig-nificance for deviation from randomness (more than one
Table 4 Total χ2
9 value (in integers) for differences from randomness of dinucleotides from prokaryote DNA segments
Bases separated by K sites, and χ21
contribution for the most different (from neutrality) pair (MD). Signs (S) indicate more (+) and less (−) observed than expected pairs
B. cereus rpoB D. radiodurans DR 0687 R. prowazekii RP451 M. smithii adhesin
K χ2
9(MD)S χ
2
1χ2
9(MD)S χ
2
1χ2
9(MD)S χ
2
1χ2
9(MD)S χ
2
1
0 56 TA− 10 114 TG+ 21 226 GG+ 41 200 CG− 51
1 43 GC− 11 103 CC− 24 99 CG+ 18 181 CG+ 73
2 15 GG+ 6 155 AT+ 32 146 GT− 42 139 AC− 24
3 10 TG+ 3 91 TC+ 15 105 GC+ 28 86 CA+ 30
4 23 GG− 9 107 TG+ 28 82 TC+ 16 68 AC+ 22
5 30 GG+ 14 181 TT+ 42 111 GG+ 32 103 CC+ 24
6 15 GG− 5 63 TA− 17 74 TC− 11 65 CA+ 13
7 15 CC− 4 69 CT+ 15 71 GT+ 14 72 CG+ 20
8 21 GG+ 7 133 TA+ 36 119 GT− 34 49 CC+ 10
9 19 AA− 4 51 TT− 10 52 TG+ 15 46 GC+ 12
10 11 GT+ 4 139 CT+ 37 88 GT+ 15 68 CG+ 21
11 25 GG+ 9 113 AA+ 14 51 GG+ 15 60 CC+ 15
12 10 TG+ 3 76 TA− 12 84 GC+ 13 67 CA+ 15
13 20 GT+ 5 83 CA+ 14 71 GT+ 18 67 CG+ 25
14 40 GG+ 18 69 AT+ 13 87 GT− 22 70 AA+ 14
15 26 GG− 7 96 TC+ 18 79 GC+ 14 93 GC+ 36
16 10 CT+ 3 110 AG+ 20 45 GT+ 13 51 AA− 7
17 46 GG+ 18 100 TT+ 16 156 GG+ 49 99 CC+ 33
18 5 GG− 1 91 GT+ 13 63 CT+ 12 46 AA− 12
19 16 GT+ 7 81 CT+ 12 64 TC+ 15 60 CG+ 16
20 37 GG+ 15 116 AC− 17 164 GT− 41 129 CC+ 38
21 6 GG− 3 86 TA− 26 57 TG+ 14 42 GC+ 16
22 3 GG− 1 83 CT+ 10 89 GT− 21 59 CG+ 16
23 29 GG+ 10 179 CA− 25 131 GG+ 41 85 CA− 16
24 12 AG+ 3 39 CG+ 7 84 TG+ 15 64 CA+ 15
25 25 GG− 8 85 AT− 14 35 GT+ 7 98 AC+ 21
26 30 GG+ 14 96 TT+ 15 207 GT− 45 77 CA− 18

Page 9 of 14Valenzuela Biol Res (2017) 50:3
value over 17) but did not show periodicity. In the four prokaryotes both selective interactions and periodicity were clearly present.
Among viruses, HIV-1 was already studied [2, 7, 8, 10]; a large internucleotide interaction was found but not a clear periodicity.
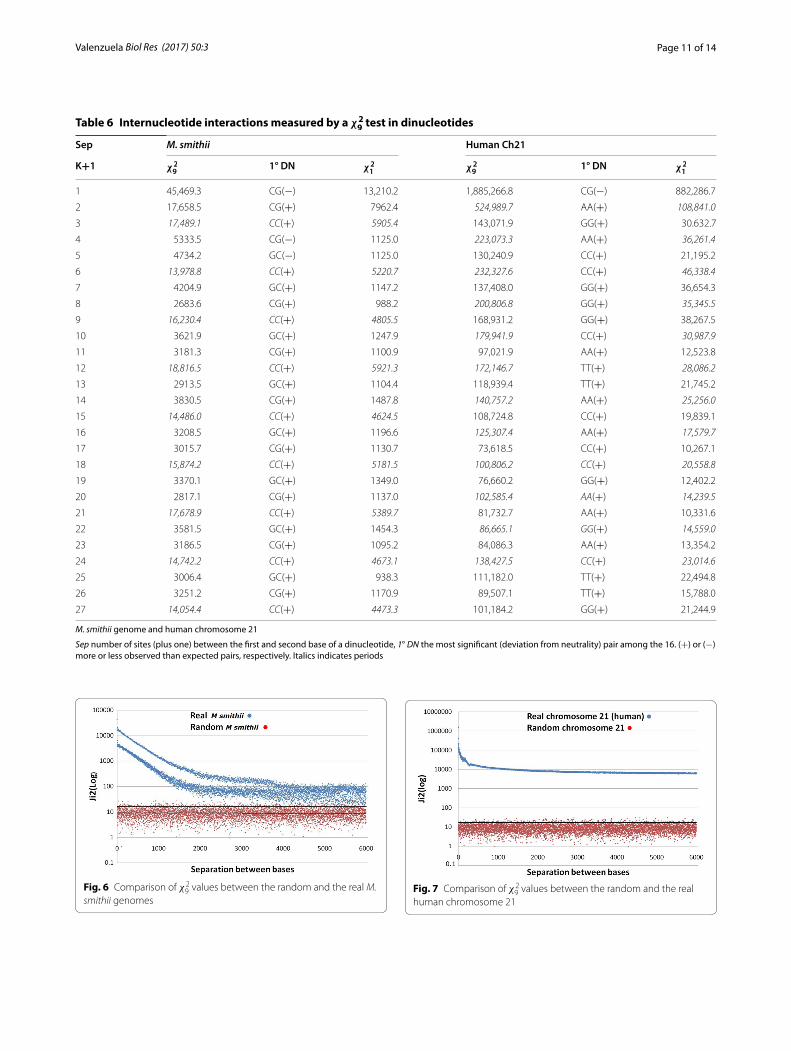
Larger genomes and separations between basesThe analysis was extended to the complete genome of Methanobrevibacter smithii (archaea; GenBank, M. smithii: NC_009515.1; 1,853,160 bp) and human chromo-some 21 (HCh21, GB-AN = NC_000021.9; 46,709,983 bp from which only 40,088,619 could be included as A, T, G or C). This is shown in Table 6 with separations between 0 and 26 sites. As noted, we had not found clear perio-dicities in virus and eukaryote DNA segments [2, 8] but HCh21 showed 2K and 6K periodicities ([12], this article). The 3K periodicity is evident in the M. smithii genome. The minimum total significant values of the base to base interaction was χ2
9= 2683.6 (at Sep 8) in
the case of M. smithii (P < 10−315) and 63,342.0 (at Sep
33) for HCh21 (P < 10−7463.9). The maximal significance implies a probability less than 10−180,000 a value that leads us to think of a meta-intelligent design (Laplacian vast intelligence?) where everything, in the universe, is deter-mined since the beginning. We have reviewed around 30 prokaryote genomes and 30 mtDNA that presented a high internucleotide interaction and 3K periodicity. In about 10 DNA segments of eukaryote genomes we found large interactions but we did not find clear perio-dicities except in the collagen genes as was mentioned. However, we found a 3 Kper in the six chromosomes of C. elegans and some periodicities in other human chro-mosomes. Figures 6 and 7 show χ2
9 values for M. smithii
and HCh21, respectively, until Sep 6000. These figures show in red the χ2
9 values for randomly-constructed M.
smithii and HCh21 DNAs for a visual statistical compari-son. These figures were constructed during a research unit of under graduated students [12]; the human chro-mosome 21 was an old version of its q-arm and less than 33,000,000 bp, and the M. smithii was also an old version in which the genome had a small but important
Fig. 4 A gene from Rickettsia prowazekii
Fig. 5 A gene from Methanobrevibacter smithii
Page 10 of 14Valenzuela Biol Res (2017) 50:3
proportion of non identified bases; HCh21 showed sig-nificant interactions with separations over 15 millions nucleotide sites. The results of both versions of M. smithii are completely comparable; some differences were found in the two versions of HCh21 (this is due to the number of bp analyzed and the proportion of unknown bases), in relation to data presented in Table 6, but not at a level to change the results presented in Fig. 7. These figures are presented to acknowledge the hard and devoted work of these students. Table 6 was constructed with the updated information. It is important to know that these randomly constructed genomes yielded χ2
9 values completely in
agreement with the expected theoretical values; this gives strong confirming evidence to our method.
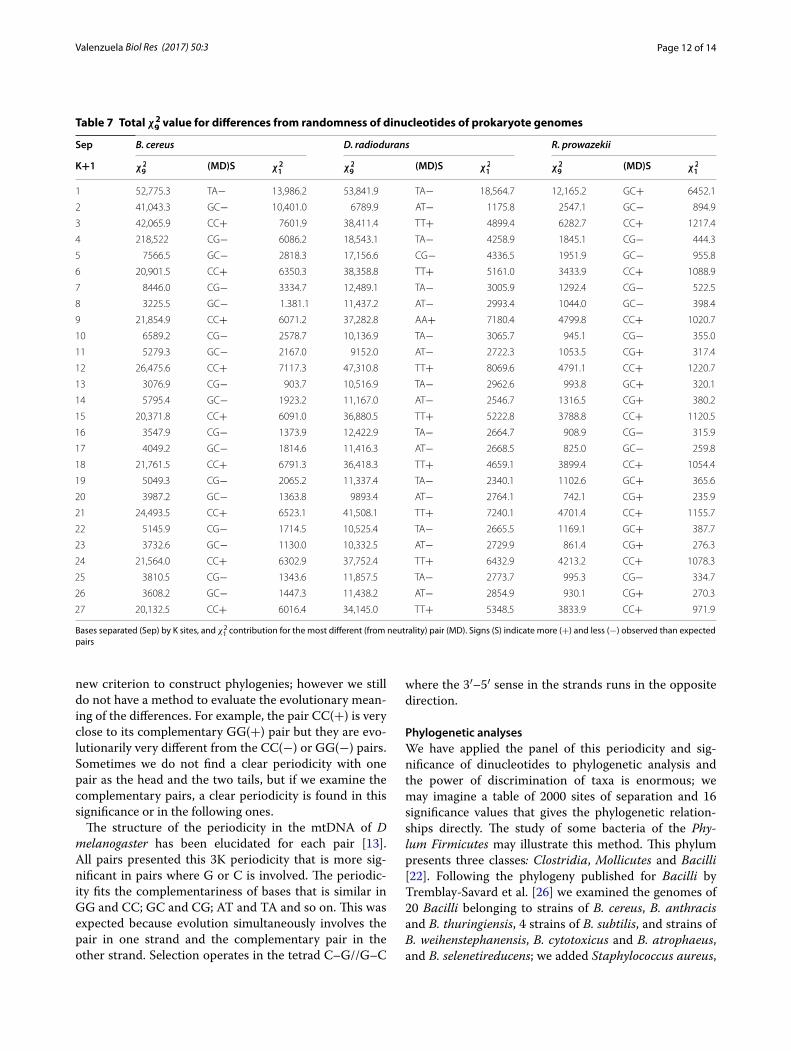
Complete prokaryote genomesWe have analyzed more than 40 prokaryote genomes; four are presented here. The complete genomes of B. cereus (GenBank, B. cereus NC7401: AP007209.1; 5,221,581 bp), D. radiodurans (GenBank D. radiodurans
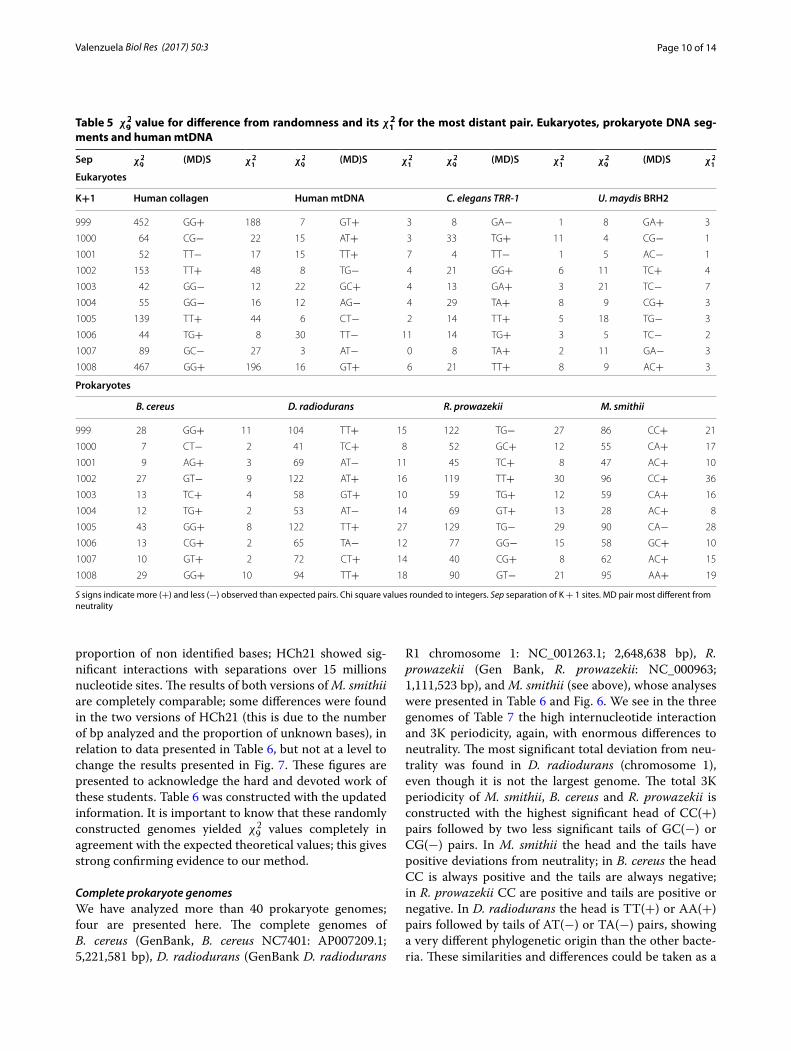
R1 chromosome 1: NC_001263.1; 2,648,638 bp), R. prowazekii (Gen Bank, R. prowazekii: NC_000963; 1,111,523 bp), and M. smithii (see above), whose analyses were presented in Table 6 and Fig. 6. We see in the three genomes of Table 7 the high internucleotide interaction and 3K periodicity, again, with enormous differences to neutrality. The most significant total deviation from neu-trality was found in D. radiodurans (chromosome 1), even though it is not the largest genome. The total 3K periodicity of M. smithii, B. cereus and R. prowazekii is constructed with the highest significant head of CC(+) pairs followed by two less significant tails of GC(−) or CG(−) pairs. In M. smithii the head and the tails have positive deviations from neutrality; in B. cereus the head CC is always positive and the tails are always negative; in R. prowazekii CC are positive and tails are positive or negative. In D. radiodurans the head is TT(+) or AA(+) pairs followed by tails of AT(−) or TA(−) pairs, showing a very different phylogenetic origin than the other bacte-ria. These similarities and differences could be taken as a
Table 5 χ2
9 value for difference from randomness and its χ2
1 for the most distant pair. Eukaryotes, prokaryote DNA seg-
ments and human mtDNA
S signs indicate more (+) and less (−) observed than expected pairs. Chi square values rounded to integers. Sep separation of K + 1 sites. MD pair most different from neutrality
Sep χ2
9(MD)S χ
2
1χ2
9(MD)S χ
2
1χ2
9(MD)S χ
2
1χ2
9(MD)S χ
2
1
Eukaryotes
K+1 Human collagen Human mtDNA C. elegans TRR‑1 U. maydis BRH2
999 452 GG+ 188 7 GT+ 3 8 GA− 1 8 GA+ 3
1000 64 CG− 22 15 AT+ 3 33 TG+ 11 4 CG− 1
1001 52 TT− 17 15 TT+ 7 4 TT− 1 5 AC− 1
1002 153 TT+ 48 8 TG− 4 21 GG+ 6 11 TC+ 4
1003 42 GG− 12 22 GC+ 4 13 GA+ 3 21 TC− 7
1004 55 GG− 16 12 AG− 4 29 TA+ 8 9 CG+ 3
1005 139 TT+ 44 6 CT− 2 14 TT+ 5 18 TG− 3
1006 44 TG+ 8 30 TT− 11 14 TG+ 3 5 TC− 2
1007 89 GC− 27 3 AT− 0 8 TA+ 2 11 GA− 3
1008 467 GG+ 196 16 GT+ 6 21 TT+ 8 9 AC+ 3
Prokaryotes
B. cereus D. radiodurans R. prowazekii M. smithii
999 28 GG+ 11 104 TT+ 15 122 TG− 27 86 CC+ 21
1000 7 CT− 2 41 TC+ 8 52 GC+ 12 55 CA+ 17
1001 9 AG+ 3 69 AT− 11 45 TC+ 8 47 AC+ 10
1002 27 GT− 9 122 AT+ 16 119 TT+ 30 96 CC+ 36
1003 13 TC+ 4 58 GT+ 10 59 TG+ 12 59 CA+ 16
1004 12 TG+ 2 53 AT− 14 69 GT+ 13 28 AC+ 8
1005 43 GG+ 8 122 TT+ 27 129 TG− 29 90 CA− 28
1006 13 CG+ 2 65 TA− 12 77 GG− 15 58 GC+ 10
1007 10 GT+ 2 72 CT+ 14 40 CG+ 8 62 AC+ 15
1008 29 GG+ 10 94 TT+ 18 90 GT− 21 95 AA+ 19
Page 11 of 14Valenzuela Biol Res (2017) 50:3
Table 6 Internucleotide interactions measured by a χ2
9 test in dinucleotides
M. smithii genome and human chromosome 21
Sep number of sites (plus one) between the first and second base of a dinucleotide, 1° DN the most significant (deviation from neutrality) pair among the 16. (+) or (−) more or less observed than expected pairs, respectively. Italics indicates periods
Sep M. smithii Human Ch21
K+1 χ2
91° DN χ
2
1χ2
91° DN χ
2
1
1 45,469.3 CG(−) 13,210.2 1,885,266.8 CG(−) 882,286.7
2 17,658.5 CG(+) 7962.4 524,989.7 AA(+) 108,841.0
3 17,489.1 CC(+) 5905.4 143,071.9 GG(+) 30.632.7
4 5333.5 CG(−) 1125.0 223,073.3 AA(+) 36,261.4
5 4734.2 GC(−) 1125.0 130,240.9 CC(+) 21,195.2
6 13,978.8 CC(+) 5220.7 232,327.6 CC(+) 46,338.4
7 4204.9 GC(+) 1147.2 137,408.0 GG(+) 36,654.3
8 2683.6 CG(+) 988.2 200,806.8 GG(+) 35,345.5
9 16,230.4 CC(+) 4805.5 168,931.2 GG(+) 38,267.5
10 3621.9 GC(+) 1247.9 179,941.9 CC(+) 30,987.9
11 3181.3 CG(+) 1100.9 97,021.9 AA(+) 12,523.8
12 18,816.5 CC(+) 5921.3 172,146.7 TT(+) 28,086.2
13 2913.5 GC(+) 1104.4 118,939.4 TT(+) 21,745.2
14 3830.5 CG(+) 1487.8 140,757.2 AA(+) 25,256.0
15 14,486.0 CC(+) 4624.5 108,724.8 CC(+) 19,839.1
16 3208.5 GC(+) 1196.6 125,307.4 AA(+) 17,579.7
17 3015.7 CG(+) 1130.7 73,618.5 CC(+) 10,267.1
18 15,874.2 CC(+) 5181.5 100,806.2 CC(+) 20,558.8
19 3370.1 GC(+) 1349.0 76,660.2 GG(+) 12,402.2
20 2817.1 CG(+) 1137.0 102,585.4 AA(+) 14,239.5
21 17,678.9 CC(+) 5389.7 81,732.7 AA(+) 10,331.6
22 3581.5 GC(+) 1454.3 86,665.1 GG(+) 14,559.0
23 3186.5 CG(+) 1095.2 84,086.3 AA(+) 13,354.2
24 14,742.2 CC(+) 4673.1 138,427.5 CC(+) 23,014.6
25 3006.4 GC(+) 938.3 111,182.0 TT(+) 22,494.8
26 3251.2 CG(+) 1170.9 89,507.1 TT(+) 15,788.0
27 14,054.4 CC(+) 4473.3 101,184.2 GG(+) 21,244.9
Fig. 6 Comparison of χ29 values between the random and the real M.
smithii genomesFig. 7 Comparison of χ2
9 values between the random and the real
human chromosome 21
Page 12 of 14Valenzuela Biol Res (2017) 50:3
new criterion to construct phylogenies; however we still do not have a method to evaluate the evolutionary mean-ing of the differences. For example, the pair CC(+) is very close to its complementary GG(+) pair but they are evo-lutionarily very different from the CC(−) or GG(−) pairs. Sometimes we do not find a clear periodicity with one pair as the head and the two tails, but if we examine the complementary pairs, a clear periodicity is found in this significance or in the following ones.
The structure of the periodicity in the mtDNA of D melanogaster has been elucidated for each pair [13]. All pairs presented this 3K periodicity that is more sig-nificant in pairs where G or C is involved. The periodic-ity fits the complementariness of bases that is similar in GG and CC; GC and CG; AT and TA and so on. This was expected because evolution simultaneously involves the pair in one strand and the complementary pair in the other strand. Selection operates in the tetrad C–G//G–C
where the 3′–5′ sense in the strands runs in the opposite direction.
Phylogenetic analysesWe have applied the panel of this periodicity and sig-nificance of dinucleotides to phylogenetic analysis and the power of discrimination of taxa is enormous; we may imagine a table of 2000 sites of separation and 16 significance values that gives the phylogenetic relation-ships directly. The study of some bacteria of the Phy-lum Firmicutes may illustrate this method. This phylum presents three classes: Clostridia, Mollicutes and Bacilli [22]. Following the phylogeny published for Bacilli by Tremblay-Savard et al. [26] we examined the genomes of 20 Bacilli belonging to strains of B. cereus, B. anthracis and B. thuringiensis, 4 strains of B. subtilis, and strains of B. weihenstephanensis, B. cytotoxicus and B. atrophaeus, and B. selenetireducens; we added Staphylococcus aureus,
Table 7 Total χ2
9 value for differences from randomness of dinucleotides of prokaryote genomes
Bases separated (Sep) by K sites, and χ21
contribution for the most different (from neutrality) pair (MD). Signs (S) indicate more (+) and less (−) observed than expected pairs
Sep B. cereus D. radiodurans R. prowazekii
K+1 χ2
9(MD)S χ
2
1χ2
9(MD)S χ
2
1χ2
9(MD)S χ
2
1
1 52,775.3 TA− 13,986.2 53,841.9 TA− 18,564.7 12,165.2 GC+ 6452.1
2 41,043.3 GC− 10,401.0 6789.9 AT− 1175.8 2547.1 GC− 894.9
3 42,065.9 CC+ 7601.9 38,411.4 TT+ 4899.4 6282.7 CC+ 1217.4
4 218,522 CG− 6086.2 18,543.1 TA− 4258.9 1845.1 CG− 444.3
5 7566.5 GC− 2818.3 17,156.6 CG− 4336.5 1951.9 GC− 955.8
6 20,901.5 CC+ 6350.3 38,358.8 TT+ 5161.0 3433.9 CC+ 1088.9
7 8446.0 CG− 3334.7 12,489.1 TA− 3005.9 1292.4 CG− 522.5
8 3225.5 GC− 1.381.1 11,437.2 AT− 2993.4 1044.0 GC− 398.4
9 21,854.9 CC+ 6071.2 37,282.8 AA+ 7180.4 4799.8 CC+ 1020.7
10 6589.2 CG− 2578.7 10,136.9 TA− 3065.7 945.1 CG− 355.0
11 5279.3 GC− 2167.0 9152.0 AT− 2722.3 1053.5 CG+ 317.4
12 26,475.6 CC+ 7117.3 47,310.8 TT+ 8069.6 4791.1 CC+ 1220.7
13 3076.9 CG− 903.7 10,516.9 TA− 2962.6 993.8 GC+ 320.1
14 5795.4 GC− 1923.2 11,167.0 AT− 2546.7 1316.5 CG+ 380.2
15 20,371.8 CC+ 6091.0 36,880.5 TT+ 5222.8 3788.8 CC+ 1120.5
16 3547.9 CG− 1373.9 12,422.9 TA− 2664.7 908.9 CG− 315.9
17 4049.2 GC− 1814.6 11,416.3 AT− 2668.5 825.0 GC− 259.8
18 21,761.5 CC+ 6791.3 36,418.3 TT+ 4659.1 3899.4 CC+ 1054.4
19 5049.3 CG− 2065.2 11,337.4 TA− 2340.1 1102.6 GC+ 365.6
20 3987.2 GC− 1363.8 9893.4 AT− 2764.1 742.1 CG+ 235.9
21 24,493.5 CC+ 6523.1 41,508.1 TT+ 7240.1 4701.4 CC+ 1155.7
22 5145.9 CG− 1714.5 10,525.4 TA− 2665.5 1169.1 GC+ 387.7
23 3732.6 GC− 1130.0 10,332.5 AT− 2729.9 861.4 CG+ 276.3
24 21,564.0 CC+ 6302.9 37,752.4 TT+ 6432.9 4213.2 CC+ 1078.3
25 3810.5 CG− 1343.6 11,857.5 TA− 2773.7 995.3 CG− 334.7
26 3608.2 GC− 1447.3 11,438.2 AT− 2854.9 930.1 CG+ 270.3
27 20,132.5 CC+ 6016.4 34,145.0 TT+ 5348.5 3833.9 CC+ 971.9
Page 13 of 14Valenzuela Biol Res (2017) 50:3
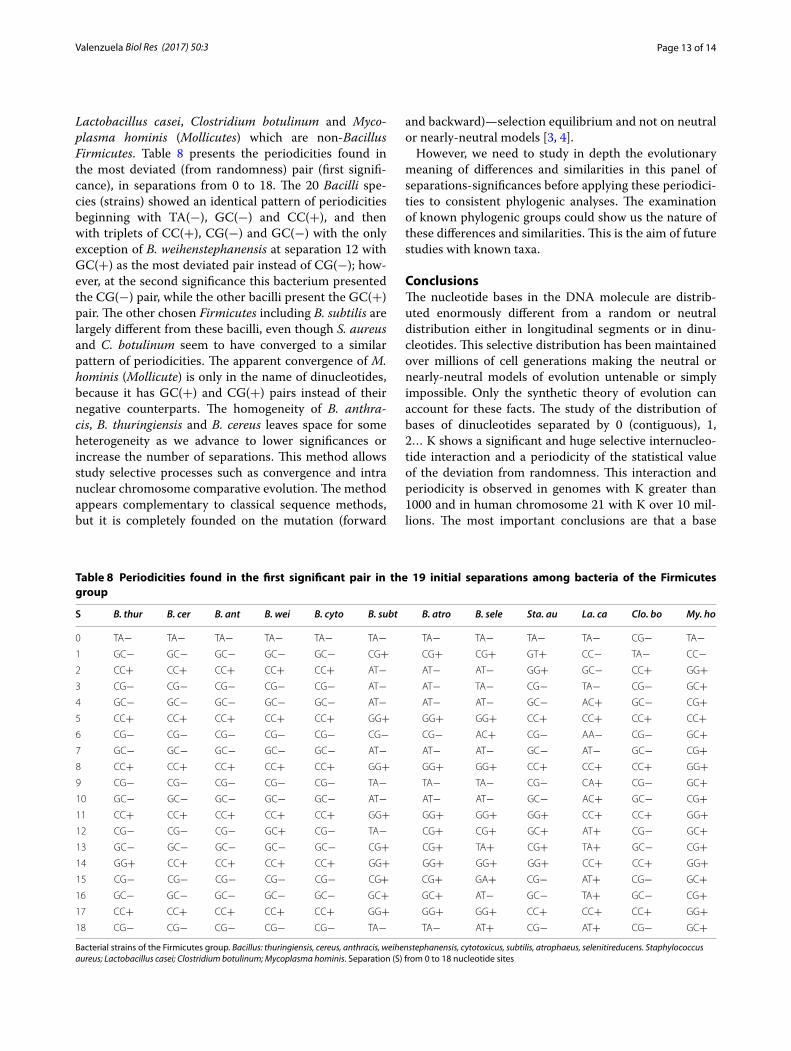
Lactobacillus casei, Clostridium botulinum and Myco-plasma hominis (Mollicutes) which are non-Bacillus Firmicutes. Table 8 presents the periodicities found in the most deviated (from randomness) pair (first signifi-cance), in separations from 0 to 18. The 20 Bacilli spe-cies (strains) showed an identical pattern of periodicities beginning with TA(−), GC(−) and CC(+), and then with triplets of CC(+), CG(−) and GC(−) with the only exception of B. weihenstephanensis at separation 12 with GC(+) as the most deviated pair instead of CG(−); how-ever, at the second significance this bacterium presented the CG(−) pair, while the other bacilli present the GC(+) pair. The other chosen Firmicutes including B. subtilis are largely different from these bacilli, even though S. aureus and C. botulinum seem to have converged to a similar pattern of periodicities. The apparent convergence of M. hominis (Mollicute) is only in the name of dinucleotides, because it has GC(+) and CG(+) pairs instead of their negative counterparts. The homogeneity of B. anthra-cis, B. thuringiensis and B. cereus leaves space for some heterogeneity as we advance to lower significances or increase the number of separations. This method allows study selective processes such as convergence and intra nuclear chromosome comparative evolution. The method appears complementary to classical sequence methods, but it is completely founded on the mutation (forward
and backward)—selection equilibrium and not on neutral or nearly-neutral models [3, 4].
However, we need to study in depth the evolutionary meaning of differences and similarities in this panel of separations-significances before applying these periodici-ties to consistent phylogenic analyses. The examination of known phylogenic groups could show us the nature of these differences and similarities. This is the aim of future studies with known taxa.
ConclusionsThe nucleotide bases in the DNA molecule are distrib-uted enormously different from a random or neutral distribution either in longitudinal segments or in dinu-cleotides. This selective distribution has been maintained over millions of cell generations making the neutral or nearly-neutral models of evolution untenable or simply impossible. Only the synthetic theory of evolution can account for these facts. The study of the distribution of bases of dinucleotides separated by 0 (contiguous), 1, 2… K shows a significant and huge selective internucleo-tide interaction and a periodicity of the statistical value of the deviation from randomness. This interaction and periodicity is observed in genomes with K greater than 1000 and in human chromosome 21 with K over 10 mil-lions. The most important conclusions are that a base
Table 8 Periodicities found in the first significant pair in the 19 initial separations among bacteria of the Firmicutes group
Bacterial strains of the Firmicutes group. Bacillus: thuringiensis, cereus, anthracis, weihenstephanensis, cytotoxicus, subtilis, atrophaeus, selenitireducens. Staphylococcus aureus; Lactobacillus casei; Clostridium botulinum; Mycoplasma hominis. Separation (S) from 0 to 18 nucleotide sites
S B. thur B. cer B. ant B. wei B. cyto B. subt B. atro B. sele Sta. au La. ca Clo. bo My. ho
0 TA− TA− TA− TA− TA− TA− TA− TA− TA− TA− CG− TA−1 GC− GC− GC− GC− GC− CG+ CG+ CG+ GT+ CC− TA− CC−2 CC+ CC+ CC+ CC+ CC+ AT− AT− AT− GG+ GC− CC+ GG+3 CG− CG− CG− CG− CG− AT− AT− TA− CG− TA− CG− GC+4 GC− GC− GC− GC− GC− AT− AT− AT− GC− AC+ GC− CG+5 CC+ CC+ CC+ CC+ CC+ GG+ GG+ GG+ CC+ CC+ CC+ CC+6 CG− CG− CG− CG− CG− CG− CG− AC+ CG− AA− CG− GC+7 GC− GC− GC− GC− GC− AT− AT− AT− GC− AT− GC− CG+8 CC+ CC+ CC+ CC+ CC+ GG+ GG+ GG+ CC+ CC+ CC+ GG+9 CG− CG− CG− CG− CG− TA− TA− TA− CG− CA+ CG− GC+10 GC− GC− GC− GC− GC− AT− AT− AT− GC− AC+ GC− CG+11 CC+ CC+ CC+ CC+ CC+ GG+ GG+ GG+ GG+ CC+ CC+ GG+12 CG− CG− CG− GC+ CG− TA− CG+ CG+ GC+ AT+ CG− GC+13 GC− GC− GC− GC− GC− CG+ CG+ TA+ CG+ TA+ GC− CG+14 GG+ CC+ CC+ CC+ CC+ GG+ GG+ GG+ GG+ CC+ CC+ GG+15 CG− CG− CG− CG− CG− CG+ CG+ GA+ CG− AT+ CG− GC+16 GC− GC− GC− GC− GC− GC+ GC+ AT− GC− TA+ GC− CG+17 CC+ CC+ CC+ CC+ CC+ GG+ GG+ GG+ CC+ CC+ CC+ GG+18 CG− CG− CG− CG− CG− TA− TA− AT+ CG− AT+ CG− GC+

Page 14 of 14Valenzuela Biol Res (2017) 50:3
• We accept pre-submission inquiries
• Our selector tool helps you to find the most relevant journal
• We provide round the clock customer support
• Convenient online submission
• Thorough peer review
• Inclusion in PubMed and all major indexing services
• Maximum visibility for your research
Submit your manuscript atwww.biomedcentral.com/submit
Submit your next manuscript to BioMed Central and we will help you at every step:
co-evolves with all the other bases of the genome or there is a genome co-adaptation or co-selection of the bases of this genome. This periodicity and the different signifi-cance of the 16 dinucleotides may be used to construct phylogenies with a completely different approach than phylogenies made using sequence differences.
AbbreviationHCh21: Homo sapiens chromosome 21.
AcknowledgementsI am greatly indebted to Dr. Javier Cisternas who provided Q-Basic programs to obtain Figs. 1, 2, 3, 4, 5 and to my student Hermes Solar who provided Java programs to obtain Figs. 6 and 7.
Competing interestsThe author declares that no competing interests.
Availability of data and materialsAll data is available by internet except obsolete and non relevant data included in Figs. 6 and 7.
Consent for publicationAuthor’s full authorization.
FundingNon external funds were involved.
Received: 19 October 2016 Accepted: 6 February 2017
References 1. Gouet R, Lopez-Fenner J. Evolución markoviana de un cariotipo. Rev Soc
Chil Estad. 1986;3:1–25. 2. Valenzuela CY. Non-random pre-transcriptional evolution in HIV-1. A
refutation of the foundational conditions for neutral evolution. Genet Mol Biol. 2009;32:159–69.
3. Valenzuela CY. Foundational errors in the Neutral and Nearly-Neutral Theories of evolution in Relation to the Synthetic Theory. Is it necessary a new evolutionary paradigm? Biol Res. 2013;46:101–19. doi:10.4067/S0716-97602013000200001.
4. Valenzuela CY. Response by the author (erratum). Biol Res. 2013;46:309. 5. Parzen E. Modern probability theory and its applications. Tokyo: Wiley;
1960. p. 67–74. 6. Feller W. An introduction to probability theory and its application. 3rd ed.
New York: Willey; 1968. p. 38–42.
7. Valenzuela CY, Flores SV, Cisternas J. Fixations of the HIV-1 env gene refute neutralism: new evidence for pan-selective evolution. Biol Res. 2010;43:149–63.
8. Valenzuela CY. Internucleotide correlation and nucleotide periodicity in Drosophila mtDNA: new evidence for panselective evolution. Biol Res. 2010;43:497–502.
9. Valenzuela CY. Neutral illusions, selective nightmares and autopoietic madness. Rev Chil Hist Nat. 2010;83:497–500.
10. Valenzuela CY. Heterogeneous periodicity of drosophila mtDNA: new ref-utations of neutral and nearly neutral evolution. Biol Res. 2011;44:283–93.
11. Valenzuela CY. Periodicidades e interacciones del DNA. El fin del neutral-ismo y del casi-neutralismo. In: Veloso A, Spotorno A, editors. Darwin y la evolución. Santiago: Editorial Universitaria Press; 2012. p. 189–295.
12. Valenzuela CY. Periodicidades genómicas y el fin del Neutralismo. Abstracts of the XV Latin-American congress of genetics. J Bas Appl Genet. 2012. Suppl XIII(1): 15–6 (The Latin-American Society of Genetics, Rosario, Argentina, October 2012).
13. Valenzuela CY. The structure of selective dinucleotide interactions and Periodicities in D. melanogaster mtDNA. Biol Res. 2014;47:1–12.
14. Valenzuela CY, Santos JL. A model of complete random molecular evolu-tion by recurrent mutation. Biol Res. 1996;29:203–12.
15. Valenzuela CY. Non random DNA evolution. Biol Res. 1997;30:117–23. 16. Valenzuela CY. Misconceptions and false expectations in neutral evolu-
tion. Biol Res. 2000;33:187–95. 17. Wright S. Evolution in Mendelian populations. Genetics. 1931;16:97–159. 18. Wright S. The roles of mutation, inbreeding, crossbreeding and selection
in evolution. Proc 6th Int Congr Genet. 1932;1:356–66. 19. Wright S. Surfaces of selective value revisited. Am Nat. 1988;131:115–23. 20. Morvan-Dubois G, Le Guellec D, Garrone R, Zylberberg L, Bonnaud L.
Phylogenetic analysis of vertebrate fibrillar collagen locates the position of zebrafish α3(I) and suggests an evolutionary link between collagen and Hox clusters. J Mol Evol. 2003;57:501–14.
21. Kuivaniemi H, Tromp G, Prockop DJ. Mutations in fibrillar collagen (types I, II, III and XI), fibril-associated collagen (type IX), and network-forming col-lagen (type X) cause a spectrum of diseases of bone, cartilage and blood vessels. Hum Mut. 1997;9:300–15.
22. Willey JM, Sherwood LM, Woolvertone CJ. Microbiología de Prescott, Harley y Klein. 7th ed. Madrid: McGraw-Hill; 2009.
23. Blasius M, Buob R, Shevelev IV, Hubscher U. Enzymes involved in DNA ligation and end-healing in the radioresistant bacterium Deinococcus radiodurans. BMC Mol Biol. 2007;8:69–80.
24. White O, Elsen JA, Heidelberg JF, Hickey EK, Peterson JD, Dodson RJ, et al. Genome sequences of the radioresistant bacterium Deinococcus radiodurans R1. Science. 2010;86:1571–7.
25. Andersson GE, Zomorodipour A, Andersson JO, Sicheritz-Pontén T, Alsmark UCM, Podowski RM, et al. The genome sequence of Rickettsia prowazekii and the origin of mitochondria. Nature. 1998;396:133–43.
26. Tremblay-Savard O, Benzaid B, Franz-Lang B, El Mabrouk N. Evolution of tRNA repertoires in Bacillus inferred with OrthoAlign. Mol Biol Evol. 2015;32(6):1643–56.