self-assembly of amphiphilic statistical copolymers and
TRANSCRIPT
This is a repository copy of Self-assembly of amphiphilic statistical copolymers and their aqueous rheological properties.
White Rose Research Online URL for this paper:http://eprints.whiterose.ac.uk/126797/
Version: Accepted Version
Article:
Neal, T.J., Beattie, D.L., Byard, S.J. et al. (7 more authors) (2018) Self-assembly of amphiphilic statistical copolymers and their aqueous rheological properties. Macromolecules, 51 (4). pp. 1474-1487. ISSN 0024-9297
https://doi.org/10.1021/acs.macromol.7b02134
[email protected]://eprints.whiterose.ac.uk/
Reuse
Items deposited in White Rose Research Online are protected by copyright, with all rights reserved unless indicated otherwise. They may be downloaded and/or printed for private study, or other acts as permitted by national copyright laws. The publisher or other rights holders may allow further reproduction and re-use of the full text version. This is indicated by the licence information on the White Rose Research Online record for the item.
Takedown
If you consider content in White Rose Research Online to be in breach of UK law, please notify us by emailing [email protected] including the URL of the record and the reason for the withdrawal request.

1
Self-assembly of amphiphilic statistical copolymers and
their aqueous rheological properties
Thomas J. Neal,a Deborah L. Beattie,a Sarah J. Byard,a Gregory N. Smith,a Martin W. Murray,b Neal S.
J. Williams,b Simon N. Emmett,b Steven P. Armes,a Sebastian G. Spain,*,a Oleksandr O. Mykhaylyk*,a
a Department of Chemistry, Dainton Building, The University of Sheffield, Sheffield, S3 7HF, UK.
bAkzoNobel Decorative Paints, Wexham Road, Slough, Berkshire, SL2 5DS, UK
ABSTRACT. A range of poly(n-butyl methacrylate-stat-methacrylic acid) [P(BMA-stat-MAA)]
statistical copolymers of various compositions and molecular weights ranging from 5 to 30 kDa were
prepared using either reversible addition-fragmentation chain transfer (RAFT) solution
copolymerization or conventional free radical polymerization in isopropanol (IPA). On dilution with
water, these amphiphilic copolymers self-assembled to form spherical nano-objects as confirmed by
small-angle X-ray scattering (SAXS) and transmission electron microscopy. Various structural particle
models were examined to extract information regarding the mean nano-object size and morphology. It is
found that nano-object radii are independent of copolymer molecular weight, but depend on the
copolymer composition: the smaller the amount of MAA units in the molecules the larger the nano-
objects are formed. Combined SAXS and aqueous electrophoretic measurements indicated that most of
the MAA units are located at the nano-object surface. Furthermore, SAXS and rheology measurements
were used to monitor the effect of solvent composition on the copolymer morphology both at a fixed
copolymer concentration (either 1 wt% or 25 wt%) and also for a gradual variation in copolymer
2
concentrations (from 1 wt% to 40 wt%) when adding water to the initial copolymer solution in IPA.
These studies revealed that the copolymers are present in solution as molecularly-dissolved Gaussian
chains when the solvent composition is IPA-rich. However, the copolymer chains self-assemble into
spherical nano-objects when the solvent composition is water-rich. At intermediate solvent
compositions, SAXS analysis confirmed the formation of an interconnected nano-object network, which
accounts for the apparently anomalous increase in solution viscosity on dilution indicated by rheology
measurements.
INTRODUCTION. Amphiphilic copolymers are used in various applications including drug delivery,
cosmetics, paints, and coatings.1,2 They comprise both hydrophilic and hydrophobic monomers and are
known to self-assemble in aqueous solution to form a wide range of nanoscale morphologies.3 The self-
assembly of diblock copolymers has been extensively studied as they can produce well-defined
morphologies, such as spheres,4–12 worms13 or vesicles,14,15 which can often be predicted by their
molecular parameters such as the chemical nature of each comonomer and the mean degree of
polymerization (DP) of each block.16 In comparison, the nanostructures formed by amphiphilic
statistical copolymers are relatively under-studied. Nevertheless, both spherical nano-objects and other
morphologies have been reported depending on the hydrophilic/hydrophobic balance.17–21
Chang and McCormick demonstrated how the distribution of a hydrophobe along the backbone of a
statistical copolymer affected its self-assembly.22 Statistical copolymers prepared via conventional free
radical polymerization (FRP), had a tendency to undergo intramolecular hydrophobic interactions. In
contrast, copolymers containing micro-domains (short blocks) of the hydrophobe displayed
intermolecular association that was enhanced by the size of these micro-domains. This association
behaviour was further investigated by studying the effects of incorporating various bulky hydrophobic
substituents, such as lauryl (LA), cyclodecyl (CD), and 1-adamantyl (AD) methacrylamides into the
copolymer chain.23 Copolymers containing bulkier CD and AD substituents more strongly favoured
intramolecular association compared with the LA-based copolymer. Moreover, reducing the number of
3
hydrophobic groups significantly reduced both the aggregation number and the particle radius.23 More
recently, Sato et al. investigated how the composition and the degree of polymerization affected the
aqueous micellization behavior of a series of amphiphilic statistical copolymers synthesized via
reversible addition-fragmentation chain transfer (RAFT) polymerization.23 The results from this study
indicated a strong influence of the mean DP and copolymer composition on the aggregation number and
the number of hydrophobic micro-domains per aggregate, with higher DPs leading to lower aggregation
number. Sato et al., further analyzed the self-assembly of statistical copolymers by investigating the
effect of varying both the hydrophobic and ionic comonomer units on the micellar structure.24 Like
Kamachi et al.2 higher hydrophobic monomer contents led to larger aggregation numbers (and hence
particle size). Furthermore, varying the type of ionic monomer had little effect on the micellar structure.24
As well as spherical nano-objects, other relatively unusual copolymer assemblies, such as giant
vesicles, honeycomb films and bowl-shaped aggregates, have been achieved through the aggregation of
amphiphilic statistical copolymers.25–30 An example of one of these higher-order architectures was
reported by Lui and Zhu in 2011, who demonstrated that vesicles could be formed by the self-assembly
of L-glutamic acid-based amphiphilic random copolymers in an ethanol/water mixture.25 Structures such
as honeycomb films and spheres were also achieved using evaporative self-assembly from various
solvents, including dichloromethane and methanol.
Although the self-assembly of amphiphilic statistical copolymers has been investigated to some extent,
there is only a rather limited understanding of how such behavior can affect the physical properties of
such dispersions. Although this question has been overlooked, it is essential when evaluating these
systems for commercial applications. Furthermore, there have been only limited studies of such systems
using scattering techniques combined with detailed structural analysis and modelling.31 Herein an
extensive study is conducted to assess the effect of composition, molecular weight, concentration and
solvent composition on the self-assembly of a series of anionic amphiphilic statistical copolymers in iso-
propanol/water solution and the resulting physical properties of such colloidal dispersions. More
4
specifically, a series of methacrylic statistical copolymers were synthesised via RAFT copolymerization
in order to achieve a wide range of comonomer compositions and narrow molecular weight distributions.
Additionally, a series of similar copolymers were synthesized via conventional free radical
copolymerization to examine the effect of dispersity (Mw/Mn) on copolymer self-assembly. The micellar
structures formed by these amphiphilic copolymers were characterized by small-angle X-ray scattering
(SAXS) in dilute solution in order to evaluate their morphology. A series of structural models have been
developed to analyze the resulting SAXS patterns. Finally SAXS studies were also conducted at higher
copolymer concentrations to account for the anomalous rheological behaviour of such dispersions,
which leads to an increase in solution viscosity on dilution with water.
EXPERIMENTAL SECTION.
Materials. Butyl methacrylate (BMA, 99%), and methacrylic acid (MAA, 99.5%) were purchased
from Sigma-Aldrich (Gillingham, UK) and were passed through basic alumina to remove inhibitors
prior to use. Isopropanol (IPA, 99.9%), triethanolamine (TEA, 99%), glacial acetic acid (99.85%), 4,4’-
azobis(4-cyanovaleric acid) (ACVA, 98%), trimethylsiyl diazomethane solution (2.0 M in diethyl ether)
and deuterated acetone were purchased from Sigma-Aldrich and used as received unless stated
otherwise in the text. High-performance liquid chromatography grade tetrahydrofuran (THF) and
deuterated chloroform were purchased from VWR (Lutterworth, UK). Deionised water was obtained
using an Elgastat Option 3A water purifier. 4-cyano-4-(2-phenyl-ethanesulfanylthiocarbonyl)
sufanylpentanoic acid (PETTC) was prepared in-house as reported previously.32
Gel permeation chromatography (GPC). The molecular weight distributions were determined by
GPC using THF containing 1 wt% acetic acid and 0.054 w/v% butyl hydroxytoluene (BHT) as the
eluent. Separations were performed using a pair of Plgel Mixed-C columns (7.8 × 300 mm, 5 µm bead
size) at a flow rate of 1.0 mL min-1. The GPC system was equipped with a WellChrom K-2301
5
refractive index detector measuring at wavelength 950 ± 30 nm. All the samples were measured relative
to a set of ten near-monodisperse poly(methyl methacrylate) (PMMA) standards with peak molecular
weight values ranging from 1,280 to 330,000 Da.
SAXS measurements. SAXS patterns were collected using laboratory SAXS instruments, either
Bruker AXS Nanostar modified with Xenocs GeniX 3D system designed for CuK radiation
(wavelength = 1.54 Å), two sets of motorized collimating scatterless slits and equipped with a 2D Hi-
STAR multi-wire gas detector or a Xenocs Xuess 2.0 laboratory beamline equipped with a Dectris
Pilatus 1M detector and an Excillum liquid gallium MetalJet X-ray source (ぢ = 1.34 Å). The majority of
the patterns were collected over a scattering vector range of 0.008 Å-1 to 0.16 Å-1. The length of the
scattering vector, q, is given by (4 / )sinq , where is half the scattering angle. X-ray scattering
data reduced by Nika SAS macros for Igor Pro (integration, normalisation, background subtraction)33
were further analysed using Irena SAS macros for Igor Pro.34 Scattering of water was used for absolute
intensity calibration of SAXS patterns.
Aqueous Electrophoresis. The electrophoretic mobility of aqueous copolymer dispersions, with an
electrolyte background of 0.75 mM KCl, was measured using phase-analysis light scattering (PALS) on
a Malvern Zetasizer Nano ZS instrument.
1H NMR spectroscopy. 1H NMR spectra were recorded on either a Bruker AV1-400 or AV3HD-400
MHz spectrometer in either CDCl3 or (CD3)2CO. Typically, 64 scans were averaged per spectrum.
Spectra were analyzed with Bruker Topspin 3.0 software and the chemical shifts are reported in ppm
relative to the residual solvent peak. In order to calculate the copolymer composition, the copolymer
methacrylic acid units were methylated to methyl methacrylate using trimethylsiyldiazomethane (TMS-
DAM) prior to the NMR measurements as previously reported.35
6
Transmission electron microscopy (TEM). TEM studies were conducted using a Philips CM 100
instrument operating at 100 kV and equipped with a Gatan 1k CCD camera. Copper/palladium TEM
grids (Agar Scientific, UK) were coated with a thin layer of carbon and then glow discharged for 30
seconds. Samples were prepared by placing a droplet (10 づL) of diluted copolymer dispersions (0.1 %
w/w) to the carbon-coated copper grids for 1 minute. Once the excess dispersion was removed by
dabbing the grids with filter paper uranyl formate (9.0 づL of a 0.75% w/w solution) was placed on the
grids for 20 seconds and then dabbed with filter paper. Each sample was additionally dried using a
vacuum hose.
Rheology. An MCR 502 rheometer (Anton Paar, Gratz, Austria) equipped with a TruGap system for
automatic gap control and configured for cone-and-plate geometry (50 mm diameter, angle 2°) with a
solvent trap was used for measuring dynamic viscosity of the copolymer dispersions at various
concentrations and solvent compositions. In order to reduce any shear-induced change in copolymer
morphology, an oscillatory mode was chosen for the measurements. Preliminary strain sweep
experiments, between 0.1% and 20% strain at constant angular frequencies were performed for all
copolymer samples to identify the linear viscoelastic region. Once a suitable strain had been identified,
an angular frequency sweep, downwards from 200 rad s-1 to 0.1 rad s-1, was conducted at a constant
strain (typically 1%) and temperature (21 °C) to measure the dynamic viscosity (Figure S1). The
dynamic viscosity determined for each copolymer dispersion displayed almost no frequency dependence
at frequencies below 10 rad s-1. Thus, this region of rheological data was used to obtain zero shear
viscosity defined by an extrapolation of the experimental results to zero angular frequency. Such
obtained values of zero shear viscosity were used for the characterization of copolymer dispersions.
RESULTS AND DISCUSSION.

7
Synthesis of BMA/MAA Amphiphilic Copolymers. A series of twelve poly(n-butyl methacrylate-
stat-methacrylic acid) [P(BMA-stat-MAA)] copolymers was synthesized with varying comonomer
compositions and molecular weights via RAFT solution copolymerization (Figure 1). PETTC and
ACVA were used as the chain transfer agent (CTA) and initiator, respectively, and the CTA/initiator
molar ratio was maintained at 5.0. RAFT chemistry was used to ensure narrow molecular weight
distributions and good control over the target copolymer molecular weight. The twelve copolymers were
purified by precipitation from solution into a 1:1 ratio of water/methanol mixture to remove any residual
comonomers. The purified copolymers were isolated as white/yellow powders. The lower molecular
weight copolymers were more yellow owing to their higher proportion of RAFT chain-ends. GPC
analysis showed that the copolymer molecular weight ranged from 6.1 kDa to 22.3 kDa with Mw/Mn
values always below 1.25 (Table 1).
Figure 1. Synthesis of amphiphilic P(BMA-stat-MAA) statistical copolymers by RAFT solution
copolymerization using a PETTC RAFT agent and an ACVA initiator followed by micellar self-
assembly on addition of water.
BMA and MAA comonomers were added into the reaction solution at molar feed ratios of 70:30,
80:20, and 90:10, respectively (Table S1). Determination of the copolymer compositions using 1H NMR
spectroscopy indicated that there were fewer MAA units present in the copolymer than expected from
the initial feed ratio (Table 1). Intantaneous comonomer conversions were determined throughout the

8
polymerization by 1H NMR spectroscopy (Figure S2) and comparable initial rates of polymerization
were obtained for each comonomer (kobs 蛤 ど┻どどにぱ s-1) which should lead to statistical incorporation.
However, after 430 minutes the reaction rate of MAA decreases significantly (kobs 蛤 0.0001 s-1),
resulting in a substantially lower MAA conversion compared to that of BMA (63 mol % vs. 93 mol %,
respectively). It is not known why the observed MAA conversion is limited but such kinetic data does
clarify why the MAA content of the final copolymers is always less than that targeted. Taking the lower
ultimate MAA conversion into account, the theoretical BMA/MAA copolymer compositions can be
recalculated as 77:23, 85:15, and 93:7, which is in good agreement with compositions determined from
1H NMR analysis of the methylated copolymers. However, because the BMA comonomer continues to
polymerize after MAA polymerization has essentially stopped, this produces a short BMA-rich ‘blocky’
sequence at the end of each copolymer chain.
Table 1. Compositional data obtained from 1H NMR analysis of methylated copolymers [P(BMA-
stat-MMA)], weight-average molecular weight (Mw) and dispersity (Mw/Mn) obtained by GPC analysis
of P(BMA-stat-MAA) copolymers using a THF eluent containing 1.0 wt% acetic acid (AcOH).
Synt
hesis
NMR THF + 1 wt% AcOH GPC
Label BMA content
MMA content Mw, kDa Mw/Mn
RA
FT
BM77:23(22k) 0.79 0.21 21.9 1.25 BM77:23(15k) 0.76 0.24 13.1 1.20 BM77:23(10k) 0.80 0.2 11.2 1.19 BM77:23(5k) 0.78 0.22 6.1 1.20 BM85:15(22k) 0.87 0.13 22.3 1.24 BM85:15(15k) 0.85 0.15 11.4 1.19 BM85:15(10k) 0.88 0.12 8.6 1.19 BM85:15(5k) 0.84 0.16 6.6 1.19 BM93:7(22k) 0.94 0.06 22.3 1.23 BM93:7(15k) 0.93 0.07 12.5 1.16 BM93:7(10k) 0.93 0.07 10.6 1.16

9
BM93:7(5k) 0.92 0.08 7.0 1.16
FRP
FRP70:30(24k) 0.69 0.31 23.9 1.81 FRP80:20(31k) 0.78 0.22 31.2 1.89 FRP90:10(21k) 0.88 0.12 21.2 1.85
An additional series of P(BMA-stat-MAA) copolymers was synthesized by monomer-starved
conventional free radical solution copolymerization in IPA. This protocol should produce copolymer
molecules with evenly distributed BMA and MAA units along the chain, which enables a comparison to
be made to the potentially less even monomer distribution in the copolymers prepared by RAFT
copolymerization. Again, copolymer compositions of 70:30, 80:20 and 90:10 were targeted by varying
the BMA/MAA comonomer feed ratios. These target compositions were fully consistent with 1H NMR
analysis of the methylated copolymers (Table 1). These copolymers have significantly higher
dispersities (Mw/Mn ≈ 1.85) than those synthesized via RAFT copolymerization (Mw/Mn ≈ 1.20). Thus,
the latter technique provides better control over the molecular weight distribution (Table 1).36
Copolymer Self-assembling in Water. The self-assembly behavior of these amphiphilic copolymers
in water was investigated using SAXS. To avoid formation of large copolymer aggregates, dispersions
were prepared using IPA as a co-solvent. Furthermore, TEA (1.1 mol. equivalents to the MAA residues)
was added to the copolymer dispersions to deprotonate the MAA units and hence increase their water
solubility. Thus, copolymers were first dissolved at 50 wt% in IPA and deprotonated with TEA before
dilution to 1.0 wt% with water. This protocol yielded colloidally stable dispersions/solutions for most
formulations. However, attempts to prepare copolymer dispersions at high copolymer concentrations
with low IPA contents (indicated in Figure S3) were unsuccessful, owing to aggregation and
precipitation.
SAXS patterns recorded for 1.0 wt% copolymer dispersions in water showed features consistent with
the formation of particles with a clearly defined Guinier region at q < 0.04 Å-1 and the first minimum of
10
the form factor at q ~ 0.08 Å-1 (Figures 2 and 3). Analysis of these scattering patterns was undertaken by
attempting to fit the data using appropriate structural models.
In general, the intensity of the X-rays scattered by a dispersion of similar particles can be expressed
via the differential scattering cross-section per unit sample volume, dみ/dよ(q), which is defined as the
product of the particle form factor and the structure factor:
辰停辰定 岫圏岻 噺 軽鯨岫圏岻 完 ┼著待 完 繋著待 岫圏┸ 堅怠┸ ┼ ┸ 堅賃岻皇岫堅怠┸ ┼ ┸ 堅賃岻穴堅怠 ┼ 穴堅賃 (1),
where 繋岫圏┸ 堅怠┸ ┼ ┸ 堅賃岻 is the form factor defined by a k number of r parameters, 皇岫堅怠┸ ┼ ┸ 堅賃岻 is the
distribution function of these parameters, N is the number density per unit volume and 鯨岫圏岻 is the
structure factor.
The copolymers under investigation comprise either a fully statistical or a predominantly statistical
distribution of BMA and MAA units. Thus, according to the literature, such copolymers should form
approximately spherical nano-objects (or, for the sake of simplicity, particles).17,18 However, since there
is no diblock copolymer architecture, it can be assumed that phase separation between the hydrophobic
and hydrophilic units is negligible. Therefore, no well-defined core and corona domains are expected for
these self-assembled morphologies. This means that a spherical form factor should be appropriate to
describe these nano-objects: 繋坦岫圏┸ 堅怠岻 噺 軽叩巽巽態 岫堅怠岻紅坦態畦坦態岫圏┸ 堅怠岻 岫に岻,
where r1 is the nano-object radius, As(q, r1) is the sphere form factor amplitude defined as:
畦坦岫圏┸ 堅怠岻 噺 ぬ岷sin岫圏┸ 堅怠岻 伐 圏堅怠 cos岫圏┸ 堅怠岻峅岫圏堅怠岻戴 岫ぬ岻
and the mean nano-object aggregation number Nagg(r1) is expressed as: 軽叩巽巽岫堅怠岻 噺 岫な 伐 捲坦誰狸岻 替訂追迭戴蝶棟 岫ね岻,
where xsol is the volume fraction of solvent within the nano-object. The scattering length contrast of the
nano-object described by eq 4 is given by くs = Vs(行s ‒ 行sol), where 行s and 行sol represent the scattering
11
length densities of the copolymer and background solvent, respectively. s in this case represents the
averaged scattering length density of the copolymer, which is calculated as: 行坦 噺 行台托代 ゲ 懸台托代 髪 行托代代 ゲ 懸托代代 岫の岻,
where 鉱 represents the respective volume fractions of BMA and MAA repeat units in the copolymer,
and 行BMA and 行MAA are the respective scattering length densities of PBMA (9.80 × 1010 cm-2) and
PMAA (10.70 × 1010 cm-2). The 行sol was calculated from the scattering length densities and volume
fractions of the solvent components. In particular, in this work mixtures of water (行H2O = 9.42 × 10¹⁰
cm-2) and IPA (行C3H8O = 7.55 × 1010 cm-2) were used in this analysis. The total volume of an average
copolymer molecule, Vs, is obtained as a sum of the average volumes of both the BMA and MAA
components in the copolymers calculated using the equation VBMA or MAA = Mw/(NABMA or MAA , where
Mw is the product of the number of BMA or MAA repeat units per chain and the BMA or MAA repeat
unit mass. The solid-state densities of the homopolymers, PBMA or PMAA, were determined by helium
pycnometry [PBMA = 1.05 g cm-3 and PMAA = 1.18 g cm-3].
The polydispersity of the nano-object radius, expressed as a Gaussian distribution, is considered for
the structural model (eq 1):
皇岫堅怠岻 噺 怠謬態訂蹄馴棟鉄 結貸岫認迭貼馴棟岻鉄鉄配馴棟鉄 (6),
where Rs is the mean nano-object radius and jRs is its standard deviation. The number density per unit
volume (eq 1) is expressed as:
軽 噺 笛完 蝶岫追迭岻堤岫追迭岻鳥追迭屯轍 (7),
where 剛 is the total volume fraction of copolymer molecules in the sample and V岫堅怠岻 is the total volume
of copolymer chains within the nano-object [V岫堅怠岻 噺 撃坦軽叩巽巽岫堅怠岻].
It is commonly accepted that the Percus-Yevick approximation is suitable for describing structural
peaks originating from particle interactions at high concentrations (at or above 5 vol%).37 However, a
12
pronounced peak of intensity at q ~ 0.02 Å-1 was observed consistently in the scattering patterns even at
copolymer concentrations as low as 1.0 wt% owing to long-range repulsive interactions between the
anionic nano-objects (Figures 2 and 3). Indeed, addition of a small amount of NaCl results in the loss of
this feature (Figure S4). Thus, two structure factors were evaluated within the SAXS model (eq 1) to
account for this additional feature. The first is based on the Percus-Yevick approximation,37,38 S(q) =
SPY(q, RPY, fPY), where RPY is an interparticle correlation radius and fPY is an effective volume fraction,
and second is based on the Hayter-Penfold approximation for charged particle Coulomb interactions,39
S(q) = SHP(q, RHP, fHP, M, T, , Q), where RHP is an interparticle correlation radius, fHP is an effective
volume fraction, M is the ionic strength of the solvent, T is the absolute temperature, is the solvent
dielectric constant and Q is the particle charge expressed in electrons.
The particle charge required for the Hayter-Penfold approximation could be calculated from the
electrophoretic mobility (づe) of the P(BMA-stat-MAA) particles as determined by aqueous
electrophoresis. Mobility can be converted into a -potentials using the Henry equation:40
航奪 噺 態戴 悌梼棟悌轍挺涛 耕血岫腔迎坦岻 岫ぱ岻,
where ごrs is the dielectric constant of water, ご0 is the permittivity of vacuum, とw is the dynamic
viscosity of water, だ is the inverse Debye length and f(だRs) can be obtained from the Oshima
expression.40 The apparent charge (Q) can be related to the effective -potential by solving the
linearized Poisson-Boltzmann equation:41
芸 噺 眺棟岫怠袋汀眺棟岻碇田 勅抵賃田脹 岫ひ岻,
where ぢB is the Bjerrum length,41 and kB is the Boltzmann constant. The aggregation observed for MAA-
rich copolymer nano-objects means that their electrophoretic mobility value is less reliable than for
well-dispersed nano-objects. Nonetheless, there is a clear correlation between the particle radius and the
13
particle surface charge (Table S2). From these measurements, an average charge was calculated for the
copolymer compositions and used in the Hayter-Penfold approximation (Table 2).
The proposed model (eqs 1 and 2) should demonstrate a strong power law dependence at high q
[dみ/dよ(q) ~ q-4]. However, the experimental SAXS data (Figures 2 and 3) indicate a relatively flat curve
in this q range (q > 0.1 Å-1), especially for the pattern corresponding to BM93:7(22k) (Figure 3b). This type
of behavior is commonly observed for diblock copolymer micelles owing to scattering from the corona
blocks.42 For random copolymers, this is an unexpected result. Nevertheless, randomly-packed MAA
and BMA residues within the nano-objects may well produce regions with differing scattering length
densities. Such fluctuations in scattering length density within the nano-objects should cause scattering
at high q. Similar structural formation has been analyzed using a ‘blob’ model.43 This approach was
developed to interpret neutron scattering from the solvated cores of spherical micelles, where the Debye
function for a Gaussian polymer chain44 繋達竪叩辿樽岫捲岻 噺 に岷exp岫伐捲岻 伐 な 髪 捲峅【捲態 (10),
where 捲 噺 岫圏迎巽岻態 and 迎巽 is the radius of gyration of the copolymer chains, was used in the analytical
form factor calculations of the scattering length density fluctuations described as independent blobs.
Thus, this “blob” model43 was incorporated into the structural model describing the form factor of
nano-objects formed by statistical copolymers:
繋坦但岫圏┸ 堅怠岻 噺 軽叩巽巽態 岫堅怠岻紅坦態 峙券但狸誰但岫券但狸誰但 伐 な岻閤態盤圏迎巽但狸誰但匪畦坦態岫圏┸ 堅怠岻 髪 券但狸誰但繋達竪叩辿樽盤圏迎巽但狸誰但匪峩 【券但狸誰但態 岫なな岻,
where 閤岫検岻 噺 岷な 伐 exp岫伐検岻峅【検 , y 噺 岫圏迎巽但狸誰但岻態 is the form factor amplitude of a ‘blob’ (polymer
chain), 迎巽但狸誰但 is the ‘blob’ radius of gyration and 繋達竪叩辿樽盤圏迎巽但狸誰但匪 is the self-correlation term of the
Gaussian polymer chain (‘blob’) represented by the Debye function (eq 10). 券但狸誰但 噺 畦怠撃誰但棚【撃但狸誰但 is an
14
approximate number of ‘blobs’, where A1 is a fitting parameter, 撃誰但棚 噺 ね【ぬ講堅怠戴 and 撃但狸誰但 噺ね【ぬ講岫迎巽但狸誰但岻戴.
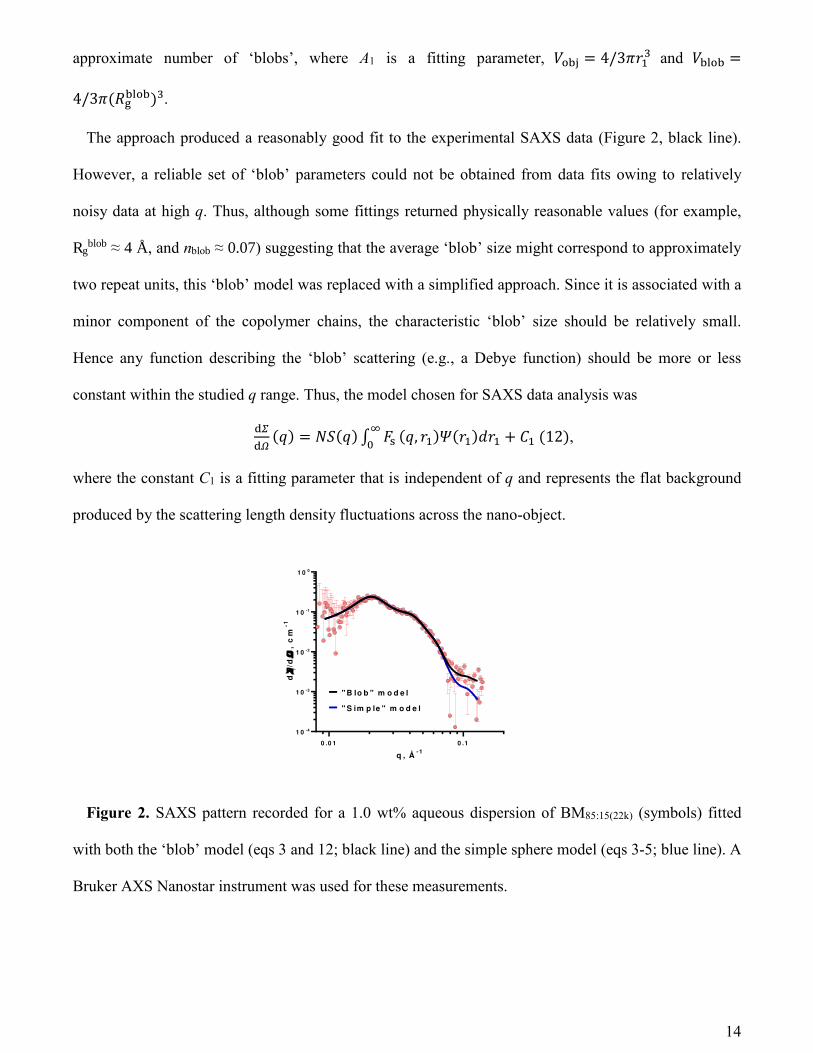
The approach produced a reasonably good fit to the experimental SAXS data (Figure 2, black line).
However, a reliable set of ‘blob’ parameters could not be obtained from data fits owing to relatively
noisy data at high q. Thus, although some fittings returned physically reasonable values (for example,
Rgblob ≈ 4 Å, and nblob ≈ 0.07) suggesting that the average ‘blob’ size might correspond to approximately
two repeat units, this ‘blob’ model was replaced with a simplified approach. Since it is associated with a
minor component of the copolymer chains, the characteristic ‘blob’ size should be relatively small.
Hence any function describing the ‘blob’ scattering (e.g., a Debye function) should be more or less
constant within the studied q range. Thus, the model chosen for SAXS data analysis was
辰停辰定 岫圏岻 噺 軽鯨岫圏岻 完 繋坦著待 岫圏┸ 堅怠岻皇岫堅怠岻穴堅怠 髪 系怠 岫なに岻,
where the constant C1 is a fitting parameter that is independent of q and represents the flat background
produced by the scattering length density fluctuations across the nano-object.
Figure 2. SAXS pattern recorded for a 1.0 wt% aqueous dispersion of BM85:15(22k) (symbols) fitted
with both the ‘blob’ model (eqs 3 and 12; black line) and the simple sphere model (eqs 3-5; blue line). A
Bruker AXS Nanostar instrument was used for these measurements.
0 .0 1 0 .1
1 0 -4
1 0 -3
1 0 -2
1 0 -1
1 0 0
q , Å - 1
d
/d
,c
m-1
" S im p le " m o d e l
" B lo b " m o d e l
15
The proposed model produced reasonably good fits to the scattering patterns obtained for 1.0 wt%
P(BMA-stat- MAA) copolymer aqueous dispersions (Figure 3), yielding the nano-object radii for each
system (Table 2). However, SAXS patterns for the BM77:23 samples displayed some upturn at low q
(Figure 3b), suggesting the presence of large aggregates. A combination of Guinier and power law
functions is commonly employed to describe the scattering from large randomly-shaped
structures.45,46,47 However, the Guinier region located at very low q is often inaccessible in SAXS
experiments and only the power law region is recorded in scattering patterns. Thus, in order to fit the
upturn in intensity observed in the scattering patterns, an additional term describing the power law
dependence at low q was incorporated into the model:45,46,47 d洪d硬 岫圏岻 噺 軽鯨岫圏岻 豹 繋坦著待 岫圏┸ 堅怠岻皇岫堅怠岻穴堅怠 髪 系怠 髪 稽 ゲ 圏貸牒岫なぬ岻
where B is a prefactor that depends on the type of power-law scattering, as determined by the regime in
which P falls. For example, for P = 4 this power law dependence corresponds to Porod’s law and B is
the Porod constant. The refined model was used for SAXS analysis and a least-squares algorithm was
employed for data fits. However, a genetic optimization algorithm was applied when the global
minimum of the figure of merit for the fitting (“chi-squared” parameter) had to be identified, in some
cases, particularly for the model utilizing the Hayter-Penfold structure factor.
When fitting experimental SAXS patterns using eq 13, the two structure factor approximations
produced different values for the structural parameters describing particle packing in these copolymer
dispersions (Table 2). More specifically, the interparticle distances and effective volume fractions
obtained using the Percus-Yevick approximation were systematically larger than those values calculated
when employing the Hayter-Penfold approximation. Nevertheless, the form factor parameters (FF
column in Table 2) were not influenced by the chosen structure factor functions and employing either
Percus-Yevick or Hayter-Penfold approximation produced very similar results for the particle radius,
which was the most important parameter for this study. In view of this finding, the less parameterized
Percus-Yevick approximation was used for SAXS analysis in the rest of this work.
16
Considering eq 13 in combination with eqs 2, 4 and 7 suggests that 奄 and xsol are positively covariant.
Thus, when the above model was used for data fitting, the volume fraction was fixed at the known
concentration of the copolymer dispersion in order to evaluate xsol. This approach yielded xsol values
close to zero, suggesting minimal ingress of the water molecules within the P(BMA-stat-MAA) nano-
objects.
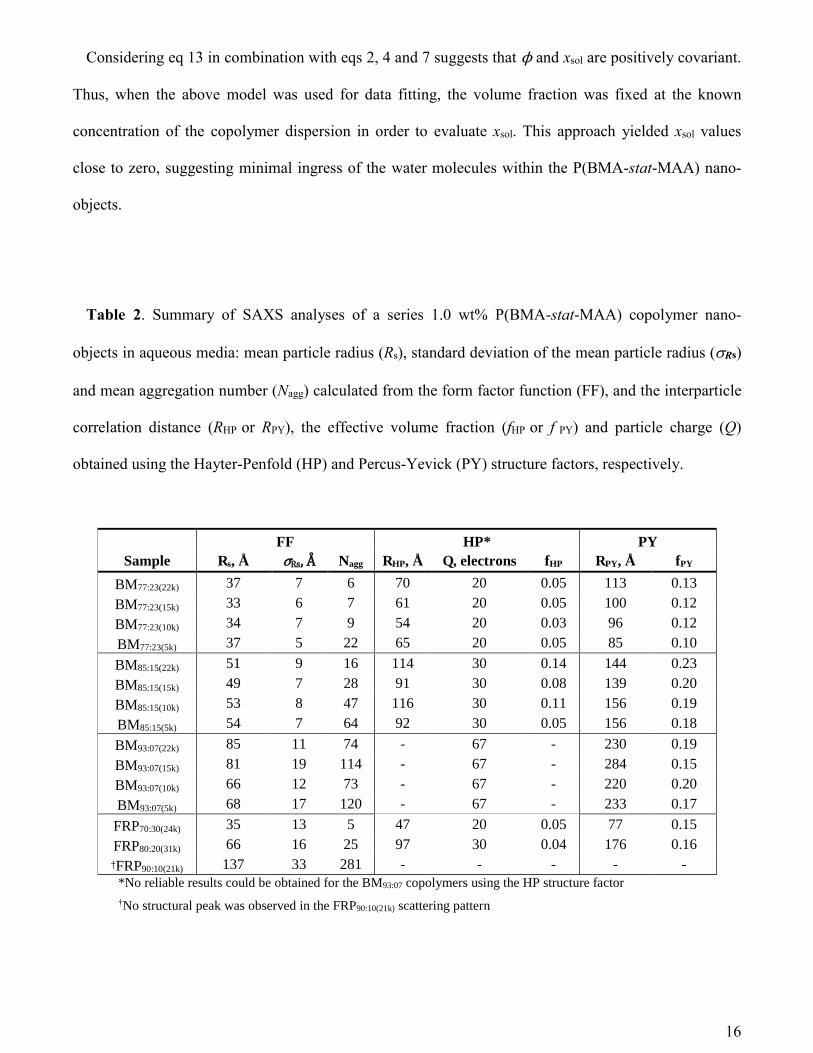
Table 2. Summary of SAXS analyses of a series 1.0 wt% P(BMA-stat-MAA) copolymer nano-
objects in aqueous media: mean particle radius (Rs), standard deviation of the mean particle radius (Rs)
and mean aggregation number (Nagg) calculated from the form factor function (FF), and the interparticle
correlation distance (RHP or RPY), the effective volume fraction (fHP or f PY) and particle charge (Q)
obtained using the Hayter-Penfold (HP) and Percus-Yevick (PY) structure factors, respectively.
FF HP* PY
Sample Rs, Å ぴ , Å Nagg RHP, Å Q, electrons fHP RPY, Å fPY
BM77:23(22k) 37 7 6 70 20 0.05 113 0.13
BM77:23(15k) 33 6 7 61 20 0.05 100 0.12
BM77:23(10k) 34 7 9 54 20 0.03 96 0.12
BM77:23(5k) 37 5 22 65 20 0.05 85 0.10
BM85:15(22k) 51 9 16 114 30 0.14 144 0.23
BM85:15(15k) 49 7 28 91 30 0.08 139 0.20
BM85:15(10k) 53 8 47 116 30 0.11 156 0.19
BM85:15(5k) 54 7 64 92 30 0.05 156 0.18
BM93:07(22k) 85 11 74 - 67 - 230 0.19
BM93:07(15k) 81 19 114 - 67 - 284 0.15
BM93:07(10k) 66 12 73 - 67 - 220 0.20
BM93:07(5k) 68 17 120 - 67 - 233 0.17
FRP70:30(24k) 35 13 5 47 20 0.05 77 0.15
FRP80:20(31k) 66 16 25 97 30 0.04 176 0.16 さFRP90:10(21k) 137 33 281 - - - - - *No reliable results could be obtained for the BM93:07 copolymers using the HP structure factor †No structural peak was observed in the FRP90:10(21k) scattering pattern
17
SAXS analysis indicates a correlation between the copolymer composition and the mean nano-object
radius, with MAA-rich copolymers producing smaller nano-objects (Table 2). In contrast, the
copolymer molecular weight has rather little effect on the nano-object size, particularly for the 77:23
and the 85:15 compositions. The anionic MAA groups stabilize the nano-objects and higher MAA
contents lead to lower mean aggregation numbers. Analysis of the 93:7 copolymer series indicates that
the nano-object radius increases for the two higher molecular weights (Table 2). This suggests that the
RAFT chain-ends help to solubilize the lower molecular weight copolymers: using PETTC as the CTA
produces copolymer chains with an ionizable carboxylic acid end-group, which behaves like an
additional MAA group. For relatively low MAA contents and copolymer molecular weights, such as
BM93:7(10k) or BM93:7(5k), these end-groups effectively increase the carboxylic acid content of these
MAA-based and, as a result, smaller nano-object radii are formed. Thus, higher molecular weight
copolymers (15 kDa or 22 kDa) are more representative of the 93:7 composition.
Since there is no consistent correlation between copolymer molecular weight and nano-object size, the
dispersity should have relatively little effect. Indeed, similar analysis undertaken on the FRP-
synthesized copolymer series demonstrates a comparable trend, whereby the MAA composition is
inversely related to the nano-object dimensions (Table 2). Although the compositional dependence is
similar for the two synthesis methods, some discrepancies can be identified when a direct comparison
between RAFT- and FRP- synthesized copolymers is made. Generally, the nano-objects formed by the
FRP series tend to be larger than those formed by the RAFT series as the MAA content is lowered. This
size difference could be the result of statistical variations in the distribution of MAA units along the
copolymer chains, as indicated by the BMA/MAA copolymerization rate (Figure S2), as well as the
incorporation of an additional carboxylic acid group per chain for the RAFT-synthesized copolymers.
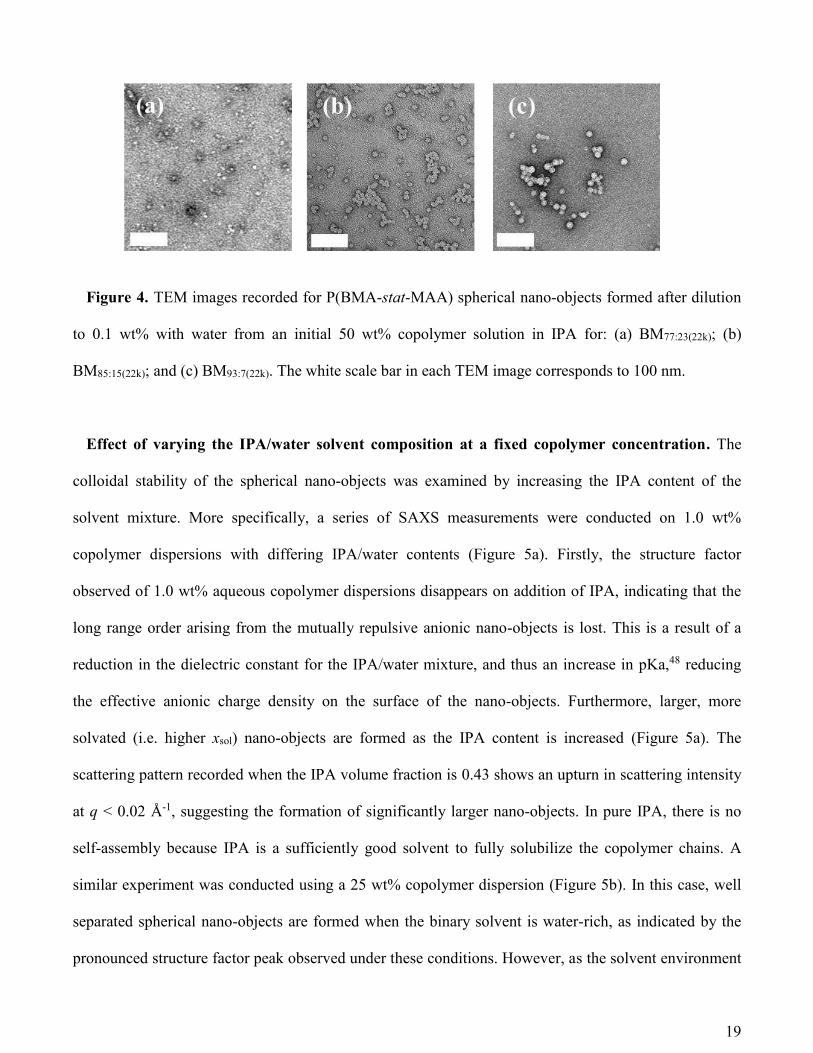
TEM images obtained after drying 0.1 wt% copolymer dispersions confirm the formation of spherical
nano-objects (Figure 4) and are consistent with the SAXS data. Moreover, TEM analysis also suggests
that MAA-rich copolymers form smaller nano-objects. However, SAXS is considered far more

18
statistically robust than TEM, with the latter technique also prone to staining artefacts and the possibility
of nano-object flattening occurring during drying.
Figure 3. SAXS patterns recorder for 1.0 wt% aqueous dispersions of P(BMA-stat-MAA) copolymer
nano-objects (symbols) fitted using a refined spherical particle model (eq 13, solid lines) and (eq 14,
dashed line); where (a) compares the scattering from a series of copolymers of the same composition
(BM85:15) but differing molecular weights and (b) compares the scattering for copolymers of the same
molecular weight (22 kDa) but differing copolymer compositions. A Bruker AXS Nanostar instrument
was used for these measurements. Some patterns are shifted upward by arbitrary factors (as indicated on
the plots) to avoid overlap.
0 .0 1 0 .1
1 0 -4
1 0 -3
1 0 -2
1 0 -1
1 0 0
1 0 1
1 0 2
1 0 3
1 0 4
q , Å - 1
d
/d
,c
m-1
B M 9 3 :7 (2 2 k )
B M 8 5 :1 5 (2 2 k )
B M 7 7 :2 3 (2 2 k )
(b )
x 1 0 2
x 1 0 4
0 .0 1 0 .1
1 0 -4
1 0 -3
1 0 -2
1 0 -1
1 0 0
1 0 1
1 0 2
1 0 3
q , Å - 1
d
/d
,c
m-1
B M 8 5 :1 5 (2 2 k )
B M 8 5 :1 5 (1 5 k )
B M 8 5 :1 5 (1 0 k )
B M 8 5 :1 5 (5 k )
(a )
x 1 0 1
x 1 0 2
x 1 0 3
19
Figure 4. TEM images recorded for P(BMA-stat-MAA) spherical nano-objects formed after dilution
to 0.1 wt% with water from an initial 50 wt% copolymer solution in IPA for: (a) BM77:23(22k); (b)
BM85:15(22k); and (c) BM93:7(22k). The white scale bar in each TEM image corresponds to 100 nm.
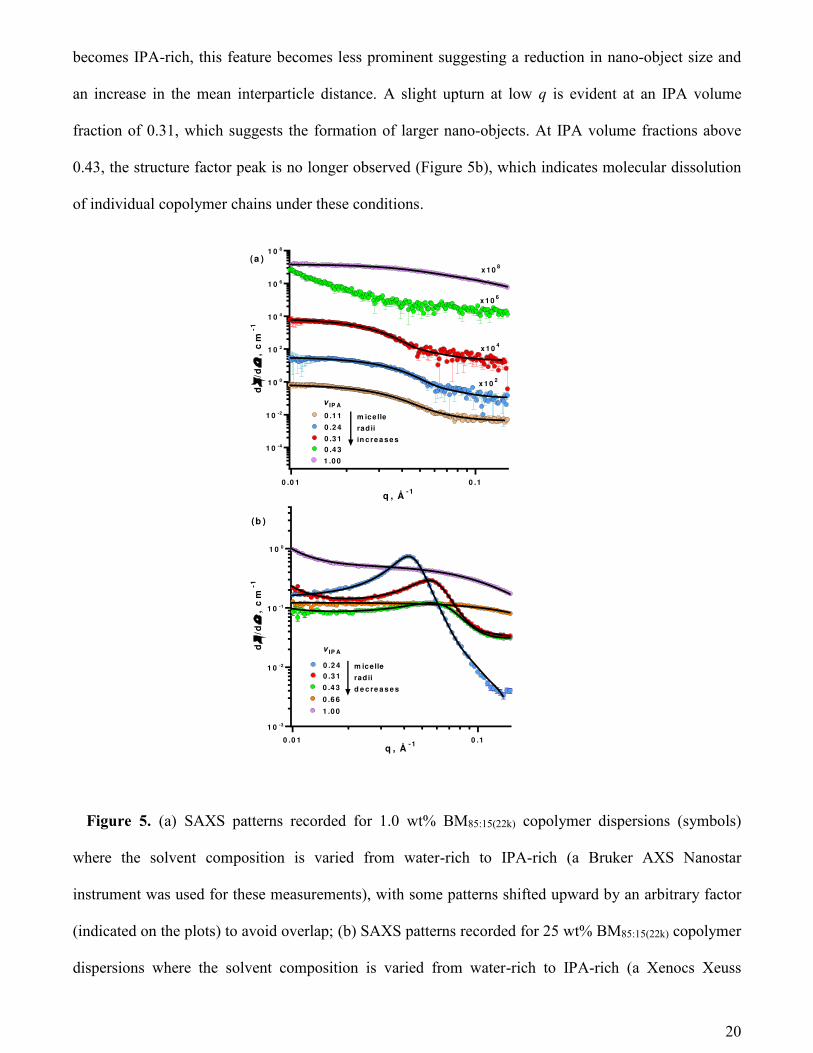
Effect of varying the IPA/water solvent composition at a fixed copolymer concentration. The
colloidal stability of the spherical nano-objects was examined by increasing the IPA content of the
solvent mixture. More specifically, a series of SAXS measurements were conducted on 1.0 wt%
copolymer dispersions with differing IPA/water contents (Figure 5a). Firstly, the structure factor
observed of 1.0 wt% aqueous copolymer dispersions disappears on addition of IPA, indicating that the
long range order arising from the mutually repulsive anionic nano-objects is lost. This is a result of a
reduction in the dielectric constant for the IPA/water mixture, and thus an increase in pKa,48 reducing
the effective anionic charge density on the surface of the nano-objects. Furthermore, larger, more
solvated (i.e. higher xsol) nano-objects are formed as the IPA content is increased (Figure 5a). The
scattering pattern recorded when the IPA volume fraction is 0.43 shows an upturn in scattering intensity
at q < 0.02 Å-1, suggesting the formation of significantly larger nano-objects. In pure IPA, there is no
self-assembly because IPA is a sufficiently good solvent to fully solubilize the copolymer chains. A
similar experiment was conducted using a 25 wt% copolymer dispersion (Figure 5b). In this case, well
separated spherical nano-objects are formed when the binary solvent is water-rich, as indicated by the
pronounced structure factor peak observed under these conditions. However, as the solvent environment
20
becomes IPA-rich, this feature becomes less prominent suggesting a reduction in nano-object size and
an increase in the mean interparticle distance. A slight upturn at low q is evident at an IPA volume
fraction of 0.31, which suggests the formation of larger nano-objects. At IPA volume fractions above
0.43, the structure factor peak is no longer observed (Figure 5b), which indicates molecular dissolution
of individual copolymer chains under these conditions.
Figure 5. (a) SAXS patterns recorded for 1.0 wt% BM85:15(22k) copolymer dispersions (symbols)
where the solvent composition is varied from water-rich to IPA-rich (a Bruker AXS Nanostar
instrument was used for these measurements), with some patterns shifted upward by an arbitrary factor
(indicated on the plots) to avoid overlap; (b) SAXS patterns recorded for 25 wt% BM85:15(22k) copolymer
dispersions where the solvent composition is varied from water-rich to IPA-rich (a Xenocs Xeuss
0 .0 1 0 .1
1 0 -4
1 0 -2
1 0 0
1 0 2
1 0 4
1 0 6
1 0 8
q , Å - 1
d
/d
,c
m-1
x 1 0 4
x 1 0 2
x 1 0 6
0 .4 3
0 .3 1
0 .1 1
0 .2 4
v IP A
(a )
1 .0 0
x 1 0 8
m icelle
radii
in c re a s e s
0 .0 1 0 .1
1 0 -3
1 0 -2
1 0 -1
1 0 0
q , Å - 1
d
/d
,c
m-1
1 .0 0
0 .6 6
0 .4 3
0 .2 4
0 .3 1
v IP A
(b )
m icelle
radii
d e c re a s e s
21
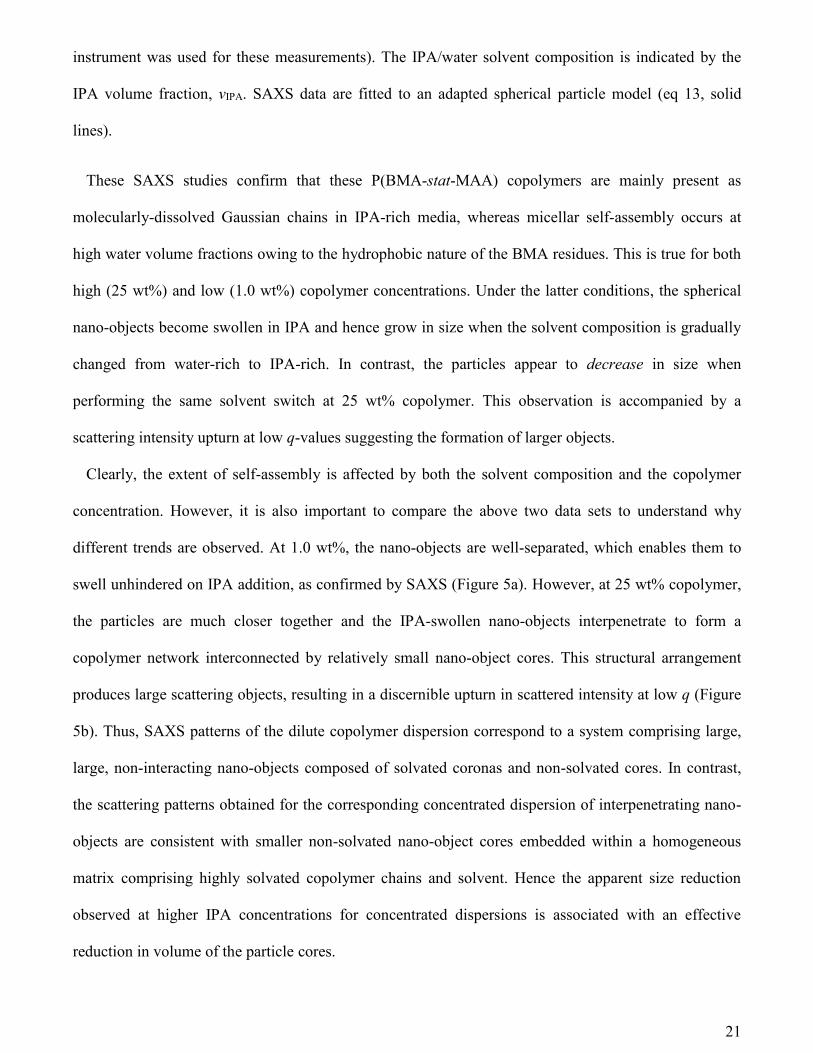
instrument was used for these measurements). The IPA/water solvent composition is indicated by the
IPA volume fraction, vIPA. SAXS data are fitted to an adapted spherical particle model (eq 13, solid
lines).
These SAXS studies confirm that these P(BMA-stat-MAA) copolymers are mainly present as
molecularly-dissolved Gaussian chains in IPA-rich media, whereas micellar self-assembly occurs at
high water volume fractions owing to the hydrophobic nature of the BMA residues. This is true for both
high (25 wt%) and low (1.0 wt%) copolymer concentrations. Under the latter conditions, the spherical
nano-objects become swollen in IPA and hence grow in size when the solvent composition is gradually
changed from water-rich to IPA-rich. In contrast, the particles appear to decrease in size when
performing the same solvent switch at 25 wt% copolymer. This observation is accompanied by a
scattering intensity upturn at low q-values suggesting the formation of larger objects.
Clearly, the extent of self-assembly is affected by both the solvent composition and the copolymer
concentration. However, it is also important to compare the above two data sets to understand why
different trends are observed. At 1.0 wt%, the nano-objects are well-separated, which enables them to
swell unhindered on IPA addition, as confirmed by SAXS (Figure 5a). However, at 25 wt% copolymer,
the particles are much closer together and the IPA-swollen nano-objects interpenetrate to form a
copolymer network interconnected by relatively small nano-object cores. This structural arrangement
produces large scattering objects, resulting in a discernible upturn in scattered intensity at low q (Figure
5b). Thus, SAXS patterns of the dilute copolymer dispersion correspond to a system comprising large,
large, non-interacting nano-objects composed of solvated coronas and non-solvated cores. In contrast,
the scattering patterns obtained for the corresponding concentrated dispersion of interpenetrating nano-
objects are consistent with smaller non-solvated nano-object cores embedded within a homogeneous
matrix comprising highly solvated copolymer chains and solvent. Hence the apparent size reduction
observed at higher IPA concentrations for concentrated dispersions is associated with an effective
reduction in volume of the particle cores.
22
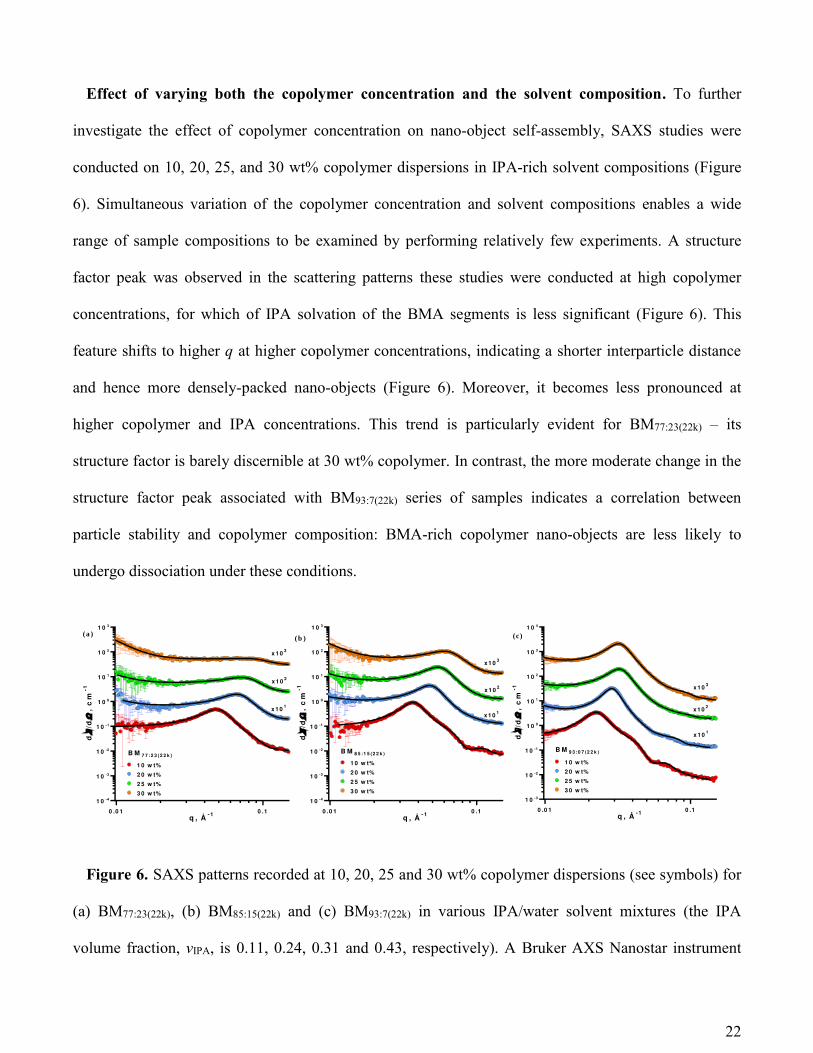
Effect of varying both the copolymer concentration and the solvent composition. To further
investigate the effect of copolymer concentration on nano-object self-assembly, SAXS studies were
conducted on 10, 20, 25, and 30 wt% copolymer dispersions in IPA-rich solvent compositions (Figure
6). Simultaneous variation of the copolymer concentration and solvent compositions enables a wide
range of sample compositions to be examined by performing relatively few experiments. A structure
factor peak was observed in the scattering patterns these studies were conducted at high copolymer
concentrations, for which of IPA solvation of the BMA segments is less significant (Figure 6). This
feature shifts to higher q at higher copolymer concentrations, indicating a shorter interparticle distance
and hence more densely-packed nano-objects (Figure 6). Moreover, it becomes less pronounced at
higher copolymer and IPA concentrations. This trend is particularly evident for BM77:23(22k) – its
structure factor is barely discernible at 30 wt% copolymer. In contrast, the more moderate change in the
structure factor peak associated with BM93:7(22k) series of samples indicates a correlation between
particle stability and copolymer composition: BMA-rich copolymer nano-objects are less likely to
undergo dissociation under these conditions.
Figure 6. SAXS patterns recorded at 10, 20, 25 and 30 wt% copolymer dispersions (see symbols) for
(a) BM77:23(22k), (b) BM85:15(22k) and (c) BM93:7(22k) in various IPA/water solvent mixtures (the IPA
volume fraction, vIPA, is 0.11, 0.24, 0.31 and 0.43, respectively). A Bruker AXS Nanostar instrument
0 .0 1 0 .1
1 0 -4
1 0 -3
1 0 -2
1 0 -1
1 0 0
1 0 1
1 0 2
1 0 3
q , Å - 1
d
/d
,c
m-1
1 0 w t%
2 0 w t%
2 5 w t%
3 0 w t%
B M 7 7 :2 3 (2 2 k )
(a )
x 1 0 1
x 1 0 2
x 1 0 3
0 .0 1 0 .1
1 0 -4
1 0 -3
1 0 -2
1 0 -1
1 0 0
1 0 1
1 0 2
1 0 3
q , Å - 1
d
/d
,c
m-1
1 0 w t%
2 0 w t%
2 5 w t%
3 0 w t%
B M 8 5 :1 5 (2 2 k )
(b )
x 1 0 1
x 1 0 2
x 1 0 3
0 .0 1 0 .1
1 0 -3
1 0 -2
1 0 -1
1 0 0
1 0 1
1 0 2
1 0 3
1 0 4
q , Å - 1
d
/d
,c
m-1
1 0 w t%
2 0 w t%
2 5 w t%
3 0 w t%
B M 9 3 :0 7 (2 2 k )
(c )
x 1 0 1
x 1 0 2
x 1 0 3
23
was used for these measurements. Some patterns are shifted upward by an arbitrary factor indicated on
the plots to avoid overlap. The SAXS data are fitted using an adapted spherical nano-object model (eq
13, solid lines).
The spherical nano-objects formed at 10 wt% copolymer concentration are of a similar size to that
determined at 1.0 wt% but the relative interparticle distance is significantly reduced, as expected at this
higher copolymer concentration (compare Tables 2 and 3). The observed reduction in nano-object
dimensions when increasing the copolymer concentration (Table 3) is attributed to the higher IPA
content in the binary solvent mixture. This is consistent with the observed increase in the solvent
volume fraction within the nano-objects (xsol) obtained from SAXS analysis (eq 4). Thus, the nano-
object size and mean aggregation number are reduced in IPA-rich media. The shift and attenuation in
the structure factor peak observed in these scattering patterns, despite the higher copolymer concentration,
suggests a morphological transformation from spherical nano-objects at low copolymer concentration in
water-rich media towards molecularly-dissolved copolymer chains in IPA-rich media. As expected, this
trend is most noticeable for MAA-rich copolymers (Figure 6a). At 30 wt% copolymer, the nano-objects
possess their smallest dimensions and are highly swollen. Indeed, xsol is close to unity, which seems to
be physically unrealistic. The model assumes the sole presence of spherical nano-objects and that all the
copolymer chains are located within the nano-objects. Since the copolymer volume fraction is fixed
during data fitting, such high xsol values suggest that the fitting algorithm artificially lowers the nano-
object scattering contribution by reducing the (1 - xsol) term in eq 6. A reasonable explanation is that not
all copolymer chains are located within the nano-objects. Given that IPA is a reasonably good solvent
for the BMA residues and that the structural morphology is less defined at high copolymer
concentrations and IPA volume fractions, the single population of spherical nano-objects assumed in
this scattering model is an over-simplified approximation. Indeed, given the broad distribution of
copolymer compositions, BMA-rich chains are more likely to form nano-objects, whereas MAA-rich
chains are more likely to be molecularly dissolved. Thus, these two populations may well coexist,
24
particularly at higher IPA volume fractions. In this case the SAXS pattern can be represented by a
superposition of scattering contributions from both nano-objects (eq 2) and random coils (eq 10) where
the total copolymer concentration, redistributed between these two populations, is fixed. However, this
refined two-population model does not provide a satisfactory fit to the experimental data at high q. An
alternative model involves a single population of nano-objects whereby some of the copolymer chains
form bridges between neighboring nano-objects to produce an extended network (Figure 7). In this case
the copolymer volume fraction located within the nano-objects and, therefore, the total nano-object
volume will be reduced. At the same time, the interconnected nano-objects form a larger network of
objects that scatter coherently. Indeed, the relevant SAXS patterns exhibit a gradual upturn in scattering
at low q values (Figure 6) with the scattering intensity following a power law dependence (with an
exponent of ~ -3 at the highest IPA content, see Figures 6a and 6b) that suggests the formation of large
fractals. However, the Guinier region for these structures could not be resolved at low q (~ 0.002 Å-1),
which suggests that their dimensions exceed 3000 Å. In general, these SAXS observations support the
formation of a nano-object network interconnected by partially released copolymer chains (Figure 7).
Satisfactory qualitative fits to scattering patterns can be obtained using a relatively simple structural
model (eq 13) incorporating a spherical micelle form factor (eq 2) (Figure 6). However, quantitative
SAXS analysis of this inter-connected nano-object network is beyond the scope of this work. In addition,
redistribution of solvent molecules is likely for IPA-rich dispersions, since this co-solvent can readily
penetrate the nano-objects. Such variation of the solvent composition inside and outside the nano-
objects and concomitant reduction in the scattering length density contrast between IPA-swollen nano-
objects and the binary solvent mixture may account for the artificially high xsol suggested by the data fits.
SAXS analysis suggests that the self-assembled morphology transforms from well-defined nano-
objects to interconnected nano-objects to molecularly-dissolved copolymers (Figure 7). At low
copolymer concentrations in a water-rich environment, the copolymer chains self-assemble to form
stable nano-objects. However, increasing the copolymer concentration along with the IPA volume
25
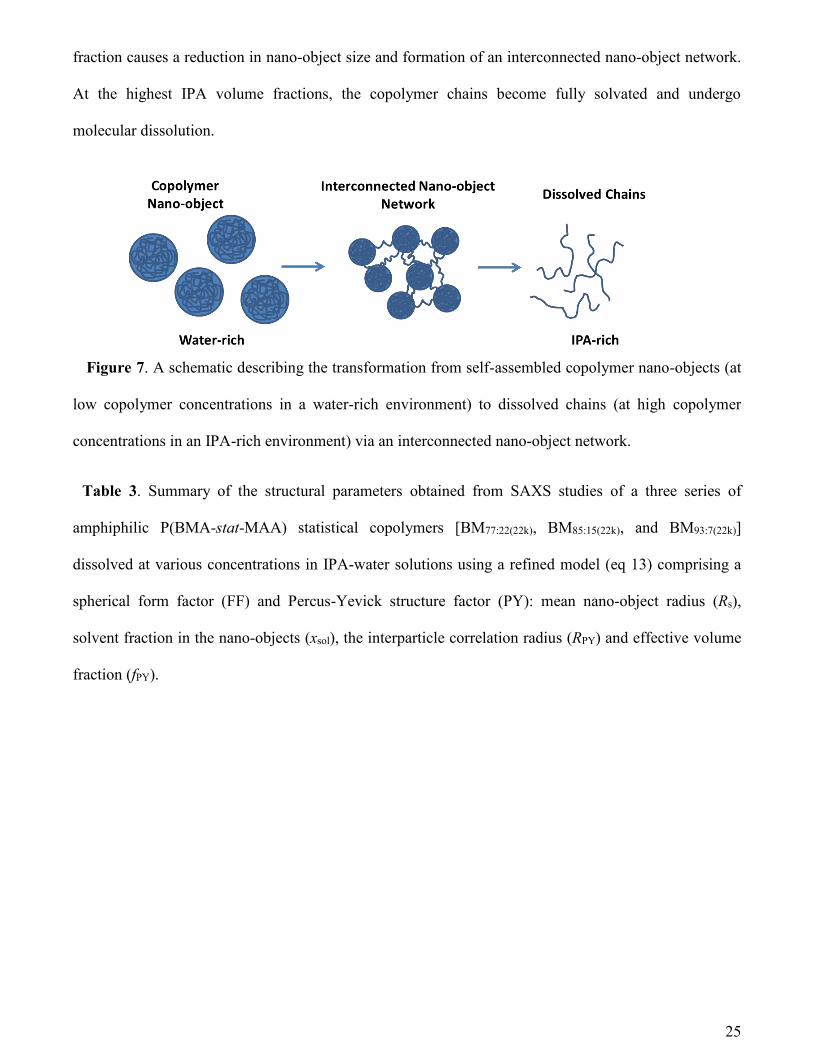
fraction causes a reduction in nano-object size and formation of an interconnected nano-object network.
At the highest IPA volume fractions, the copolymer chains become fully solvated and undergo
molecular dissolution.
Figure 7. A schematic describing the transformation from self-assembled copolymer nano-objects (at
low copolymer concentrations in a water-rich environment) to dissolved chains (at high copolymer
concentrations in an IPA-rich environment) via an interconnected nano-object network.
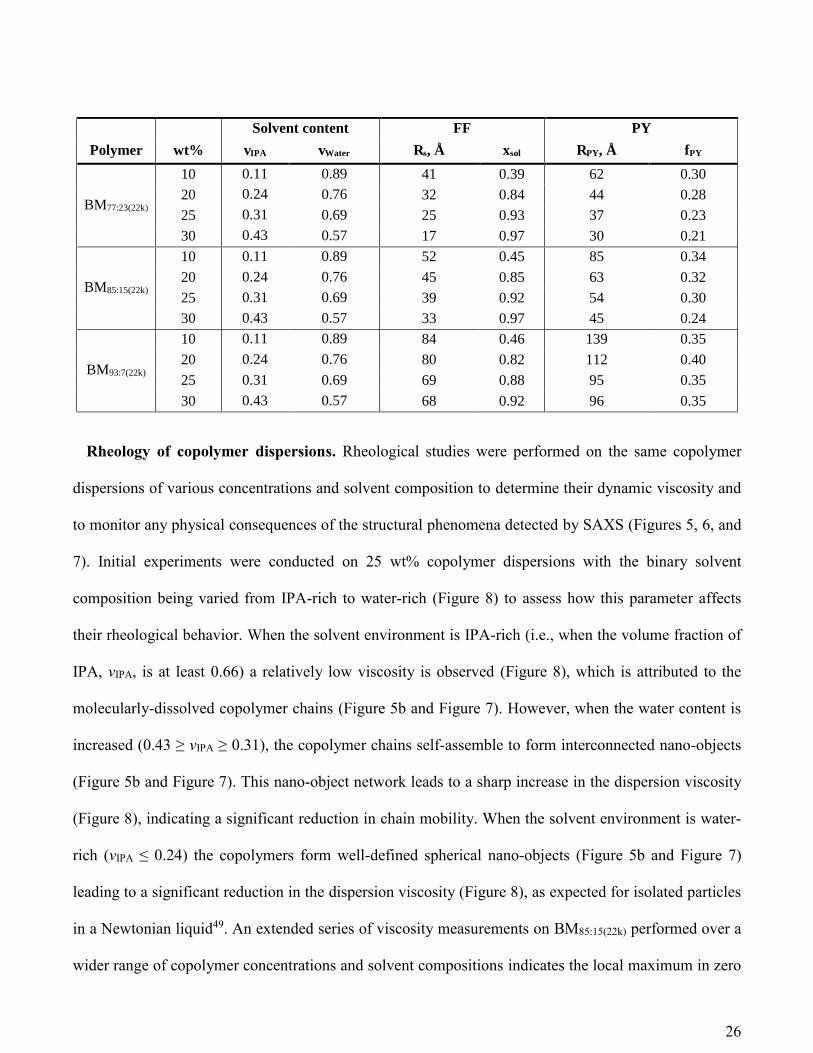
Table 3. Summary of the structural parameters obtained from SAXS studies of a three series of
amphiphilic P(BMA-stat-MAA) statistical copolymers [BM77:22(22k), BM85:15(22k), and BM93:7(22k)]
dissolved at various concentrations in IPA-water solutions using a refined model (eq 13) comprising a
spherical form factor (FF) and Percus-Yevick structure factor (PY): mean nano-object radius (Rs),
solvent fraction in the nano-objects (xsol), the interparticle correlation radius (RPY) and effective volume
fraction (fPY).
26
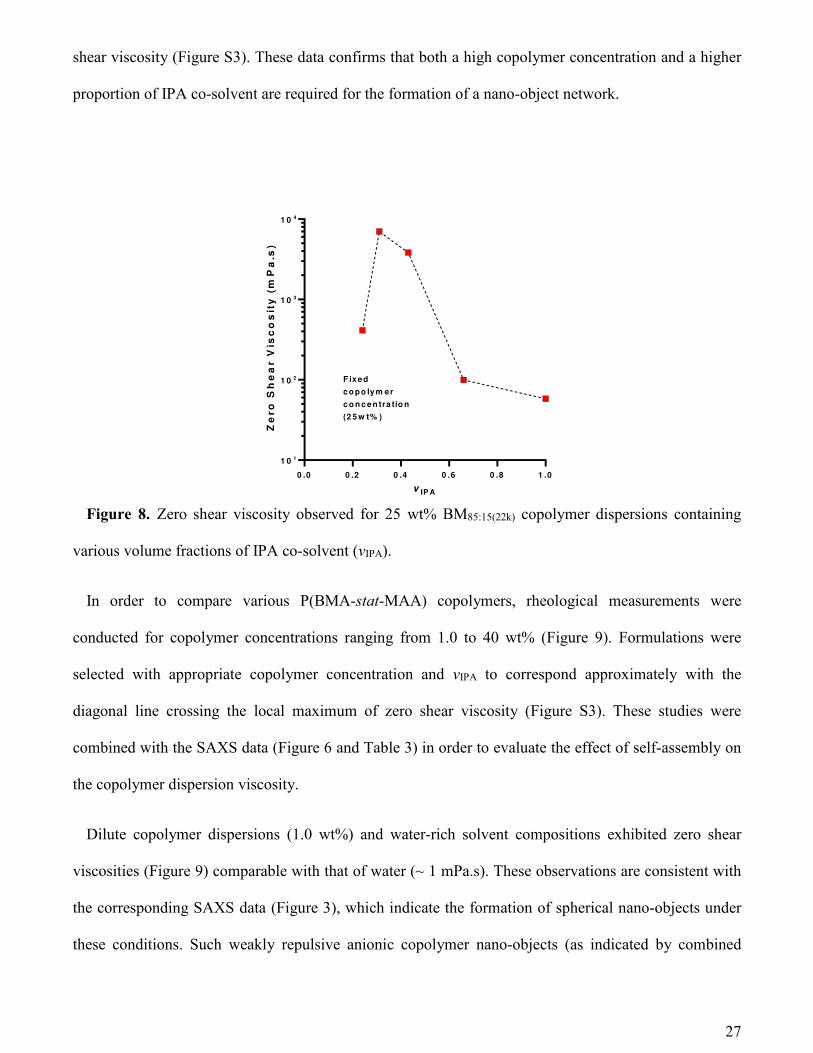
Rheology of copolymer dispersions. Rheological studies were performed on the same copolymer
dispersions of various concentrations and solvent composition to determine their dynamic viscosity and
to monitor any physical consequences of the structural phenomena detected by SAXS (Figures 5, 6, and
7). Initial experiments were conducted on 25 wt% copolymer dispersions with the binary solvent
composition being varied from IPA-rich to water-rich (Figure 8) to assess how this parameter affects
their rheological behavior. When the solvent environment is IPA-rich (i.e., when the volume fraction of
IPA, vIPA, is at least 0.66) a relatively low viscosity is observed (Figure 8), which is attributed to the
molecularly-dissolved copolymer chains (Figure 5b and Figure 7). However, when the water content is
increased (0.43 ≥ vIPA ≥ 0.31), the copolymer chains self-assemble to form interconnected nano-objects
(Figure 5b and Figure 7). This nano-object network leads to a sharp increase in the dispersion viscosity
(Figure 8), indicating a significant reduction in chain mobility. When the solvent environment is water-
rich (vIPA ≤ 0.24) the copolymers form well-defined spherical nano-objects (Figure 5b and Figure 7)
leading to a significant reduction in the dispersion viscosity (Figure 8), as expected for isolated particles
in a Newtonian liquid49. An extended series of viscosity measurements on BM85:15(22k) performed over a
wider range of copolymer concentrations and solvent compositions indicates the local maximum in zero
Solvent content FF PY
Polymer wt% vIPA vWater Rs, Å xsol RPY, Å fPY
BM77:23(22k)
10 0.11 0.89 41 0.39 62 0.30
20 0.24 0.76 32 0.84 44 0.28
25 0.31 0.69 25 0.93 37 0.23
30 0.43 0.57 17 0.97 30 0.21
BM85:15(22k)
10 0.11 0.89 52 0.45 85 0.34
20 0.24 0.76 45 0.85 63 0.32
25 0.31 0.69 39 0.92 54 0.30
30 0.43 0.57 33 0.97 45 0.24
BM93:7(22k)
10 0.11 0.89 84 0.46 139 0.35
20 0.24 0.76 80 0.82 112 0.40
25 0.31 0.69 69 0.88 95 0.35
30 0.43 0.57 68 0.92 96 0.35
27
shear viscosity (Figure S3). These data confirms that both a high copolymer concentration and a higher
proportion of IPA co-solvent are required for the formation of a nano-object network.
Figure 8. Zero shear viscosity observed for 25 wt% BM85:15(22k) copolymer dispersions containing
various volume fractions of IPA co-solvent (vIPA).
In order to compare various P(BMA-stat-MAA) copolymers, rheological measurements were
conducted for copolymer concentrations ranging from 1.0 to 40 wt% (Figure 9). Formulations were
selected with appropriate copolymer concentration and vIPA to correspond approximately with the
diagonal line crossing the local maximum of zero shear viscosity (Figure S3). These studies were
combined with the SAXS data (Figure 6 and Table 3) in order to evaluate the effect of self-assembly on
the copolymer dispersion viscosity.
Dilute copolymer dispersions (1.0 wt%) and water-rich solvent compositions exhibited zero shear
viscosities (Figure 9) comparable with that of water (~ 1 mPa.s). These observations are consistent with
the corresponding SAXS data (Figure 3), which indicate the formation of spherical nano-objects under
these conditions. Such weakly repulsive anionic copolymer nano-objects (as indicated by combined
0 .0 0 .2 0 .4 0 .6 0 .8 1 .0
1 0 1
1 0 2
1 0 3
1 0 4
v IP A
Ze
ro S
he
ar
Vis
co
sit
y (
mP
a.s
)
F ixed
c o p o ly m er
c o n c e n tra tio n
(2 5 w t% )
28
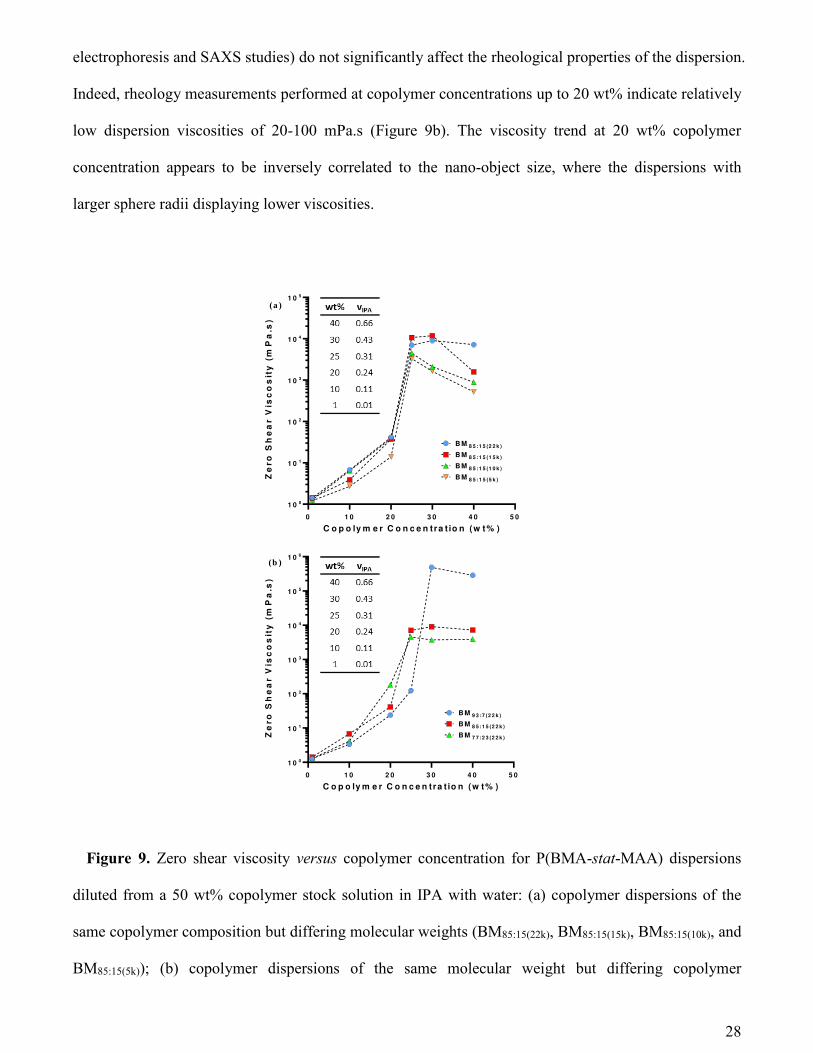
electrophoresis and SAXS studies) do not significantly affect the rheological properties of the dispersion.
Indeed, rheology measurements performed at copolymer concentrations up to 20 wt% indicate relatively
low dispersion viscosities of 20-100 mPa.s (Figure 9b). The viscosity trend at 20 wt% copolymer
concentration appears to be inversely correlated to the nano-object size, where the dispersions with
larger sphere radii displaying lower viscosities.
Figure 9. Zero shear viscosity versus copolymer concentration for P(BMA-stat-MAA) dispersions
diluted from a 50 wt% copolymer stock solution in IPA with water: (a) copolymer dispersions of the
same copolymer composition but differing molecular weights (BM85:15(22k), BM85:15(15k), BM85:15(10k), and
BM85:15(5k)); (b) copolymer dispersions of the same molecular weight but differing copolymer
0 1 0 2 0 3 0 4 0 5 0
1 0 0
1 0 1
1 0 2
1 0 3
1 0 4
1 0 5
C o p o ly m e r C o n c e n tra t io n (w t% )
Ze
ro S
he
ar
Vis
co
sit
y (
mP
a.s
)
B M 8 5 :1 5 (2 2 k )
B M 8 5 :1 5 (1 5 k )
B M 8 5 :1 5 (1 0 k )
B M 8 5 :1 5 (5 k )
(a )
0 1 0 2 0 3 0 4 0 5 0
1 0 0
1 0 1
1 0 2
1 0 3
1 0 4
1 0 5
1 0 6
C o p o ly m e r C o n c e n tra t io n (w t% )
Ze
ro S
he
ar
Vis
co
sit
y (
mP
a.s
)
B M 9 3 :7 (2 2 k )
B M 8 5 :1 5 (2 2 k )
B M 7 7 :2 3 (2 2 k )
(b )

29
composition [BM77:23(22k), BM85:15(22k), and BM93:7(22k)]. The table in each plot shows the composition of
the studied samples (copolymer concentrations and respective IPA volume fraction in the solvent).
Each copolymer displays a local maximum in viscosity at concentrations ranging from 25 wt% to 30
wt%. For example, the copolymer series containing the highest MAA content (Figure 9b) displays a
sharp increase in viscosity at the lowest copolymer concentration (25 wt%) and vIPA (0.31). This
correlates well with the SAXS data (Figure 6a), which suggests that BM77:23(22k) copolymers no longer
form well-defined spherical nano-objects at this concentration but instead form an interconnected nano-
object network, as indicated by the scattering intensity upturn at low q. Furthermore, rheology
measurements show that BMA-rich copolymers (Figure 9b) display a viscosity maximum at the highest
concentration of 30 wt% where the vIPA is 0.43. Again, this observation is consistent with the SAXS
data (Figure 6c), which shows that BM93:7(22k) copolymers at this concentration form a nano-object
network at this concentration.
Further inspecting the rheology data indicates a strong relationship between the maximum viscosity
and the copolymer composition. The former parameter increases with lower MAA contents,
consequently there is a correlation between the maximum viscosity and the nano-object radius. At 40 wt%
copolymer, the IPA content in the copolymer dispersions becomes significant, which promotes
molecular dissolution. Moreover, the viscosity depends on the copolymer molecular weight such that
the longest chains produce the most viscous solutions (Figure 9a). This is consistent with the SAXS data
and suggests that the copolymer chains are molecularly dissolved at this concentration. Furthermore, the
viscosity of 40 wt% copolymer solution not only depends on the molecular weight but also on the
copolymer composition, with the highest viscosity being achieved for the lowest MAA fraction (Figure
9b). An extended set of viscosity measurements using a wider range of copolymer concentrations and
solvent compositions to further map out the peak in viscosity (Figure S3).
Overall, there is a good correlation between the copolymer morphologies determined by SAXS and
viscoelastic properties of the copolymer dispersions: well-defined spherical nano-objects behave as a

30
Newtonian liquid,49 interconnected nano-object networks are characterized by an increase in dispersion
viscosity by more than two orders of viscosity compared to well separated nano-objects, while
molecularly-dissolved copolymer chains exhibit the rheological behavior expected for a polymer
solution.
The relationship between nano-objects size and the copolymer composition. According to the
SAXS data the nano-objects size is strongly dependent on the copolymer composition. In principle, this
trend can be mathematically modelled and used as a predictive tool. However, a suitable physical model
is required to account for the structure of the copolymer nano-objects. SAXS studies indicate structural
order for the nano-objects at low copolymer concentration (Figure 3), while the electrophoretic data
(Table S2) confirm that the nano-objects have anionic character. Thus, following Derjaguin, Landau,
Verwey and Overbeek (DLVO) theory50 the observed colloidal stability of these particles is consistent
with a charge stabilization mechanism. In this context, it is noteworthy that the surface charge increases
with the radius (Table S2). Considering that both parameters responsible for the colloidal stability51 are
related to each other, it is possible to hypothesize that the nano-objects become colloidally stable by
acquiring a critical surface charge density. Since the MAA repeat units confer the surface charge,
copolymer self-assembly most likely involves localization of this component at the particle surface. If
this is correct, then reducing the MAA fraction in the copolymer chains leads to the formation of larger
nano-objects in order to maintain a constant surface charge density. As an idealized approximation of
the proposed scenario it could be assumed that all MAA units congregate at the particle surface. To test
this assumption, the fraction of the nano-object surface covered by MAA residues was calculated for
each particle from the known properties of the copolymer chains and the nano-objects they form.
Using a relatively simple geometric model and structural information obtained from SAXS, the
location of the MAA units within the nano-object can be identified and used to relate the nano-object
radius to the copolymer composition. First, various reasonable assumptions are made for this model: (1)
the nano-objects are assumed to be perfect spheres; (2) all of the MAA segments are located on the
31
nano-object surface; (3) the total surface area covered by all the MAA residues is calculated using the
volume occupied by one MAA unit, where each unit is represented by a cube and one face makes up a
fraction of the nano-object surface.
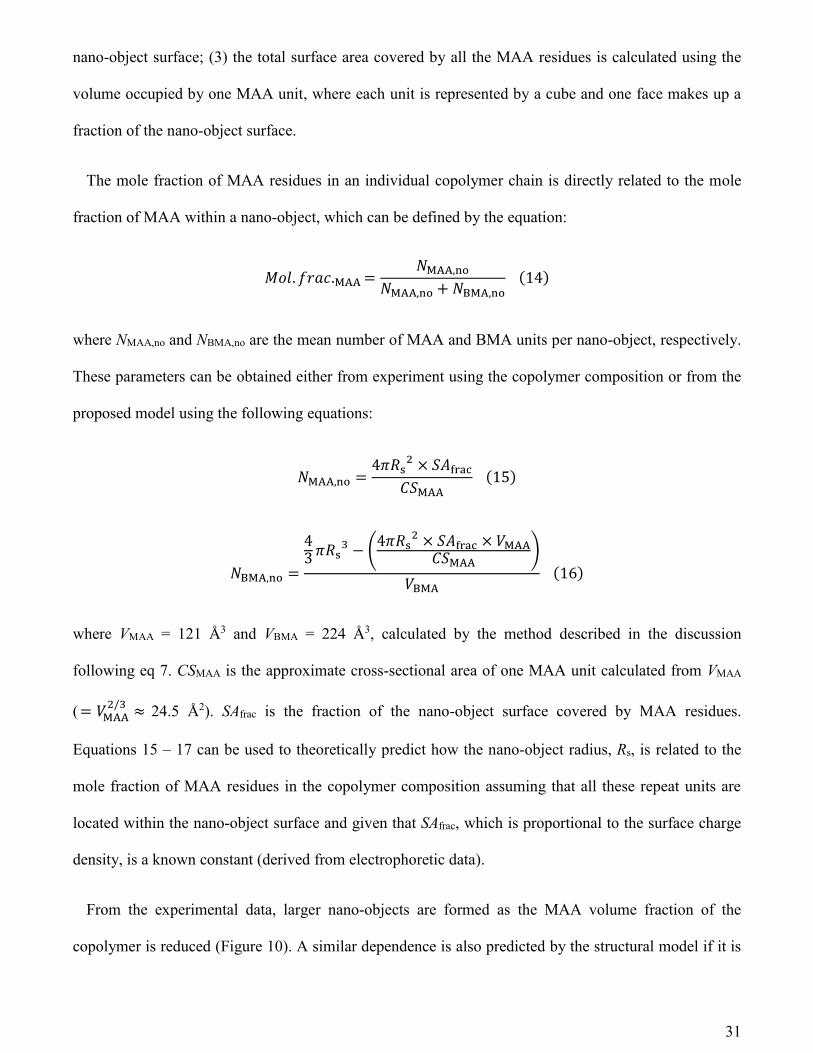
The mole fraction of MAA residues in an individual copolymer chain is directly related to the mole
fraction of MAA within a nano-object, which can be defined by the equation:
警剣健┻ 血堅欠潔┻托代代 噺 軽托代代┸樽誰軽托代代┸樽誰 髪 軽台托代┸樽誰 岫なね岻
where NMAA,no and NBMA,no are the mean number of MAA and BMA units per nano-object, respectively.
These parameters can be obtained either from experiment using the copolymer composition or from the
proposed model using the following equations:
軽托代代┸樽誰 噺 ね講迎坦態 抜 鯨畦脱嘆叩達系鯨托代代 岫なの岻
軽台托代┸樽誰 噺 ねぬ 講迎坦戴 伐 峭ね講迎坦態 抜 鯨畦脱嘆叩達 抜 撃托代代系鯨托代代 嶌撃台托代 岫なは岻
where VMAA = 121 Å3 and VBMA = 224 Å3, calculated by the method described in the discussion
following eq 7. CSMAA is the approximate cross-sectional area of one MAA unit calculated from VMAA
(噺 撃托代代態【戴 蛤 24.5 Å2). SAfrac is the fraction of the nano-object surface covered by MAA residues.
Equations 15 – 17 can be used to theoretically predict how the nano-object radius, Rs, is related to the
mole fraction of MAA residues in the copolymer composition assuming that all these repeat units are
located within the nano-object surface and given that SAfrac, which is proportional to the surface charge
density, is a known constant (derived from electrophoretic data).
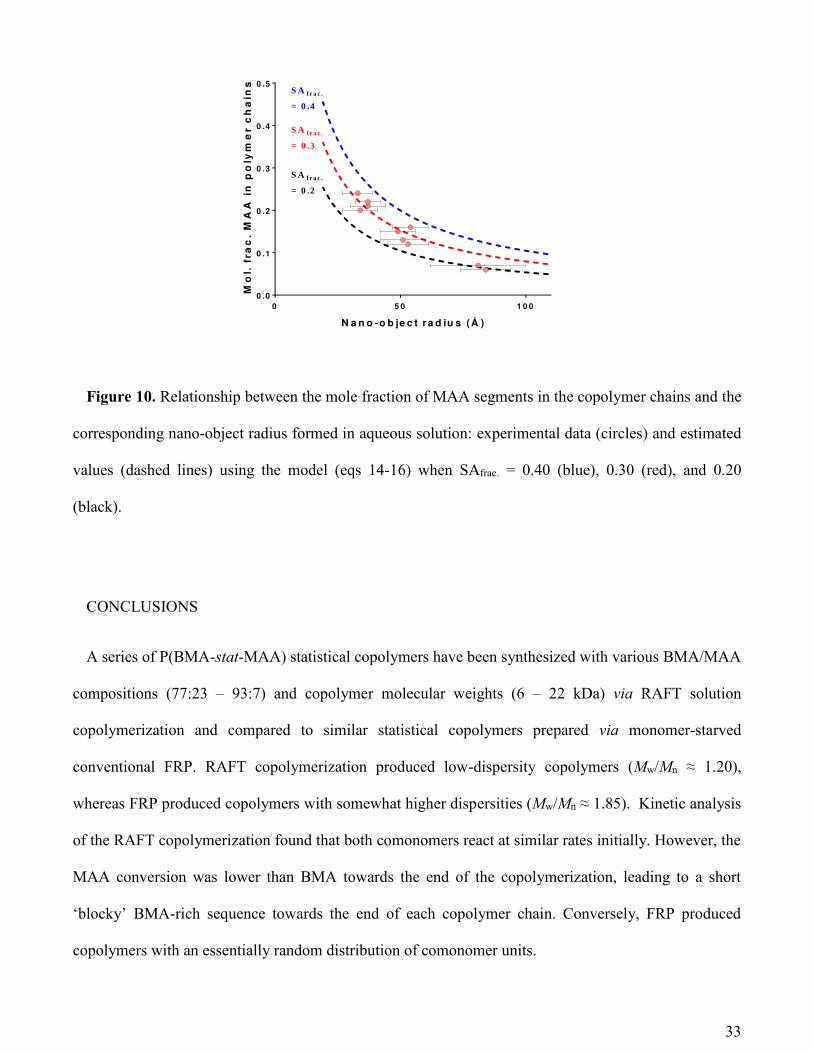
From the experimental data, larger nano-objects are formed as the MAA volume fraction of the
copolymer is reduced (Figure 10). A similar dependence is also predicted by the structural model if it is
32
assumed that all MAA residues are located at the nano-objects surface and its surface fraction, SAfrac, is
constant and independent of the particle size (Figure 10). The striking similarity between the
experimental data and the theoretical prediction by this model suggests that most of the MAA units are
indeed localized at the nano-objects surface. All the experimental data lie within a narrow interval of
SAfrac values and approximately follow a curve corresponding to SAfrac = 0.30 (Figure 10). The
discrepancies observed between the idealized model and the experimental results is likely to be related
to the statistical nature of the copolymer chains. The average contour length of the mean sequence of
BMA repeat unit is probably shorter than the particle diameter. As a result, some MAA units are
surrounded by neighboring BMA units and hence may become ‘trapped’ within the particle cores. Thus,
a more physically realistic structural model should have a core-shell morphology (or perhaps a gradient
distribution of MAA repeat units) with a relatively high concentration of MAA units in the particle shell
(surface) and a relatively low concentration of MAA units within the particle core. A similar model has
been invoked in a recent work on self-assembly of a poly(methyl methacrylate-co-2-dimethyl
aminoethyl methacrylate) random copolymer.19 Nevertheless, the proposed idealized model suggests
that the colloidal stability involves achieving a critical surface charge density that is mainly governed by
the MAA content of the copolymer chains. This crude structural model can be used to estimate the
dimensions of particles formed by the self-assembly of a series of amphiphilic statistical copolymers of
variable MAA content. In principle, incorporating an additional parameter that accounts for the spatial
distribution of MAA repeat units throughout an individual nano-object would improve the predictions of
this model, but this is beyond the scope of this study.
33
Figure 10. Relationship between the mole fraction of MAA segments in the copolymer chains and the
corresponding nano-object radius formed in aqueous solution: experimental data (circles) and estimated
values (dashed lines) using the model (eqs 14-16) when SAfrac. = 0.40 (blue), 0.30 (red), and 0.20
(black).
CONCLUSIONS
A series of P(BMA-stat-MAA) statistical copolymers have been synthesized with various BMA/MAA
compositions (77:23 – 93:7) and copolymer molecular weights (6 – 22 kDa) via RAFT solution
copolymerization and compared to similar statistical copolymers prepared via monomer-starved
conventional FRP. RAFT copolymerization produced low-dispersity copolymers (Mw/Mn ≈ 1.20),
whereas FRP produced copolymers with somewhat higher dispersities (Mw/Mn ≈ 1.85). Kinetic analysis
of the RAFT copolymerization found that both comonomers react at similar rates initially. However, the
MAA conversion was lower than BMA towards the end of the copolymerization, leading to a short
‘blocky’ BMA-rich sequence towards the end of each copolymer chain. Conversely, FRP produced
copolymers with an essentially random distribution of comonomer units.
0 5 0 1 0 00 .0
0 .1
0 .2
0 .3
0 .4
0 .5
N a n o -o b je c t r a d iu s (Å )
Mo
l. f
rac
. M
AA
in
po
lym
er
ch
ain
s
S A f r a c .
= 0 .4
S A f r a c .
= 0 .3
S A f r a c .
= 0 .2
34
SAXS studies of the effect of varying the IPA/water binary solvent composition on the morphology of
the self-assembled structures in the presence of base (ca. pH 8) indicated that the copolymers are largely
present as molecularly-dissolved Gaussian chains when the solvent is IPA-rich but self-assemble to
form well-defined spherical nano-objects when the solvent composition becomes water-rich. Nano-
object radii are inversely proportional to the MAA content of such copolymers but remain independent
of molecular weight. At high copolymer concentrations and intermediate IPA/water solvent
compositions, SAXS indicated the formation of relatively large objects. This is interpreted in terms of
an inter-connected nano-object network created by the overlap of swollen nano-objects confined in
space. These morphological insights correlate well with rheological measurements. At low copolymer
concentrations, non-interacting spherical nano-objects are formed and the dispersions exhibit viscosities
comparable to that of water. At high copolymer and IPA concentrations, when the dispersions become
molecularly-dissolved copolymer chains, the solution viscosities are molecular weight-dependent, as
expected. At intermediate copolymer and IPA concentrations, a pronounced maximum in solution
viscosity is observed, which is consistent with the formation of the inter-connected nano-object network
structures indicated by the SAXS data.
A relatively simple structural model involving just a form factor for spherical particles proved to be a
good first approximation for the SAXS analysis of nano-objects formed by self-assembly of amphiphilic
P(BMA-stat-MAA) statistical copolymers. This model has been refined by incorporating additional
terms to account for fluctuating scattering length density associated with randomly-packed MAA and
BMA repeat units, and scattering arising from a large inter-connected nano-object network. An
appropriate structure factor has also been incorporated into this model to analyze the nano-object
packing. This more sophisticated model provided good fits to all experimental SAXS patterns obtained
for these copolymer dispersions, allowing determination of particle size, particle size distribution, the
solvent concentration inside the particle cores and the mean molecule aggregation number.
35
Combined SAXS and electrophoretic measurements indicate that the nano-object size is directly
related to the surface charge density and, therefore, the fraction of the nano-object surface covered by
MAA. A new structural model assuming that the hydrophilic (MAA) units are localized at the particle
surface and the hydrophobic (BMA) units mainly form the particle core has been proposed that is
consistent with the experimental data and can be used as a first approximation to predict nano-object
dimensions for aqueous dispersions of amphiphilic statistical copolymers.
ASSOCIATED CONTENT
Supporting Information. Representative curves of dynamic viscosity vs. angular frequency, table
summarizing the reagent quantities required in the RAFT copolymerization, summary of copolymer
characterization data, electrophoretic data, dependence of viscosity on sample composition and SAXS
patterns with accompanying images of copolymer dispersions in the presence of added electrolyte.
AUTHOR INFORMATION
Corresponding Authors
*E-mail: [email protected], (O.O.M.)
*E-mail: [email protected] (S.G.S)
ACKNOWLEDGEMENTS
AkzoNobel (Slough, UK) and EPSRC (EP/L016281/1) are thanked for funding a CDT PhD CASE
studentship for T.J.N. O.O.M. and S.P.A. thank EPSRC for the capital equipment grant to purchase the
laboratory-based Xenocs/Excillum SAXS instrument used for characterizing the studied copolymer
36
dispersions (EP/M028437/1). Dr. M. J. Derry is thanked for his help in calculating the nano-object
surface area fraction covered by MAA.
REFERENCES
(1) Rösler, A.; Vandermeulen, G. W. M.; Klok, H. A. Advanced Drug Delivery Devices via Self-
Assembly of Amphiphilic Block Copolymers. Adv. Drug Deliv. Rev. 2012, 64, 270–279.
(2) Morishima, Y.; Nomura, S.; Ikeda, T.; Seki, M.; Kamachi, M. Characterization of Unimolecular
Micelles of Random Copolymers of Sodium 2-(Acrylamido)-2-Methylpropanesulfonate and
Methacrylamides Bearing Bulky Hydrophobic Substituents. Macromolecules 1995, 28 (8), 2874–
2881.
(3) Li, L.; Raghupathi, K.; Song, C.; Prasad, P.; Thayumanavan, S. Self-Assembly of Random
Copolymers. Chem. Commun. 2014, 50 (88), 13417–13432.
(4) Xu, R.; Winnik, M. A.; Hallett, F. R.; Riess, G.; Croucher, M. D. Light-Scattering Study of the
Association Behavior of Styrene-Ethylene Oxide Block Copolymers in Aqueous Solution.
Macromolecules 1991, 24 (1), 87–93.
(5) Wilhelm, M.; Zhao, C. Le; Wang, Y.; Xu, R.; Winnik, M. A.; Mura, J. L.; Riess, G.; Croucher, M.
D. Poly(styrene-Ethylene Oxide) Block Copolymer Micelle Formation in Water: A Fluorescence
Probe Study. Macromolecules 1991, 24 (5), 1033–1040.
(6) Prochazka, K.; Kiserow, D.; Ramireddy, C.; Munk, P.; Webber, S. E.; Tuzar, Z. Time-Resolved
Fluorescence Studies of the Chain Dynamics of Naphthalene-Labeled Polystyrene-Block-
Poly(methacrylic Acid) Micelles in Aqueous Media. Macromolecules 1992, 25 (1), 454–460.
(7) Astafieva, I.; Zhong, X. F.; Eisenberg, A. Critical Micellization Phenomena in Block
37
Polyelectrolyte Solutions. Macromolecules 1993, 26, 7339.
(8) Qin, A.; Tian, M.; Ramireddy, C.; Webber, S. E.; Munk, P.; Tuzar, Z. Polystyrene挑
Poly(methacrylic Acid) Block Copolymer Micelles. Macromolecules 1994, 27 (1), 120–126.
(9) Guo, M.; Pitet, L. M.; Wyss, H. M.; Vos, M.; Dankers, P. Y. W.; Meijer, E. W. Tough Stimuli-
Responsive Supramolecular Hydrogels with Hydrogen-Bonding Network Junctions. J. Am. Chem.
Soc. 2014, 136 (19), 6969–6977.
(10) Huo, M.; Yuan, J.; Tao, L.; Wei, Y. Redox-Responsive Polymers for Drug Delivery: From
Molecular Design to Applications. Polym. Chem. 2014, 5 (5), 1519.
(11) Schattling, P.; Jochum, F. D.; Theato, P. Multi-Stimuli Responsive Polymers – the All-in-One
Talents. Polym. Chem. 2014, 5 (1), 25–36.
(12) Sun, Y.; Wang, Z.; Li, Y.; Zhang, Z.; Zhang, W.; Pan, X.; Zhou, N.; Zhu, X. Photoresponsive
Amphiphilic Macrocycles Containing Main-Chain Azobenzene Polymers. Macromol. Rapid
Commun. 2015, 1341–1347.
(13) Blanazs, A.; Madsen, J.; Battaglia, G.; Ryan, A. J.; Armes, S. P. Mechanistic Insights for Block
Copolymer Morphologies: How Do Worms Form Vesicles? J. Am. Chem. Soc. 2011, 133,
16581–16587.
(14) Blanazs, A.; Ryan, A. J.; Armes, S. P. Predictive Phase Diagrams for RAFT Aqueous Dispersion
Polymerization: Effect of Block Copolymer Composition, Molecular Weight, and Copolymer
Concentration. Macromolecules 2012, 45, 5099–5107.
(15) Mable, C. J.; Gibson, R. R.; Prevost, S.; McKenzie, B. E.; Mykhaylyk, O. O.; Armes, S. P.
Loading of Silica Nanoparticles in Block Copolymer Vesicles during Polymerization-Induced
Self-Assembly: Encapsulation Efficiency and Thermally Triggered Release. J. Am. Chem. Soc.
2015, 137 (51), 16098–16108.
38
(16) Blanazs, A.; Armes, S. P.; Ryan, A. J. Self-Assembled Block Copolymer Aggregates: From
Micelles to Vesicles and Their Biological Applications. Macromol. Rapid Commun. 2009, 30 (4–
5), 267–277.
(17) Scheler, U. Handbook of Polyelectrolytes and Their Application, Vol. 2; American Scientific
Publishers: California, 2002.
(18) Hu, Y.; Armentrout, R. S.; McCormick, C. L. Water Soluble Polymers. 75. Responsive
Microdomains in Labeled N-Octylamide-Substituted Poly(sodium Maleate-Alt-Ethyl Vinyl
Ether): Transient Fluorescence and Time-Resolved Fluorescence Anisotropy Studies.
Macromolecules 1997, 30, 3538–3546.
(19) Pegg, J. C.; Czajka, A.; Hill, C.; James, C.; Peach, J.; Rogers, S. E.; Eastoe, J. Alternative Route
to Nanoscale Aggregates with a pH-Responsive Random Copolymer. Langmuir 2017, 33 (10),
2628–2638.
(20) Hales, K.; Pochan, D. J. Using Polyelectrolyte Block Copolymers to Tune Nanostructure
Assembly. Curr. Opin. Colloid Interface Sci. 2006, 11 (6), 330–336.
(21) Hirai, Y.; Terashima, T.; Takenaka, M.; Sawamoto, M. Precision Self-Assembly of Amphiphilic
Random Copolymers into Uniform and Self-Sorting Nanocompartments in Water.
Macromolecules 2016, 49 (14), 5084–5091.
(22) Chang, Y.; McCormick, C. L. Water-Soluble Copolymers. 49. Effect of the Distribution of the
Hydrophobic Cationic Monomer Dimethyldodecyl(2-acrylamidoethy1)ammonium Bromide on
the Solution Behavior of Associating Acrylamide Copolymers. Macromolecules 1993, 26, 6121.
(23) Hashidzume, A.; Kawaguchi, A.; Tagawa, A.; Hyoda, K.; Sato, T. Synthesis and Structural
Analysis of Self-Associating Amphiphilic Statistical Copolymers in Aqueous Media.
Macromolecules 2006, 39 (3), 1135–1143.
39
(24) Kawata, T.; Hashidzume, A.; Sato, T. Micellar Structure of Amphiphilic Statistical Copolymers
Bearing Dodecyl Hydrophobes in Aqueous Media. Macromolecules 2007, 40 (4), 1174–1180.
(25) Zhu, X.; Liu, M. Self-Assembly and Morphology Control of New L -Glutamic Acid-Based
Amphiphilic Random Copolymers: Giant Vesicles, Vesicles, Spheres, and Honeycomb Film.
Langmuir 2011, 27 (21), 12844–12850.
(26) Guo, P.; Guan, W.; Liang, L.; Yao, P. Self-Assembly of pH-Sensitive Random Copolymers:
Poly(styrene-Co-4-Vinylpyridine). J. Colloid Interface Sci. 2008, 323 (2), 229–234.
(27) Liu, X.; Kim, J.-S.; Wu, J.; Eisenberg, A. Bowl-Shaped Aggregates from the Self-Assembly of an
Amphiphilic Random Copolymer of Poly(styrene- Co -Methacrylic Acid). Macromolecules 2005,
38 (16), 6749–6751.
(28) Tian, F.; Yu, Y.; Wang, C.; Yang, S. Consecutive Morphological Transitions in Nanoaggregates
Assembled from Amphiphilic Random Copolymer via Water-Driven Micellization and Light-
Triggered Dissociation. Macromolecules 2008, 41 (10), 3585–3588.
(29) Wu, X.; Qiao, Y.; Yang, H.; Wang, J. Self-Assembly of a Series of Random Copolymers Bearing
Amphiphilic Side Chains. J. Colloid Interface Sci. 2010, 349 (2), 560–564.
(30) Ilhan, F.; Galow, T. H.; Gray, M.; Clavier, G.; Rotello, V. M. Giant Vesicle Formation through
Self-Assembly of Complementary Random Copolymers [10]. J. Am. Chem. Soc. 2000, 122 (24),
5895–5896.
(31) Riemer, S.; Prévost, S.; Dzionara, M.; Appavou, M.-S.; Schweins, R.; Gradzielski, M.
Aggregation Behaviour of Hydrophobically Modified Polyacrylate – Variation of Alkyl Chain
Length. Polymer (Guildf). 2015, 70, 194–206.
(32) Semsarilar, M.; Ladmiral, V.; Blanazs, A.; Armes, S. P. Poly(methacrylic Acid)-Based AB and
ABC Block Copolymer Nano-Objects Prepared via RAFT Alcoholic Dispersion Polymerization.
40
Polym. Chem. 2014, 5 (10), 3466–3475.
(33) Ilavsky, J. Nika: Software for Two-Dimensional Data Reduction. J. Appl. Crystallogr. 2012, 45
(2), 324–328.
(34) Ilavsky, J.; Jemian, P. R. Irena: Tool Suite for Modeling and Analysis of Small-Angle Scattering.
J. Appl. Crystallogr. 2009, 42 (2), 347–353.
(35) Cockram, A. A.; Neal, T. J.; Derry, M. J.; Mykhaylyk, O. O.; Williams, N. S. J.; Murray, M. W.;
Emmett, S. N.; Armes, S. P. Effect of Monomer Solubility on the Evolution of Copolymer
Morphology during Polymerization-Induced Self-Assembly in Aqueous Solution.
Macromolecules 2017, 50 (3), 796–802.
(36) Chiefari, J.; Chong, Y. K. (Bill); Ercole, F.; Krstina, J.; Jeffery, J.; Le, T. P. T.; Mayadunne, R. T.
A.; Meijs, G. F.; Moad, C. L.; Moad, G.; Rizzardo, E.; Thang, S. H. Living Free-Radical
Polymerization by Reversible Addition−Fragmentation Chain Transfer: The RAFT Process.
Macromolecules 1998, 31 (16), 5559–5562.
(37) Pedersen, J. S.; Gerstenberg, M. C. Scattering Form Factor of Block Copolymer Micelles.
Macromolecules 1996, 29 (4), 1363–1365.
(38) Percus, J. K.; Yevick, G. J. Analysis of Classical Statistical Mechanics by Means of Collective
Coordinates. Phys. Rev. 1958, 110 (1), 1–13.
(39) Hayter, J. B.; Penfold, J. An Analytic Structure Factor for Macroion Solutions. Mol. Phys. 1981,
42, 109–118.
(40) Delgado, A. V.; González-Caballero, F.; Hunter, R. J.; Koopal, L. K.; Lyklema, J. Measurement
and Interpretation of Electrokinetic Phenomena (IUPAC Technical Report). Pure Appl. Chem.
2005, 77 (10), 1753–1805.
41
(41) Hsu, M. F.; Dufresne, E. R.; Weitz, D. A. Charge Stabilization in Nonpolar Solvents. Langmuir
2005, 21 (11), 4881–4887.
(42) Pedersen, J. S. Form Factors of Block Copolymer Micelles with Spherical, Ellipsoidal and
Cylindrical Cores. J. Appl. Crystallogr. 2000, 33 (3 I), 637–640.
(43) Pedersen, J. S.; Hamley, I. W.; Ryu, C. Y.; Lodge, T. P. Contrast Variation Small-Angle Neutron
Scattering Study of the Structure of Block Copolymer Micelles in a Slightly Selective Solvent at
Semidilute Concentrations. Macromolecules 2000, 33 (2), 542–550.
(44) Doi, M.; Edwards, S. F. The Theory of Polymer Dynamics; Claredon Press: Oxford, 1986.
(45) Beaucage, G.; Schaefer, D. W. W. Structural Studies of Complex Systems Using Small-Angle
Scattering: A Unified Guinier/power-Law Approach. J. Non. Cryst. Solids 1994, 172–174, 797–
805.
(46) Beaucage, G. Approximations Leading to a Unified Exponential/Power-Law Approach to Small-
Angle Scattering. J. Appl. Crystallogr. 1995, 28 (6), 717–728.
(47) Beaucage, G. Small-Angle Scattering from Polymeric Mass Fractals of Arbitrary Mass-Fractal
Dimension. J. Appl. Crystallogr. 1996, 29 (2), 134–146.
(48) Lee, C.; Jeoung, E.; Lee, I. Effect of Mixtures of Water and Organic Solvents on the Acidities of
5-Membered Heteroaromatic Carboxylic Acids. Journal of Heterocyclic Chemistry. 2000, pp
159–166.
(49) Willenbacher, N.; Georgieva, K. Rheology of Disperse Systems. In Product Design and
Engineering: Formulation of Gels and Pastes; Brockel, U., Meier, W., Wgner, G., Eds.; Wiley-
VCH Verlag GmbH & Co. KGaA.: Weinheim, 2013; pp 7–49.
(50) Hunter, R. J. Foundations of Colloid Science, 2nd ed.; Oxford University Press: New York, 2000.

42
(51) Hidalgo-Álvarez, R.; Martín, A.; Fernández, A.; Bastos, D.; Martínez, F.; De Las Nieves, F. J.
Electrokinetic Properties, Colloidal Stability and Aggregation Kinetics of Polymer Colloids. Adv.
Colloid Interface Sci. 1996, 67, 1–118.
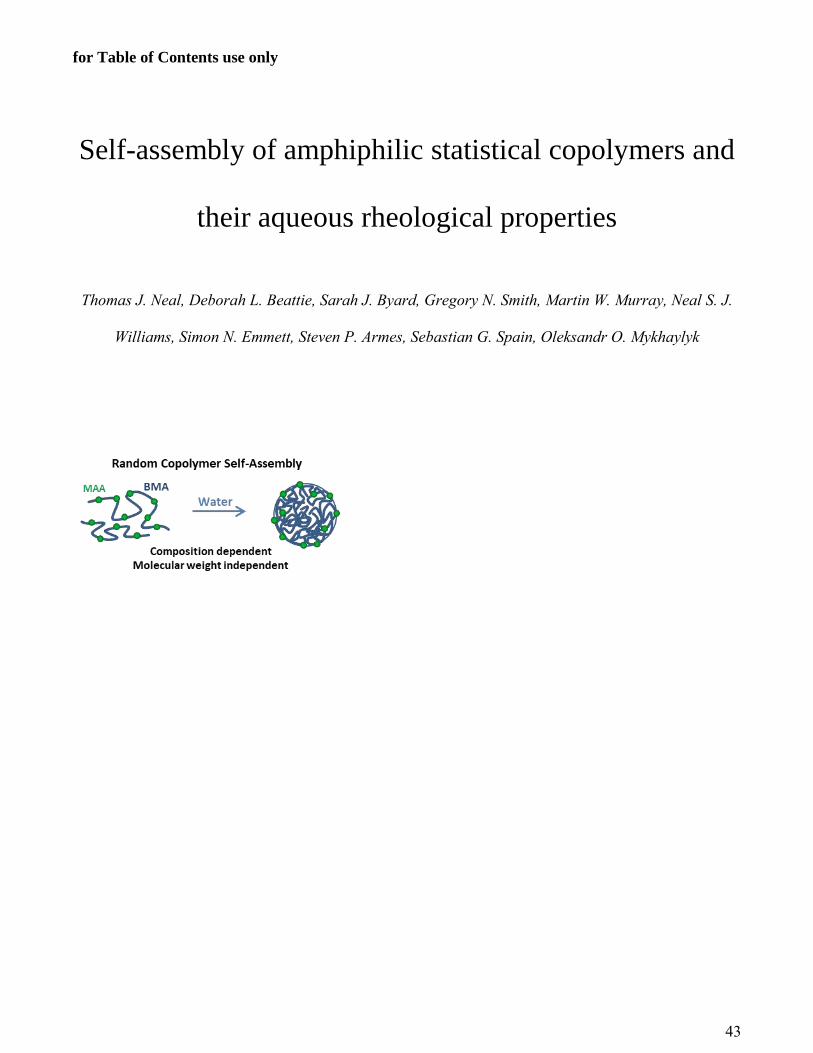
43
for Table of Contents use only
Self-assembly of amphiphilic statistical copolymers and
their aqueous rheological properties
Thomas J. Neal, Deborah L. Beattie, Sarah J. Byard, Gregory N. Smith, Martin W. Murray, Neal S. J.
Williams, Simon N. Emmett, Steven P. Armes, Sebastian G. Spain, Oleksandr O. Mykhaylyk