self-calibrating and high-sensitivity microwave phase
TRANSCRIPT
Self-calibrating and high-sensitivity microwavephase noise analyzer applying an opticalfrequency comb generator and an optical-hybrid-based I/Q detectorFANGZHENG ZHANG,1 JINGZHAN SHI,1 YU ZHANG,2 DE BEN,1 LIJUN SUN,2 AND SHILONG PAN1,*1Key Laboratory of Radar Imaging and Microwave Photonics, Ministry of Education, Nanjing University of Aeronautics and Astronautics,Nanjing 210016, China2Chongqing Optoelectronics Research Institute, Chongqing 400060, China*Corresponding author: [email protected]
Received 20 August 2018; accepted 13 September 2018; posted 14 September 2018 (Doc. ID 342669); published 10 October 2018
Phase noise analyzers (PNAs) are indispensable forevaluating the short-term stability of microwave signals.In this Letter, a high-sensitivity PNA with self-calibrationcapability is proposed based on an optical frequency combgenerator and an optical-hybrid-based I∕Q detector.The negative factors that result in inaccurate measurement,including the direct component interference, amplitudenoises of the microwave signal under test and the laser,and phase noise of the laser, are all eliminated throughdigital signal processing. A proof-of-concept experimentis performed. The established PNA can achieve accuratephase noise measurement with a high sensitivity of−146.1 dBc∕Hz at 10 kHz, and the self-calibrating prop-erty of the PNA is also verified. © 2018 Optical Society ofAmerica
OCIS codes: (060.5625) Radio frequency photonics; (070.1170)
Analog optical signal processing; (060.2360) Fiber optics links and
subsystems.
https://doi.org/10.1364/OL.43.005029
Phase noise indicates the short-term frequency stability of asingle-frequency signal [1]. In radar, communication, and nav-igation systems, high-stability microwave signals are highly de-manded [2,3], and a high-sensitivity phase noise analyzer(PNA) is indispensable for measuring microwave signals havinga low phase noise. Among the various methods for establishinga PNA, the photonic-delay-line-based frequency discriminatormethod has attracted a lot of attention because it can achieve ahigh sensitivity and a large measurement frequency range withthe help of microwave photonic technologies [4–7]. In thismethod, to achieve a high phase noise measurement sensitivity,a large time delay is required [8], which, however, will reducethe reliable offset frequency range for phase noise measure-ment. By applying the two-channel cross-correlation method[9], the phase noise measurement sensitivity can also be
improved, but the measurement is usually time-consuming,and the system has a high cost. In Ref. [10], a cost-effectivereal-time ultra-high-sensitivity PNA based on an optical fre-quency comb (OFC) generator is proposed. By processingthe selected �nth order comb lines, which carry the n-timesmagnified phase noise of the signal under test (SUT), the mea-surement sensitivity of the PNA can be significantly improved.However, a potential problem with this system is that thephase-to-voltage conversion coefficient of the mixer is depen-dent on the input power, which not only converts the ampli-tude noises of the SUT and the laser source into a part of themeasured phase noise but also requires a calibration before eachmeasurement because the SUTs usually have different powers.
In this Letter, we propose and demonstrate a self-calibratingand high-sensitivity PNA based on an OFC generator and anoptical-90-degree-hybrid-based I∕Q detector. Figure 1(a)shows the schematic diagram of the proposed PNA. The con-tinuous wave (CW) light from a laser diode (LD) is injectedinto an OFC generator, which is driven by the SUT havinga frequency of f s. According to Ref. [11], the optical fieldof the obtained signal is
E1�t� ∝Xn�∞
n�−∞�An�t�ej�2π�f c�nf s�t�φc�t��nφs�t���, (1)
where f c and φc�t� are the frequency and phase noise of theCW light from the LD, respectively. φs�t� is the phase noise ofthe SUT. An�t� is the amplitude of the �nth order comb line,which is related to the amplitude and amplitude noise of theCW light and the amplitude and amplitude noise of the SUT.Considering the symmetry of the OFC, the amplitude of the−nth order comb line is equal to that of the nth order combline, that is, A−n�t� � An�t�.
The output signal from the OFC generator is amplified byan erbium-doped fiber amplifier (EDFA) and then split intotwo branches by an optical splitter. In the upper branch, a spanof single-mode fiber (SMF) is used to introduce a time delay ofτ. Then, the �nth order comb lines of the delayed signal are
Letter Vol. 43, No. 20 / 15 October 2018 / Optics Letters 5029
0146-9592/18/205029-04 Journal © 2018 Optical Society of America

selected out by a dual-output reconfigurable optical bandpassfilter (ROBPF). The obtained two optical signals after theROBPF can be written as
E2a�t� ∝ An�t − τ�ej�2π�f c�nf s��t−τ��φc�t−τ��nφs�t−τ��,
E2b�t� ∝ An�t − τ�ej�2π�f c−nf s��t−τ��φc�t−τ�−nφs�t−τ�−φd �, (2)
where φd is the phase difference between the �nth order andthe −nth order comb lines due to the dispersion of the SMF. Inthe lower branch, the�nth order comb lines are filtered out byanother ROBPF, and the obtained two optical signals are
E3a�t� ∝ An�t�ej�2π�f c�nf s�t�φc�t��nφs�t��,
E3b�t� ∝ An�t�ej�2π�f c−nf s�t�φc�t�−nφs�t��: (3)
Next, the two �nth order comb lines from the upper and thelower branches are sent to the two input ports of an optical90-degree hybrid, respectively [12]. After the hybrid, two bal-anced photodiodes (BPD1 and BPD2) are followed to imple-ment optical-to-electrical conversion. The output electricalsignals of BPD1 and BPD2 are
v1�t� ∝ 4R1ZLAn�t�An�t − τ� cos�φ1�t� � φ2�t��,v2�t� ∝ 4R2ZLAn�t�An�t − τ� sin�φ1�t� � φ2�t��, (4)
where R1 and R2 are the responsivities of BPD1 and BPD2,respectively, ZL is the input impendence, φ1�t� � 2πf cτ�φc�t� − φc�t − τ�, and φ2�t� � 2πnf sτ� n�φs�t� − φs�t − τ��.Similarly, the two −nth order comb lines from the upper andthe lower branches are sent to another optical 90-degree hybrid,which is followed by another pair of BPDs (BPD3 and BPD4).The obtained two electrical signals are
v3�t� ∝ 4R3ZLAn�t�An�t − τ� cos�φd � φ1�t� − φ2�t��,v4�t� ∝ 4R4ZLAn�t�An�t − τ� sin�φd � φ1�t� − φ2�t��, (5)
where R3 and R4 are the responsivities of BPD3 and BPD4, re-spectively. The obtained four electrical signals in Eqs. (4) and (5)are digitized by a four-channel analog-to-digital converter(ADC), and the obtained digital signals are processed to acquirethe phase noise of the SUT.
Based on Eqs. (4) and (5), φ2�t� can be calculated by
φ2�t� � arctan
" R1
R3v3�t� − v1�t�
R1
R2v2�t� � R1
R4v4�t�
#� φd
2: (6)
Considering the variation of φ1�t� due to the phase noise of atypical LD would exceed 2π in a short observation time [13],according to Eqs. (4) and (5), the maximum value of vi�t� isproportional to Ri, and thus R1∕Ri can be figured out by
R1
Ri� max�v1�t��
max�vi�t��, i � 2, 3, 4: (7)
In Eq. (6), φd can be treated as a constant, because the phasefluctulatation due to the interreaction between the phase noiseof a commercial LD and the dispersion of an SMF with a lengthof several kilometers can be neglected. Thus, the power spectraldensity (PSD) of φ2�t� at nonzero offset frequencies can becalculated by neglecting the φd∕2 term in Eq. (6). Finally,the phase noise of the SUT can be achieved via
L�f � � sφ2�f �8n2 sin2�πf τ� , f > 0, (8)
where sφ2�f � is the PSD of φ2�t�.In this method, the estimated phase φ2�t� in Eq. (6) is
related to the n-times magnified phase variation of the SUT.Thus a high phase noise measurement sensitivity can beachieved. To show how the measurement sensitivity is affectedby n, the phase noise floor of the PNA is analyzed when choos-ing different n and considering the internal noises of the mea-surement system. Here, the internal noise sources, includingthe shot noise, flicker noise, and thermal noise, are mainly fromthe active devices in the system, such as the BPDs and the ADC[14]. We define the terms (R1v2�t�∕R2 � R1v4�t�∕R4) and(R1v3�t�∕R3 − v1�t�) in Eq. (6) as I�t� and Q�t�, respectively.Since the noises in the BPDs and the ADC are uncorrelated,the noise signals in I�t� and Q�t� are also uncorrelated. InFig. 1(b), αI �t� and αQ�t� are the uncorrelated noise signalsin I�t� and Q�t�, respectively, A is the signal amplitude thatis proportional to the power of the selected comb lines, andφ�t� equals φ2�t� − φd∕2. When αI �t� and αQ�t� are far lessthan A, the phase fluctuation due to the noises is
φα�t� ≈
ffiffiffiffiffiffiffiffiffiffiffiffiffiffiffiffiffiffiffiffiffiffiffiffiffiffiffiffiffiffiffiffiffiffiffiffijαI �t�j2 � jαQ�t�j2
qA
� α�t�A
: (9)
We define the PSD of φα�t� as sφα�f �. To achieve accuratephase noise measurement, the PSD of φ2�t�, that is, sφ2�f �,should satisfy the following condition:
sφ2�f � ≥ sφα�f � �sα�f �A2 , (10)
where sα�f � is the PSD of α�t�. According to Eq. (8), the mini-mum phase noise that can be accurately measured is
Lmin�f � �sα�f �
8A2n2 sin2�πf τ� : (11)
Equation (11) indicates that, if A is a constant, the phase noisefloor will be improved by choosing a larger n, and the phase
Fig. 1. (a) Schematic diagram of the proposed PNA and (b) diagram for estimating the phase noise floor.
5030 Vol. 43, No. 20 / 15 October 2018 / Optics Letters Letter

noise floor is improved by 20 lg�n� dB compared with the caseapplying the �1st order comb lines.
In addition to the high measurement sensitivity, the proposedmethod also has the following advantages. First, thanks to the useof balanced photodetection, the obtained signals in Eqs. (4) and(5) are free from the direct component (dc) interference, which isundesirable in zero-intermediate-frequency signal processing [7].Besides, in obtaining Eq. (6), the amplitude noises of the SUTand the laser and the phase noise of the laser φc�t� are all elim-inated, which helps to achieve an accurate phase noise measure-ment. Furthermore, the value of R1∕Ri in Eq. (7) is acquiredduring the phase noise measurement process applying the samesampled data, which means a self-calibrating operation is achieved.
To verify the feasibility of the proposed PNA, a proof-of-concept experiment is carried out. A continuous-wave light at1550.52 nm with a power of 19 dBm is generated by an LD(TeraXion, PS-NLL-1550.52-080-000-A1), which has a line-width of 5 kHz. The light is sent to an OFC generator(Optical Comb, WETC-01-25) that is driven by the SUT.The obtained OFC is amplified by an EDFA (Amonics,AEDFA-35-B-FA) and then split into two branches by an opticalsplitter. The signal in the upper branch is delayed by a span ofSMF with a length of 2 km and a dispersion of 17 ps/(nm·km) at1550 nm. After the SMF, the �nth comb lines are selected outby a ROBPF (Finisar, Waveshaper 16000A). In the lowerbranch, the �nth order comb lines are selected out using twotunable optical filters (Yenista, XTM-50/S). The two�nth ordercomb lines and the two −nth order comb lines are sent into anoptical 90-deg hybrid (Kylia, COH28), respectively. Followingthe optical hybrids, four BPDs (Thorlabs, PDB450C) are usedto implement square-law detection. The analog voltages at theoutput of the BPDs are converted to digital signals by a four-channel ADC (National Instruments, PCI-4462) with asampling rate of 204.8 kSa/s. The digitalized data are sent toa computer for calculating the phase noise.
First, phase noise measurement of a 25-GHz signal generatedby a commercial microwave signal source (Agilent, E8257D-option 567) is tested with the established PNA. Figure 2(a) showsthe optical spectrum of the generated OFC, which consists ofmore than 40 comb lines. By adjusting the central wavelengthand bandwidth of the ROBPFs to make them have filter re-sponses as shown in Figs. 2(b) and 2(c), the �10th order comblines are selected, of which the spectra are also shown in Figs. 2(b)and 2(c). Figure 3 shows the digitalized signals of v1�t�, v2�t�,v3�t�, and v4�t� in a period of 0.2 s, where the phase variations ofthe waveform are larger than 2π in a temporal duration less than0.15 s, indicating the calculation in Eq. (7) is feasible. Applingthese data, the phase noise of the 25-GHz signal can be calculatedbased on Eqs. (6)–(8). The result is shown in Fig. 4, in which thephase noise measured by a commercial PNA (R&S, FSWP50) isalso depicted as a comparison. As can be seen, the curve measuredby the proposed PNA agrees well with that measured by thecommercial PNA, especially at offset frequencies larger than1 kHz. The deviation between the two results at an offset fre-quency below 1 kHz is mainly attributed to the coefficient of1∕8n2 sin2�πf τ� in Eq. (8), which is infinite at zero offsetfrequencies. This is a common problem for all frequency-discriminator-based PNAs. Another factor resulting in thedeviation is the optical phase fluctuations thermally induced inthe separated paths of the proposed PNA, which is a slow-varyingprocess [15].
Fig. 2. (a) Optical spectrum of the OFC, (b) responses of theROBPFs for selecting the �10th order comb lines and the spectraof the selected �10th order comb lines, and (c) responses of theROBPFs for selecting the −10th order comb lines and the spectraof the selected −10th order comb lines.
Fig. 3. Digitalized signals of v1�t�, v2�t�, v3�t�, and v4�t� in aperiod of 0.2 s.
Fig. 4. Phase noise of a 25-GHz signal measured by the proposedPNA and that measured by a commercial PNA.
Letter Vol. 43, No. 20 / 15 October 2018 / Optics Letters 5031
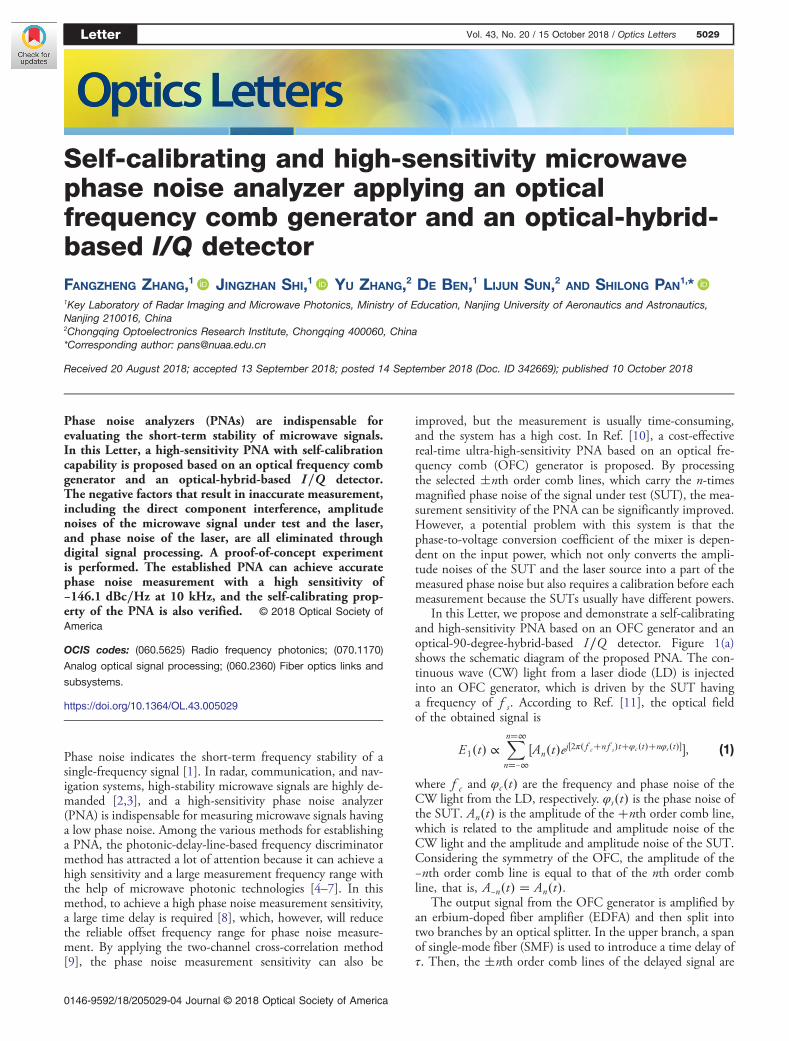
Then the phase noise measurement sensitivity is investigatedby measuring the phase noise floor of the established PNA,which is implemented according to the method in Ref. [6].Figure 5(a) shows the measured phase noise floor of the estab-lished PNA when n is chosen as 1, 10, 20, and 40, respectively.As can be seen, when selecting the �1st, the �10th, the�20th, and the �40th order comb lines, the phase noise floorat 10 kHz offset frequency is −127.6, −138.9, −144.1, and−146.1 dBc∕Hz, respectively. It is found that although thephase noise floor is improved as the increase of n, the improve-ment shows a deviation from the ideal case as indicated inEq. (11). This is mainly caused by the fact that, in our experi-ment, the optical frequency comb line with a higher order hasless power, as shown in Fig. 2(a), which means the value of Adrops as the increase of n.
It should be noted that, although applying higher ordercomb lines can help to improve the phase noise measurementsensitivity, another factor must be considered when choosingthe proper comb lines. Based on Eq. (6), to estimate the phaseφ2�t� without ambiguity, the following condition should besatisfied:
kπ −π
2< φ2�t� −
φd
2≤ kπ � π
2, k ∈ Z: (12)
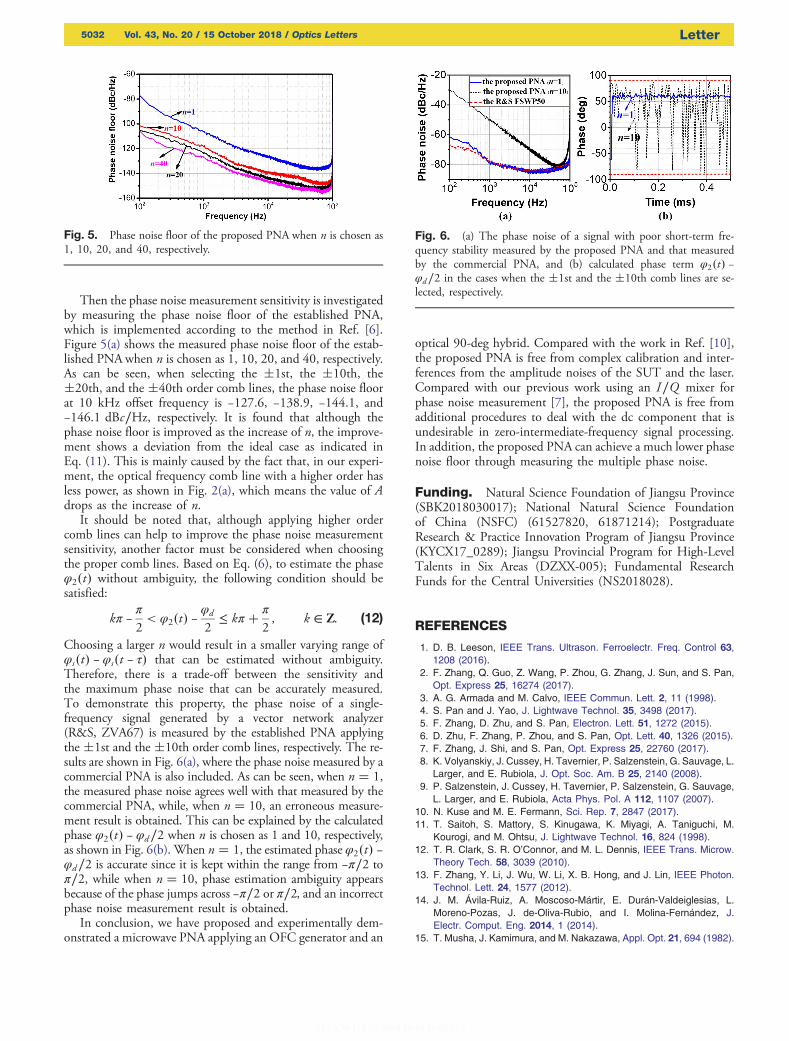
Choosing a larger n would result in a smaller varying range ofφs�t� − φs�t − τ� that can be estimated without ambiguity.Therefore, there is a trade-off between the sensitivity andthe maximum phase noise that can be accurately measured.To demonstrate this property, the phase noise of a single-frequency signal generated by a vector network analyzer(R&S, ZVA67) is measured by the established PNA applyingthe �1st and the �10th order comb lines, respectively. The re-sults are shown in Fig. 6(a), where the phase noise measured by acommercial PNA is also included. As can be seen, when n � 1,the measured phase noise agrees well with that measured by thecommercial PNA, while, when n � 10, an erroneous measure-ment result is obtained. This can be explained by the calculatedphase φ2�t� − φd∕2 when n is chosen as 1 and 10, respectively,as shown in Fig. 6(b). When n � 1, the estimated phase φ2�t� −φd∕2 is accurate since it is kept within the range from −π∕2 toπ∕2, while when n � 10, phase estimation ambiguity appearsbecause of the phase jumps across −π∕2 or π∕2, and an incorrectphase noise measurement result is obtained.
In conclusion, we have proposed and experimentally dem-onstrated a microwave PNA applying an OFC generator and an
optical 90-deg hybrid. Compared with the work in Ref. [10],the proposed PNA is free from complex calibration and inter-ferences from the amplitude noises of the SUT and the laser.Compared with our previous work using an I∕Q mixer forphase noise measurement [7], the proposed PNA is free fromadditional procedures to deal with the dc component that isundesirable in zero-intermediate-frequency signal processing.In addition, the proposed PNA can achieve a much lower phasenoise floor through measuring the multiple phase noise.
Funding. Natural Science Foundation of Jiangsu Province(SBK2018030017); National Natural Science Foundationof China (NSFC) (61527820, 61871214); PostgraduateResearch & Practice Innovation Program of Jiangsu Province(KYCX17_0289); Jiangsu Provincial Program for High-LevelTalents in Six Areas (DZXX-005); Fundamental ResearchFunds for the Central Universities (NS2018028).
REFERENCES
1. D. B. Leeson, IEEE Trans. Ultrason. Ferroelectr. Freq. Control 63,1208 (2016).
2. F. Zhang, Q. Guo, Z. Wang, P. Zhou, G. Zhang, J. Sun, and S. Pan,Opt. Express 25, 16274 (2017).
3. A. G. Armada and M. Calvo, IEEE Commun. Lett. 2, 11 (1998).4. S. Pan and J. Yao, J. Lightwave Technol. 35, 3498 (2017).5. F. Zhang, D. Zhu, and S. Pan, Electron. Lett. 51, 1272 (2015).6. D. Zhu, F. Zhang, P. Zhou, and S. Pan, Opt. Lett. 40, 1326 (2015).7. F. Zhang, J. Shi, and S. Pan, Opt. Express 25, 22760 (2017).8. K. Volyanskiy, J. Cussey, H. Tavernier, P. Salzenstein, G. Sauvage, L.
Larger, and E. Rubiola, J. Opt. Soc. Am. B 25, 2140 (2008).9. P. Salzenstein, J. Cussey, H. Tavernier, P. Salzenstein, G. Sauvage,
L. Larger, and E. Rubiola, Acta Phys. Pol. A 112, 1107 (2007).10. N. Kuse and M. E. Fermann, Sci. Rep. 7, 2847 (2017).11. T. Saitoh, S. Mattory, S. Kinugawa, K. Miyagi, A. Taniguchi, M.
Kourogi, and M. Ohtsu, J. Lightwave Technol. 16, 824 (1998).12. T. R. Clark, S. R. O’Connor, and M. L. Dennis, IEEE Trans. Microw.
Theory Tech. 58, 3039 (2010).13. F. Zhang, Y. Li, J. Wu, W. Li, X. B. Hong, and J. Lin, IEEE Photon.
Technol. Lett. 24, 1577 (2012).14. J. M. Ávila-Ruiz, A. Moscoso-Mártir, E. Durán-Valdeiglesias, L.
Moreno-Pozas, J. de-Oliva-Rubio, and I. Molina-Fernández, J.Electr. Comput. Eng. 2014, 1 (2014).
15. T. Musha, J. Kamimura, and M. Nakazawa, Appl. Opt. 21, 694 (1982).
Fig. 5. Phase noise floor of the proposed PNA when n is chosen as1, 10, 20, and 40, respectively.
Fig. 6. (a) The phase noise of a signal with poor short-term fre-quency stability measured by the proposed PNA and that measuredby the commercial PNA, and (b) calculated phase term φ2�t� −φd∕2 in the cases when the �1st and the �10th comb lines are se-lected, respectively.
5032 Vol. 43, No. 20 / 15 October 2018 / Optics Letters Letter