self-consolidating concrete (phase i & ii) · pdf fileself-consolidating concrete (phase i...
TRANSCRIPT

FHWA NJ 2007-021
Self-Consolidating Concrete (Phase I & II)
FINAL REPORT April 2008
Submitted by
Hani Nassif 1 Kagan Aktas1 Husam Najm 1
Associate Professor Graduate Student Associate Professor Nakin Suksawang2 Raymond El-Khoury1 Assistant Professor Graduate Student
1Dept. of Civil & Environmental Engineering 2Dept. of Civil Engineering and Construction
Rutgers, The State University Florida International University Piscataway, NJ 08854-8014 1501 West Bradley Ave.
Miami, FL 61625
NJDOT Research Project Manager
Edward S. Kondrath
In cooperation with
New Jersey Department of Transportation
Bureau of Research And
U. S. Department of Transportation Federal Highway Administration

Disclaimer Statement
"The contents of this report reflect the views of the author(s) who is (are) responsible for the facts and the
accuracy of the data presented herein. The contents do not necessarily reflect the official views or policies of the New Jersey Department of Transportation or the Federal Highway Administration. This report does not constitute
a standard, specification, or regulation."
This document is disseminated under the sponsorship of the Department of Transportation, University Transportation Centers Program, in the interest of
information exchange. The U.S. Government assumes no liability for the contents or use thereof.
TECHNICAL REPORT STANDARD TITLE PAGE
1. Report No. 2.Government Accession No. 3. Recipient’s Catalog No. FHWA NJ-2007-021
4. Title and Subtitle 5. Report Date
May 2008 Self Consolidating Concrete (Phase I & II) 6. Performing Organization Code Rutgers University
7. Author(s) 8. Performing Organization Report No. Hani Nassif, Kagan Aktas, Husam Najm, Nakin Suksawang, and Raymond El-Khoury
9. Performing Organization Name and Address 10. Work Unit No. Dept. of Civil & Environmental Engineering 11. Contract or Grant No. Center for Advanced Infrastructure & Transportation (CAIT)
Rutgers, The State University Piscataway, NJ 08854-8014 12. Sponsoring Agency Name and Address 13. Type of Report and Period Covered
Draft Report 01/01/05 – 12/31/2007
14. Sponsoring Agency Code
New Jersey Department of Transportation Federal Highway Administration PO 600 U.S. Department of Transportation
15. Supplementary Notes Trenton, NJ 08625 Washington, D.C.
16. Abstract This report summarizes the two-phase research on Self-Consolidating Concrete (SCC) in New Jersey. Phase I involves collecting actual field SCC mixes that were used for casting non-structural concrete components such as tee walls and noise walls. In addition, laboratory mixes were also made to evaluate the mechanical properties and the durability of SCC with various pozzolanic materials. In Phase II, the feasibility of using SCC in drilled shaft construction was evaluated on the new viaduct construction at the intersection of the GSP/I280 near Newark, NJ. SCC was used in the drilled shaft foundations of this project as part of the NJDOT’s SCC implementation plan with support from the Innovative Bridge Research and Construction Federal program. Fresh mix tests as well as visual inspection were performed; and specimens were collected to perform laboratory tests. All three shafts were instrumented with temperature sensors and cross-hole sonic logging (CSL) along the shaft length. Results from Phase I and II showed that SCC can be successfully made using viscosity modified admixture (VMA) or solely using super plasticizer (namely the polycarboxilate type) by properly adjusting the paste volume and coarse to fine aggregate ratios. SCC can also be made to equivalently match the mechanical properties and durability of high-performance concrete (HPC) by substituting Portland cement with pozzolans and other cementitious materials. Furthermore, based on the observations of the field mixes, more fundamental knowledge on SCC need to be disseminated to the contractor. It is recommended that the spread test be used in the field for classifying the fresh concrete properties of SCC as a screening test. For more quantitative results, it is recommended that the spread test be used in conjunction with other segregation tests, such as the J-ring test in order to determine the consistency of the mix.
17. Key Words 18. Distribution Statement Self-compacting concrete, segregation, mix design, mechanical properties, durability, drilled shafts
19. Security Classif (of this report)
21. No of Pages 20. Security Classif. (of this page) 22. Price
51 Unclassified Unclassified Form DOT F 1700.7 (8-69)
i

Acknowledgements
The authors would like to thank the New Jersey Department of Transportation (NJDOT) and staff for their help and support of this project: Edward S. Kondrath, Eileen Sheehy, Tony Chmiel (Retired), Fred Lovet, Jose Lopez (Retired), and Richard Dunne, for their help and assistance throughout the project. Also, the assistance of students Christopher Ericsson, Michael Boxer, Eric Rundstrom, Kyle Kelly, Wai Wah (Derek) Lam, Ufuk Ates, and Michael Yu are thankfully acknowledged. This study was funded by the New Jersey Department of Transportation (NJDOT) and in part by the Center for Advanced Infrastructure and Transportation (CAIT) at Rutgers, The State University of New Jersey. The findings expressed in this report are those of the authors and do not necessarily reflect the view of NJDOT.
ii
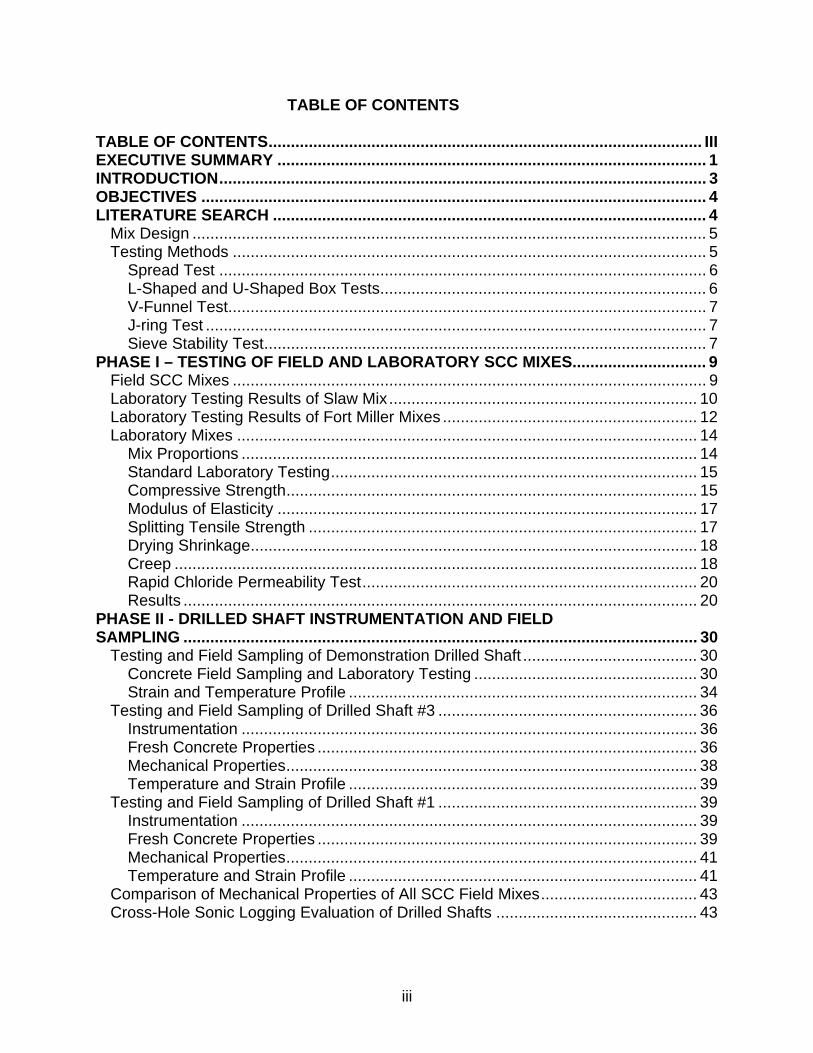
TABLE OF CONTENTS TABLE OF CONTENTS................................................................................................. III EXECUTIVE SUMMARY ................................................................................................ 1 INTRODUCTION............................................................................................................. 3 OBJECTIVES ................................................................................................................. 4 LITERATURE SEARCH ................................................................................................. 4
Mix Design ................................................................................................................... 5 Testing Methods .......................................................................................................... 5
Spread Test ............................................................................................................. 6 L-Shaped and U-Shaped Box Tests......................................................................... 6 V-Funnel Test........................................................................................................... 7 J-ring Test ................................................................................................................ 7 Sieve Stability Test................................................................................................... 7
PHASE I – TESTING OF FIELD AND LABORATORY SCC MIXES.............................. 9 Field SCC Mixes .......................................................................................................... 9 Laboratory Testing Results of Slaw Mix..................................................................... 10 Laboratory Testing Results of Fort Miller Mixes ......................................................... 12 Laboratory Mixes ....................................................................................................... 14
Mix Proportions ...................................................................................................... 14 Standard Laboratory Testing.................................................................................. 15 Compressive Strength............................................................................................ 15 Modulus of Elasticity .............................................................................................. 17 Splitting Tensile Strength ....................................................................................... 17 Drying Shrinkage.................................................................................................... 18 Creep ..................................................................................................................... 18 Rapid Chloride Permeability Test........................................................................... 20 Results ................................................................................................................... 20
PHASE II - DRILLED SHAFT INSTRUMENTATION AND FIELD SAMPLING ................................................................................................................... 30
Testing and Field Sampling of Demonstration Drilled Shaft ....................................... 30 Concrete Field Sampling and Laboratory Testing .................................................. 30 Strain and Temperature Profile .............................................................................. 34
Testing and Field Sampling of Drilled Shaft #3 .......................................................... 36 Instrumentation ...................................................................................................... 36 Fresh Concrete Properties ..................................................................................... 36 Mechanical Properties............................................................................................ 38 Temperature and Strain Profile .............................................................................. 39
Testing and Field Sampling of Drilled Shaft #1 .......................................................... 39 Instrumentation ...................................................................................................... 39 Fresh Concrete Properties ..................................................................................... 39 Mechanical Properties............................................................................................ 41 Temperature and Strain Profile .............................................................................. 41
Comparison of Mechanical Properties of All SCC Field Mixes................................... 43 Cross-Hole Sonic Logging Evaluation of Drilled Shafts ............................................. 43
iii

RECOMMENDATIONS AND CONCLUSIONS............................................................. 45 REFERENCES.............................................................................................................. 45
iv

LIST OF FIGURES Figure 1. Spread Test (taken from ASTM International 2002)........................................ 6 Figure 2. U-Shaped Box and L-Shaped Box (taken from ASTM
International) .................................................................................................... 7 Figure 3. V-Funnel (taken from ASTM International)...................................................... 8 Figure 4. J-Ring (taken from ASTM International) .......................................................... 8 Figure 5. Forney One-million lb Compression Testing Machine................................... 15 Figure 6. Elastic Modulus Test Using 3-LVDT Ring ..................................................... 17 Figure 7. Tinius Olsen Compression-Testing Machine................................................. 18 Figure 8. Drying Shrinkage Test Setups: a) Length Comparator, b) VWSG
Setup.............................................................................................................. 19 Figure 9. Creep Rig Test Set-up .................................................................................. 19 Figure 10. Rapid Chloride Permeability Test Setup ..................................................... 20 Figure 11. Comparison of Compressive Strength and a) Modulus of
Elasticity, b) Tensile Splitting Strength of Mix 1 and SCC1 Mixes.................. 23 Figure 12. Comparison of Compressive Strength and a) Modulus of
Elasticity, b) Tensile Splitting Strength of SCC Mixes .................................... 24 Figure 13. Comparison of Compressive Strength and a) Modulus of
Elasticity, b) Tensile Splitting Strength of SCC4 and SCC5 Mixes................. 25 Figure 14. Comparison of Compressive Strength and Modulus of
Elasticity of SCC and HPC Mixes containing (a) 20% F and (b) 5%SF 20%F ................................................................................................... 26
Figure 15. Comparison of Drying Shrinkage of All Mixes ............................................. 27 Figure 16. Results of Rapid Chloride Permeability Tests of All Mixes.......................... 28 Figure 17 Plot of (a) the Specific Creep and (b) Shrinkage of SCC
Containing 20% slag cement and 20% Class F Fly Ash................................. 29 Figure 18. Sensor Locations (Not to scale) .................................................................. 31 Figure 19. Model 4200 Concrete Embedment Gage.................................................... 32 Figure 20. Model 4200 Gage After Cage Placement.................................................... 32 Figure 21. Data Acquisition System ............................................................................. 33 Figure 22. Failure Type of Demonstration Shaft Concrete Under
Compression .................................................................................................. 33 Figure 23. Top View of 6 x 12 inch Test Specimen ...................................................... 34 Figure 24. Strain Profile of the Demonstration Shaft .................................................... 35 Figure 25. Temperature Profile of the Demonstration Shaft ......................................... 35 Figure 26. Drilled Shaft #3............................................................................................ 37 Figure 27. Close-up View of the Sensors in Drilled Shaft #3........................................ 37 Figure 28. Slump Flow Test ......................................................................................... 38 Figure 29. Slump Flow ................................................................................................. 38 Figure 30. J-Ring Flow Test ......................................................................................... 38 Figure 31. J-Ring Flow Measurement .......................................................................... 38 Figure 32. L-Box Test................................................................................................... 38 Figure 33. L-Box Test Measurement (h2) ..................................................................... 38 Figure 34. Strain Profile in Drilled Shaft #3 .................................................................. 40 Figure 35 Temperature Record in Drilled Shaft #3........................................................ 40 Figure 36. Strain Profile in Drilled Shaft #1 .................................................................. 42
v
Figure 37. Temperature Profile in Drilled Shaft #1 ....................................................... 42 Figure 38. Comparison of Compressive Strength of Field Mixes ................................. 43 Figure 39. Comparison of Splitting Tensile Strength of Field Mixes ............................. 44 Figure 40. Comparison of Modulus Elasticity of Field Mixes ........................................ 44 Figure 41 – Typical CSL for Drilled Shaft B3 (CHL tests performed by
Olson Instruments) ......................................................................................... 49
vi

LIST OF TABLES
Table 1 - Mix Proportions of Field SCC Mixes................................................................. 9 Table 2 - Compressive Strength (psi) (ASTM C39) for SLAW (4/1/04) SCC
Mix.................................................................................................................. 10 Table 3 - Tensile Splitting Strength (psi) (ASTM C496) for SLAW (4/1/04)
SCC Mix ......................................................................................................... 10 Table 4 - Rapid Chloride Permeability (Coulombs) (ASTM C1202) for
SLAW (4/1/04) SCC Mix................................................................................. 11 Table 5 - Elastic Modulus (ksi) (ASTM C469) for SLAW (4/1/04) SCC Mix................... 11 Table 6 - Poisson’s Ratio for SLAW (4/1/04) SCC Mix.................................................. 11 Table 7 - Average Length Change (ASTM C157) for SLAW (4/1/04) SCC
Mix.................................................................................................................. 12 Table 8 - Compressive Strength (psi) (ASTM C39) for Fort Miller Mixes....................... 12 Table 9 - Splitting Tensile Strength (psi) (ASTM C496) for Fort Miller
Mixes.............................................................................................................. 13 Table 10 - Elastic Modulus (ksi) (ASTM C469) for Fort Miller Mixes ............................. 13 Table 11 - Rapid Chloride Permeability (Coulombs) (ASTM C1202) for
Fort Miller Mixes............................................................................................. 13 Table 12 - Average Length Change (%) (ASTM C157) for fort Miller Mixes.................. 13 Table 13 - Mix Proportions and Fresh Concrete Properties .......................................... 16 Table 14 - Summary of Laboratory Tests for SCC ........................................................ 16 Table 15 - Comparison of Mechanical Properties of Laboratory Mixes ......................... 22 Table 16 - Compressive Strength of Demonstration Shaft Field Mix (psi) ..................... 30 Table 17 - Sensor Locations ......................................................................................... 31 Table 18 - Fresh Concrete Tests Performed on Concrete for Drilled Shaft
#3 ................................................................................................................... 36 Table 19 - Mechanical Properties of Concrete from Drilled Shaft #3............................. 39 Table 20 - Fresh Concrete Tests Performed on Concrete for Drilled Shaft
#1 ................................................................................................................... 41 Table 21 - Mechanical Properties of Concrete from Drilled Shaft #1............................. 41 Table 22 – Summarized results of CSL Testing for Demo Drilled Shaft #1
on I280 Interchange (CHL tests performed by Olson Instruments) ................ 48 Table 23 – Summarized results of CSL Testing for Demo Drilled Shaft B3
on I280 Interchange (CHL tests performed by Olson Instruments) ................ 48 Table 24 – Summarized results of CSL Testing for Demo Drilled Shaft P1
on I280 Interchange (CSL tests performed by Olson Instruments) ................ 50 Table 25 – Summarized results of CSL Testing for Demo Drilled Shaft P1
and P2 on I280 Interchange (CSL tests performed by Olson Instruments) ................................................................................................... 50
Table 26 – Crosshole Sonic Logging (CSL) Condition Rating Criteria (CHL tests performed by Olson Instruments) .......................................................... 51
vii
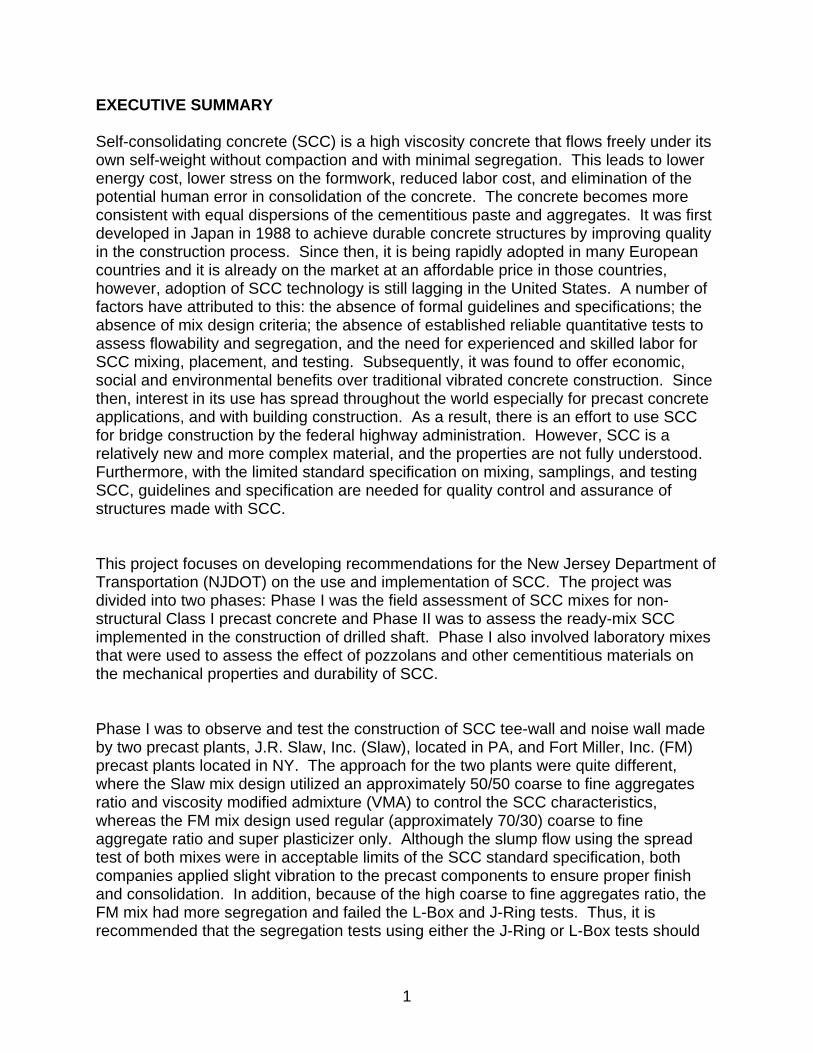
EXECUTIVE SUMMARY Self-consolidating concrete (SCC) is a high viscosity concrete that flows freely under its own self-weight without compaction and with minimal segregation. This leads to lower energy cost, lower stress on the formwork, reduced labor cost, and elimination of the potential human error in consolidation of the concrete. The concrete becomes more consistent with equal dispersions of the cementitious paste and aggregates. It was first developed in Japan in 1988 to achieve durable concrete structures by improving quality in the construction process. Since then, it is being rapidly adopted in many European countries and it is already on the market at an affordable price in those countries, however, adoption of SCC technology is still lagging in the United States. A number of factors have attributed to this: the absence of formal guidelines and specifications; the absence of mix design criteria; the absence of established reliable quantitative tests to assess flowability and segregation, and the need for experienced and skilled labor for SCC mixing, placement, and testing. Subsequently, it was found to offer economic, social and environmental benefits over traditional vibrated concrete construction. Since then, interest in its use has spread throughout the world especially for precast concrete applications, and with building construction. As a result, there is an effort to use SCC for bridge construction by the federal highway administration. However, SCC is a relatively new and more complex material, and the properties are not fully understood. Furthermore, with the limited standard specification on mixing, samplings, and testing SCC, guidelines and specification are needed for quality control and assurance of structures made with SCC. This project focuses on developing recommendations for the New Jersey Department of Transportation (NJDOT) on the use and implementation of SCC. The project was divided into two phases: Phase I was the field assessment of SCC mixes for non-structural Class I precast concrete and Phase II was to assess the ready-mix SCC implemented in the construction of drilled shaft. Phase I also involved laboratory mixes that were used to assess the effect of pozzolans and other cementitious materials on the mechanical properties and durability of SCC. Phase I was to observe and test the construction of SCC tee-wall and noise wall made by two precast plants, J.R. Slaw, Inc. (Slaw), located in PA, and Fort Miller, Inc. (FM) precast plants located in NY. The approach for the two plants were quite different, where the Slaw mix design utilized an approximately 50/50 coarse to fine aggregates ratio and viscosity modified admixture (VMA) to control the SCC characteristics, whereas the FM mix design used regular (approximately 70/30) coarse to fine aggregate ratio and super plasticizer only. Although the slump flow using the spread test of both mixes were in acceptable limits of the SCC standard specification, both companies applied slight vibration to the precast components to ensure proper finish and consolidation. In addition, because of the high coarse to fine aggregates ratio, the FM mix had more segregation and failed the L-Box and J-Ring tests. Thus, it is recommended that the segregation tests using either the J-Ring or L-Box tests should
1

be added and performed in conjunction with the spread test to determine the fresh concrete properties of SCC. In addition to the plant mixes, laboratory SCC mixes were made to determine the effect of pozzolans and other cementitious materials on SCC. Results showed that the mechanical properties and durability of SCC can be enhanced by adding pozzolanic materials and/or slag cement. It is recommended that pozzolanic materials be used in SCC. It is also suggested that the coarse to fine aggregate ratio to be controlled at 50/50 to avoid segregation. During Phase II of the project field applicability of SCC mixes in drilled shaft applications was thoroughly tested. Three out of five shafts were instrumented with strain and temperature gages to monitor the behavior of SCC during hydration and in curing phases. Fresh concrete testing was also performed to evaluate existing testing procedures and identify those that are reliable and easily implementable under field conditions. Moreover, concrete cylinder specimens were taken to verify the design strength requirements. Finally cross-hole sonic logging tests were performed to test the continuity and integrity of the drilled shaft profile and cross section. Performance of the SCC obtained from the drilled shafts in Phase II was found to be satisfactory. All mixes including the mix from the demonstration shaft passed the 28-day requirements. The only problem that was encountered was during the pour of the demonstration shaft. Segregation due to high slump flow was observed in the cylinders during testing which adversely affected the strength of this mix. This problem was overcome in the following drilled shaft pours by restricting the slump flow requirement to between 24 and 28 inches. Cross Seismic Logs (CSL) data showed homogenous concrete in the shaft with no defects and field tests showed that the mix was within the spread slump test and J-ring test acceptability criteria. However, SCC in drilled shaft should not be dropped from heights more than 6 feet. For higher drops, a tremie should be used to avoid segregation. Mechanical properties of the SCC obtained from those shafts were observed to be identical. Test results from the cross-hole sonic logging indicated that there are no air pockets in any of the shafts. This means that the SCC supplied was able to flow through the dense reinforcement layers within the drilled shaft cage. Two out of the five fresh concrete tests were found to be suitable for quality control testing on site. These tests are “C1621/C1621M-06 Standard Test Method for Passing Ability of Self-Consolidating Concrete by J-Ring” and “C1611/C1611M-05 Standard Test Method for Slump Flow of Self-Consolidating Concrete”. These tests are easy to apply in the field and more importantly together they can test the flowability as well as the passing ability of concrete supplied to the site.
2

INTRODUCTION SCC can be defined as concrete that does not need compaction or vibration. It is a concrete that has high flowability without segregation. The material is able to flow under its self-weight into corners of formwork and through closely spaced reinforcement without vibration or compaction, leading to a more industrialized production process, reducing labor cost and eliminating potential human error from vibrating the concrete. In consequence, the concrete structure becomes more consistent and reliable. Hence, the use of SCC is spreading rapidly around the world, especially in Japan and Europe. However, the use of SCC in the United States is only limited to precast plants in a few states. Part of the reason is due to the limited knowledge and experience with the new material, lack of quality control and assurance, and no standard specifications for testing SCC. There is more experience with antiwashout underwater concrete, Antiwashout concrete is cast underwater and segregation is strictly inhibited by adding a large amount of a viscous agent made of water-soluble polymer that prevents the cement particles from dispersing into the surrounding water. However, it was found that antiwashout concrete is not applicable to structures in the air for two reasons: First, entrapped air bubbles could not be eliminated due to the high viscosity, and second, compaction in the confined areas around reinforcing bars was difficult. Therefore, SCC was developed and investigated for improved workability and performance. Fresh concrete can easily attain high flowability by simply increasing the water-to-binder ratio (w/b), however, this will lead to segregation and lower durability. In order to successfully develop SCC for highway structures, mineral and chemical admixtures such as pozzolans, high-range water-reducing agent (HRWRA), and viscosity-modifying admixture (VMA) need to be added to the mix design. Moreover, the absolute volume of coarse aggregates used in the mixture needs to be limited to reduce interparticle friction that prevent SCC from flowing under its own weight without segregation [5,6]. Thus, more volume of cement paste is needed to balance the reduced volume of coarse aggregates, leading to higher material cost and higher shrinkage. There are different methods to produce SCC and we need to evaluate these methods for its proper use in construction projects in New Jersey. Although, the Rutgers team has identified a number of SCC mixes and has produced them in the Laboratory, there is a need to understand the behavior of each mix under the conditions it is being used. Before SCC can be incorporated in NJDOT projects, mix designs and specifications need to be developed. These items should reflect the state-of-art in design of SCC while incorporating factors specific to New Jersey and the availability of SCC producers and need in various projects. Factors to be considered in developing specifications include: aggregate gradation requirements, maximum volume of coarse aggregates, appropriate filler materials and other admixtures, flow and segregation testing methods, durability, and material handling and placement requirements. The following section describes the various objectives and scope of the project based on the discussion and
3

pre-project meeting held at NJDOT with the presence of NJDOT Research Bureau and Materials Division. OBJECTIVES The project consists of two Phases: Phase I – Testing of Field and Laboratory SCC mixes and Phase II – Instrumentation and Field Testing of SCC Drilled Shaft Application. The main objectives of Phase I of this project are:
1. Identify existing SCC mix designs that have been implemented for both cast-in-place and pre-cast applications in New Jersey and other States in the region including Pennsylvania, Virginia, and New York.
2. Determine the available methods currently used to produce SCC and their effects on the mechanical properties and durability for developing and making SCC mixes, i.e., the use of new generation superplasticizers and gradation only versus the use of a combination of new generation superplasticizer and VMA.
3. Develop and administer a testing program to assure that the mix designs developed meet all the standard specifications of structural concrete and its long-term durability including: strength, air content, drying shrinkage, freeze-thaw, rapid chloride permeability, and scaling as well as curing methods. The testing procedures might vary depending on the type of the SCC mix and its field application as was directed by NJDOT.
4. Coordinate efforts with the local concrete producers to make sure that the selected SCC mixes can be produced in the plant and hauled to construction sites similar to regular concrete.
The main objectives of Phase II of this project are: 1. Construct a 30 ft long dummy shaft to identify potential problems of using SCC in
drilled shafts and to evaluate acceptable mix design and testing methods. 2. Based on Task 1, adjust mix design and construction methods, if necessary, to
properly use SCC in remaining shafts. 3. Instrument drilled shaft cages with strain and temperature sensors and collect
samples for field and libratory tests. 4. Perform field tests on fresh concrete and laboratory tests on hardened
specimens. 5. Evaluate the feasibility of SCC for drilled shaft construction.
LITERATURE SEARCH The research team initiated efforts to find the most relevant literature as the first step in the development process to assemble and review current practice, technical literature,
4

research findings of recently completed and ongoing projects, and procedures from domestic and foreign sources. The literature review conducted revealed that there is no clear definition of SCC in the United States. However, according to preliminary work by ASTM C09.47, SCC should have a fluidity that allows self-consolidation without external energy; remain homogeneous in the form during and after the placement; and that it flows easily through reinforcement. In order to achieve these characteristics, the volume of coarse aggregates need to be reduced and limited, while the paste content needs to be increased, and the paste viscosity should be increased to reduce the risk of segregation. The following section is a summary of the literature review of SCC mixes designs and testing methods currently being used in Japan and Europe and by researchers in the field: Mix Design There is a large body of literature related to SCC mix design methods and the development of SCC mixes incorporating various VMA and HRWRA [6, 9–20]. Because the increase in the volume of paste content and the associate cost, most of the mix designs incorporate industrial byproducts such as limestone filler to reduce the amount of Portland cement in the mix design of SCC. There have also been studies addressing durability issues in SCC or comparing the mechanical properties of SCC to normal concrete [8, 14, 21, 22]. However, these studies are still limited and do not address all of the durability issues for highway structures. Moreover, most of these mix designs are based on Japanese and European experiences. SCC mix designs using raw material in United States has not been used. Testing Methods As mentioned in the definition, SCC does not require compaction. Therefore, the rheological characteristics of SCC are very important since its consolidation depends on its rheological performance. In ordinary concrete, adequate slump in conjunction with good consolidation practice will yield a dense concrete structure with few air voids. The external forces due to vibration compensate for the variations in plastic concrete and therefore the rheology of concrete could be ignored. Hence only the slump test is performed for testing fresh ordinary concrete. Whereas in SCC, the rheological characteristic cannot be ignored since the concrete need to meet the certain rheological requirements. The plastic concrete is generally described as Bingham fluid where the concrete behavior is characterized by its shear yield stress and plastic viscosity. For SCC, the shear yield stress has to be lower than ordinary concrete in order for the concrete to self-compact. The rheology of concrete could be measured using a concrete rheometer. A concrete rheometer measures the shear yield stress and viscosity of concrete. The problem with
5
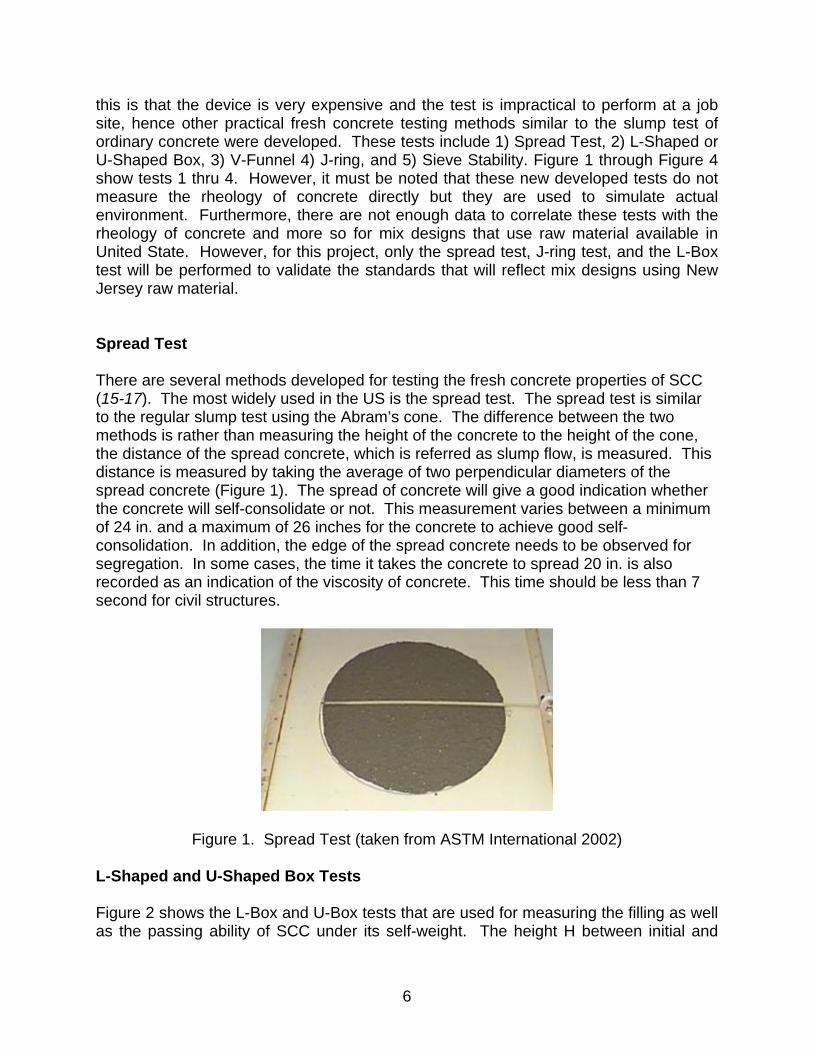
this is that the device is very expensive and the test is impractical to perform at a job site, hence other practical fresh concrete testing methods similar to the slump test of ordinary concrete were developed. These tests include 1) Spread Test, 2) L-Shaped or U-Shaped Box, 3) V-Funnel 4) J-ring, and 5) Sieve Stability. Figure 1 through Figure 4 show tests 1 thru 4. However, it must be noted that these new developed tests do not measure the rheology of concrete directly but they are used to simulate actual environment. Furthermore, there are not enough data to correlate these tests with the rheology of concrete and more so for mix designs that use raw material available in United State. However, for this project, only the spread test, J-ring test, and the L-Box test will be performed to validate the standards that will reflect mix designs using New Jersey raw material. Spread Test There are several methods developed for testing the fresh concrete properties of SCC (15-17). The most widely used in the US is the spread test. The spread test is similar to the regular slump test using the Abram’s cone. The difference between the two methods is rather than measuring the height of the concrete to the height of the cone, the distance of the spread concrete, which is referred as slump flow, is measured. This distance is measured by taking the average of two perpendicular diameters of the spread concrete (Figure 1). The spread of concrete will give a good indication whether the concrete will self-consolidate or not. This measurement varies between a minimum of 24 in. and a maximum of 26 inches for the concrete to achieve good self-consolidation. In addition, the edge of the spread concrete needs to be observed for segregation. In some cases, the time it takes the concrete to spread 20 in. is also recorded as an indication of the viscosity of concrete. This time should be less than 7 second for civil structures.
Figure 1. Spread Test (taken from ASTM International 2002) L-Shaped and U-Shaped Box Tests Figure 2 shows the L-Box and U-Box tests that are used for measuring the filling as well as the passing ability of SCC under its self-weight. The height H between initial and
6
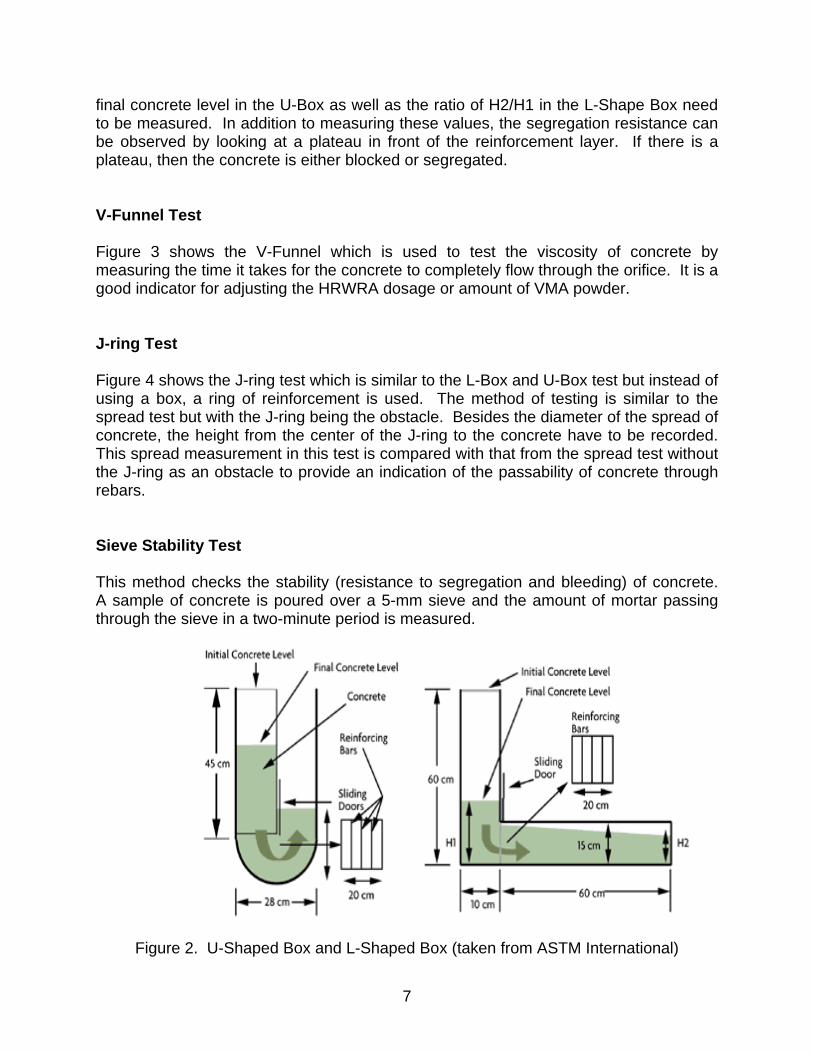
final concrete level in the U-Box as well as the ratio of H2/H1 in the L-Shape Box need to be measured. In addition to measuring these values, the segregation resistance can be observed by looking at a plateau in front of the reinforcement layer. If there is a plateau, then the concrete is either blocked or segregated. V-Funnel Test Figure 3 shows the V-Funnel which is used to test the viscosity of concrete by measuring the time it takes for the concrete to completely flow through the orifice. It is a good indicator for adjusting the HRWRA dosage or amount of VMA powder. J-ring Test Figure 4 shows the J-ring test which is similar to the L-Box and U-Box test but instead of using a box, a ring of reinforcement is used. The method of testing is similar to the spread test but with the J-ring being the obstacle. Besides the diameter of the spread of concrete, the height from the center of the J-ring to the concrete have to be recorded. This spread measurement in this test is compared with that from the spread test without the J-ring as an obstacle to provide an indication of the passability of concrete through rebars. Sieve Stability Test This method checks the stability (resistance to segregation and bleeding) of concrete. A sample of concrete is poured over a 5-mm sieve and the amount of mortar passing through the sieve in a two-minute period is measured.
Figure 2. U-Shaped Box and L-Shaped Box (taken from ASTM International)
7

Figure 3. V-Funnel (taken from ASTM International)
Figure 4. J-Ring (taken from ASTM International)
8

PHASE I – TESTING OF FIELD AND LABORATORY SCC MIXES Field SCC Mixes A total of three NJDOT SCC mixes were sampled and tested for compressive strength, modulus of elasticity, tensile splitting strength, drying shrinkage, and rapid chloride permeability tests. One of the SCC mixes was sampled at the J.R. Slaw, Inc. (Slaw) precast plant in Pennsylvania. The other two SCC mixes were sampled at the Fort Miller, Inc. (FM) precast plant in New York. The two companies used different approaches on developing the SCC mixes. The Slaw mix was based on a more conventional approach using a combination of VMA and superplasticizer as well as lowering the coarse to fine aggregates ratio such that approximately equal amount of stone and sand were used in the mix design to attain SCC characteristic. The Slaw mix also contained a 20 percent Portland cement replacement by weight of slag cement. FM mixes were similar to a regular concrete mix design with high coarse to fine aggregates ratio but with high amount of superplasticizer to attain SCC characteristic. One of the FM mixes contained 30 percent Portland cement replacement by weight of Class F fly ash. Table 1 summarizes the mix proportions of the field SCC mixes.
Table 1 - Mix Proportions of Field SCC Mixes
Mixtures Identification Raw Material
(lb/yd3) Slaw FM1 FM2 PC 564 801 524 SF -- -- -- F -- -- 224 SL 143 -- -- Total Cement. Material 707 801 748
1450 (52%)
1783 (63%)
1729 (60%)CA
1350 (48%)
1033 (37%)
1136 (40%)FA
Water 250 288 262 w/CM 0.35 0.36 0.35 SP (oz) 55.9 105 45 AEA (oz) 8.0 12.4 10.3 VMA (oz) 14.0 -- -- Slump (in) 25 24 24 Air (%) 6.0 5.00 5.75
9

Laboratory Testing Results of Slaw Mix
Table 2 and Table 3 summarize the compressive strength and tensile splitting strength of the Slaw mix, respectively. The Slaw mix has very high compressive and tensile splitting strength of 8,700 psi and 771 psi at 28-day, respectively. Table 4 summarizes the rapid chloride results. Overall, the mix had moderate to high chloride ion penetrability with the lowest average charge passed of 3292 Coulombs. This value is higher than the NJDOT specification for HPC with the maximum permissible charge passed of 2000 Coulombs. The modulus of elasticity and Poisson ratio were also recorded and tabulated in Table 5 and Table 6. As observed in Table 7, the Slaw mix also has very high free drying shrinkage values with a 7-day drying shrinkage value of 0.044%. The 90-day drying shrinkage is also high with a value of 0.079%. It is expected that this mix could lead to a potential cracking problem if the structural components are restrained. Results related to strength and durability are obtained from tests performed at the Rutgers Concrete Testing Laboratory.
Table 2 - Compressive Strength (psi) (ASTM C39) for SLAW (4/1/04) SCC Mix
Day Specimen 1 Specimen 2 Specimen 3 Average 1 4576 4775 4814 4722 3 5889 6525 6525 6313 7 6366 7401 7182 6983 14 8833 9390 8117 8780 28 8754 8196 9151 8700 56 9470 8515 9032 9006 90 8515 9470 8913 8966
Table 3 - Tensile Splitting Strength (psi) (ASTM C496) for SLAW (4/1/04) SCC Mix
Day Specimen 1 Specimen 2 Specimen 3 Average 1 581 511 527 540 3 623 623 471 572 7 643 577 621 613 14 657 627 617 633 28 756 782 776 771 56 756 786 796 779 90 N/A 786 796 791
10
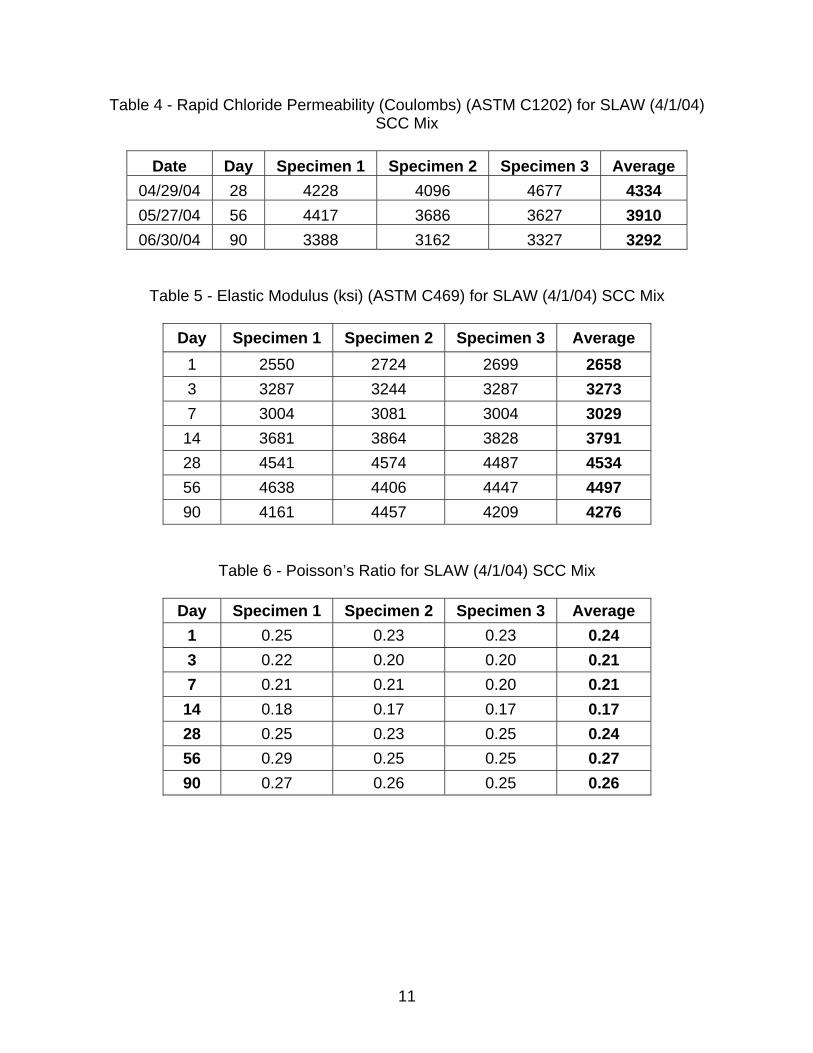
Table 4 - Rapid Chloride Permeability (Coulombs) (ASTM C1202) for SLAW (4/1/04) SCC Mix
Date Day Specimen 1 Specimen 2 Specimen 3 Average
04/29/04 28 4228 4096 4677 4334 05/27/04 56 4417 3686 3627 3910 06/30/04 90 3388 3162 3327 3292
Table 5 - Elastic Modulus (ksi) (ASTM C469) for SLAW (4/1/04) SCC Mix
Day Specimen 1 Specimen 2 Specimen 3 Average 1 2550 2724 2699 2658 3 3287 3244 3287 3273 7 3004 3081 3004 3029
14 3681 3864 3828 3791 28 4541 4574 4487 4534 56 4638 4406 4447 4497 90 4161 4457 4209 4276
Table 6 - Poisson’s Ratio for SLAW (4/1/04) SCC Mix
Day Specimen 1 Specimen 2 Specimen 3 Average 0.25 0.23 0.23 1 0.24 0.22 0.20 0.20 3 0.21 0.21 0.21 0.20 7 0.21 0.18 0.17 0.17 14 0.17 0.25 0.23 0.25 28 0.24 0.29 0.25 0.25 56 0.27 0.27 0.26 0.25 90 0.26
11
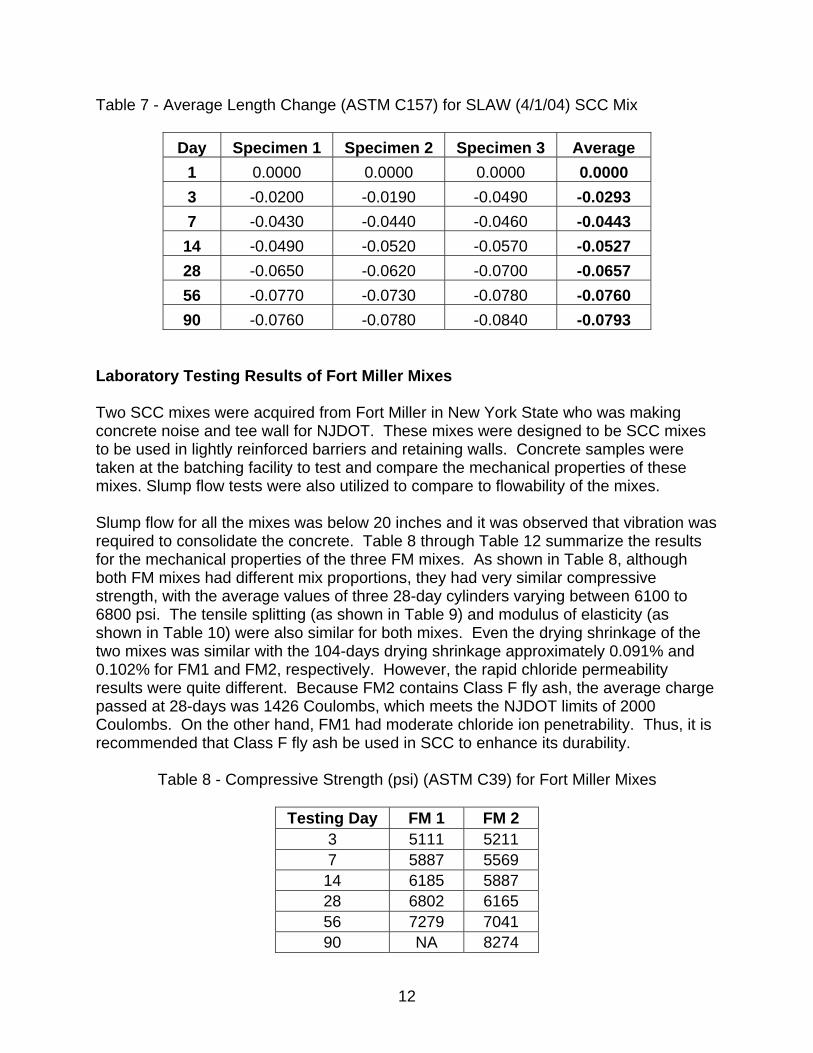
Table 7 - Average Length Change (ASTM C157) for SLAW (4/1/04) SCC Mix
Day Specimen 1 Specimen 2 Specimen 3 Average 0.0000 0.0000 0.0000 1 0.0000 -0.0200 -0.0190 -0.0490 3 -0.0293 -0.0430 -0.0440 -0.0460 7 -0.0443 -0.0490 -0.0520 -0.0570 14 -0.0527 -0.0650 -0.0620 -0.0700 28 -0.0657 -0.0770 -0.0730 -0.0780 56 -0.0760 -0.0760 -0.0780 -0.0840 90 -0.0793
Laboratory Testing Results of Fort Miller Mixes Two SCC mixes were acquired from Fort Miller in New York State who was making concrete noise and tee wall for NJDOT. These mixes were designed to be SCC mixes to be used in lightly reinforced barriers and retaining walls. Concrete samples were taken at the batching facility to test and compare the mechanical properties of these mixes. Slump flow tests were also utilized to compare to flowability of the mixes. Slump flow for all the mixes was below 20 inches and it was observed that vibration was required to consolidate the concrete. Table 8 through Table 12 summarize the results for the mechanical properties of the three FM mixes. As shown in Table 8, although both FM mixes had different mix proportions, they had very similar compressive strength, with the average values of three 28-day cylinders varying between 6100 to 6800 psi. The tensile splitting (as shown in Table 9) and modulus of elasticity (as shown in Table 10) were also similar for both mixes. Even the drying shrinkage of the two mixes was similar with the 104-days drying shrinkage approximately 0.091% and 0.102% for FM1 and FM2, respectively. However, the rapid chloride permeability results were quite different. Because FM2 contains Class F fly ash, the average charge passed at 28-days was 1426 Coulombs, which meets the NJDOT limits of 2000 Coulombs. On the other hand, FM1 had moderate chloride ion penetrability. Thus, it is recommended that Class F fly ash be used in SCC to enhance its durability.
Table 8 - Compressive Strength (psi) (ASTM C39) for Fort Miller Mixes
Testing Day FM 1 FM 2
3 5111 5211 7 5887 5569
14 6185 5887 28 6802 6165 56 7279 7041 90 NA 8274
12

Table 9 - Splitting Tensile Strength (psi) (ASTM C496) for Fort Miller Mixes
Testing Day FM 1 FM 2 3 487 472 7 531 597
14 587 597 28 621 666 56 657 703 90 NA 682
Table 10 - Elastic Modulus (ksi) (ASTM C469) for Fort Miller Mixes
Testing Day FM 1 FM 2 3 3186 3566 7 3633 3799
14 NA 3827 28 4102 3975 56 4115 3947 90 NA 4508
Table 11 - Rapid Chloride Permeability (Coulombs) (ASTM C1202) for Fort Miller Mixes
Testing Day FM 1 FM 2 28 NA 1426 56 2504 959 90 NA 752
Table 12 - Average Length Change (%) (ASTM C157) for fort Miller Mixes
Testing Day FM 1 FM 2 0 0.0000 0.0000 3 -0.0063 -0.0080 7 -0.0226 -0.0423
14 -0.0433 -0.0573 56 -0.0853 -0.0780 104 -0.0910 -0.1015
13

Laboratory Mixes Because of the limited SCC mixes available for NJDOT, the research team, in coordination with NJDOT Staff, worked with two concrete producers that are approved by NJDOT to develop trial mixes that reflected local resources readily available in New Jersey. The laboratory trial mixes included a minimum of four different SCC mixes include 1) Class A SCC using VMA, 2) Class A SCC using no VMA, 3) Class B SCC using VMA and 4) Class B SCC using no VMA. Several trial mixes of SCC were tested for compressive and modulus results.
Mix Proportions A total of 8 mixes, consisting of one normal (or conventional) concrete, five SCC, and two HPC mixes, with w/b ratios ranging from 0.39 to 0.35 were made. This comparison of mix performance from each type of concrete allows the understanding of SCC in relation to HPC and Normal concrete. Table 13 shows the mix proportions of all mixes. Normal Concrete (NC) mix represented the conventional concrete. Mix 1 represented the conventional concrete with 7000-psi compressive strength. SCC1 through SCC5 represented the five SCC mixes, and HPC1 and HPC2 represent the HPC mixes. All mixes had equal w/b ratio of 0.39, with the exception of SCC5, which had a w/b ratio of 0.35. The varying parameters between these mixes were the cementitious materials. Mix 1 contained only Portland Cement (PC); whereas, HPC1 and HPC2 mixes contained 20 % F and a combination of 5 % SF and 20 % F, respectively. For the SCC mixes, SCC1, SCC2, SCC3, and SCC4 had similar mix proportions with equal amounts of water, CA, and FA content, but they had varying cementitious materials. SCC1 contained only PC, whereas, SCC2, SCC3, and SCC4 contained 20 % F, a combination of 5 % SF with 20 % F, and 20 % SL, respectively. Additionally, the volume of the chemical admixture was adjusted for each mix to attain SCC characteristics. SCC5 was obtained from a precast plant as part of a field preliminary study for the New Jersey Department of Transportation (NJDOT) to deploy SCC in noise walls. SCC5 used different CA type and contained 20% Slag (SL) and VMA and color pigment was added to the mix. The mixing procedure followed a modified ASTM C192 to account for the mineral and chemical admixtures as required by the manufacturer of the mineral and chemical admixture that required longer mixing time than conventional concrete. The mixing was performed in the laboratory using an electric drum mixer. Modifications to the ASTM C192 specification include: longer mixing time (rather than using the standard 3, 3, and 2 minutes mixing intervals, the mixing time was altered to 4, 4, and 5 minutes mixing intervals). The extended time was needed for the SL, SF, and F to evenly disperse in the concrete as well as for dispersing the SP, which was added during the final 5 minutes interval. Standard fresh concrete tests, such as the slump (ASTM C143) and air content test (ASTM C173), were also performed. However, for SCC, rather than
14

using the standard ASTM slump test, a spread test was used as shown in Figure 1. The specimens were fabricated using a vibrating table for the Mix 1 and HPC mixes according to ASTM C192. For the SCC mixes, the concrete was simply poured into the molds without any consolidation. The specimens were sealed with a polythene sheet to minimize the loss of moisture.
Standard Laboratory Testing The tests performed for SCC in this project are shown in Table 14. The concrete laboratory is fully equipped to test both normal and high performance concrete as well as large-scale structural concrete. Brief explanations for the tests are as follows: Compressive Strength The compression test was performed in accordance to ASTM C39 using the Forney-1 million pound compression-testing machine (Figure 5). The machine is equipped with three dial indicators for use at different loading ranges. In addition to the dial indicators, a 500-kip digital load cell was used to collect the data automatically through a computer-based data acquisition system. Compressive strength tests were conducted on all mixes at the age of 1, 3, 7, 14, 28, 56, and 90 days. All tests were performed using 4 × 8 in. cylinders that were moist cured in a water tank. For the compressive strength, three cylinders were loaded on each testing day in a compression machine. The test was performed in accordance with ASTM C39. The specimens’ plainness was achieved by using unbonded steel caps with neoprene inserts for both the top and bottom ends of the specimens. The unbonded steel caps were used in lieu of the capping compound, in order to speed up the testing process.
Figure 5. Forney One-million lb Compression Testing Machine
15

Table 13 - Mix Proportions and Fresh Concrete Properties
Raw Material Mixtures Identification (lb/yd3) Mix 1 SCC1 SCC2 SCC3 SCC4 SCC5 HPC1 HPC2
OPC 806 870 696 652 608 566 646 605 SF -- -- -- 44 -- -- -- 41 F -- -- 174 174 -- -- 161 161 SL -- -- -- -- 260 144 -- -- CA 1727 1381 1381 1381 1381 1453 1727 1727 FA 1185 1496 1496 1496 1496 1354 1185 1185 Water 314 340 340 340 340 250 314 314 w/b 0.39 0.39 0.39 0.39 0.39 0.35 0.39 0.39 SP (oz) 60.8 146.8 100.1 120.1 68.4 80.4 38.4 57.6 AEA (oz) 2.4 1.3 2.0 1.3 1.3 11.6 12.9 12.9 VMA (oz) -- -- -- -- -- 20 -- -- Slump (in) 5.0 -- -- -- -- - 3.2 3.1 Slump Flow(in) -- 27.3 24.5 24.8 25.3 24.8 -- -- Air (%) 6 7 6 5 6 6 5 5
Table 14 - Summary of Laboratory Tests for SCC
Test Routine of Applicable Curing Conditions
Age of Concrete at Test, days
Tests ASTM Standard
1. Slump and Slump Flow
1 per batch C143 and NJDOT C4 for Slump Flow
None 0, fresh
2. Fresh Air Content 1 per batch C231 None 0, fresh 3. Unit Weight 1 per batch C138 None 0, fresh 4. Compressive Strength
2 per batch & 4 per mix
C39 3, 28 day wet 1, 3, 7, 14, 28, 56,90
5. Split Cylinder 4 per mix C496 28 day wet 1, 3, 7, 14, 28, 56,90 Tensile Strength
6. Modulus of Elasticity
3 per mix C469 28 day wet 1, 3, 7, 14, 28, 56,90
7. Air Dry Shrinkage
3 per mix C490, C157 1 day wet 1 to 90
8. Air Void Analysis 1 per mix C457 28 day wet NA 9. Restrained Shrinkage
1 or 2 per mix
None 1 day wet 1 to 90
10. Freeze Thaw 3 per mix C666 14 day wet 14 14 day wet plus
14 day dry
11. Scaling 1 per mix C672 28 12. Rapid Chloride 3 per mix C1202 28, 56, and
90 days 28, 56, and
90 Permeability
16

Modulus of Elasticity The elastic modulus is performed in accordance to ASTM C469 using a compressometer. The compressometer is equipped with digital dial gage that has an accuracy of 0.00005 in., which is sufficient for this test. The modulus of elasticity test was conducted in accordance with ASTM C469. Unlike the compression test, rather than using unbonded steel caps, the top and bottom of the cylinder were covered with capping compound. The strain was measured using the average of three linear variable differential transformers (LVDTs) that were attached to a compressometer (Figure 6).
Figure 6. Elastic Modulus Test Using 3-LVDT Ring Splitting Tensile Strength Splitting tensile strength is determined by splitting a 4 X 8 in. cylinder in accordance to ASTM C496 using the 400-kip Tinius Olsen compression-testing machine. The Tinius Olsen Compression machine (Figure 7) is used because it has longer head extension than the Forney 1-million pound compression machine. On each testing day, three 4 × 8 in. cylinders were loaded along the length in the compression machine. To avoid localized cracking and to ensure that the load is distributed uniformly, thin sheets of plywood with a width of 1 in. and thickness of 1/8 in. were placed between the top and bottom load bearings.
17

Figure 7. Tinius Olsen Compression-Testing Machine Drying Shrinkage Drying shrinkage of concrete is determined in accordance with ASTM C157 using a length comparator and/or vibrating wire strain gage (VWSG) embedded inside the concrete prism. Figure 8a and 8b illustrate the drying shrinkage measurements using length comparator and VWSG, respectively. The drying shrinkage specimens consisted of three 3 × 3 × 11 in. prisms with embedded studs at each end. The drying shrinkage was measured using a length comparator (a) where the length of the concrete (between the two embedded studs) was compared to a reference bar. After the concrete was cast, all specimens were carefully wrapped in plastic to avoid moisture loss. After 24 hours, the specimens were de-molded and stored in an environmental chamber with a controlled ambient temperature and relative humidity of 75oF and 50%, respectively. The drying shrinkage was measured at 1, 3, 7, 14, 28, 56, and 90 days using the length comparator. Creep Creep test is performed in accordance to ASTM C512 using spring loaded creep frame (creep rig). The concrete strain is measured by external vibrating wire strain gages. The external strain gages are instrumented on the specimens at three gage lines spaced uniformly around the periphery of the specimen. For each creep test, a total of 5 specimens are instrumented, 3 specimens are used for loading and the other 2 are used as control specimens. The vibrating wire strain gages are connected to two 96 channels data logger that record the strain value at every 10 minutes. The applied load is monitored with a 200 kip load cell that is also connected to the data logger. The creep test setup is illustrated in Figure 9.
18

(a)
(b)
Figure 8. Drying Shrinkage Test Setups: a) Length Comparator, b) VWSG Setup
Figure 9. Creep Rig Test Set-up
19
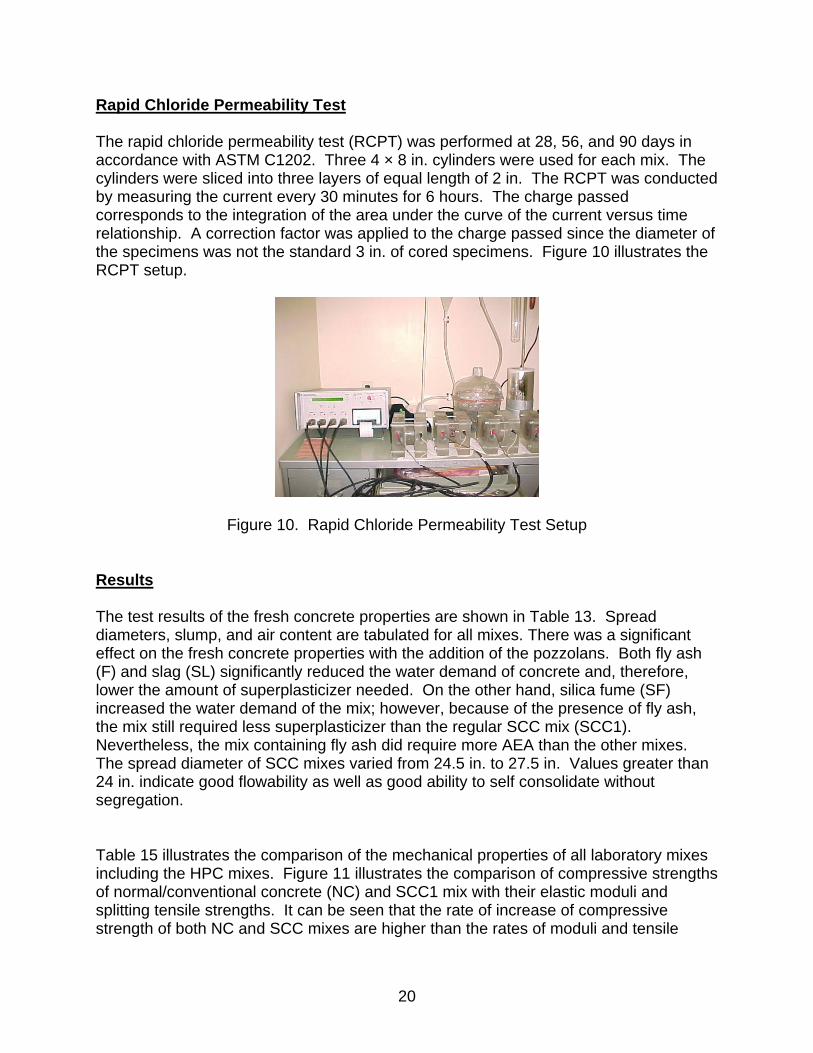
Rapid Chloride Permeability Test The rapid chloride permeability test (RCPT) was performed at 28, 56, and 90 days in accordance with ASTM C1202. Three 4 × 8 in. cylinders were used for each mix. The cylinders were sliced into three layers of equal length of 2 in. The RCPT was conducted by measuring the current every 30 minutes for 6 hours. The charge passed corresponds to the integration of the area under the curve of the current versus time relationship. A correction factor was applied to the charge passed since the diameter of the specimens was not the standard 3 in. of cored specimens. Figure 10 illustrates the RCPT setup.
Figure 10. Rapid Chloride Permeability Test Setup Results The test results of the fresh concrete properties are shown in Table 13. Spread diameters, slump, and air content are tabulated for all mixes. There was a significant effect on the fresh concrete properties with the addition of the pozzolans. Both fly ash (F) and slag (SL) significantly reduced the water demand of concrete and, therefore, lower the amount of superplasticizer needed. On the other hand, silica fume (SF) increased the water demand of the mix; however, because of the presence of fly ash, the mix still required less superplasticizer than the regular SCC mix (SCC1). Nevertheless, the mix containing fly ash did require more AEA than the other mixes. The spread diameter of SCC mixes varied from 24.5 in. to 27.5 in. Values greater than 24 in. indicate good flowability as well as good ability to self consolidate without segregation.
Table 15 illustrates the comparison of the mechanical properties of all laboratory mixes including the HPC mixes. Figure 11 illustrates the comparison of compressive strengths of normal/conventional concrete (NC) and SCC1 mix with their elastic moduli and splitting tensile strengths. It can be seen that the rate of increase of compressive strength of both NC and SCC mixes are higher than the rates of moduli and tensile
20

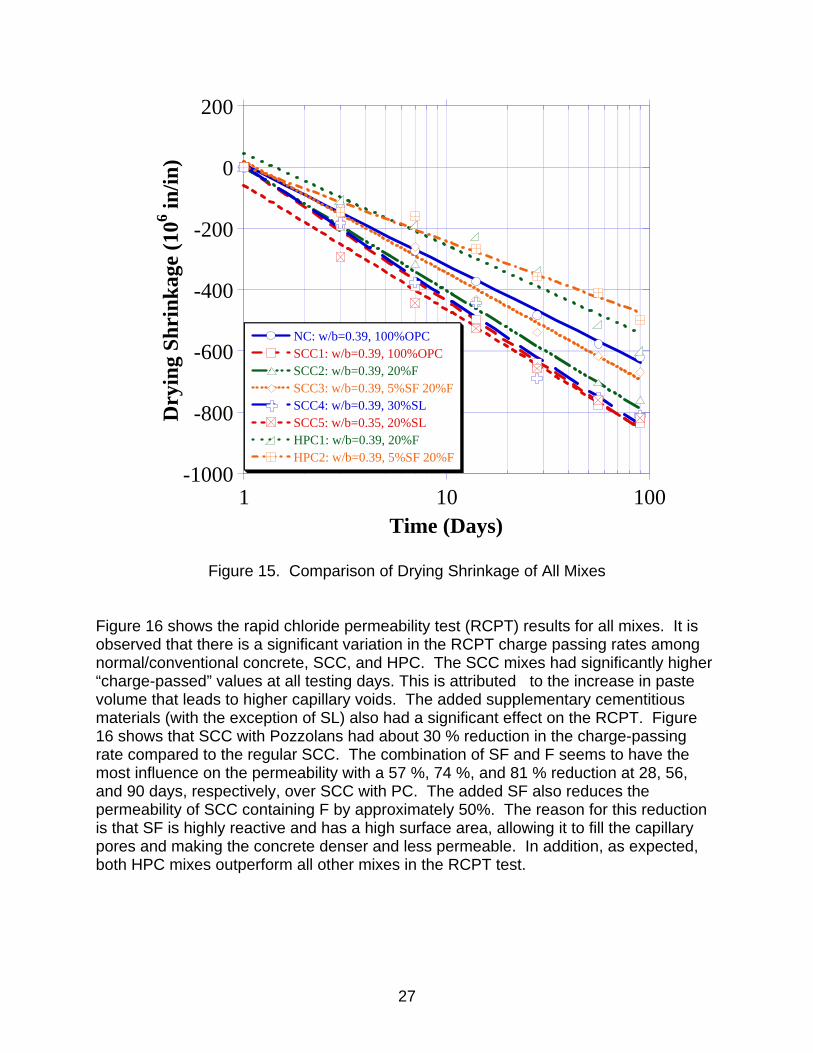
strengths. More importantly there is no significant difference between the mechanical properties of NC and SCC1. Figure 12a shows the compressive strength and modulus of elasticity of mixes SCC1, SCC2, SCC3, and SCC4. Figure 12b shows the compressive strength and tensile splitting strength of the same mixes. The SCC mix containing F only (i.e., SCC2) had the highest compressive strength, modulus of elasticity, and tensile splitting strength compared to all other SCC mixes. The increase was approximately 5% compared to SCC containing OPC only (i.e., SCC1). Both SCC3 and SCC4 had the worst performance with a minimum of 15 % reduction in compressive strength, modulus of elasticity, and tensile splitting strength at early-age when comparing to SCC1. At later-age, both SCC3 and SCC4 still had lower compressive strength and tensile splitting strength with a minimum of 5 % reduction, but have comparable modulus of elasticity with SCC1. In other words, the addition of pozzolans does not seem to have a long-term effect on the mechanical properties of SCC. Figure 13a shows the compressive strength and modulus of elasticity of the SCC mixes with varying w/b ratios and Figure 13b shows the compressive strength and tensile splitting strength for the same mixes. As expected, the mix containing lower w/b ratio (i.e., SCC5) had higher compressive strength and tensile splitting strength than mix containing higher w/b ratio (i.e., SCC4). However, mix SCC4 had higher modulus of elasticity than mix SCC5. This could be attributed to the fact that mix SCC5 was obtained from the precast plant and had different type of CA and lower cement content. In addition, mix SCC5 had different chemical admixtures including VMA and added color pigment. Figure 14a and Figure 14b show the relationship of the compressive strength and modulus of elasticity between SCC and HPC mixes. It is observed that SCC mixes outperformed HPC mixes in terms of modulus of elasticity, i.e., SCC2 had an average of 8 % increase over HPC1; and SCC3 had an average of 6% increase over HPC2. Figure 15 illustrates the drying shrinkage of normal/conventional concrete, SCC, and HPC mixes. It is observed that the HPC mixes had the lowest drying shrinkage, whereas the SCC mixes had the highest drying shrinkage. The reason for this is because SCC mixes had higher cementitious paste and higher capillary pores that lead to higher drying shrinkage. Nevertheless, the shrinkage subsided as pozzolans were added to the SCC mixes. Among all the SCC mixes, the mix containing both SF and F has the lowest drying shrinkage with a 20 % reduction in comparison with the SCC1 or regular SCC mix. Mix SCC2 (or SCC mix containing 20 % F) also had a 10% reduction, whereas, SCC3 (or SCC containing 30 % SL) did not have a significant reduction.
21
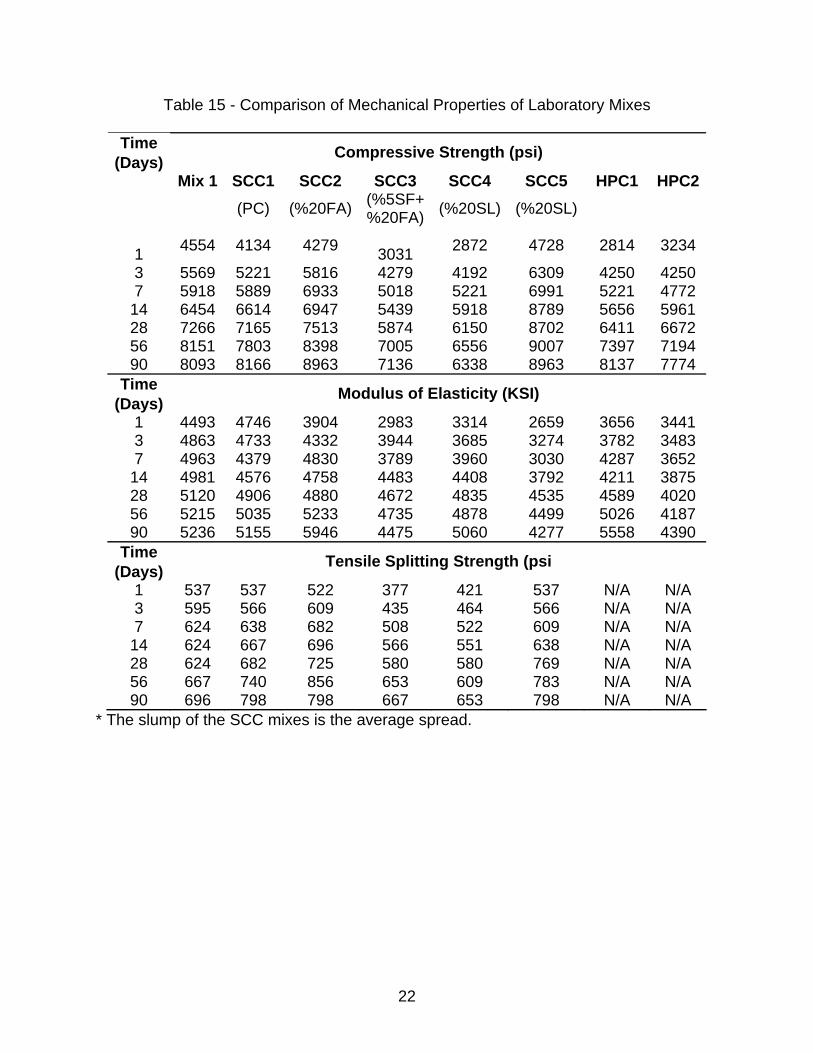
Table 15 - Comparison of Mechanical Properties of Laboratory Mixes
Time Compressive Strength (psi) (Days) Mix 1 SCC1 SCC2 SCC3 SCC4 SCC5 HPC1 HPC2
(%5SF+ (PC) (%20FA) (%20SL) (%20SL) %20FA) 4554 4134 4279 2872 4728 2814 3234 1 3031 3 5569 5221 5816 4279 4192 6309 4250 4250 7 5918 5889 6933 5018 5221 6991 5221 4772 14 6454 6614 6947 5439 5918 8789 5656 5961 28 7266 7165 7513 5874 6150 8702 6411 6672 56 8151 7803 8398 7005 6556 9007 7397 7194 90 8093 8166 8963 7136 6338 8963 8137 7774
Time Modulus of Elasticity (KSI) (Days) 1 4493 4746 3904 2983 3314 2659 3656 3441 3 4863 4733 4332 3944 3685 3274 3782 3483 7 4963 4379 4830 3789 3960 3030 4287 3652 14 4981 4576 4758 4483 4408 3792 4211 3875 28 5120 4906 4880 4672 4835 4535 4589 4020 56 5215 5035 5233 4735 4878 4499 5026 4187 90 5236 5155 5946 4475 5060 4277 5558 4390
Time Tensile Splitting Strength (psi (Days) 1 537 537 522 377 421 537 N/A N/A 3 595 566 609 435 464 566 N/A N/A 7 624 638 682 508 522 609 N/A N/A 14 624 667 696 566 551 638 N/A N/A 28 624 682 725 580 580 769 N/A N/A 56 667 740 856 653 609 783 N/A N/A 90 696 798 798 667 653 798 N/A N/A
* The slump of the SCC mixes is the average spread.
22

2000
4000
6000
8000
10000
1 10 100
f'c-NC: w/b=0.39, 100%OPCf'c-SCC1: w/b=0.39, 100%OPCE-NC: w/b=0.39, 100%OPCE-SCC1: w/b=0.39, 100%OPC
2000
4000
6000
8000
10000
Com
pres
sive
Str
engt
h (p
si)
Time (Days)
Ela
stic
Mod
ulus
(ksi
)
CompressiveStrength, f'c
Elastic Modulus, E
(a)
2000
4000
6000
8000
10000
1 10 100
f'c-NC: w/b=0.39, 100%OPCf'c-SCC1: w/b=0.39, 100%OPC f'sp-NC: w/b=0.39, 100%OPC f'sp-SCC1: w/b=0.39, 100%OPC
360
720
1080
1440
1800
Com
pres
sive
Str
engt
h (p
si)
Time (Days)
Ten
sile
Spl
ittin
g St
reng
th (p
si)
CompressiveStrength, f'c
Tensile SplittingStrength, f'sp
(b)
Figure 11. Comparison of Compressive Strength and a) Modulus of Elasticity, b) Tensile Splitting Strength of Mix 1 and SCC1 Mixes
23

2000
4000
6000
8000
10000
1 10 100
f'c-SCC1: 100%OPCf'c-SCC2: 20%Ff'c-SCC3: 5%SF 20%Ff'c-SCC4: 30%SLE-SCC1: 100%OPCE-SCC2: 20%FE-SCC3: 5%SF 20%FE-SCC4: 30%SL
2000
4000
6000
8000
10000
Com
pres
sive
Str
engt
h (p
si)
Time (Days)
Ela
stic
Mod
ulus
(ksi
)
CompressiveStrength, f'c
Elastic Modulus, E
(a)
2,000
4,000
6,000
8,000
10,000
1 10 100
f'c-SCC1: 100%OPCf'c-SCC2: 20%Ff'c-SCC3: 5%SF 20%Ff'c-SCC4: 30%SLf'sp-SCC1: 100%OPCf'sp-SCC2: 20%Ff'sp-SCC3: 5%SF 20%Ff'sp-SCC4: 30%SL
500
1,000
1,500
2,000
Com
pres
sive
Str
engt
h (p
si)
Time (Days)
Ten
sile
Spl
ittin
g St
reng
th (p
si)
CompressiveStrength, f'c
Tensile SplittingStrength, f'sp
(b)
Figure 12. Comparison of Compressive Strength and a) Modulus of Elasticity, b)
Tensile Splitting Strength of SCC Mixes
24

2000
4000
6000
8000
10000
1 10 100
f'c-SCC4: w/b =0.39, 30%SLf'c-SCC4:w/b=0.35, 20%SLE-SCC4:w/b=0.39, 30%SLE-SCC5: w/b=0.35, 20%SL
2000
4000
6000
8000
10000
Com
pres
sive
Str
engt
h (p
si)
Time (Days)
Ela
stic
Mod
ulus
(ksi
)
CompressiveStrength, f'c
Elastic Modulus, E
(a)
2000
4000
6000
8000
10000
1 10 100
f'c-SCC4: w/b=0.39, 30%SL f'c-SCC5: w/b=0.35, 20%SL f'sp-SCC4: w/b=0.39, 30%SLf'sp-SCC5: w/b=0.35, 20%SL
400
800
1200
1600
2000
Com
pres
sive
Str
engt
h (p
si)
Time (Days)
Ten
sile
Spl
ittin
g St
reng
th (p
si)
CompressiveStrength, f'c
Tensile SplittingStrength, f'sp
(b)
Figure 13. Comparison of Compressive Strength and a) Modulus of Elasticity, b)
Tensile Splitting Strength of SCC4 and SCC5 Mixes
25

2000
4000
6000
8000
10000
2500
5000
7500
10000
1 10 100
SCC2 f'cHPC1 f'c
SCC2 E HPC1 E
Com
pres
sive
Str
engt
h (p
si)
Ela
stic
Mod
ulus
(ksi
)
Time (Days)
Compressive Strength, fc'
Elastic Modulus, E
(a)
2000
4000
6000
8000
10000
2500
5000
7500
10000
1 10 100
SCC3 f'cHPC2 f'c
SCC3 E HPC2 E
Com
pres
sive
Str
engt
h (p
si)
Ela
stic
Mod
ulus
(ksi
)
Time (Days)
Compressive Strength, fc'
Elastic Modulus, E
(b)
Figure 14. Comparison of Compressive Strength and Modulus of Elasticity of SCC and
HPC Mixes containing (a) 20% F and (b) 5%SF 20%F
26
-1000
-800
-600
-400
-200
0
200
1 10 100
NC: w/b=0.39, 100%OPCSCC1: w/b=0.39, 100%OPCSCC2: w/b=0.39, 20%FSCC3: w/b=0.39, 5%SF 20%FSCC4: w/b=0.39, 30%SLSCC5: w/b=0.35, 20%SLHPC1: w/b=0.39, 20%FHPC2: w/b=0.39, 5%SF 20%F
Dry
ing
Shri
nkag
e (1
06 in/in
)
Time (Days)
Figure 15. Comparison of Drying Shrinkage of All Mixes Figure 16 shows the rapid chloride permeability test (RCPT) results for all mixes. It is observed that there is a significant variation in the RCPT charge passing rates among normal/conventional concrete, SCC, and HPC. The SCC mixes had significantly higher “charge-passed” values at all testing days. This is attributed to the increase in paste volume that leads to higher capillary voids. The added supplementary cementitious materials (with the exception of SL) also had a significant effect on the RCPT. Figure 16 shows that SCC with Pozzolans had about 30 % reduction in the charge-passing rate compared to the regular SCC. The combination of SF and F seems to have the most influence on the permeability with a 57 %, 74 %, and 81 % reduction at 28, 56, and 90 days, respectively, over SCC with PC. The added SF also reduces the permeability of SCC containing F by approximately 50%. The reason for this reduction is that SF is highly reactive and has a high surface area, allowing it to fill the capillary pores and making the concrete denser and less permeable. In addition, as expected, both HPC mixes outperform all other mixes in the RCPT test.
27

0
1000
2000
3000
4000
5000
6000
7000
8000
28 Days56 Days90 Days
Cha
rge
Pass
ed (C
oulo
mbs
)
NC
: w/b
=0.3
910
0%O
PC
SCC
1: w
/b=0
.39
100%
OPC
SCC
2: w
/b=0
.39
20%
F
SCC
3: w
/b=0
.39
5%SF
20%
F
SCC
4: w
/b=0
.39
30%
SL
SCC
5: w
/b=0
.35
20%
SL
HPC
1: w
/b=0
.39
20%
F
HPC
2: w
/b=0
.39
5%SF
20%
F
Figure 16. Results of Rapid Chloride Permeability Tests of All Mixes Figure 17a and Figure 17b illustrate the specific creep and shrinkage of SCC containing slag cement and class F fly ash, respectively. The SCC mix containing 20% Class F fly ash (SCC2) has lowered specific creep and shrinkage than the SCC mix containing 20% slag cement (SCC5). Thus, it is recommended that Class F fly ash be used when the structural components where lower creep and shrinkage are desired.
28

0
0 .1
0 .2
0 .3
0 .4
0 .5
0 .6
0 .7
0 5 0 10 0 1 5 0 2 0 0 2 5 0 3 0 0 35 0
2 0 % C la ss F F ly A sh2 0 % S la g C e m e n t
Spec
ific
Cre
ep (M
icro
stra
ins/
PSI)
T im e (D a ys) (a)
0
100
200
300
400
500
600
700
800
0 50 100 150 200 250 300 350
20% C lass F F ly A sh20% S lag C em en t
Shrin
kage
Str
ain
(Mic
rost
rain
s)
T im e (D ays)
(b)
Figure 17 Plot of (a) the Specific Creep and (b) Shrinkage of SCC Containing 20% slag cement and 20% Class F Fly Ash
29
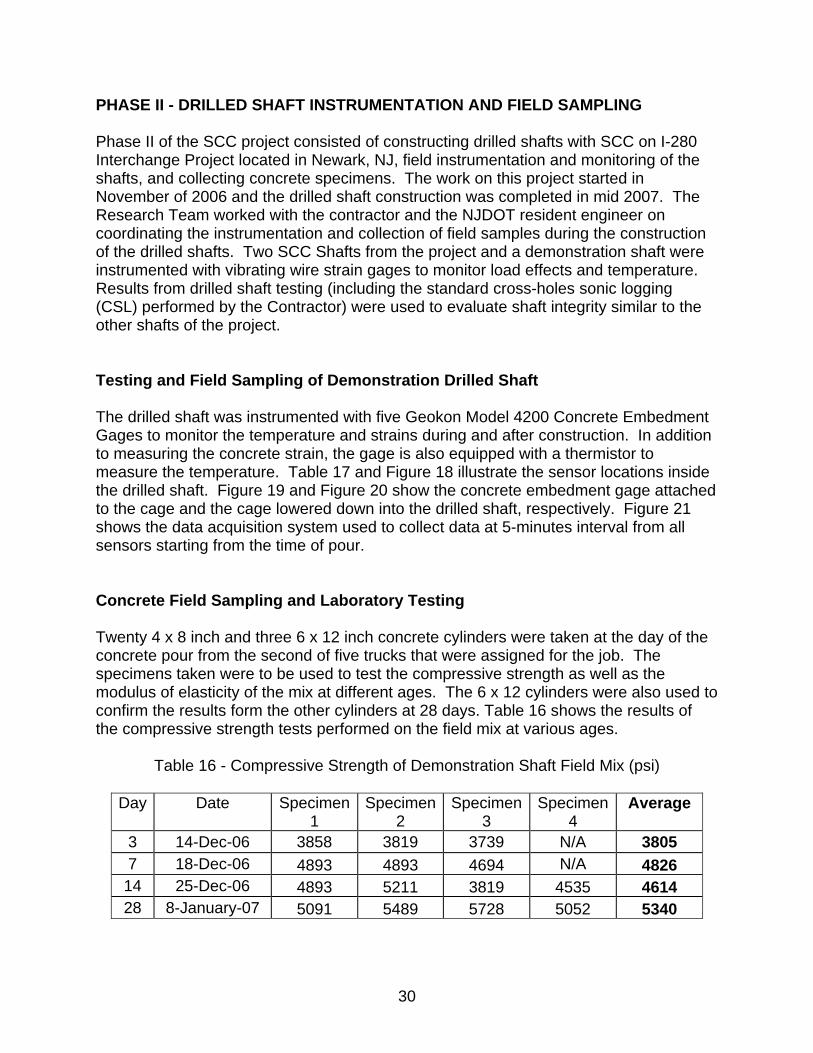
PHASE II - DRILLED SHAFT INSTRUMENTATION AND FIELD SAMPLING Phase II of the SCC project consisted of constructing drilled shafts with SCC on I-280 Interchange Project located in Newark, NJ, field instrumentation and monitoring of the shafts, and collecting concrete specimens. The work on this project started in November of 2006 and the drilled shaft construction was completed in mid 2007. The Research Team worked with the contractor and the NJDOT resident engineer on coordinating the instrumentation and collection of field samples during the construction of the drilled shafts. Two SCC Shafts from the project and a demonstration shaft were instrumented with vibrating wire strain gages to monitor load effects and temperature. Results from drilled shaft testing (including the standard cross-holes sonic logging (CSL) performed by the Contractor) were used to evaluate shaft integrity similar to the other shafts of the project. Testing and Field Sampling of Demonstration Drilled Shaft The drilled shaft was instrumented with five Geokon Model 4200 Concrete Embedment Gages to monitor the temperature and strains during and after construction. In addition to measuring the concrete strain, the gage is also equipped with a thermistor to measure the temperature. Table 17 and Figure 18 illustrate the sensor locations inside the drilled shaft. Figure 19 and Figure 20 show the concrete embedment gage attached to the cage and the cage lowered down into the drilled shaft, respectively. Figure 21 shows the data acquisition system used to collect data at 5-minutes interval from all sensors starting from the time of pour. Concrete Field Sampling and Laboratory Testing Twenty 4 x 8 inch and three 6 x 12 inch concrete cylinders were taken at the day of the concrete pour from the second of five trucks that were assigned for the job. The specimens taken were to be used to test the compressive strength as well as the modulus of elasticity of the mix at different ages. The 6 x 12 cylinders were also used to confirm the results form the other cylinders at 28 days. Table 16 shows the results of the compressive strength tests performed on the field mix at various ages.
Table 16 - Compressive Strength of Demonstration Shaft Field Mix (psi)
Day Date Specimen 1
Specimen 2
Specimen 3
Specimen 4
Average
3 14-Dec-06 3858 3819 3739 N/A 3805 7 18-Dec-06 N/A 4893 4893 4694 4826 14 25-Dec-06 4893 5211 3819 4535 4614 28 8-January-07 5091 5489 5728 5052 5340
30
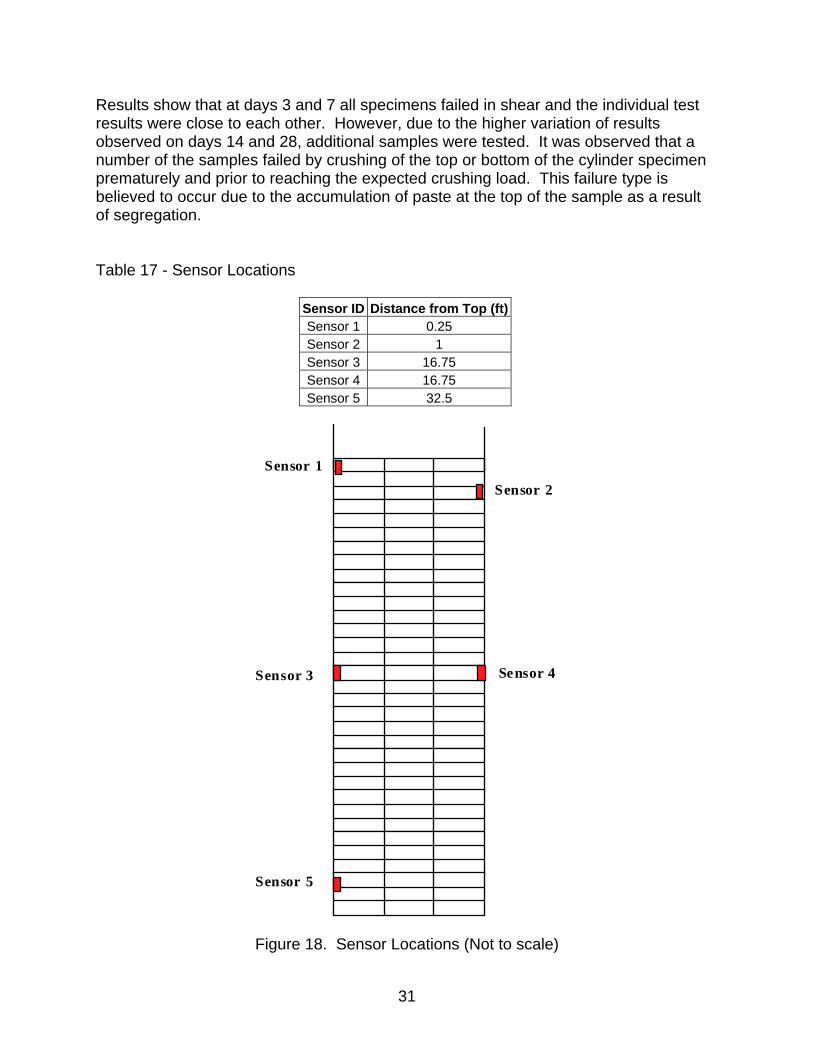
Results show that at days 3 and 7 all specimens failed in shear and the individual test results were close to each other. However, due to the higher variation of results observed on days 14 and 28, additional samples were tested. It was observed that a number of the samples failed by crushing of the top or bottom of the cylinder specimen prematurely and prior to reaching the expected crushing load. This failure type is believed to occur due to the accumulation of paste at the top of the sample as a result of segregation. Table 17 - Sensor Locations
Sensor ID Distance from Top (ft)Sensor 1 0.25 Sensor 2 1 Sensor 3 16.75 Sensor 4 16.75 Sensor 5 32.5
Sensor 1
Sensor 2
Sensor 3 Sensor 4
Sensor 5
Figure 18. Sensor Locations (Not to scale)
31

Two 6 x 12 inch cylinder specimens were also tested to confirm the 28-day compressive strength results from the 4 x 8 inch cylinders. First specimen had a failure stress of 6119 psi with a shear type failure and the second specimen failed as seen in Figure 22 at a value of 5305 psi, with an average value of 5712 psi. Figure 22 illustrates the failure mechanism observed while testing specimen 4 at 28-day tests. As described earlier the failure takes place by crushing of concrete on the top (or bottom) of the specimen. The bottom part of the cylinder crumbled slowly into many pieces until the specimen could not sustain any more load.
Figure 19. Model 4200 Concrete Embedment Gage
Figure 20. Model 4200 Gage After Cage Placement
32
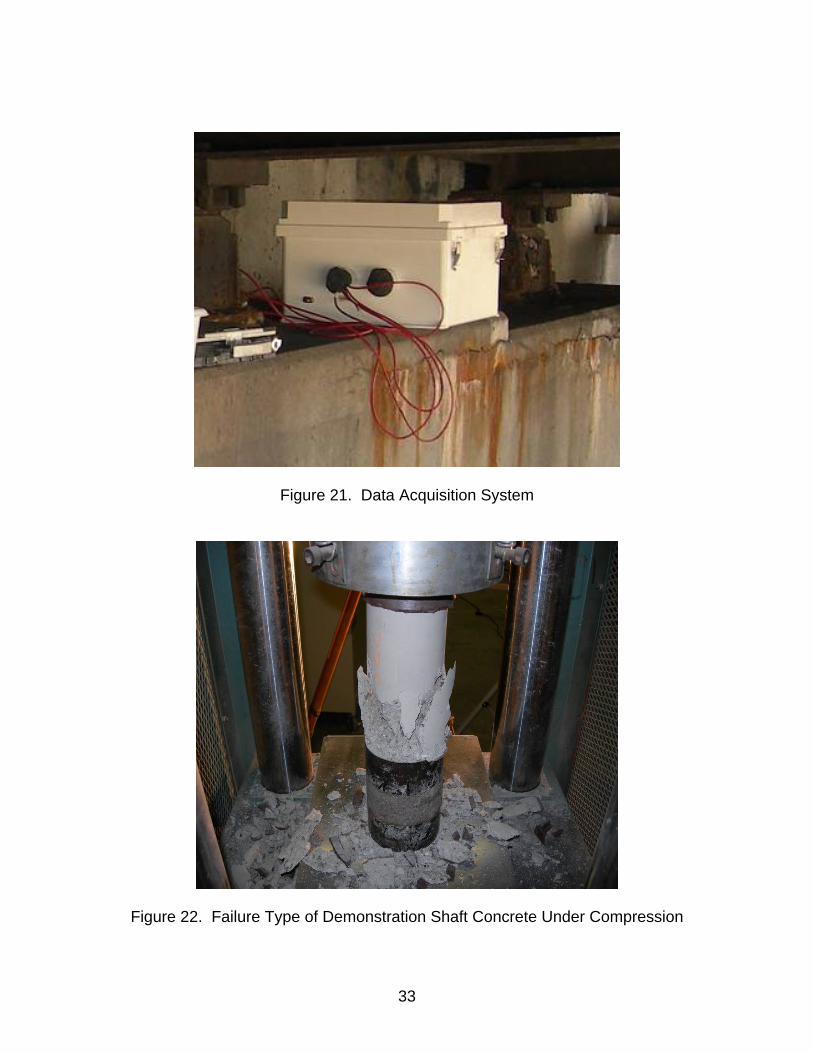
Figure 21. Data Acquisition System
Figure 22. Failure Type of Demonstration Shaft Concrete Under Compression
33

Figure 23 illustrates the picture that was taken before the specimens were capped by a high strength sulfur compound. The top ¼ in portion of the sample was observed to be almost entirely composed of cement paste with many air pockets. This is mostly due to the segregation of the concrete and it is the main cause for high variation in the compressive strength tests.
Figure 23. Top View of 6 x 12 inch Test Specimen Strain and Temperature Profile Figure 24 and Figure 25 show the change in strains and temperature from the time of pour (December 11, 2006) to 28 days (10:25 am January 8, 2006), respectively. Sensors 3 and 4 recorded temperature values around 63 0F. This is expected since these sensors are in the middle of the shaft. Dissipation of the heat of hydration is therefore much slower than the concrete near the top surface (which is exposed to ambient temperatures) and the concrete that is close to bottom (which dissipates heat through contact with the surrounding soil). The initial temperature recorded by the gages is the temperature of the concrete at the time of arrival of the truck to the site. This value is around 75 0F for all sensors. Peak temperature of Sensors 1 and 2 are 106 0F and 94 0F, respectively. For Sensors 3 and 4 the values were 126.5 0F and 128 0F, respectively, while the value for Sensor 5 was 111 0F. Strains in all sensors are in compression indicating that the concrete is shrinking freely.
34

-400
-300
-200
-100
0
100
0 5 10 15 20 25 30
Sensor 1Sensor 2Sensor 3
Sensor 4Sensor 5
Stra
in (μ
ε)
Time (Days)
December 11, 2006
January 8, 2006
Figure 24. Strain Profile of the Demonstration Shaft
20
40
60
80
100
120
140
0 5 10 15 20 25 30
Sensor 1Sensor 2Sensor 3Sensor 4Sensor 5
Tem
pera
ture
(F0 )
Time (Days)
December 11, 2006January 8, 2006
Figure 25. Temperature Profile of the Demonstration Shaft
35

Testing and Field Sampling of Drilled Shaft #3 Drilled Shaft #3 is the 2nd out of 3 of the drilled shafts that were poured for the Route 280 project. Similar instrumentation and field sampling procedures were followed as was performed in the demonstration shaft. The number of samples taken was increased to test for other mechanical properties such as tensile strength and modulus of elasticity. Moreover, on top of regular slump flow tests performed, L-box and J-ring tests were also utilized to test the flowability of the SCC supplied to the site. Instrumentation The drilled shaft was instrumented with 3 embedment concrete strain gages that also have thermistors attached. The total length of the shaft was 33 ft with only 20 ft being under ground. Two sensors were placed at mid-height whereas the other sensors were placed one foot above the bottom of the shaft. Figure 26 and Figure 27 show drilled shaft #3 and close-up view of the sensors installed, respectively. The shaft was monitored for 14 days and then the data logger unit was moved to drilled shaft #1. Fresh Concrete Properties Table 18 summarizes the fresh concrete testing results for Drilled Shaft #3 and Figure 28 through Figure 33 illustrate the field-testing procedures. Due to space limitations at the location of the drilled shaft concrete pours, not all tests were performed for each truck. However, the slump flow test was performed for every truck arriving at the site. The value of the slump flow test from the truck No. 1 was higher in comparison with those from other trucks. According to the results of the J-Ring test, the concrete from Truck No. 1 will have minimal to noticeable blocking while the concrete from Truck No. 3 will have no visible blocking. The L–Box test performed on the concrete from Truck No. 4 indicated that blocking may be experienced since h2/h1 was observed to be less than 0.9.
Table 18 - Fresh Concrete Tests Performed on Concrete for Drilled Shaft #3
L - Box Slump Flow
J-Ring Flow
Difference from Slump
Flow (in) Truck No. h2 (in) h1 (in) h2/h1 (in) (in x in) 1 28.5 27 1.5 - - - 2 24.5 - - - - - 3 18.5 18.25 0.25 - - - 4 19.5 - - 3.25 4.75 0.684
36

Figure 26. Drilled Shaft #3
Figure 27. Close-up View of the Sensors in Drilled Shaft #3
37

Figure 28. Slump Flow Test Figure 29. Slump Flow
Figure 30. J-Ring Flow Test Figure 31. J-Ring Flow Measurement
Figure 32. L-Box Test Figure 33. L-Box Test Measurement (h2)
Mechanical Properties Table 19 illustrates a summary of the mechanical properties of the concrete obtained from Drilled Shaft #3. It is observed that the average compressive strength at 28 days is 35 percent higher than those obtained from testing the concrete specimens collected from the demonstration shaft. During testing, it was also observed that none of the samples experienced premature failures due to segregation. This is believed to be due to the lower slump flow obtained from drilled shaft #3 mix.
38

Table 19 - Mechanical Properties of Concrete from Drilled Shaft #3
Compressive Strength
Splitting Tensile Strength
Modulus of Elasticity Day
(psi) (psi (ksi) 3 3839 514 - 7 5542 622 3651
14 6086 595 4070 28 7823 671 4100 56 7902 723 4320
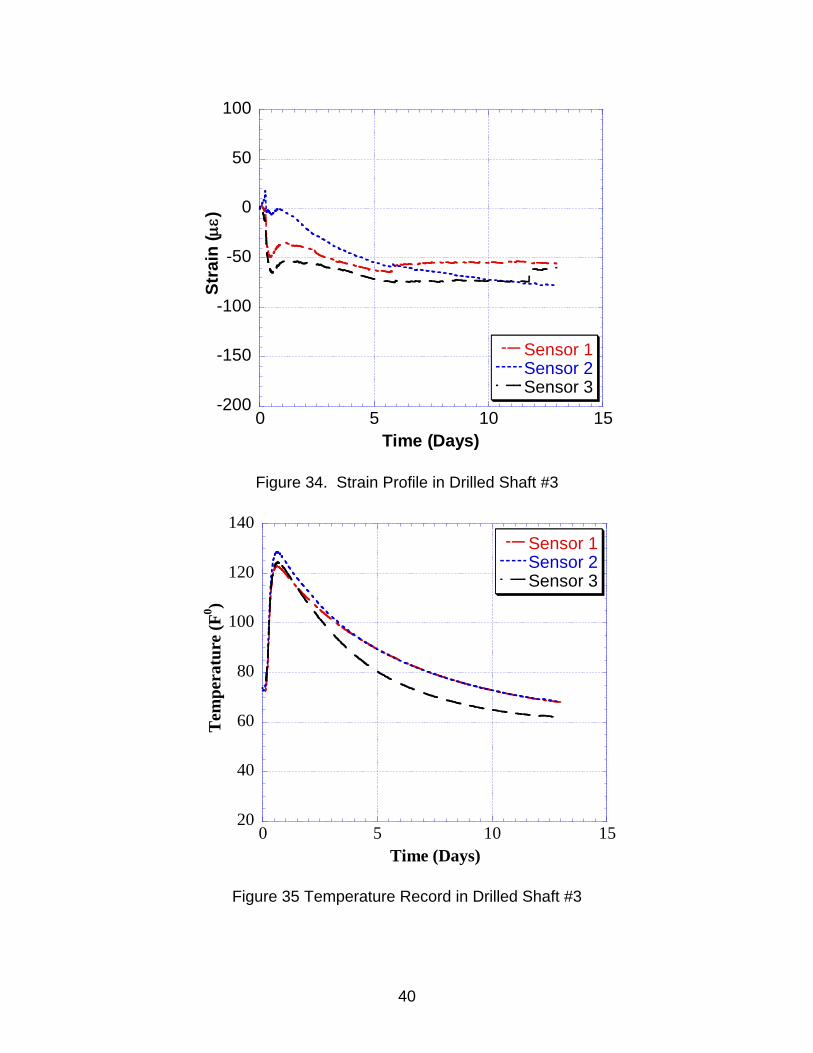
Temperature and Strain Profile Figure 34 and Figure 35 illustrate the strain as well as the temperature profiles for Drilled Shaft # 3, respectively. Sensors 1 and 2 were placed at mid-height where as sensor 3 was placed at the bottom of the drilled shaft. Testing and Field Sampling of Drilled Shaft #1 Drilled Shaft #1 was the last of the four shafts that were poured for the Route 280 Project. The numbering scheme and arrangement of the sensors used was identical to that used in Drilled Shaft #3 and the same field tests were employed on two of the four trucks that arrived to the site. Instrumentation As was done in the other drilled shafts, two sensors were installed at the mid-height of the shaft whereas the last sensor was placed close to the bottom of the shaft. The readings from the sensors were monitored up to 14 days only. Fresh Concrete Properties
Table 20 shows the results of the fresh concrete tests performed on two of the four trucks that arrived to the site for Drilled Shaft #1. The slump flow values from both trucks varied between 19 and 21.5 inches, which is less than the limit of 24 inches specified by NJDOT Specifications. The J–Ring test performed on the second truck (measured flow is 21.5 inch.) indicated that blocking should be observed in the concrete from this truck. The L–Box readings correlated well with the J-Ring test results showing that blocking might be obtained due to the h2/h1 ratio of 0.632, which is lower than the L–Box test limit 0.9.
39
-200
-150
-100
-50
0
50
100
0 5 10 15
Sensor 1Sensor 2Sensor 3
Stra
in (μ
ε)
Time (Days)
Figure 34. Strain Profile in Drilled Shaft #3
20
40
60
80
100
120
140
0 5 10 15
Sensor 1Sensor 2Sensor 3
Tem
pera
ture
(F0 )
Time (Days)
Figure 35 Temperature Record in Drilled Shaft #3
40
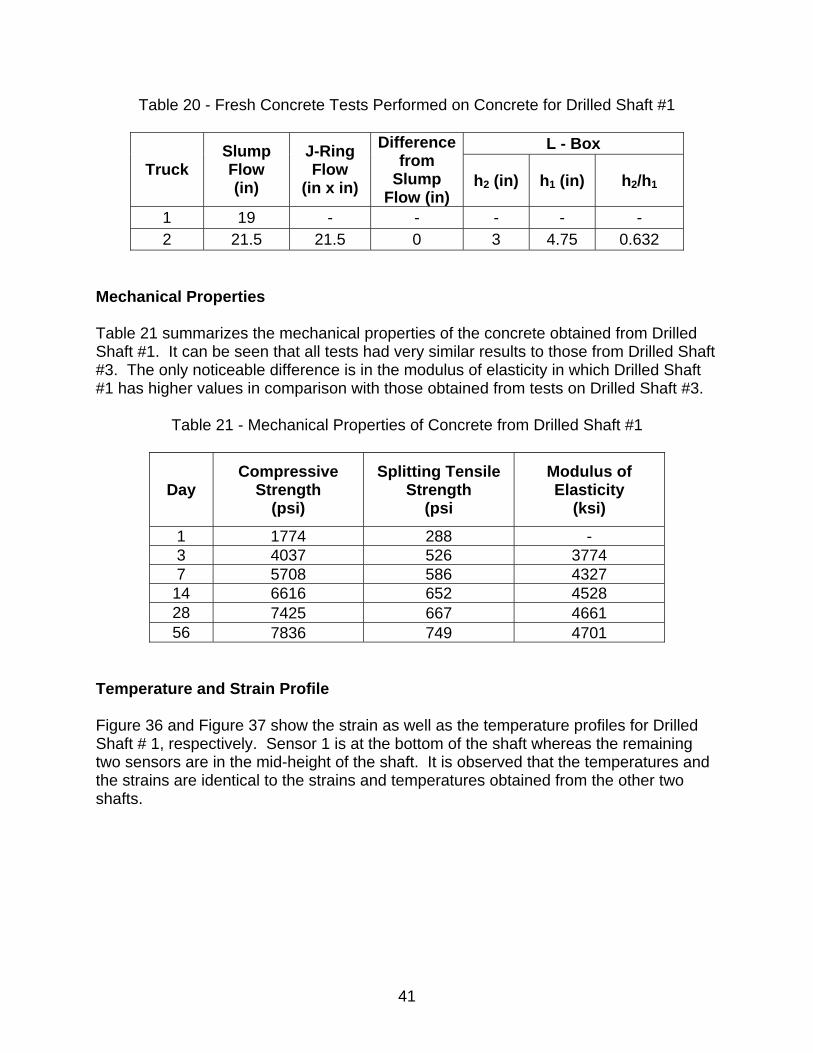
Table 20 - Fresh Concrete Tests Performed on Concrete for Drilled Shaft #1
L - Box Difference from
Slump Flow (in)
Slump Flow
J-Ring Flow Truck
h2 (in) h1 (in) h2/h1 (in) (in x in)
1 19 - - - - - 2 21.5 21.5 0 3 4.75 0.632
Mechanical Properties Table 21 summarizes the mechanical properties of the concrete obtained from Drilled Shaft #1. It can be seen that all tests had very similar results to those from Drilled Shaft #3. The only noticeable difference is in the modulus of elasticity in which Drilled Shaft #1 has higher values in comparison with those obtained from tests on Drilled Shaft #3.
Table 21 - Mechanical Properties of Concrete from Drilled Shaft #1
Compressive Strength
Splitting Tensile Strength
Modulus of Elasticity Day
(psi) (psi (ksi)
1 1774 288 - 3 4037 526 3774 7 5708 586 4327 14 6616 652 4528 28 7425 667 4661 56 7836 749 4701
Temperature and Strain Profile Figure 36 and Figure 37 show the strain as well as the temperature profiles for Drilled Shaft # 1, respectively. Sensor 1 is at the bottom of the shaft whereas the remaining two sensors are in the mid-height of the shaft. It is observed that the temperatures and the strains are identical to the strains and temperatures obtained from the other two shafts.
41
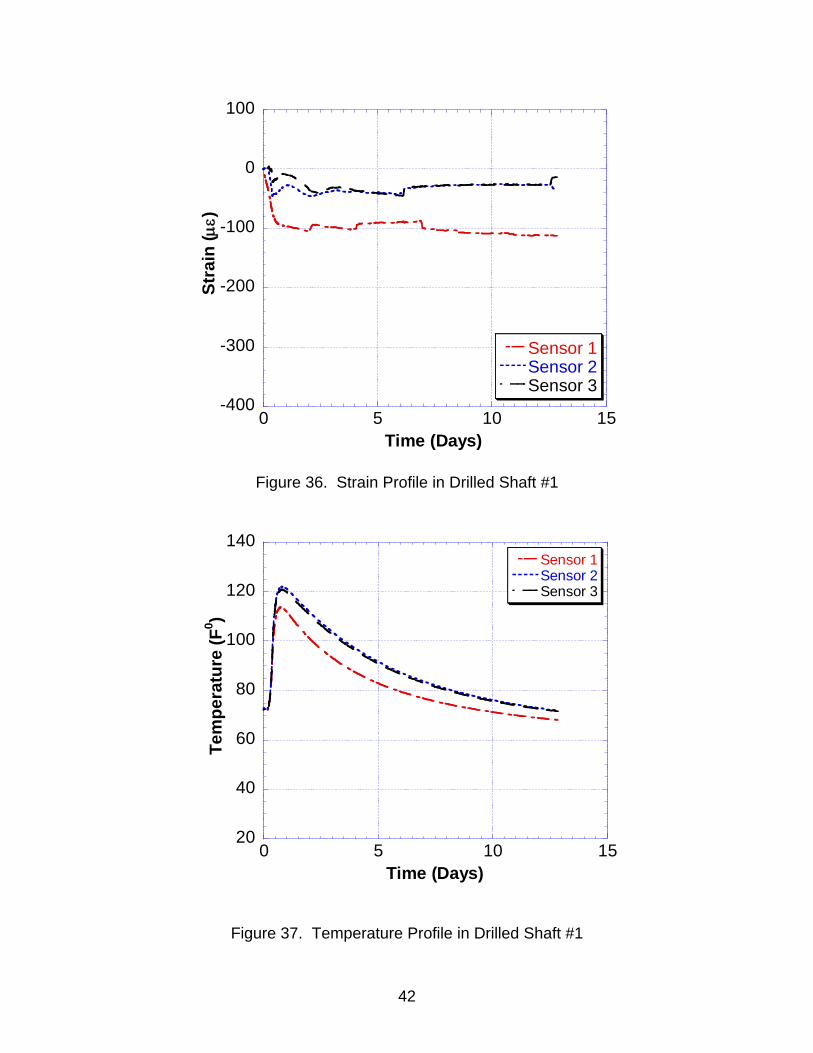
-400
-300
-200
-100
0
100
0 5 10 15
Sensor 1Sensor 2Sensor 3
Stra
in (μ
ε)
Time (Days)
Figure 36. Strain Profile in Drilled Shaft #1
20
40
60
80
100
120
140
0 5 10 15
Sensor 1Sensor 2Sensor 3
Tem
pera
ture
(F0 )
Time (Days)
Figure 37. Temperature Profile in Drilled Shaft #1
42

Comparison of Mechanical Properties of All SCC Field Mixes Figure 38 and Figure 40 show a comparison of mixes obtained from the field including the demonstration shaft. It is clear that concrete from drilled shafts 1 and 3, both having lower slump flows, outperformed the concrete from the demonstration shaft. Cross-Hole Sonic Logging Evaluation of Drilled Shafts The project Contractor performed Cross-hole sonic logging evaluation on each drilled shaft including the demonstration shaft. The results showed no (major) air pockets or a discontinuity in the integrity of any of the shafts. This means that the SCC mix used was successful in passing through the dense reinforcement layers in the 6 feet diameter shafts. Appendix A shows typical results from the analysis of the CSL of the Drilled Shafts in I-280 Interchange.
0
2000
4000
6000
8000
10000
0
14
28
41
55
69
0 10 20 30 40 50 60
Demo ShaftShaft #3Shaft #1
Com
pres
sive
Str
engt
h (p
si)
Com
pres
sive
Str
engt
h (M
Pa)
Time (Hours)
Figure 38. Comparison of Compressive Strength of Field Mixes
43
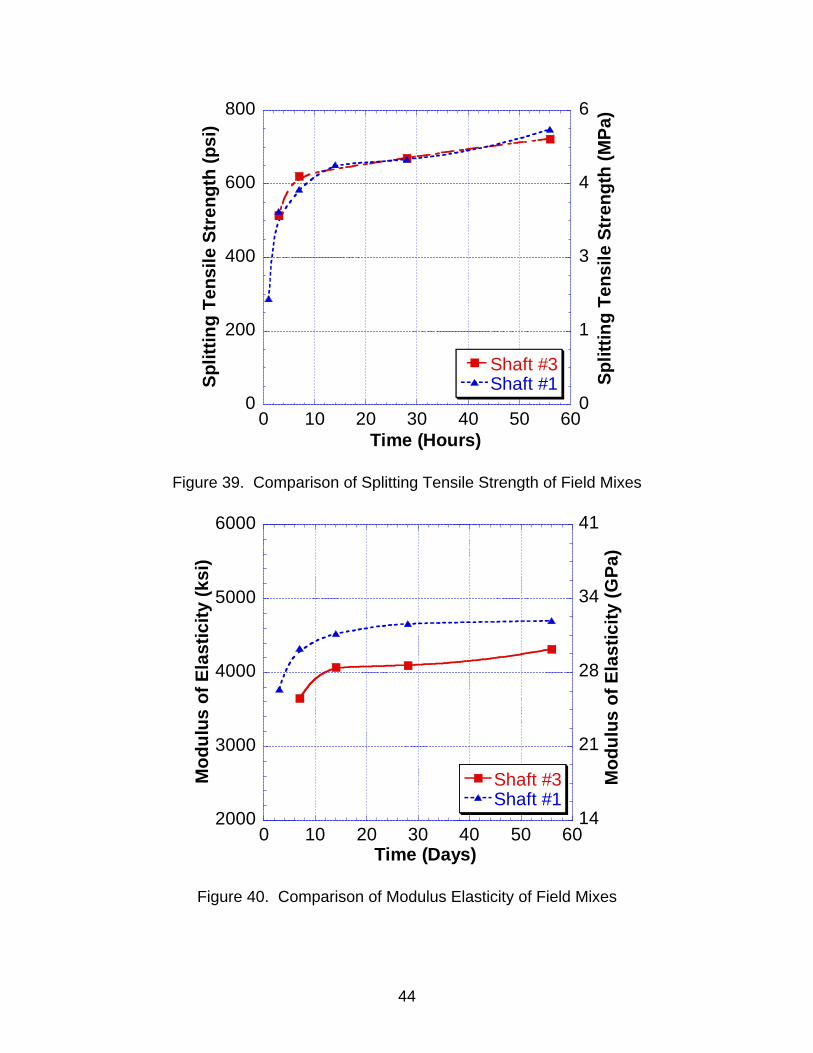
0
200
400
600
800
0
1
3
4
6
0 10 20 30 40 50 60
Shaft #3Shaft #1Sp
littin
g Te
nsile
Str
engt
h (p
si)
Split
ting
Tens
ile S
tren
gth
(MPa
)
Time (Hours)
Figure 39. Comparison of Splitting Tensile Strength of Field Mixes
2000
3000
4000
5000
6000
0 10 20 30 40 50 60
Shaft #3Shaft #1
14
21
28
34
41
Mod
ulus
of E
last
icity
(ksi
)
Time (Days)
Mod
ulus
of E
last
icity
(GPa
)
Figure 40. Comparison of Modulus Elasticity of Field Mixes
44
RECOMMENDATIONS AND CONCLUSIONS The following conclusions and recommendations could be made from this study 1. There are no significant changes in compressive strength between SCC and
normal/conventional concrete. 2. The modulus of elasticity of SCC is slightly lower than that of normal/conventional
concrete but its tensile splitting strength was higher. The reduction in the elastic modulus was about 5% and the increase in the tensile splitting strength was about 10%. Nonetheless, the modulus of elasticity of SCC containing supplementary cementitious materials increases at a higher rate with time than regular SCC.
3. SCC has higher drying shrinkage than normal/conventional concrete and HPC. The drying shrinkage of SCC was approximately 30% higher than that of normal/conventional concrete and approximately 40 % higher than that of HPC. In addition, fly ash is the best overall pozzolans for controlling the drying shrinkage of SCC with a 10 % reduction over normal SCC.
4. The performance of SCC under rapid chloride permeability testing (ASTM C1202) is greatly enhanced with the addition of fly ash and silica fume especially at 56 and 90 days. There is a 70% reduction in the amount of charged passed with the addition of silica fume and fly ash.
5. Performance of the SCC obtained from the drilled shafts in Phase II was found satisfactory. However, for the Demo shaft, the slump flow measured was over the upper specified limit of 28 inches. Additionally, it is also observed that there is a need to examine various mixes for segregation by applying the Visual Stability Index (VSI) as a screening tool.
6. ASTM Standard J-Ring Test (C1621/C1621M-06 Standard Test Method for Passing Ability of Self-Consolidating Concrete by J-Ring) was successfully used to test the passing ability of SCC. It is suggested that this test be used as a part of quality control measure (along with the regular slump flow test) when a more quantitative result is needed. This is especially true for mixes with superplasticizer only and high coarse aggregate content where the slump flow maybe within the limits of the slump flow test but may segregate when passing through the J-ring.
REFERENCES
1. Persson, B., A Comparison Between Mechanical Properties of Self-Compacting Concrete and the Corresponding Properties of Normal Concrete, Cement And Concrete Research, Vol. 31, No.2, 2001, pp. 193-198.
2. Zhu, W., P. Bartos, Permeation Properties of Self-Compacting Concrete, Cement and Concrete Research, Vol. 33, No. 6, 2003, pp. 921-926.
3. Persson, B., Sulphate Resistance of Self-Compacting Concrete, Cement and Concrete Research, In Press.
4. Persson, B., Internal Frost Resistance and Salt Frost Scaling Of Self-Compacting Concrete, Cement And Concrete Research, Vol. 33, No. 3, 2003, pp. 373 – 379.
45

5. Okamura, H., Self-Compacting High-Performance Concrete, Concrete International, Vol. 19, No. 7, 1997, pp.50-54.
6. Trandifilou, L.N., Implementation of High-Performance Materials: When Will They Become Standard, Proceeding of the 6th International Bridge Engineering Conference, TRB, 2005, pp. 33-48 (on CD).
7. Su, N., K.C. Hsu, H.W. Chai, A Simple Mix Design Method for Self-Compacting Concrete, Cement And Concrete Research, Vol. 31, No. 12, 2001, pp. 1799-1807.
8. Saak, A.W., H.M. Jennings, S.P. Shah, New Methodology for Designing Self-Compacting Concrete, ACI Materials Journal, 98 (6), 2001, pp. 429 – 439.
9. Sedran, T., F. De Larrard, Optimizing of Self-Compacting Concrete, Proceedings Of The 1st RILEM Symposium on Self-Compacting Concrete, 1999, pp. 321 – 332.
10. Edamatsu, Y., N. Nishida, A Rational Mix-Design Method for Self-Compacting Concrete Considering Interaction Between Coarse Aggregates And Mortar Particles, Proceedings of The 1st RILEM Symposium on Self-Compacting Concrete, 1999, pp. 309 – 320.
11. Jacobs, F., F. Hunkeler, Design of Self-Compacting Concrete For Durable Concrete Structures, Proceedings of The 1st RILEM Symposium on Self-Compacting Concrete, 1999, pp. 397 – 407.
12. Xie, Y., B. Liu, J. Yin, S. Zhou, Optimum Mix Parameters of High-Strength Self-Compacting Concrete with Ultrapulverized Fly Ash, Cement And Concrete Research, Vol. 32, No. 3, 2002, pp. 477-480.
13. Bouzoubaa, N., M. Lachemi, Self-Compacting Concrete Incorporating High Volumes of Class F Fly Ash: Preliminary Results, Cement and Concrete Research, Vol. 31, No. 3, 2001, pp. 413-420.
14. Ho, D.W.S., A.M.M. Sheinn, C.C. Ng, C.T. Tam, The use of Quarry Dust for SCC Applications, Cement and Concrete Research, Vol. 32, No. 4, 2003, pp. 505 – 511.
15. Ozawa, K., N. Sakata, H. Okamura, Evaluation Of Self-Compactibility of Fresh Concrete using The Funnel Test, Proceedings Of The Japanese Soc. Civ. Eng., No. 25, 1995, pp. 59- 75.
16. Domone, P. The Slump Flow Test for High-Workability Concrete, Cement and Concrete Research, Vol. 28, No. 2, 1998, pp. 177-182.
17. Bui, V., D. Montgomery, I. Hinczak, K. Turner, Rapid Testing Method For Segregation Resistance Of Self-Compacting Concrete, Cement And Concrete Research, Vol. 32, No. 9, 2002, pp. 1489 – 1496.
18. ACI Committee 318, Building Code Requirements for Structural Concrete, ACI 318-05, Farmington Hills, M.I., 2005, p. 443.
19. AASHTO, AASHTO LRFD Bridge Design Specification for Highway Bridges, 3rd Edition, Washington, D.C., 2002.
20. ACI Committee 363, State-of-the-Art Report on High-Strength Concrete, ACI 363R-92, Farmington Hills, M.I., 1997, p. 55.
21. Carrasquillo, R. L., Nilson, A. H., and Slate, F. O., “Properties of High Strength Concrete Subject to Short-Term Loads”, ACI Journal, Vol. 78, No. 3, May-June 1981, pp. 171-178.
46

22. Comité Européen de Normalisation (CEN), Eurocode 2: Design of Concrete Structures, EN-1992-2:2005 (E), Brussel, Belgium.
23. Suksawang, N., and Nassif, H.H., Effect of Modulus of Elasticity on Creep Prediction of High Strength Concrete Containing Pozzolans, Shrinkage and Creep of Concrete, ACI, SP-227, Farmington Hills, M.I., 2005, pp. 261-284.
24. Gardner, N.J., “Design provisions for shrinkage and creep of concrete”, ACI Publication, SP 194, The Adam Neville Symposium: Creep and Shrinkage – Structural Design Effects, 2000, pp. 101-134.
25. Nassif, H. Najm, H., and Suksawang, N., Effect of Pozzolanic Materials and Curing Methods on the Elastic Modulus of HPC, Cement and Concrete Composites, Vol. 27, Issue 6, 2005, pp. 661-670.
26. ACI Committee 209, Prediction of creep, shrinkage and temperature effects in concrete structures. Report No. ACI 209 R-92, American Concrete Institute, Farmington Hills, Michigan, 1992, 47 pp.
27. Branson, D.E., and Christianson, M.L. Time-Dependent Concrete Properties related to Design-Strength and Elastic Properties, Creep, and Shrinkage. ACI Publication SP-76, 1982, pp. 257-277.
28. Bazant, Z.P., and Murphy, W.P. Creep and Shrinkage Prediction Model for Analysis and Design of Concrete Structures – Model B3. Materials and Structures, Vol. 28, No. 180, July 1995, pp. 357-365.
29. Bazant, Z.P., and Boweja, S. Justification and refinements of model B3 for concrete and shrinkage 1. Statistics and Sensitivity. Materials and Structures, Vol. 28, No. 181, Aug-Sept 1995, pp. 415-430.
30. Bazant, Z.P., and Boweja, S. Justification and refinements of model B3 for concrete and shrinkage 2. Updating and theoretical basis. Materials and Structures, Vol. 28, No. 182, October 1995, pp. 488-495.
31. Gardner, N.J., and Lockman, M. “Design provision for drying shrinkage and creep of normal-strength concrete”, ACI Material Journal, Vol. 98, Mar-Apr 2001, pp. 159-167.
47

Appendix A – Cross-Hole Logging Tests
Table 22 – Summarized results of CSL Testing for Demo Drilled Shaft #1 on I280 Interchange (CHL tests performed by Olson Instruments)
Table 23 – Summarized results of CSL Testing for Demo Drilled Shaft B3 on I280 Interchange (CHL tests performed by Olson Instruments)
48

Figure 41 – Typical CSL for Drilled Shaft B3 (CHL tests performed by Olson Instruments)
49

Table 24 – Summarized results of CSL Testing for Demo Drilled Shaft P1 on I280
Interchange (CSL tests performed by Olson Instruments)
Table 25 – Summarized results of CSL Testing for Demo Drilled Shaft P1 and P2 on I280 Interchange (CSL tests performed by Olson Instruments)
50

Table 26 – Crosshole Sonic Logging (CSL) Condition Rating Criteria (CHL tests
performed by Olson Instruments)
51