self-efficacy for self-regulated learning: a validation study
TRANSCRIPT
http://epm.sagepub.com/Measurement
Educational and Psychological
http://epm.sagepub.com/content/68/3/443The online version of this article can be found at:
DOI: 10.1177/0013164407308475
26 November 2007 2008 68: 443 originally published onlineEducational and Psychological Measurement
Ellen L. Usher and Frank PajaresSelf-Efficacy for Self-Regulated Learning : A Validation Study
Published by:
http://www.sagepublications.com
at: can be foundEducational and Psychological MeasurementAdditional services and information for
http://epm.sagepub.com/cgi/alertsEmail Alerts:
http://epm.sagepub.com/subscriptionsSubscriptions:
http://www.sagepub.com/journalsReprints.navReprints:
http://www.sagepub.com/journalsPermissions.navPermissions:
http://epm.sagepub.com/content/68/3/443.refs.htmlCitations:
What is This?
- Nov 26, 2007 OnlineFirst Version of Record
- May 6, 2008Version of Record >>
at University of Missouri-Columbia on March 7, 2013epm.sagepub.comDownloaded from
Validity Studies
Self-Efficacy for
Self-Regulated LearningA Validation Study
Ellen L. UsherUniversity of Kentucky
Frank PajaresEmory University
The psychometric properties and multigroup measurement invariance of scores on the
Self-Efficacy for Self-Regulated Learning Scale taken from Bandura’s Children’s
Self-Efficacy Scale were assessed in a sample of 3,760 students from Grades 4 to 11.
Latent means differences were also examined by gender and school level. Results
reveal a unidimensional construct with equivalent factor pattern coefficients for boys
and girls and for students in elementary, middle, and high school. Elementary school
students report higher self-efficacy for self-regulated learning than do students in mid-
dle and high school. The latent factor is related to self-efficacy, self-concept, task goal
orientation, apprehension, and achievement.
Keywords: self-efficacy; self-regulation; self-regulated learning; social cognitive
theory; academic motivation
In his social cognitive theory, Bandura (1986) put forth a model of human func-
tioning in which self-regulatory factors are accorded a central role, and educa-
tional researchers have provided insights over the past two decades about how
these factors operate within learning contexts. Defined by Zimmerman (2002b) as
‘‘the self-directive process by which learners transform their mental abilities into
academic skills’’ (p. 65), self-regulation is a metacognitive process that requires
students to explore their own thought processes so as to evaluate the results of their
actions and plan alternative pathways to success. Successful learners organize their
work, set goals, seek help when needed, use effective work strategies, and manage
their time (Zimmerman, 1998, 2002b; Zimmerman & Bandura, 1994; Zimmerman
& Martinez-Pons, 1986, 1988). Such students act as agents, proactively engaged in
their own development and authors of their academic present and future.
Educational and
Psychological Measurement
Volume 68 Number 3
June 2008 443-463
© 2008 Sage Publications
10.1177/0013164407308475
http://epm.sagepub.com
hosted at
http://online.sagepub.com
Authors’ Note: Please address correspondence to Ellen L. Usher, Educational and Counseling Psychol-
ogy, 249 Dickey Hall, University of Kentucky, Lexington, KY 40506; e-mail: [email protected].
443
at University of Missouri-Columbia on March 7, 2013epm.sagepub.comDownloaded from
A key determinant of whether learners employ self-regulatory strategies rests in
the beliefs they hold about their capabilities to do so (see Zimmerman & Cleary,
2006). Hence, knowing self-regulatory strategies is not enough to ensure their effec-
tive use; students must also possess the belief that they can use them effectively.
This belief in one’s self-regulatory capabilities, or self-efficacy for self-regulated
learning, is an important predictor of students’ successful use of self-regulatory
skills and strategies across academic domains (Bandura, Barbaranelli, Caprara, &
Pastorelli, 1996, 2001; Bandura, Caprara, Barbaranelli, Gerbino, & Pastorelli, 2003;
Bong, 2001; Zimmerman & Bandura, 1994; Zimmerman, Bandura, & Martinez-
Pons, 1992; Zimmerman & Martinez-Pons, 1990). Students’ self-efficacy for self-
regulated learning is also related to motivation and achievement in diverse academic
areas and for students at all levels of schooling (see Bandura, 1997; Pajares, 2007).
For example, it correlates positively with academic self-efficacy and self-concept,
value of school and of particular school subjects, and holding a mastery goal orien-
tation, essay writing, mathematics problem solving, science competence, and overall
grade point average, and it correlates negatively with academic and subject-specific
anxiety and with performance-avoid goal orientation (e.g., Joo, Bong, & Choi,
2000; Pajares, 1996; Pajares & Graham, 1999; Pajares, Miller, & Johnson, 1999;
Pajares & Valiante, 1999, 2002; Usher & Pajares, 2006; Zimmerman & Bandura,
1994; Zimmerman et al., 1992; Zimmerman & Martinez-Pons, 1990).
Gender differences in students’ self-efficacy for self-regulated learning typically
favor female students (Pajares, 2002). For example, Zimmerman and Martinez-
Pons (1990) interviewed students in Grades 5, 8, and 11 and found that girls
displayed more goal-setting and planning strategies, and they kept records and self-
monitored more frequently than did boys. Girls also surpassed boys in their ability
to structure their environment for optimal learning.
Students’ reported use of self-regulatory skills also differ as a function of academic
level. Zimmerman and Martinez-Pons (1990) found that certain self-regulatory learn-
ing strategies (e.g., reviewing texts, help-seeking from adults) declined across the
three grade levels. Other strategies (e.g., record keeping, monitoring, organizing) were
used more frequently by students in Grades 8 and 10 than by students in Grade 5.
Pajares and Valiante (2002) assessed the self-beliefs of students in Grades 3 to 11 and
reported that students’ confidence in their self-regulatory learning strategies decreased
as students progressed from elementary school to high school. This decrease was even
steeper than a similar decrease in students’ academic self-efficacy beliefs.
Assessing Self-Efficacy for Self-Regulated Learning
In their initial examinations of high school students’ use of self-regulated learning
strategies, Zimmerman and Martinez-Pons (1986, 1988) factor analyzed results from
structured interviews and found that students used various self-regulatory learning
444 Educational and Psychological Measurement
at University of Missouri-Columbia on March 7, 2013epm.sagepub.comDownloaded from
strategies that included planning and organizing academic work, structuring a pro-
ductive study environment, overcoming distractions, and participating in class. This
set of strategies in turn became the basis for a self-efficacy for self-regulated learning
scale in Bandura’s Multidimensional Scales of Perceived Self-Efficacy, now pub-
lished as a subset of items in the Children’s Self-Efficacy Scale (CSES; Bandura,
2006), which is composed of 55 items related to many domains of functioning.
Self-efficacy for self-regulated learning items from the CSES have been used in a
number of studies, all of which have relied on Zimmerman and Martinez-Pons’s
(1986, 1988) early analysis of interview data as a sole indicant of content validity
(e.g., Bong, 2001; Pajares, 1996, 2001; Pajares & Valiante, 2002; Zimmerman et al.,
1992). Although, according to guidelines put forth by Henson (2001), these items
have been found to have acceptable stability and internal consistency across indivi-
dual studies, their factor structure has not been sufficiently examined.
For example, measures used by Bandura and his colleagues to assess the effi-
cacy beliefs of European middle school students included 37 items from the CSES
(Bandura et al., 1996, 2001; Pastorelli et al., 2001). Principal components factor
analyses revealed that three factors underlay the items: academic self-efficacy,
social self-efficacy, and self-regulatory efficacy (see Bandura et al., 2001, p. 192).
The items intended to tap self-efficacy for self-regulated learning did not form a
distinct factor. Instead, some were among those representing the academic self-
efficacy factor. Choi, Fuqua, and Griffin (2001, p. 482) subjected the CSES items
to a principal components and principal axis factor analysis and extracted a ‘‘self-
regulated learning efficacy’’ factor comprising 10 items, 9 of which were among
those Bandura (2006) designed to assess self-efficacy for self-regulated learning.
An additional item from the CSES having to do with resisting the temptation to
skip school also loaded on this factor. Similar results were reported by Miller,
Coombs, and Fuqua (1999), though no item-specific information was provided.
Bong (2001) conducted an exploratory factor analysis on the 11 items identified by
Zimmerman et al. (1992) along with 38 other academics-related self-efficacy items
and found that the items tapping self-efficacy for self-regulated learning formed a
distinct factor.
Findings from these analyses offer equivocal support for a unidimensional factor
structure of items tapping self-efficacy for self-regulated learning among middle
grades, high school, and college students, in part because the number of items used
in the studies has varied. In addition, findings have not shed light on how the factor
structure or measures of self-efficacy for self-regulated learning might vary as a
function of gender or school level. The theoretical (Bandura, 1997) and empirical
(see Pajares, 2002) suggestion that female students report higher levels of confi-
dence in their self-regulatory capabilities than do male students may well be a
reflection of latent mean differences, but researchers have not ruled out the possibi-
lity that improper specification of measurement models or factor structure may also
contribute to this difference. Whatever the case, given that constructs in structural
Usher, Pajares / Self-Efficacy for Self-Regulated Learning 445
at University of Missouri-Columbia on March 7, 2013epm.sagepub.comDownloaded from
equation modeling are theoretically free of error, structural equation modeling
techniques can provide a more accurate test of mean differences than have tradi-
tional tests such as MANOVA (Hancock, 1997; Thompson & Green, 2006).
Because students rely on different self-regulatory strategies as they progress
through school, it also seems important to determine whether self-regulatory self-
efficacy is best measured in similar ways across school levels. Determining the
sources of variance underlying differences in group scores on an instrument is a
necessary step in validating obtained scores. Consequently, a multigroup compari-
son that tests the factorial equivalence of self-efficacy for self-regulated learning is
required to substantiate and extend previous findings.
The purpose of the present study was to test the construct validity of items
designed to assess self-efficacy for self-regulated learning by following four sequen-
tial steps. First, we assessed the factor structure of self-efficacy for self-regulated
learning by examining whether a single factor underlay the items. Next, we aimed to
determine whether the measurement model for self-efficacy for self-regulated learning
was invariant across gender and school level (elementary, middle, and high). We use
the term measurement equivalence to refer to the invariant operation of the items
across groups. Third, we tested for latent mean differences in self-efficacy for self-
regulated learning between boys and girls and students in elementary, middle, and
high school. Finally, we sought to test construct and concurrent validity by examining
the relationship between scores on the self-efficacy for self-regulated learning scale
and scores assessing other motivation and achievement constructs often used in aca-
demic research, namely, self-efficacy, self-concept, anxiety, task goal orientation, and
grade point average.
Based on the tenets of social cognitive theory and existing research, we hypothe-
sized that the items designed to measure self-efficacy for self-regulated learning
would form a unidimensional construct and would demonstrate an equivalent struc-
ture for boys and girls and for elementary, middle, and high school students. We
hypothesized an equivalent structure because the self-regulatory practices repre-
sented by the items used to assess self-efficacy for self-regulated learning were pos-
ited by Bandura (1986) to operate beneficially for all students across grade levels
and academic domains (and see Zimmerman, 1998, 2002a). These practices were
completing homework in a timely fashion, studying when there are other interest-
ing things to do, concentrating on school work, remembering information presented
in class and in school books, arranging a place to study at home, motivating oneself
to do school work, and participating in class discussions. Because self-efficacy
theorists (Bandura, 1986; Zimmerman, 1998) have posited that confidence in self-
regulated learning is related to indexes of academic motivation and achievement,
and in concert with research findings (Zimmerman, 2002a), we hypothesized
that self-efficacy for self-regulated learning scores would be positively correlated
with indexes of self-efficacy, self-concept, task goal orientation, and academic
achievement and negatively correlated with indexes of academic anxiety. Because
446 Educational and Psychological Measurement
at University of Missouri-Columbia on March 7, 2013epm.sagepub.comDownloaded from
gender and grade level differences are typically observed in students’ academic
self-efficacy beliefs, we similarly hypothesized such differences in self-regulatory
confidence.
Method and Data Sources
Data were obtained from 3,670 students (1,849 girls and 1,821 boys) who partici-
pated in six studies of academic motivation. They were enrolled in elementary
(Grade 3= 105, Grade 4= 280, Grade 5= 282), middle (Grade 6= 579, Grade 7=868, Grade 8= 592), or high school (Grade 9= 319, Grade 10= 267, Grade 11=313, Grade 12= 65). Students were recruited for participation in studies of science,
writing, and general academic motivation (Britner, 2006; Pajares, 2001; Pajares,
Britner, & Valiante, 2000; Pajares et al., 1999; Pajares & Valiante, 1999; Pajares,
Valiante, & Cheong, 2007). Students were predominantly White, attended schools
in middle-class socioeconomic settings in the suburban northeastern and southern
United States, and ranged in age from 8 to 18 (M = 12:9) years. Because of
researchers’ interest in the development of self-regulated learning skills in middle
school, most investigations of students’ self-efficacy for self-regulated learning have
taken place in middle school settings, hence the large sample size for this subgroup.
Instruments
Instruments were administered in individual classes. Middle and high school
students completed the instrument independently, and the researcher was available
for questions; elementary school students completed it as a researcher read each
item aloud. Although these slightly different administration methods may introduce
a method effect, the researchers felt that younger students who are not yet profi-
cient readers would profit from hearing each item read.
The scale used to assess self-efficacy for self-regulated learning consisted of
items drawn from Bandura’s (2006) CSES that were intended to measure this con-
struct (see p. 326). Of the 11 items provided by Bandura (2006) in his original
Multidimensional Scales of Perceived Self-Efficacy, Pajares and Valiante (1999),
in consultation with classroom teachers, used the seven items that the teachers
believed most accurately assessed the self-regulatory strategies their students typi-
cally engaged to meet their academic needs across subject areas. Excluded, for
example, were items such as ‘‘How well can you take class notes on class instruc-
tion?’’ because, in many classes and at lower academic levels in particular, students
did not take class notes. Another item, ‘‘How well can you use the library for infor-
mation for class assignments?’’ was deemed unsuitable because many teachers
(mathematics teachers, for example) seldom, if ever, had their students use the
Usher, Pajares / Self-Efficacy for Self-Regulated Learning 447
at University of Missouri-Columbia on March 7, 2013epm.sagepub.comDownloaded from
library for information on assignments. The seven items used in this initial study
were subsequently used in future studies.
Students were instructed to ‘‘Read each statement and respond as honestly as
you can’’ by rating from 1, not well at all, to 6, very well, how well they could
carry out the self-regulatory practices identified (see Table 4). Responses thus
represent students’ judgments of their capabilities to engage specific self-regulatory
tasks, which is consistent with guidelines put forth by Bandura (2006) regarding
how best to assess self-efficacy. Across studies, scores on these items have proven
internally consistent, with alpha coefficients ranging from .78 to .84 (Britner &
Pajares, 2006; Pajares & Graham, 1999; Pajares & Valiante, 2002; Usher &
Pajares, 2006). The alpha value obtained for the scores used in the present investi-
gation was .83, which is more than the cutoff of .80 considered reasonable for
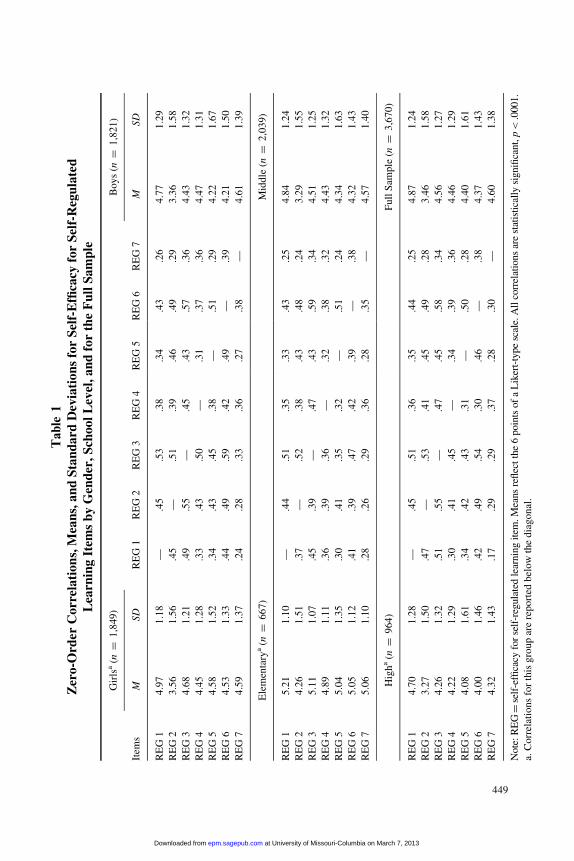
scores in most educational research (see Henson, 2001). Intercorrelations of the
items are provided in Table 1.
Other motivation constructs in this study were measured with items previously
used (with score validation) in studies of academic motivation. The Writing Skills
Self-Efficacy scale consisted of 10 items asking students how sure they were on a
scale from 0 (no chance) to 100 (completely certain) that they could perform speci-
fic writing skills (see Pajares, 2007, for information on construct validity). For
example, students were asked how confident they were that they could ‘‘Correctly
spell all words in a one page story or composition.’’ We obtained an alpha coeffi-
cient of .91 for this scale. All other scales used a 6-point Likert-type format in
which students provided judgments about how true or false they found a particular
statement to be. A five-item measure of Grade Self-Efficacy assessed students’ con-
fidence that they could obtain a certain grade in writing or in science (sample item:
‘‘How confident are you that you will get a grade better than a B?’’). An alpha of
.90 was obtained for this scale in writing; in science, it was .91.
Self-concept was assessed with six items from Marsh’s (1990) widely used Aca-
demic Self Description Questionnaire (sample item: ‘‘Compared to others my age, I
am good at writing’’). We obtained alpha coefficients of .87, .88, and .83 for this
scale in writing, science, and general academics, respectively. Writing apprehension
was measured with a scale used by Pajares et al. (1999) that assesses the anxiety stu-
dents feel when approaching the writing task (sample item: ‘‘I am afraid of writing
essays when I know they will be graded’’). We obtained an alpha of .79 for this
scale. Science anxiety was assessed with three items adapted from the Mathematics
Anxiety Scale (Betz, 1978). We obtained an alpha of .63. Task goal orientation
(e.g., ‘‘I like writing assignments that really make me think’’) was assessed using a
subscale derived from the Patterns of Adaptive Learning Survey (see Midgley et al.,
1996, for validity information). We obtained alpha coefficients of .87 for task goals
in writing, .86 in science, and .85 in general academics. The Life Orientation Test
(Scheier & Carver, 1985) was used to assess optimism (sample item: ‘‘I’m always
optimistic about my future’’). Cronbach’s alpha coefficient for this scale was .83.
448 Educational and Psychological Measurement
at University of Missouri-Columbia on March 7, 2013epm.sagepub.comDownloaded from
Table
1
Zer
o-O
rder
Co
rrel
ati
on
s,M
ean
s,a
nd
Sta
nd
ard
Dev
iati
on
sfo
rS
elf-
Effi
cacy
for
Sel
f-R
egu
late
d
Lea
rnin
gIt
ems
by
Gen
der
,S
cho
ol
Lev
el,
an
dfo
rth
eF
ull
Sa
mp
le
Gir
lsa
(n=
1,8
49
)B
oy
s(n
=1
,821
)
Item
sM
SD
RE
G1
RE
G2
RE
G3
RE
G4
RE
G5
RE
G6
RE
G7
MSD
RE
G1
4.9
71
.18
—.4
5.5
3.3
8.3
4.4
3.2
64
.77
1.2
9
RE
G2
3.5
61
.56
.45
—.5
1.3
9.4
6.4
9.2
93
.36
1.5
8
RE
G3
4.6
81
.21
.49
.55
—.4
5.4
3.5
7.3
64
.43
1.3
2
RE
G4
4.4
51
.28
.33
.43
.50
—.3
1.3
7.3
64
.47
1.3
1
RE
G5
4.5
81
.52
.34
.43
.45
.38
—.5
1.2
94
.22
1.6
7
RE
G6
4.5
31
.33
.44
.49
.59
.42
.49
—.3
94
.21
1.5
0
RE
G7
4.5
91
.37
.24
.28
.33
.36
.27
.38
—4
.61
1.3
9
Ele
men
tary
a(n
=6
67
)M
idd
le(n
=2
,03
9)
RE
G1
5.2
11
.10
—.4
4.5
1.3
5.3
3.4
3.2
54
.84
1.2
4
RE
G2
4.2
61
.51
.37
—.5
2.3
8.4
3.4
8.2
43
.29
1.5
5
RE
G3
5.1
11
.07
.45
.39
—.4
7.4
3.5
9.3
44
.51
1.2
5
RE
G4
4.8
91
.11
.36
.39
.36
—.3
2.3
8.3
24
.43
1.3
2
RE
G5
5.0
41
.35
.30
.41
.35
.32
—.5
1.2
44
.34
1.6
3
RE
G6
5.0
51
.12
.41
.39
.47
.42
.39
—.3
84
.32
1.4
3
RE
G7
5.0
61
.10
.28
.26
.29
.36
.28
.35
—4
.57
1.4
0
Hig
ha
(n=
96
4)
Fu
llS
amp
le(n
=3
,670
)
RE
G1
4.7
01
.28
—.4
5.5
1.3
6.3
5.4
4.2
54
.87
1.2
4
RE
G2
3.2
71
.50
.47
—.5
3.4
1.4
5.4
9.2
83
.46
1.5
8
RE
G3
4.2
61
.32
.51
.55
—.4
7.4
5.5
8.3
44
.56
1.2
7
RE
G4
4.2
21
.29
.30
.41
.45
—.3
4.3
9.3
64
.46
1.2
9
RE
G5
4.0
81
.61
.34
.42
.43
.31
—.5
0.2
84
.40
1.6
1
RE
G6
4.0
01
.46
.42
.49
.54
.30
.46
—.3
84
.37
1.4
3
RE
G7
4.3
21
.43
.17
.29
.29
.37
.28
.30
—4
.60
1.3
8
Note
:R
EG=
self
-effi
cacy
for
self
-reg
ula
ted
lear
nin
git
em.M
eans
refl
ect
the
6poin
tsof
aL
iker
t-ty
pe
scal
e.A
llco
rrel
atio
ns
are
stat
isti
call
ysi
gnifi
cant,
p<
.0001.
a.C
orr
elat
ion
sfo
rth
isg
rou
par
ere
po
rted
bel
ow
the
dia
go
nal
.
449
at University of Missouri-Columbia on March 7, 2013epm.sagepub.comDownloaded from
Perceived authenticity was assessed with a five-item scale drawn from Clance’s
(1985) and Harvey and Katz’s (1985) scales designed to measure inauthenticity and
the impostor syndrome (sample item: ‘‘Sometimes I’m afraid other people will dis-
cover that I’m not very smart’’). Cronbach’s alpha coefficient for this scale was .72.
Several achievement measures were used to establish the concurrent validity of
the self-efficacy for self-regulated learning items. Grade point averages ranging
from 0 to 4 or semester course grades ranging from 0 to 100 were provided by
school administrators. In other cases, teachers were asked to rate students’ writing
competence on a 5-point scale.
Analysis
Descriptive statistics and zero-order correlations were calculated for each of the
variables. Confirmatory factor analysis (CFA) was then used to test a measurement
model of the seven self-efficacy for self-regulated learning items. This model was
tested with six sample groups, one for the full sample and for each subgroup of
interest: boys, girls, elementary school students, middle school students, and high
school students. Because theory and evidence from past research suggests a unidi-
mensional self-efficacy for self-regulation construct, all items were hypothesized to
be a function of a single latent factor, and error terms were hypothesized to be
uncorrelated. In each model, the pattern coefficient from the latent factor to the first
item was constrained to 1.0 to set the scale of measurement.
Because identical model specification for each subgroup does not guarantee
that item measurement is equivalent across groups (Byrne, 1993), we conducted a
series of tests for multigroup invariance by examining three increasingly restric-
tive hierarchical CFA models. Models were run separately by gender and by
school level, and the fit statistics described below were used to verify adequate
model fit before proceeding to subsequent steps (Byrne, 2006; Hancock, 1997;
Thompson & Green, 2006). The first two models were based on analysis of covar-
iance structures; the last model was based on analysis of mean and covariance
structures (Sorbom, 1974). The first baseline model tested for equivalent factor
structure, not taking into account the factor pattern coefficients. This initial test
simply checks the adequacy of model fit in a simultaneous analysis of multigroup
data (e.g., boys and girls) and provides a model by which the subsequent invar-
iance model can be compared. In the second model, factor pattern coefficients
were constrained to be invariant across the groups. We compared the fit of the two
models to determine whether the pattern coefficients were invariant across groups
(Byrne, 2006).
Pursuant to our aim to make inferences about latent mean differences, we used a
structured means approach to test a third model that examined equivalence of inter-
cepts (see Byrne, 2006; Thompson & Green, 2006). This approach allows for simul-
taneous estimation of covariance and mean structures associated with both the latent
450 Educational and Psychological Measurement
at University of Missouri-Columbia on March 7, 2013epm.sagepub.comDownloaded from
and observed variables. In this model, factor pattern coefficients and observed vari-
able intercepts were constrained to be invariant across groups (Thompson & Green,
2006). Error terms were not constrained, and the factor disturbance was freely esti-
mated in each model. The factor intercept for one group was set to 0, which enabled
us to obtain the difference in latent factor means between this reference group and
each comparison group. Positive differences indicate that the comparison group
reported higher self-efficacy for self-regulated learning than did the reference group.
A z-score was then used to test the significance of each latent mean difference.
Effect sizes (see Hancock, 2001; Thompson & Green, 2006) for these differences
were also calculated.
We did not closely examine invariance of variable intercepts for two primary
reasons. First, we believe most researchers and school practitioners likely to make
use of this scale would find it impractical to assess students’ self-reports at the item
level (Bandura, 1997; Pajares, 1997). Second, many researchers have contended,
as did Hancock (1997), that ‘‘if group differences exist on the observed variables
this is presumed to be the direct result of group differences on the underlying
construct’’ (p. 97; see also Millsap, 1998). For this reason we focus our efforts on
examining the latent means in students’ self-regulatory self-efficacy.
We followed guidelines recommended by Bentler (2005) and Byrne (2006) to
assess the fit of all CFA models while aiming for a parsimonious model with sub-
stantive meaning. To this end, we relied on four commonly, used fit indexes to
determine whether the measurement model was equivalent across groups. We used
the chi-square statistic to assess how well the model reproduced the covariance
matrix. Because this statistic is sensitive to sample size, significant values need not
indicate a lack of fit in large samples (see Kline, 2005). We used the comparative
fit index (CFI) to assess model fit compared to a baseline model. Values near 1.0
are optimal, with values greater than .90 indicating acceptable model fit (Kline,
2005). We examined the root mean square error of approximation (RMSEA), for
which a value of 0.0 indicates the best fit between the population covariance matrix
and the covariance matrix implied by the model and estimated with sample data.
Typically, values less than .08 are considered reasonable, with values less than .05
indicating a closer approximate fit (Kline, 2005). We also examined confidence
intervals around this index. Fourth, we examined the standardized root mean square
residual (SRMR), which represents the overall average size of the residuals
between the baseline model and the model tested. According to Byrne (2006), an
SRMR value less than .05 suggests a well-fitting model. To assess the invariance of
pattern coefficients across models, we reviewed changes in fix indexes and para-
meter statistics, which have been shown to provide good comparison between
nested models (Byrne, 2006). Two specific indicators were used as criteria for mea-
surement invariance: a nonsignificant change in chi-square (see French & Finch,
2006) and a change in CFI of less than .01 (Cheung & Rensvold, 2002).
Usher, Pajares / Self-Efficacy for Self-Regulated Learning 451
at University of Missouri-Columbia on March 7, 2013epm.sagepub.comDownloaded from
Results
Means, standard deviations, and zero-order correlations for the seven items assess-
ing self-efficacy for self-regulated learning are reported by subgroup and for the
full sample in Table 1. Students reported relatively high confidence (overall
M = 4:39, SD= 0.99) in their self-regulatory capabilities. As have other researchers
(e.g., Zimmerman et al., 1992), we found that students rated themselves least confi-
dent on the item assessing how well they can ‘‘study when there are other interest-
ing things to do’’ (M = 3:46, SD= 1.58). Across the five subgroups, correlation
coefficients among the items ranged from .17 to .59.
Recall that five separate CFAs were conducted to examine the measurement
models of self-efficacy for self-regulated learning for each subgroup of interest. In
each model we found evidence of substantial multivariate kurtosis as indicated by
Mardia’s normalized estimates greater than 5.0 (see Bentler, 2005), hence we opted
to base all subsequent decisions on robust chi-square indexes and robust versions
of the CFI and RMSEA (readers are referred to Bentler, 2005; Nevitt & Hancock,
2000; Satorra & Bentler, 2001, for further explanation of robust statistics). The
self-efficacy for self-regulated learning measurement models showed adequate
model fit for girls, Satorra–Bentler (S-B) w2 (14)= 69.93, p< :0001, CFI= .98,
RMSEA= .05, SRMR= .03; for boys, S-B w2ð14)= 104.60, p< :0001, CFI= .97,
RMSEA= .06, SRMR= .03; for elementary school students, S-B w2ð14)= 20.72,
p= :11, CFI= .99, RMSEA= .03, SRMR= .03; for middle school students, S-B
w2ð14)= 102.89, p< :0001, CFI= .97, RMSEA= .06, SRMR= .03; and for high
school students, S-B w2ð14)= 71.72, p< :0001, CFI= .96, RMSEA= .07,
SRMR= .04. Consequently, when testing groups for factorial invariance, we speci-
fied the same model for each subgroup.
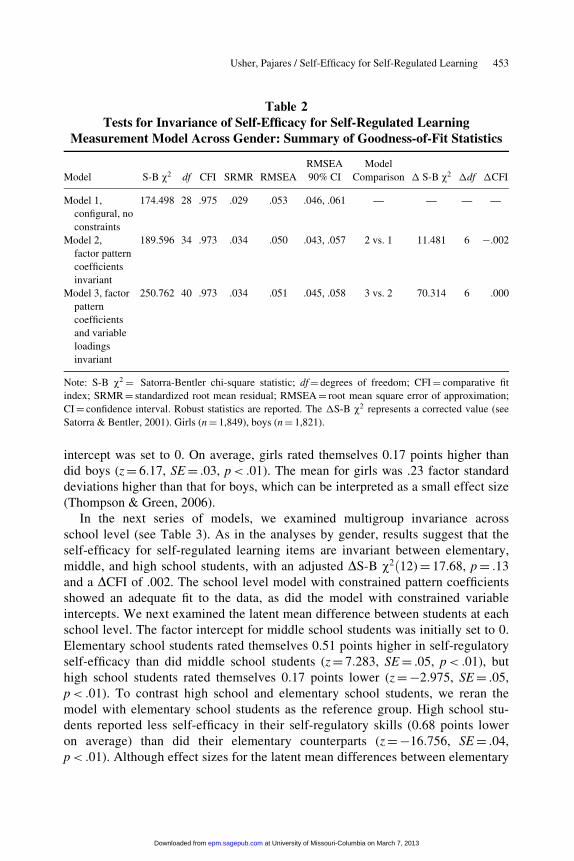
Fit indexes for the models testing invariance across the measurement models by
gender are reported in Table 2. Recall that to assess between-group invariance, we
examined change in fit statistics between the configural or baseline model (i.e., no
constraints) and the model in which factor pattern coefficients were to be equal or
invariant (i.e., constraints imposed). The change in chi-square (Dw2) statistic is
itself distributed as chi-square, but the change in the robust chi-square statistic is
not (Bentler, 2005). For this reason, we used the adjusted DS-B w2 statistic (see
Byrne, 2006, p. 219; Satorra & Bentler, 2001). This adjusted value is chi-square
distributed and easily interpretable. Our findings suggest that the items measuring
self-efficacy for self-regulated learning are invariant for girls versus boys, with an
adjusted DS-B w2ð6)= 11.48, p= :07 and a DCFI of .002. The model with con-
strained factor pattern coefficients for boys and girls showed a good fit to the data.
The model with constrained variable intercepts showed similar fit (see Table 2). To
answer the final question of interest, we examined the latent mean difference
between girls, whose factor intercept was freely estimated, and boys, whose factor
452 Educational and Psychological Measurement
at University of Missouri-Columbia on March 7, 2013epm.sagepub.comDownloaded from
intercept was set to 0. On average, girls rated themselves 0.17 points higher than
did boys (z= 6:17, SE= .03, p< :01). The mean for girls was .23 factor standard
deviations higher than that for boys, which can be interpreted as a small effect size
(Thompson & Green, 2006).
In the next series of models, we examined multigroup invariance across
school level (see Table 3). As in the analyses by gender, results suggest that the
self-efficacy for self-regulated learning items are invariant between elementary,
middle, and high school students, with an adjusted DS-B w2ð12)= 17.68, p= :13
and a DCFI of .002. The school level model with constrained pattern coefficients
showed an adequate fit to the data, as did the model with constrained variable
intercepts. We next examined the latent mean difference between students at each
school level. The factor intercept for middle school students was initially set to 0.
Elementary school students rated themselves 0.51 points higher in self-regulatory
self-efficacy than did middle school students (z= 7:283, SE= .05, p< :01), but
high school students rated themselves 0.17 points lower (z=−2:975, SE= .05,
p< :01). To contrast high school and elementary school students, we reran the
model with elementary school students as the reference group. High school stu-
dents reported less self-efficacy in their self-regulatory skills (0.68 points lower
on average) than did their elementary counterparts (z=−16:756, SE= .04,
p< :01). Although effect sizes for the latent mean differences between elementary
Table 2
Tests for Invariance of Self-Efficacy for Self-Regulated Learning
Measurement Model Across Gender: Summary of Goodness-of-Fit Statistics
Model S-B w2 df CFI SRMR RMSEA
RMSEA
90% CI
Model
Comparison � S-B w2 �df �CFI
Model 1,
configural, no
constraints
174.498 28 .975 .029 .053 .046, .061 — — — —
Model 2,
factor pattern
coefficients
invariant
189.596 34 .973 .034 .050 .043, .057 2 vs. 1 11.481 6 −.002
Model 3, factor
pattern
coefficients
and variable
loadings
invariant
250.762 40 .973 .034 .051 .045, .058 3 vs. 2 70.314 6 .000
Note: S-B w2 = Satorra-Bentler chi-square statistic; df= degrees of freedom; CFI= comparative fit
index; SRMR= standardized root mean residual; RMSEA= root mean square error of approximation;
CI= confidence interval. Robust statistics are reported. The �S-B w2 represents a corrected value (see
Satorra & Bentler, 2001). Girls (n= 1,849), boys (n= 1,821).
Usher, Pajares / Self-Efficacy for Self-Regulated Learning 453
at University of Missouri-Columbia on March 7, 2013epm.sagepub.comDownloaded from
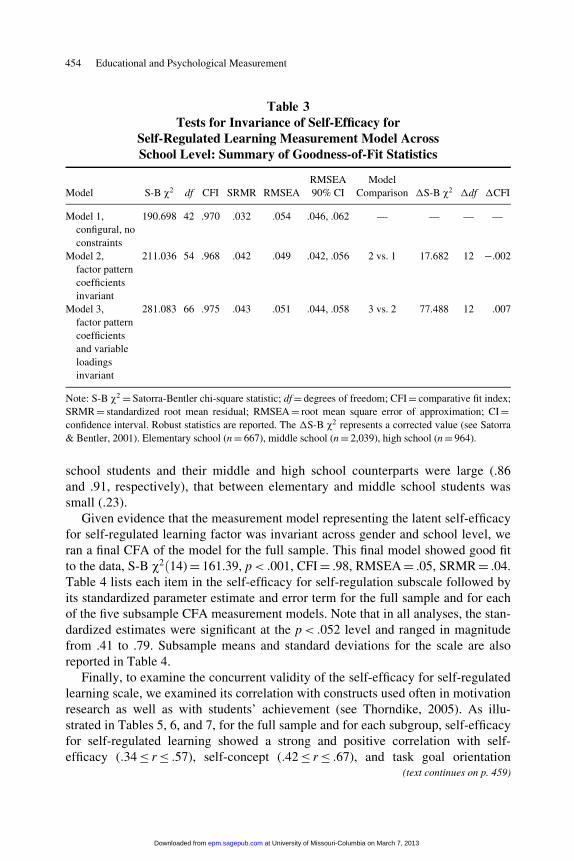
school students and their middle and high school counterparts were large (.86
and .91, respectively), that between elementary and middle school students was
small (.23).
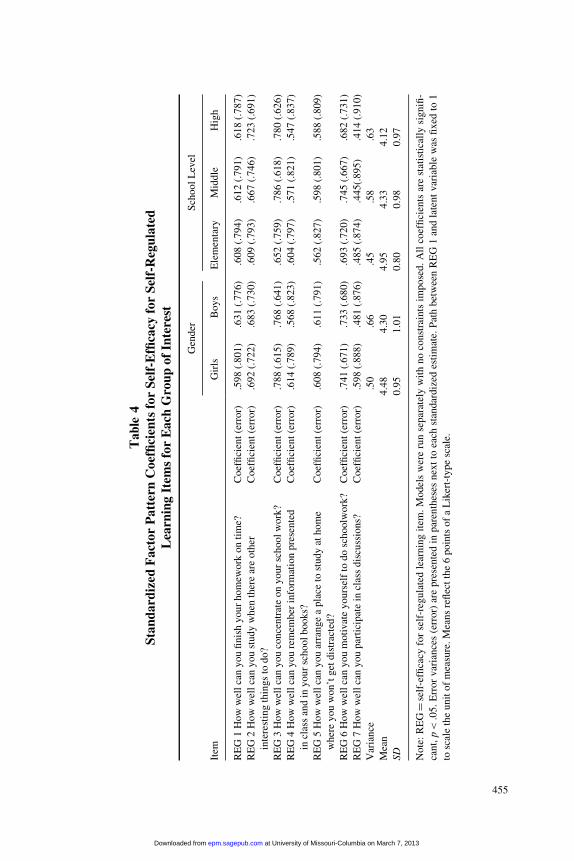
Given evidence that the measurement model representing the latent self-efficacy
for self-regulated learning factor was invariant across gender and school level, we
ran a final CFA of the model for the full sample. This final model showed good fit
to the data, S-B w2ð14)= 161.39, p< :001, CFI= .98, RMSEA= .05, SRMR= .04.
Table 4 lists each item in the self-efficacy for self-regulation subscale followed by
its standardized parameter estimate and error term for the full sample and for each
of the five subsample CFA measurement models. Note that in all analyses, the stan-
dardized estimates were significant at the p< :052 level and ranged in magnitude
from .41 to .79. Subsample means and standard deviations for the scale are also
reported in Table 4.
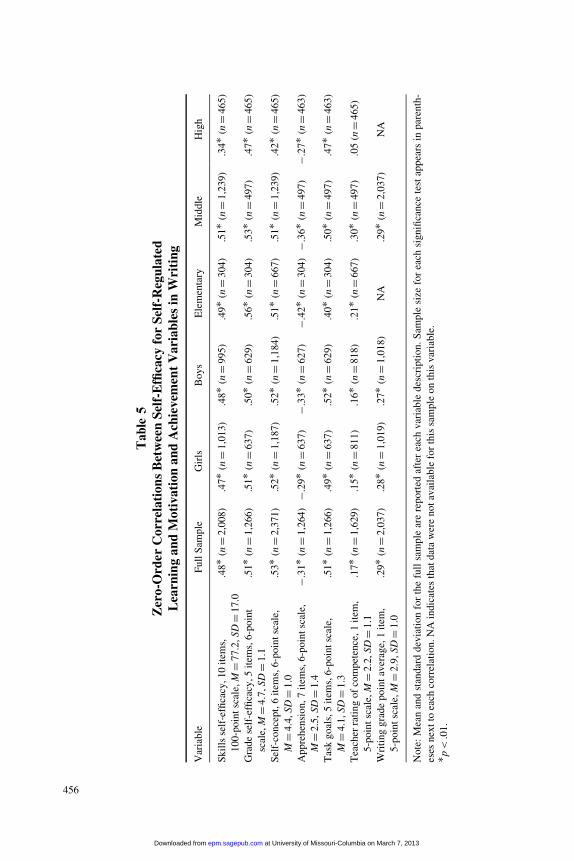
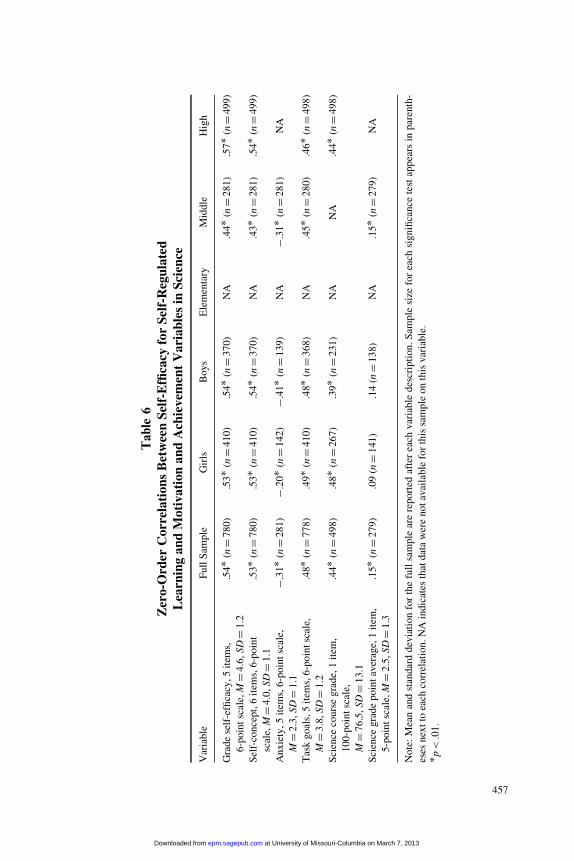
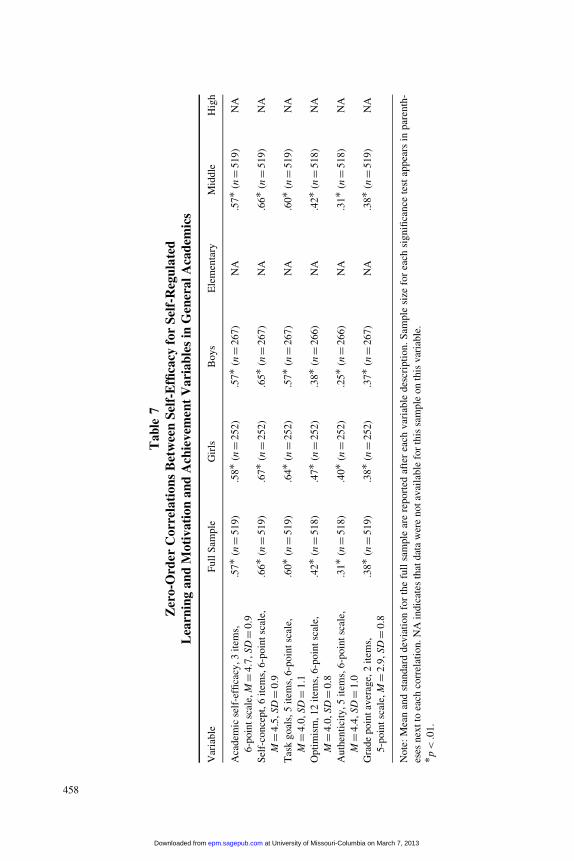
Finally, to examine the concurrent validity of the self-efficacy for self-regulated
learning scale, we examined its correlation with constructs used often in motivation
research as well as with students’ achievement (see Thorndike, 2005). As illu-
strated in Tables 5, 6, and 7, for the full sample and for each subgroup, self-efficacy
for self-regulated learning showed a strong and positive correlation with self-
efficacy (:34≤ r ≤ :57), self-concept (:42≤ r ≤ :67), and task goal orientation
Table 3
Tests for Invariance of Self-Efficacy for
Self-Regulated Learning Measurement Model Across
School Level: Summary of Goodness-of-Fit Statistics
Model S-B w2 df CFI SRMR RMSEA
RMSEA
90% CI
Model
Comparison �S-B w2 �df �CFI
Model 1,
configural, no
constraints
190.698 42 .970 .032 .054 .046, .062 — — — —
Model 2,
factor pattern
coefficients
invariant
211.036 54 .968 .042 .049 .042, .056 2 vs. 1 17.682 12 −.002
Model 3,
factor pattern
coefficients
and variable
loadings
invariant
281.083 66 .975 .043 .051 .044, .058 3 vs. 2 77.488 12 .007
Note: S-B w2 =Satorra-Bentler chi-square statistic; df= degrees of freedom; CFI= comparative fit index;
SRMR= standardized root mean residual; RMSEA= root mean square error of approximation; CI=confidence interval. Robust statistics are reported. The �S-B w2 represents a corrected value (see Satorra
& Bentler, 2001). Elementary school (n= 667), middle school (n= 2,039), high school (n= 964).
(text continues on p. 459)
454 Educational and Psychological Measurement
at University of Missouri-Columbia on March 7, 2013epm.sagepub.comDownloaded from
Table
4
Sta
nd
ard
ized
Fa
cto
rP
att
ern
Co
effi
cien
tsfo
rS
elf-
Effi
cacy
for
Sel
f-R
egu
late
d
Lea
rnin
gIt
ems
for
Ea
chG
rou
po
fIn
tere
st
Gen
der
Sch
oo
lL
evel
Item
Gir
lsB
oys
Ele
men
tary
Mid
dle
Hig
h
RE
G1
Ho
ww
ell
can
yo
ufi
nis
hy
ou
rh
om
ewo
rko
nti
me?
Co
effi
cien
t(e
rro
r).5
98
(.8
01
).6
31
(.7
76
).6
08
(.7
94
).6
12
(.7
91
).6
18
(.7
87
)
RE
G2
Ho
ww
ell
can
yo
ust
ud
yw
hen
ther
ear
eo
ther
inte
rest
ing
thin
gs
tod
o?
Coef
fici
ent
(err
or)
.692
(.722)
.683
(.730)
.609
(.793)
.667
(.746)
.723
(.691)
RE
G3
Ho
ww
ell
can
yo
uco
nce
ntr
ate
on
yo
ur
sch
oo
lw
ork
?C
oef
fici
ent
(err
or)
.78
8(.
61
5)
.76
8(.
64
1)
.65
2(.
75
9)
.78
6(.
61
8)
.78
0(.
62
6)
RE
G4
Ho
ww
ell
can
yo
ure
mem
ber
info
rmat
ion
pre
sen
ted
incl
ass
and
iny
ou
rsc
ho
ol
bo
ok
s?
Coef
fici
ent
(err
or)
.614
(.789)
.568
(.823)
.604
(.797)
.571
(.821)
.547
(.837)
RE
G5
Ho
ww
ell
can
yo
uar
ran
ge
ap
lace
tost
ud
yat
ho
me
wher
eyou
won’t
get
dis
trac
ted?
Coef
fici
ent
(err
or)
.608
(.794)
.611
(.791)
.562
(.827)
.598
(.801)
.588
(.809)
RE
G6
Ho
ww
ell
can
yo
um
oti
vat
ey
ou
rsel
fto
do
sch
oolw
ork
?C
oef
fici
ent
(err
or)
.74
1(.
67
1)
.73
3(.
68
0)
.69
3(.
72
0)
.74
5(.
66
7)
.68
2(.
73
1)
RE
G7
Ho
ww
ell
can
yo
up
arti
cip
ate
incl
ass
dis
cuss
ion
s?C
oef
fici
ent
(err
or)
.59
8(.
88
8)
.48
1(.
87
6)
.48
5(.
87
4)
.44
5(.
89
5)
.41
4(.
91
0)
Var
ian
ce.5
0.6
6.4
5.5
8.6
3
Mea
n4
.48
4.3
04
.95
4.3
34
.12
SD
0.9
51
.01
0.8
00
.98
0.9
7
No
te:
RE
G=
self
-effi
cacy
for
self
-reg
ula
ted
lear
nin
git
em.
Mo
del
sw
ere
run
sep
arat
ely
wit
hn
oco
nst
rain
tsim
po
sed
.A
llco
effi
cien
tsar
est
atis
tica
lly
sig
nifi
-
cant,
p<
.05
.E
rro
rv
aria
nce
s(e
rro
r)ar
ep
rese
nte
din
par
enth
eses
nex
tto
each
stan
dar
diz
edes
tim
ate.
Pat
hb
etw
een
RE
G1
and
late
nt
var
iab
lew
asfi
xed
to1
tosc
ale
the
un
ito
fm
easu
re.
Mea
ns
refl
ect
the
6p
oin
tso
fa
Lik
ert-
typ
esc
ale.
455
at University of Missouri-Columbia on March 7, 2013epm.sagepub.comDownloaded from
Table
5
Zer
o-O
rder
Co
rrel
ati
on
sB
etw
een
Sel
f-E
ffica
cyfo
rS
elf-
Reg
ula
ted
Lea
rnin
ga
nd
Mo
tiv
ati
on
an
dA
chie
vem
ent
Va
ria
ble
sin
Wri
tin
g
Var
iable
Full
Sam
ple
Gir
lsB
oys
Ele
men
tary
Mid
dle
Hig
h
Sk
ills
self
-effi
cacy
,1
0it
ems,
10
0-p
oin
tsc
ale,
M=
77
.2,S
D=
17
.0
.48∗ (
n=
2,0
08
).4
7∗ (
n=
1,0
13
).4
8∗ (
n=
99
5)
.49∗ (
n=
30
4)
.51∗ (
n=
1,2
39
).3
4∗ (
n=
46
5)
Gra
de
self
-effi
cacy
,5
item
s,6
-po
int
scal
e,M=
4.7
,S
D=
1.1
.51∗ (
n=
1,2
66
).5
1∗ (
n=
63
7)
.50∗ (
n=
62
9)
.56∗ (
n=
30
4)
.53∗ (
n=
49
7)
.47∗ (
n=
46
5)
Sel
f-co
nce
pt,
6it
ems,
6-p
oin
tsc
ale,
M=
4.4
,S
D=
1.0
.53∗ (
n=
2,3
71
).5
2∗ (
n=
1,1
87
).5
2∗ (
n=
1,1
84
).5
1∗ (
n=
66
7)
.51∗ (
n=
1,2
39
).4
2∗ (
n=
46
5)
Ap
pre
hen
sio
n,7
item
s,6
-po
int
scal
e,
M=
2.5
,S
D=
1.4
−.3
1∗ (
n=
1,2
64
)−.
29∗ (
n=
63
7)
−.3
3∗ (
n=
62
7)
−.4
2∗ (
n=
30
4)
−.3
6∗ (
n=
49
7)
−.2
7∗ (
n=
46
3)
Tas
kg
oal
s,5
item
s,6
-po
int
scal
e,
M=
4.1
,S
D=
1.3
.51∗ (
n=
1,2
66
).4
9∗ (
n=
63
7)
.52∗ (
n=
62
9)
.40∗ (
n=
30
4)
.50∗ (
n=
49
7)
.47∗ (
n=
46
3)
Tea
cher
rati
ng
of
com
pet
ence
,1
item
,
5-p
oin
tsc
ale,
M=
2.2
,S
D=
1.1
.17∗ (
n=
1,6
29
).1
5∗ (
n=
81
1)
.16∗ (
n=
81
8)
.21∗ (
n=
66
7)
.30∗ (
n=
49
7)
.05
(n=
46
5)
Wri
tin
gg
rad
ep
oin
tav
erag
e,1
item
,
5-p
oin
tsc
ale,
M=
2.9
,S
D=
1.0
.29∗ (
n=
2,0
37
).2
8∗ (
n=
1,0
19
).2
7∗ (
n=
1,0
18
)N
A.2
9∗ (
n=
2,0
37
)N
A
No
te:
Mea
nan
dst
andar
dd
evia
tio
nfo
rth
efu
llsa
mp
lear
ere
po
rted
afte
rea
chv
aria
ble
des
crip
tio
n.
Sam
ple
size
for
each
sign
ifica
nce
test
app
ears
inpar
enth
-
eses
nex
tto
each
corr
elat
ion
.N
Ain
dic
ates
that
dat
aw
ere
no
tav
aila
ble
for
this
sam
ple
on
this
var
iab
le.
∗ p<
.01
.
456
at University of Missouri-Columbia on March 7, 2013epm.sagepub.comDownloaded from
Table
6
Zer
o-O
rder
Co
rrel
ati
on
sB
etw
een
Sel
f-E
ffica
cyfo
rS
elf-
Reg
ula
ted
Lea
rnin
ga
nd
Mo
tiv
ati
on
an
dA
chie
vem
ent
Va
ria
ble
sin
Sci
ence
Var
iable
Full
Sam
ple
Gir
lsB
oys
Ele
men
tary
Mid
dle
Hig
h
Gra
de
self
-effi
cacy
,5
item
s,
6-p
oin
tsc
ale,
M=
4.6
,S
D=
1.2
.54∗ (
n=
78
0)
.53∗ (
n=
41
0)
.54∗ (
n=
37
0)
NA
.44∗ (
n=
28
1)
.57∗ (
n=
49
9)
Sel
f-co
nce
pt,
6it
ems,
6-p
oin
t
scal
e,M=
4.0
,S
D=
1.1
.53∗ (
n=
78
0)
.53∗ (
n=
41
0)
.54∗ (
n=
37
0)
NA
.43∗ (
n=
28
1)
.54∗ (
n=
49
9)
An
xie
ty,5
item
s,6
-po
int
scal
e,
M=
2.3
,S
D=
1.1
−.3
1∗ (
n=
28
1)
−.2
0∗ (
n=
14
2)
−.4
1∗ (
n=
13
9)
NA
−.3
1∗ (
n=
28
1)
NA
Tas
kg
oal
s,5
item
s,6
-po
int
scal
e,
M=
3.8
,S
D=
1.2
.48∗ (
n=
77
8)
.49∗ (
n=
41
0)
.48∗ (
n=
36
8)
NA
.45∗ (
n=
28
0)
.46∗ (
n=
49
8)
Sci
ence
cou
rse
gra
de,
1it
em,
10
0-p
oin
tsc
ale,
M=
76
.5,
SD=
13
.1
.44∗ (
n=
49
8)
.48∗ (
n=
26
7)
.39∗ (
n=
23
1)
NA
NA
.44∗ (
n=
49
8)
Sci
ence
gra
de
po
int
aver
age,
1it
em,
5-p
oin
tsc
ale,
M=
2.5
,S
D=
1.3
.15∗ (
n=
27
9)
.09
(n=
14
1)
.14
(n=
13
8)
NA
.15∗ (
n=
27
9)
NA
No
te:
Mea
nan
dst
andar
dd
evia
tio
nfo
rth
efu
llsa
mp
lear
ere
po
rted
afte
rea
chv
aria
ble
des
crip
tion
.S
amp
lesi
zefo
rea
chsi
gn
ifica
nce
test
app
ears
inpar
enth
-
eses
nex
tto
each
corr
elat
ion
.N
Ain
dic
ates
that
dat
aw
ere
no
tav
aila
ble
for
this
sam
ple
on
this
var
iab
le.
∗ p<
.01
.
457
at University of Missouri-Columbia on March 7, 2013epm.sagepub.comDownloaded from
Table
7
Zer
o-O
rder
Co
rrel
ati
on
sB
etw
een
Sel
f-E
ffica
cyfo
rS
elf-
Reg
ula
ted
Lea
rnin
ga
nd
Mo
tiv
ati
on
an
dA
chie
vem
ent
Va
ria
ble
sin
Gen
era
lA
cad
emic
s
Var
iable
Full
Sam
ple
Gir
lsB
oys
Ele
men
tary
Mid
dle
Hig
h
Aca
dem
icse
lf-e
ffica
cy,3
item
s,
6-p
oin
tsc
ale,
M=
4.7
,S
D=
0.9
.57∗ (
n=
51
9)
.58∗ (
n=
25
2)
.57∗ (
n=
26
7)
NA
.57∗ (
n=
51
9)
NA
Sel
f-co
nce
pt,
6it
ems,
6-p
oin
tsc
ale,
M=
4.5
,S
D=
0.9
.66∗ (
n=
51
9)
.67∗ (
n=
25
2)
.65∗ (
n=
26
7)
NA
.66∗ (
n=
51
9)
NA
Tas
kg
oal
s,5
item
s,6
-po
int
scal
e,
M=
4.0
,S
D=
1.1
.60∗ (
n=
51
9)
.64∗ (
n=
25
2)
.57∗ (
n=
26
7)
NA
.60∗ (
n=
51
9)
NA
Op
tim
ism
,1
2it
ems,
6-p
oin
tsc
ale,
M=
4.0
,S
D=
0.8
.42∗ (
n=
51
8)
.47∗ (
n=
25
2)
.38∗ (
n=
26
6)
NA
.42∗ (
n=
51
8)
NA
Au
then
tici
ty,5
item
s,6
-po
int
scal
e,
M=
4.4
,S
D=
1.0
.31∗ (
n=
51
8)
.40∗ (
n=
25
2)
.25∗ (
n=
26
6)
NA
.31∗ (
n=
51
8)
NA
Gra
de
po
int
aver
age,
2it
ems,
5-p
oin
tsc
ale,
M=
2.9
,S
D=
0.8
.38∗ (
n=
51
9)
.38∗ (
n=
25
2)
.37∗ (
n=
26
7)
NA
.38∗ (
n=
51
9)
NA
No
te:
Mea
nan
dst
andar
dd
evia
tio
nfo
rth
efu
llsa
mple
are
repo
rted
afte
rea
chv
aria
ble
des
crip
tion
.S
amp
lesi
zefo
rea
chsi
gn
ifica
nce
test
app
ears
inpar
enth
-
eses
nex
tto
each
corr
elat
ion
.N
Ain
dic
ates
that
dat
aw
ere
no
tav
aila
ble
for
this
sam
ple
on
this
var
iab
le.
∗ p<
.01
.
458
at University of Missouri-Columbia on March 7, 2013epm.sagepub.comDownloaded from
(:40≤ r ≤ :60) across subject areas. Self-regulatory self-efficacy was also positively
associated with an optimistic outlook and with feelings of authenticity (:25≤r ≤ :47) and negatively associated with apprehension and anxiety (−:42≤ r ≤−:20). In addition, self-efficacy for self-regulated learning was positively related to
achievement in writing, science, and in general academics. All correlations were of
magnitude and direction consistent with theoretical expectations.
Discussion
Our objective was to examine the factorial structure and invariance of a self-
efficacy for self-regulated learning measure that has been used in a number of
investigations but which has not yet been subjected to the more rigorous validation
procedures that CFA offers. As we hypothesized, the items used to measure self-
efficacy for self-regulated learning formed a unidimensional construct and demon-
strated an equivalent structure for boys and for girls, and for elementary, middle,
and high school students. Thus, we believe the items provide a sound measure
with which researchers can continue to assess students’ beliefs about their self-
regulatory capabilities. Correlations between scores on this subscale and those on
related motivation variables and achievement further demonstrate construct and
concurrent validity.
It is likely that, as with other self-efficacy measures, self-efficacy for self-
regulated learning will prove maximally predictive when it is measured in a man-
ner that is specific to the academic task at hand. As Zimmerman (1998) pointed
out, ‘‘self-regulation is no longer viewed as a fixed characteristic of students but
rather as context-specific processes that are selectively used to succeed in school’’
(p. 74). One recommendation for future research would be to tailor self-efficacy
for self-regulated learning items to match the academic context under study. This
could either be achieved by adding the academic subject to each item (e.g., How
well can you finish your science homework on time?) or by using only those items
that pertain to the particular course under investigation. Modification to these
scales would of course require additional evidence of construct validity.
An additional aim of our study was to test whether the latent factor means repre-
senting self-efficacy for self-regulated learning differ for boys and girls and for stu-
dents at different school levels. Our findings corroborate previous findings that
students report decreasing confidence in their self-regulatory capabilities as they
progress through school. In lower grades, many academic tasks and activities are
structured, guided, and closely monitored so as to instruct and instill the self-
regulatory habits that will serve youngsters for years ahead. As students approach
high school, they face more demanding academic work that is no longer chaper-
oned by external aids. Older students are often expected to regulate their academic
Usher, Pajares / Self-Efficacy for Self-Regulated Learning 459
at University of Missouri-Columbia on March 7, 2013epm.sagepub.comDownloaded from
work and study habits on their own, and many lose confidence when their self-
regulatory skills are exercised in these new and challenging ways. In fact, high
school students reported significantly less confidence in their self-regulatory skills
than did middle or elementary school students. We believe that these findings war-
rant attention from teachers and school practitioners whose task it is to help adoles-
cents learn to organize and regulate their academic lives effectively. Gaskill and
Woolfolk Hoy (2002) have warned that lack of self-regulation can prove discoura-
ging to students. Indeed, poor self-regulation can result in learned helplessness,
especially for students with physical, emotional, or intellectual challenges.
Continued assessment of students’ self-efficacy beliefs for self-regulated learn-
ing can provide important insights about students’ academic motivation, behavior,
and future choices. In many cases, unrealistically low self-efficacy, not lack of
capability, can be responsible for maladaptive academic habits and behaviors, as
well as for diminishing school interest and achievement. This is perhaps more true
in the area of self-regulation than it is in other areas, for self-regulatory processes
are essential for effective functioning not only in school but in the world at large
(Zimmerman, 1998). Students who lack confidence in their capability to self-
regulate their learning are less likely to implement adaptive strategies, and they
will more quickly give up in the face of difficulty. In such cases, teachers must
work to identify their students’ inaccurate self-beliefs and design and implement
interventions to challenge them. When problematically low self-efficacy is identi-
fied, students can be helped to develop a better understanding of their potential to
succeed at regulating their own work. Often, this low self-efficacy is because of
an inaccurate understanding of what skills a task or activity demands. In such
cases, young people can be helped to better understand what abilities and skills a
course of action will actually require. Identifying, challenging, and altering low
self-efficacy is essential to successful and adaptive functioning.
References
Bandura, A. (1986). Social foundations of thought and action: A social cognitive theory. Englewood
Cliffs, NJ: Prentice Hall.
Bandura, A. (1997). Self-efficacy: The exercise of control. New York: Freeman.
Bandura, A. (2006). Guide for constructing self-efficacy scales. In F. Pajares & T. Urdan (Eds.), Adoles-
cence and education, Vol. 5: Self-efficacy beliefs of adolescents (pp. 307-337). Greenwich, CT:
Information Age.
Bandura, A., Barbaranelli, C., Caprara, G. V., & Pastorelli, C. (1996). Multifaceted impact of self-
efficacy beliefs on academic functioning. Child Development, 67, 1206-1222.
Bandura, A., Barbaranelli, C., Caprara, G. V., & Pastorelli, C. (2001). Self-efficacy beliefs as shapers of
children’s aspirations and career trajectories. Child Development, 72, 187-206.
Bandura, A., Caprara, G. V., Barbaranelli, C., Gerbino, M., & Pastorelli, C. (2003). Role of affective self-
regulatory efficacy in diverse spheres of psychosocial functioning. Child Development, 74, 769-782.
Bentler, P. M. (2005). EQS 6 structural equations program manual. Encino, CA: Multivariate Software.
460 Educational and Psychological Measurement
at University of Missouri-Columbia on March 7, 2013epm.sagepub.comDownloaded from
Betz, N. E. (1978). Prevalence, distribution, and correlates of math anxiety in college students. Journal
of Counseling Psychology, 25, 441-448.
Bong, M. (2001). Role of self-efficacy and task-value in predicting college students’ course performance
and future enrollment intentions. Contemporary Educational Psychology, 26, 553-570.
Britner, S. L. (2006). [Self-efficacy for self-regulated learning beliefs of high school science students].
Unpublished raw data.
Britner, S. L., & Pajares, F. (2006). Sources of science self-efficacy beliefs of middle school students.
Journal for Research in Science Teaching, 43, 485-499.
Byrne, B. M. (1993). The Maslach Inventory: Testing for factorial validity and invariance across ele-
mentary, intermediate, and secondary teachers. Journal of Occupational and Organizational
Psychology, 66, 197-212.
Byrne, B. M. (2006). Structural equation modeling with EQS: Basic concepts, applications, and
programming (2nd ed.). Mahwah, NJ: Lawrence Erlbaum.
Cheung, G. W., & Rensvold, R. B. (2002). Evaluating goodness-of-fit indexes for testing measurement
invariance. Structural Equation Modeling: A Multidisciplinary Journal, 9, 233-255.
Choi, N., Fuqua, D. R., & Griffin, B. W. (2001). Exploratory analysis of the structure of scores from the
Multidimensional Scales of Perceived Self-Efficacy. Educational and Psychological Measurement,
61, 475-489.
Clance, P. R. (1985). The impostor phenomenon. Atlanta, GA: Peachtree.
French, B. F., & Finch, W. H. (2006). Confirmatory factor analytic procedures for the determination of
measurement invariance. Structural Equation Modeling: A Multidisciplinary Journal, 13, 378-402.
Gaskill, P. J., & Woolfolk Hoy, A. (2002). Self-efficacy and self-regulated learning: The dynamic duo in
school performance. In J. Aronson (Ed.), Improving academic achievement: Impact of psychological
factors on education (pp. 185-208). San Diego, CA: Academic Press.
Hancock, G. R. (1997). Structural equation modeling methods of hypothesis testing of latent variable
means. Measurement and Evaluation in Counseling and Development, 30, 91-105.
Hancock, G. R. (2001). Effect size, power, and sample size determination for structured means modeling
and mimic approaches to between-groups hypothesis testing of means on a single latent construct.
Psychometrika, 66, 373-388.
Harvey, J. C., & Katz, C. (1985). If I’m so successful, why do I feel like a fake: The imposter phenom-
enon. New York: Random House.
Henson, R. K. (2001). Understanding internal consistency reliability estimates: A conceptual primer on
coefficient alpha. Measurement and Evaluation in Counseling and Development, 34, 177-189.
Joo, Y.-J., Bong, M., & Choi, H.-J. (2000). Self-efficacy for self-regulated learning, academic self-
efficacy, and Internet self-efficacy in Web-based instruction. Educational Technology Research and
Development, 48(2), 5-17.
Kline, R. B. (2005). Principles and practice of structural equation modeling (2nd ed.). New York:
Guilford.
Marsh, H. W. (1990). The structure of academic self-concept: The Marsh-Shavelson model. Journal of
Educational Psychology, 82, 623-636.
Midgley, C., Maehr, M., Hicks, L., Roeser, R., Urdan, T., Anderman, E., & Kaplan, A. (1996). Patterns
of Adaptive Learning Survey (PALS). Ann Arbor, MI: Center for Leadership and Learning.
Miller, J. W., Coombs, W. T., & Fuqua, D. R. (1999). An examination of psychometric properties of
Bandura’s Multidimensional Scales of Perceived Self-Efficacy. Measurement and Evaluation in
Counseling and Development, 31, 186-197.
Millsap, R. E. (1998). Group differences in regression intercepts: Implications for factorial invariance.
Multivariate Behavioral Research, 33, 403-424.
Nevitt, J., & Hancock, G. R. (2000). Improving the root mean square error of approximation for nonnor-
mal conditions in structural equation modeling. Journal of Experimental Education, 68, 251-268.
Usher, Pajares / Self-Efficacy for Self-Regulated Learning 461
at University of Missouri-Columbia on March 7, 2013epm.sagepub.comDownloaded from
Pajares, F. (1996). Role of self-efficacy beliefs in the mathematical problem-solving of gifted students.
Contemporary Educational Psychology, 21, 325-344.
Pajares, F. (1997). Current directions in self-efficacy research. In M. Maehr & P. R. Pintrich (Eds.).
Advances in motivation and achievement. (Vol. 10, pp. 1-49). Greenwich, CT: JAI.
Pajares, F. (2001). Toward a positive psychology of academic motivation. Journal of Educational
Research, 95, 27-35.
Pajares, F. (2002). Gender and perceived self-efficacy in self-regulated learning. Theory Into Practice,
41, 116-125.
Pajares, F. (2007). Empirical properties of a scale to assess writing self-efficacy in school contexts. Mea-
surement and Evaluation in Counseling and Development, 39, 239-249.
Pajares, F. (2007). Motivational role of self-efficacy beliefs in self-regulated learning. In B. J.
Zimmerman & D. H. Schunk (Eds.), Motivation and self-regulated learning: Theory, research, and
applications (pp. 111 - 140). New York: Erlbaum.
Pajares, F., Britner, S. L., & Valiante, G. (2000). Relation between achievement goals and self-beliefs of
middle school students in writing and science. Contemporary Educational Psychology, 25, 406-422.
Pajares, F., & Graham, L. (1999). Self-efficacy, motivation constructs, and mathematics performance of
entering middle school students. Contemporary Educational Psychology, 24, 124-139.
Pajares, F., Miller, M. D., & Johnson, M. J. (1999). Gender differences in writing self-beliefs of elemen-
tary school students. Journal of Educational Psychology, 91, 50-61.
Pajares, F., & Valiante, G. (1999). Grade level and gender differences in the writing self-beliefs of mid-
dle school students. Contemporary Educational Psychology, 24, 390-405.
Pajares, F., & Valiante, G. (2002). Students’ self-efficacy in their self-regulated learning strategies: A
developmental perspective. Psychologia, 45, 211-221.
Pajares, F., Valiante, G., & Cheong, Y. F. (2007). Writing self-efficacy and its relation to gender, writing
motivation, and writing competence: A developmental perspective. In G. Rijlaarsdam (Series Ed.)
and P. Boscolo & S. Hidi (Volume Eds.), Studies in writing, Vol. 19: Writing and motivation
(pp. 141-159). Oxford, UK: Elsevier.
Pastorelli, C., Caprara, G. V., Barbaranelli, C., Rola, J., Rozsa, S., & Bandura, A. (2001). Structure of
children’s perceived self-efficacy: A cross-national study. European Journal of Psychological Assess-
ment, 17, 87-97.
Satorra, A., & Bentler, P. M. (2001). A scaled difference chi-square test statistic for moment structure
analysis. Psychometrika, 66, 507-514.
Scheier, M. F., & Carver, C. S. (1985). Optimism, coping, and health: Assessment and implications of
generalized outcome expectancies. Health Psychology, 4, 219-247.
Sorbom, D. (1974). A general method for studying differences in factor means and factor structures
between groups. British Journal of Mathematical and Statistical Psychology, 27, 229-239.
Thompson, M. S. & Green, S. B. (2006). Evaluating between-group differences in latent variable
means. In G. R. Hancock & R. O. Mueller (Eds.), A second course in structural equation modeling
(pp. 119-169). Greenwich, CT: Information Age.
Thorndike, R. M. (2005). Measurement and evaluation in psychology and education. Upper Saddle
River, NJ: Pearson.
Usher, E. L., & Pajares, F. (2006). Sources of academic and self-regulatory efficacy beliefs of entering
middle school students. Contemporary Educational Psychology, 31, 125-141.
Zimmerman, B. J. (1998). Academic studying and the development of personal skill: A self-regulatory
perspective. Educational Psychologist, 33, 73-86.
Zimmerman, B. J. (2002a). Achieving self-regulation: The trial and triumph of adolescence. In F. Pajares
& T. C. Urdan (Eds.), Adolescence and education, Vol. 2: Academic motivation of adolescents
(pp. 1-27). Greenwich, CT: Information Age.
Zimmerman, B. J. (2002b). Becoming a self-regulated learner: An overview. Theory Into Practice, 41,
64-70.
462 Educational and Psychological Measurement
at University of Missouri-Columbia on March 7, 2013epm.sagepub.comDownloaded from
Zimmerman, B. J., & Bandura, A. (1994). Impact of self-regulatory influences on writing course attain-
ment. American Educational Research Journal, 31, 845-862.
Zimmerman, B. J., Bandura, A., & Martinez-Pons, M. (1992). Self-motivation for academic attainment:
The role of self-efficacy beliefs and personal goal setting. American Educational Research Journal,
29, 663-676.
Zimmerman, B. J., & Cleary, T. J. (2006). Adolescents’ development of personal agency. In
F. Pajares & T. Urdan (Eds.), Adolescence and education, Vol. 5: Self-efficacy beliefs of adoles-
cents (pp. 45-69). Greenwich, CT: Information Age.
Zimmerman, B. J., & Martinez-Pons, M. (1986). Development of a structured interview for assessing stu-
dent use of self-regulated learning strategies. American Educational Research Journal, 23, 614-628.
Zimmerman, B. J., & Martinez-Pons, M. (1988). Construct validation of a strategy model of student
self-regulated learning. Journal of Educational Psychology, 80, 284-290.
Zimmerman, B. J., & Martinez-Pons, M. (1990). Student differences in self-regulated learning: Relating
grade, sex, and giftedness to self-efficacy and strategy use. Journal of Educational Psychology, 82,
51-59.
Usher, Pajares / Self-Efficacy for Self-Regulated Learning 463
at University of Missouri-Columbia on March 7, 2013epm.sagepub.comDownloaded from