self-organizing process and cluster network in the game of life
TRANSCRIPT

Self-Organizing Process and Cluster Network in the Game of Life
Yoshihiko Kayama and Yasumasa Imamura
Department of Media and Information, BAIKA Women’s University2-19-5 Shukuno-sho, Ibaraki 567-8578, Osaka, Japan
Abstract
Conway’s Game of Life, which is one of the most studied cel-lular automata, contains a self-organized rest state with resid-ual clusters of live cells including the well-known patternslike Block and Beehive. The present article aims to discussthe self-organizing process from the viewpoint of a networkrepresentation of the Game of Life. Scale-free property of thenetwork associated with the rest state is resilient against con-secutive removals of a hub node. Of the two types of residualclusters, whose links continue to grow or not over time, thetype of clusters accompanied by growing links is essential inthe self-organizing process. Mixing the two types of clusters,which diversifies scales of branch graphs that correspond toavalanches caused by one-cell perturbations in the rest state,contributes to the scale-free property of the rest state. Further-more, a network of clusters can be obtained from the rest-statenetwork by regarding the clusters as composites of live cells.
IntroductionConway’s Game of Life, or Life, is one of the most famouscellular automata (CA) and is defined on a two-dimensionalsquare lattice of cells, where each cell has two state values,true or false, associated with live or dead cells (Gardner,1970; Berlekamp et al., 1982).
Around 1990, researchers debated how to verify self-organized criticality (SOC) in Life, where SOC was definedby Bak et al. (1987) in a general theory of self-organizationand emergence (Bak et al., 1989; Bennett, 1991; Alstrømand Leão, 1994; Hemmingsson, 1995; Blok and Bergersen,1997). Subsequently, contradictory results of research in thisfield are thought to have originated from the different latticesizes and/or boundary conditions adopted by the researchers.In any case, Life with periodic boundary conditions is scale-free to be regarded as “sub-critical.” Thus, the main pur-pose of this study is to investigate the self-organizing pro-cess in Life by analyzing properties of power-law scalingor scale-free property in complex networks (Barabási andAlbert, 1999).
In recent years, Kayama proposed a network represen-tation (NR) of CA that focused not on cell values but onrelationships between cells, which were related by the ef-fects of a one-cell perturbation after a time interval. This
approach was used to study dynamical aspects of CA byanalyzing various characteristic parameters used in networktheory (Kayama, 2010, 2011, 2012). In particular, the NRof Life shows some interesting features: the well-knownpatterns surviving in a rest state are accompanied by char-acteristic networks which are divided into two types; theirlinks continue to grow or not over time [Figures in the ap-pendix (Kayama and Imamura, 2011)]. The rest-state net-work, which encompasses the patterns’ networks and con-nects the patterns together, is a visualization of underlyingtension that causes the growth of avalanches catalyzed byone-cell perturbations. The scale-free property of the rest-state network was also studied by analyzing its out-degreedistribution (Kayama, 2013). This article discusses the self-organizing process in Life from the viewpoint of the NR.The two types of patterns surviving in the rest state play cru-cial roles in the self-organizing process and the scale-freeproperty of the rest state. From here on, we call such residualpatterns “clusters” to distinguish them from all other chaoticpatterns.
The next section is devoted to introducing the NR of Lifeby expanding the discussions of Kayama (2013). The thirdsection explains the role of the cluster’s networks in the pro-cess of self-organization. A survey of the self-organizingprocess is given in the fourth section where a network con-necting clusters and its degree distribution are also dis-cussed.
Scale-free Property and Its ResilienceConcrete steps to obtain a network are as follows: First, adot pattern is obtained from a configuration after an intervaltime tI [Figure 1a]. Second, another dot pattern is generatedfrom the same configuration with a one-cell perturbation af-ter tI [Figure 1b]. Third, the difference of the patterns isobtained by binary addition [Figure 1c]. Fourth, a graphis obtained by connecting the initially changed cell and thechanged cells after tI [Figure 1d]. Finally, the network isdefined by combining all graphs obtained from all one-cellperturbations together.
After a transient period of self-organization, any initial
ALIFE 14: Proceedings of the Fourteenth International Conference on the Synthesis and Simulation of Living Systems
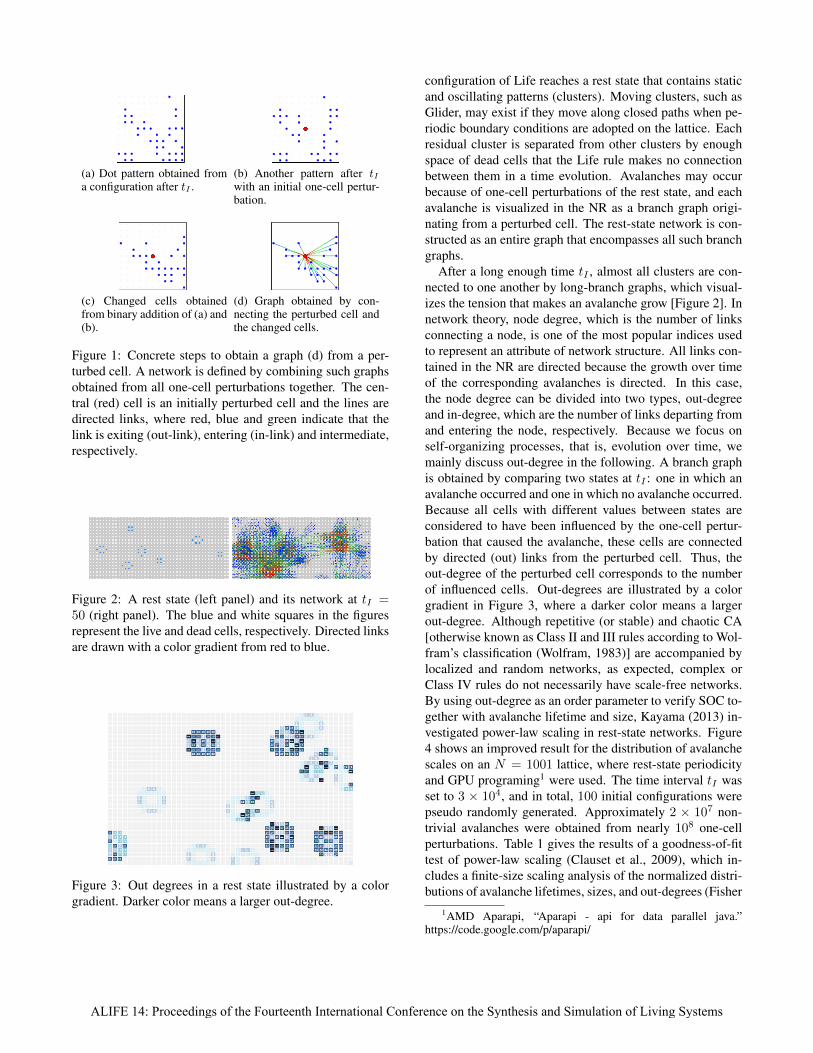
(a) Dot pattern obtained froma configuration after tI .
(b) Another pattern after tIwith an initial one-cell pertur-bation.
(c) Changed cells obtainedfrom binary addition of (a) and(b).
(d) Graph obtained by con-necting the perturbed cell andthe changed cells.
Figure 1: Concrete steps to obtain a graph (d) from a per-turbed cell. A network is defined by combining such graphsobtained from all one-cell perturbations together. The cen-tral (red) cell is an initially perturbed cell and the lines aredirected links, where red, blue and green indicate that thelink is exiting (out-link), entering (in-link) and intermediate,respectively.
Figure 2: A rest state (left panel) and its network at tI =50 (right panel). The blue and white squares in the figuresrepresent the live and dead cells, respectively. Directed linksare drawn with a color gradient from red to blue.
Figure 3: Out degrees in a rest state illustrated by a colorgradient. Darker color means a larger out-degree.
configuration of Life reaches a rest state that contains staticand oscillating patterns (clusters). Moving clusters, such asGlider, may exist if they move along closed paths when pe-riodic boundary conditions are adopted on the lattice. Eachresidual cluster is separated from other clusters by enoughspace of dead cells that the Life rule makes no connectionbetween them in a time evolution. Avalanches may occurbecause of one-cell perturbations of the rest state, and eachavalanche is visualized in the NR as a branch graph origi-nating from a perturbed cell. The rest-state network is con-structed as an entire graph that encompasses all such branchgraphs.
After a long enough time tI , almost all clusters are con-nected to one another by long-branch graphs, which visual-izes the tension that makes an avalanche grow [Figure 2]. Innetwork theory, node degree, which is the number of linksconnecting a node, is one of the most popular indices usedto represent an attribute of network structure. All links con-tained in the NR are directed because the growth over timeof the corresponding avalanches is directed. In this case,the node degree can be divided into two types, out-degreeand in-degree, which are the number of links departing fromand entering the node, respectively. Because we focus onself-organizing processes, that is, evolution over time, wemainly discuss out-degree in the following. A branch graphis obtained by comparing two states at tI : one in which anavalanche occurred and one in which no avalanche occurred.Because all cells with different values between states areconsidered to have been influenced by the one-cell pertur-bation that caused the avalanche, these cells are connectedby directed (out) links from the perturbed cell. Thus, theout-degree of the perturbed cell corresponds to the numberof influenced cells. Out-degrees are illustrated by a colorgradient in Figure 3, where a darker color means a largerout-degree. Although repetitive (or stable) and chaotic CA[otherwise known as Class II and III rules according to Wol-fram’s classification (Wolfram, 1983)] are accompanied bylocalized and random networks, as expected, complex orClass IV rules do not necessarily have scale-free networks.By using out-degree as an order parameter to verify SOC to-gether with avalanche lifetime and size, Kayama (2013) in-vestigated power-law scaling in rest-state networks. Figure4 shows an improved result for the distribution of avalanchescales on an N = 1001 lattice, where rest-state periodicityand GPU programing1 were used. The time interval tI wasset to 3 × 10⁴, and in total, 100 initial configurations werepseudo randomly generated. Approximately 2 × 10⁷ non-trivial avalanches were obtained from nearly 108 one-cellperturbations. Table 1 gives the results of a goodness-of-fittest of power-law scaling (Clauset et al., 2009), which in-cludes a finite-size scaling analysis of the normalized distri-butions of avalanche lifetimes, sizes, and out-degrees (Fisher
1AMD Aparapi, “Aparapi - api for data parallel java.”https://code.google.com/p/aparapi/
ALIFE 14: Proceedings of the Fourteenth International Conference on the Synthesis and Simulation of Living Systems

Figure 4: Normalized distribution of out-degrees of 100 rest-state networks with N = 1001.
Data set p-value xmin Scaling CriticalLifetime 1.00 363 a = 1.25 α = 1.83
Size 0.84 61 b = 1.63 β = 1.86Out-degree 1.00 684 c = 1.2 γ = 1.74
Table 1: Results of power-law tests of avalanche scales of100 rest-state networks with N = 1001. Finite-size scalingeffects were considered.
and Barber,1972; Barber, 1983). For the distributions D(l),D(s), and P (nout) of these indices, we postulate the follow-ing:
D(l, N) ∝ l−αexp(−l/lξ) N, l � 1
D(s, N) ∝ s−βexp(−s/sξ) N, s � 1
P (nout, N) ∝ n−γoutexp(−nout/nξ) N, nout � 1,
where lξ ∝ Na, sξ ∝ N b, and nξ ∝ N c are the character-istic lengths of the avalanche lifetime, size, and out-degree,respectively. The p values in the table all indicate that theindices follow a power law.
Static scale-free networks are, in general, vulnerable toattack on hub nodes. When we try to verify such an attributein the NR, similar discussions are not applicable because thenetworks are dynamic and any perturbation of multi cells isforbidden within the framework of the NR. In this case, ahub node can be defined as a cell with large out-degree. Analternative way to remove multi cells is to add several one-cell perturbations to a sequential series of rest states: thefirst rest state is reached upon adding a one-cell perturbationto an initial rest state, the second rest state is reached uponadding a one-cell perturbation to the first rest state, and soon. Because a large out-degree may become two times thenumber of residual cells, removing such a hub node changesthe rest state into an entirely different rest state. Thus, wecan expect that, even if hub nodes are subsequently removedas mentioned above, scale-free property will be preserved.Figure 5 shows a normalized distribution of out-degrees of99th rest-state network obtained from 20 initial rest statesby removing a hub node 99 times from each rest state on a
Figure 5: Normalized out-degree distribution of 20 rest-statenetworks after 99 times consecutive removal of a hub nodeon a N = 500 lattice (log-log scale).
(a) Block (b) Beehive
Figure 6: Out-degrees of cells surrounding isolated (a)Block and (b) Beehive clusters withN = 100 and tI = 990.Blue cells are alive. The numbers indicate the out-degree ofeach cell.
N = 500 lattice. The time interval between two consecu-tive removals was tI = 3× 10⁴. The goodness-of-fit test ofpower-law scaling of the distribution gives p = 1.00. Thereare no remarkable changes in the distribution of intermedi-ate rest-state networks from the first to 98th rest state. As aresult, the rest-state network of Life is resilient against con-secutive removals of a hub node.
Cluster NetworkBecause there must be a causal relationship between the va-riety of clusters and the scale-free property in the distribu-tion of avalanche scales, we now discuss the informationthe network view offers to better understand the scale-freeproperty or self-organizing process. In a previous study, wefocused on individual networks of well-known clusters andreported that two types of clusters exist: those whose linkscontinue to grow or not over time (Kayama and Imamura,2011). Herein we call these types as type-G for those thatgrow and type-NG for those that do not grow. Networks ofsome well-known clusters are listed in the appendix. Themost frequently encountered type-G and type-NG clustersare the Beehive and Block clusters, respectively. Out-degreedistributions of their networks are illustrated in Figure 6,where the numbers indicate the out-degree of each cell.When a rest state is made only from Block clusters suffi-ciently separated (greater than four cells between them) so
ALIFE 14: Proceedings of the Fourteenth International Conference on the Synthesis and Simulation of Living Systems

Figure 7: Normalized out-degree distribution of a rest-statenetwork made from 1250 Beehives with tI = 2 × 10⁴ andN = 500.
Figure 8: Block cluster terminates Beehive links.
that there is no interference, the out-degree distribution isapparently not scale free but has peaks only at nout = 3,4, and 6. However, if a rest state is made only from ran-domly located Beehive clusters, its out-degree distributionis scale free; see Figure 7, for which tI = 2 × 10⁴ andN = 500, where the number of Beehive clusters was de-termined to be 1250 from the average number of residuallive cells (approximately 3% of total cells). Following thesame process of making a rest state from only type-G clus-ters, we confirm that the rest state is also accompanied by ascale-free network. These results mean that type-G clustersare essential elements for the scale-free property2. WhenBeehive and Block clusters are mixed to make a rest state,a scale-free distribution is also obtained. However, the scal-ing exponent is larger than for a rest state made only fromBeehive clusters, which means Block clusters act to restrainBeehive links from growing. A visual confirmation of thiseffect is shown in Figure 8, where Beehive links are termi-nated by a Block cluster.
What happens if a hub node in the state of only one Bee-hive cluster in Figure 6b is removed? The rest state changedby the avalanche contains many kinds of clusters and theout-degree distribution of its network is like a scale-free dis-tribution. Since even one Beehive cluster can induce a vari-ety of clusters by the removal of a hub node, the resilienceof scale-free property discussed in the previous section is anatural consequence.
2The interference of closely spaced type-NG clusters may actas Type-G clusters.
(a) Total out-degrees (b) Probability of live cells
Figure 9: (a) Total out-degrees and (b) probability of livecells as a function of time with N = 100. Vertical arrowsindicate the times when out-degree distributions are shownin Figure 10.
(a) time = 0 (b) time = 100
(c) time = 250 (d) time = 700
Figure 10: Out-degree distributions of state networks in aself-organizing process from a pseudo randomly generatedinitial configuration at time = 0, 100, 250, and 700 withN = 100 and tI = 2× 10⁴ − time.
Self-Organizing Process and Network ofClusters
We now illustrate the transition process from a random ini-tial configuration to a rest state. Figure 9 shows the total out-degrees and probability of live cells as a function of time.Figure 10 shows out-degree distributions of state networksat time = 0, 100, 250, and 700. The state at time = 700has already reached the rest sate.
1. Because the initial network is composed of a lot of ran-dom long-range links, its out-degree distribution is almostnormal [Figure 10a].
2. After several time steps, the number of live cells rapidlydeclines. Some Block clusters are already synthesizedand restrain long-range networks. In addition to losingthe shape of the normal distribution, the number of short-range links increases [Figure 10b].
3. Chaotic regions settle into cells that are almost dead ex-cept for the clusters. The peak of the normal distribution
ALIFE 14: Proceedings of the Fourteenth International Conference on the Synthesis and Simulation of Living Systems

Figure 11: Normalized out-degree distribution of 10 clusternetworks with N = 1000.
almost collapses and large-scale branch graphs of type-Gclusters remain [Figure 10c].
4. Cluster-synthesizing processes continue until the fractionof live cells reaches approximately 3%. Next, tiny unsta-ble regions or some moving clusters, such as Glider, moveand collide with other clusters, causing localized chaoticinteractions. Through such unstable states, the configura-tion reaches a rest state with a scale-free network [Figure10d].
When clusters are regarded as composite states of live cells,it is interesting to study the network connecting them. TheNR approach makes it possible to visualize such networksof clusters. In Figures 6a or 6b, we define a cluster group asthe cells that constitute a cluster plus the surrounding deadcells with non zero out-degree. If a one-cell perturbationof the group of cells influences other clusters, these clus-ters are considered to be linked with the perturbed clustergroup. Figure 11 shows a normalized out-degree distributionof cluster networks obtained from ten different rest stateswith N = 1000. The average scale of cluster groups (largerthan a 10× 10 rectangle) is too large to determine if the dis-tribution follows a power-law. Further investigation wouldrequire using a larger lattice size.
ConclusionsIn this article we studied the self-organizing process of Lifethrough the NR approach, which, unlike dot patterns, canreveal dynamical aspects because it contains a history ofchanges of cell states. In particular, associated networks ofclusters in a rest state can be classified into growth type andnon-growth type (types G and NG, respectively) accordingto the growth of their network. By analyzing the scale-freeproperty of the rest-state network, we noticed that type-Gclusters are essential in the self-organizing process to con-nect clusters through long-range links. Type-NG clustersalso play the important role of diversifying scales of branchgraphs to restrain the growth of type-G links. The NR ofLife also shows that it is possible to visualize a cluster net-
work when each cluster is recognized as a composite stateof live cells.
Although the ratio in which different cluster types aremixed must play an important role in the self-organizingprocess, no clear discussion or demonstration of this effectsis presently possible. Further investigation into this ratio andcluster networks requires calculations on a larger lattice andanalytical derivations.
ReferencesAlstrøm, P. and Leão, J. (1994). Self-organized criticality in
the "game of life". Phys. Rev. E, 49:R2507–R2508.
Bak, P., Chen, K., and Creutz, M. (1989). Self-organizedcriticality in the ’game of life’. Nature (London),342:780.
Bak, P., Tang, C., and Wiesenfeld, K. (1987). Self-organizedcriticality: an explanation of 1/f noise. Physical ReviewLetters, 59 (4):381–384.
Barabási, A.-L. and Albert, R. (1999). Emergence of scalingin random networks. Science, 286:509–512.
Barber, M. N. (1983). Finite size scaling, in Phase Tran-sitions and critical phenomena, volume 8. AcademicPress, London.
Bennett, C. (1991). ’life’not critical?. Nature, 350:468.
Berlekamp, E. R., Conway, J. H., and Guy, R. K. (1982).Winning Ways for Your Mathematical Plays. Academic,New York.
Blok, H. J. and Bergersen, B. (1997). Effect of boundaryconditions on scaling in the game of life. Physical Re-view E, 55.5:6249–6252.
Clauset, A., Shalizi, C. R., and Newman, M. E. J. (2009).Power-law distributions in empirical data. SIAM Re-view, 51:661–703.
Fisher, M. E. and Barber, M. N. (1972). Scaling theory forfinite-size effects in the critical region. Phys. Rev. Lett.,28:1516–1519.
Gardner, M. (1970). Mathematical games. Scientific Ameri-can, 223:102–123.
Hemmingsson, J. (1995). Consistent results on ¡Ælife¡Ç.Physica D: Nonlinear Phenomena, 80.1:151–153.
Kayama, Y. (2010). Complex networks derived from cellularautomata. arXiv:1009.4509.
Kayama, Y. (2011). Network representation of cellular au-tomata. In 2011 IEEE Symposium on Artificial Life(IEEE ALIFE 2011) at SSCI 2011, pages 194–202.
ALIFE 14: Proceedings of the Fourteenth International Conference on the Synthesis and Simulation of Living Systems

Kayama, Y. (2012). Network view of binary cellular au-tomata. In Sirakoulis, G. and Bandini, S., editors, Cel-lular Automata, volume 7495 of Lecture Notes in Com-puter Science, pages 224–233. Springer Berlin / Hei-delberg. 10.1007/978-3-642-33350-7_23.
Kayama, Y. (2013). Network representation of the game oflife and self-organized criticality. In Artificial Life (AL-IFE), 2013 IEEE Symposium on, pages 60–66. IEEE.
Kayama, Y. and Imamura, Y. (2011). Network representa-tion of the game of life. Journal of Artificial Intelli-gence and Soft Computing Research, 1 (3):233–240.
Wolfram, S. (1983). Statistical mechanics of cellular au-tomata. Rev. Mod. Phys., 55:601–644.
Appendix: Networks of Well-known ClustersWe present some network examples of well-known clustersin Life, including the simplest static clusters, “still lifes”; re-peating clusters, “oscillators”; and a moving cluster, “space-ship” (Kayama and Imamura, 2011). In the figures, the blueand the white squares represent live and dead cells, respec-tively. Directed links are drawn by a color gradient fromred to blue. Red denotes that the link is departing from thenode (out-edge), and blue denotes that the link is enteringthe node (in-edge).
tI :odd tI :even
Figure 14: Blinker cluster (type-NG) and its oscillating net-works (period 2), which depend on tI parity.
Figure 15: Spaceship cluster (Glider: type-G) and its mov-ing networks (period 4) at tI = 12.
(a) Block (b) Boat
tI :odd tI :even(c) Tub
(d) Pond
Figure 12: Still lifes (type-NG) and their networks whichstop growing at some tI value. (c) Tub network depends ontI parity.
(a) Beehive
(b) Loaf
(c) Ship
Figure 13: Still lifes (type-G) and their networks which growwith tI . Networks were obtained at tI = 20.
ALIFE 14: Proceedings of the Fourteenth International Conference on the Synthesis and Simulation of Living Systems