self-reported work limitation data: what they can … work limitation data: what they can and cannot...
TRANSCRIPT
Self-Reported Work Limitation Data: What They Can and Cannot Tell Us
Richard V. BurkhauserDepartment of Policy Analysis and Management
Cornell University
Mary C. Daly*Federal Reserve Bank of San Francisco
Andrew J. HoutenvilleSchool of Industrial and Labor Relations
Cornell University
Nigar NargisDepartment of Economics
Cornell University
This Draft: May 2, 2002First Draft: March 1, 2001
We thank J.S. Butler, Dave Stapleton, Dave Wittenburg, and participants at the Cornell Employment andDisability Policy Summer Institute and the 7th National Disability Statistics and Policy Forum: Disabilityand Participation hosted by the Disability Statistics Center, University of California, San Francisco, forhelpful comments. We also thank Carol D’Souza for research support and Anita Todd for editorialassistance. None of these individuals are responsible for any errors. This research is funded in part by theUnited States Department of Education, National Institute on Disability and Rehabilitation Research,cooperative agreement No. 13313980038. It does not necessarily reflect the view of the National Instituteon Disability and Rehabilitation Research or the Federal Reserve Bank of San Francisco.
*Corresponding author: Mary C. Daly, Economic Research Department, Federal Reserve Bank of SanFrancisco, 101 Market Street, Mail Stop 1130, San Francisco, CA 94105. Ph: (415) 974-3186, Fax: (415) 977-4054, email: [email protected].

Self-Reported Work Limitation Data: What They Can and Cannot Tell Us
Abstract
Data constraints make the long-term monitoring of the working-age population with
disabilities a difficult task. Indeed, the Current Population Survey (CPS) is the only national data
source that offers detailed work and income questions and consistently asked measures of
disability over a 20-year period. Despite its widespread use in the literature, the CPS and surveys
like it have come under attack of late, with critics discounting the results of any research obtained
from such data. We put these criticisms in perspective by systematically examining what the CPS
data can and cannot be used for in disability research. Based on comparisons with the National
Health Interview Survey (NHIS), a data set with much more information on health than the CPS,
we find that the work limitation-based definition of disability available in the CPS underestimates
the size of the broader population with health impairments in the NHIS, but that the employment
trends in these two populations in the NHIS are not significantly different from one another. We
then show that the trends in employment observed for the NHIS population defined by self-
reported work limitation are not statistically different from those found in the CPS. Based on
these findings, we argue (1) that the CPS and other nationally representative employment-based
data sets can be used to monitor trends in outcomes of those with disabilities and, (2) that the
dramatic decline in the employment of people with disabilities we describe in the CPS during the
1990s is not an artifact of the data.
-1-
Self-Reported Work Limitation Data: What They Can and Cannot Tell Us
The aging of the population and the growing number of individuals supported on public
disability programs has made the accurate monitoring of the population with disabilities an
important research and policy issue. Indeed, a large body of research has developed documenting
trends in disability prevalence and active life expectancy (see for example Bound and Waidman
1992, Crimmins, Saito, and Ingegneri 1997, Crimmins, Hayward, and Saito 1994, Hayward and
Heron 1999, Kruse 1998, Lakdawalla, Bhattacharya, and Goldman 2001, McNeil 1993, 2000,
and Verbrugge 1984). Other research has linked disability status to various social and economic
outcomes such as labor force participation and retirement (Hayward and Grady 1990, Stern 1989,
Parsons 1980) and disability benefit usage (Burkhauser and Daly 1996, Bound and Burkhauser
1999). Most recently, information on disability status has been used to examine the effectiveness
of public policies targeted towards those with disabilities, e.g., the Americans with Disabilities Act
(ADA) and the Social Security Disability Insurance (SSDI) and Supplemental Security Income
program (SSI) (see especially Acemoglu and Angrist 2001, Autor and Duggan 2001, Bound and
Waidmann 2002, Burkhauser, Daly, and Houtenville 2001, DeLeire 2000).
Information on disability status used in such studies typically comes from questions based
on whether a health limitation prevents individuals from working or limits their ability to work full
time or to do certain jobs. Numerous scholars have questioned the validity of such data for
measuring disability, arguing that it is subject to idiosyncratic variations due to differences in
skills, attitudes, and the environment (see Bound and Burkhauser 1999, and Moore 2001 for
reviews of this literature). Others have argued that work limitation questions neither capture the

-2-
actual population with disabilities (Hale 2001) nor its employment trends (Kaye 2002, Kirchner
1996, Kruse and Schur 2000, McNeil 2000). Kirchner (1996) hypothesized that changes in
cultural perceptions over time likely bias trends in disability status obtained from such measures.
Finally, some researchers have pointed out that even if the questions are valid, their effectiveness
in obtaining accurate disability information may differ depending on the design and intent of the
survey. For example, a work limitation question in a health survey may illicit different answers
than a work limitation question in an employment survey (Hardy and Pavalko 1986).
In this paper we examine the usefulness of work limitation measures of disability. We
begin by investigating whether work limitation questions can be used to monitor trends in
disability, using as a benchmark some more precise measures of health status available in the
National Health Interview Survey (NHIS). We then examine whether the same work limitation
question is equally effective when it appears in the employment-oriented Current Population
Survey (CPS) as when it appears in the health-oriented NHIS. We test the effectiveness of work
disability data on two fronts, first in its ability to track the prevalence of disability and second in
its ability to track employment—an important measure of social and economic well-being for the
population with disabilities. We find that although work limitation questions underestimate the
size of the broader population with health impairments they can be used to monitor trends in
outcomes, such as employment, for those with disabilities. Thus, we conclude that the dramatic
decline in the employment of working-age people with disabilities captured by the work
limitation-based disability questions in the CPS is not an artifact of the work limitation question or
of the CPS data, but is consistent with trends found in the NHIS using both work limitation-based
and impairment-based definitions of disability.
1The World Health Organization (WHO) has a model of disability very similar to that of Nagi. The key to both of these definitions is the recognition that individuals move from the presence of a healthcondition to a point where it begins to impinge on activities that are socially expected of them and that thismovement is related to the environment in which individuals live. See Jette and Badley (2000) for anexcellent comparison of the Nagi and WHO models.
-3-
Defining and Measuring the Population with Disabilities
Definitions of Disability
Evaluation of the population with disabilities must start with a definition of that
population. Unfortunately, unlike age or gender, which are relatively straightforward and easily
determined demographic characteristics, disability has proven to be a far more controversial
concept to define and measure. Although there is no universal agreement on the most appropriate
definition of the population with disabilities, it is possible to place the various definitions used in a
common conceptual framework. The most frequently applied model of disability comes from
Nagi (1965, 1969, 1991). In the Nagi model, disability is a dynamic process in which an
individual’s pathology interacts with the socioeconomic environment.1 The dynamic nature of the
disability process is represented by the movement through three stages: pathology, impairment,
and disability. The first stage, pathology, is the presence of a physical or mental condition that
interrupts the physical or mental process of the human body. An example is deafness. This leads
to the second stage, impairment, which Nagi defines as a physiological, anatomical, or mental
loss or abnormality that limits a person’s capacity to function. For example, deafness limits the
ability to interpret sound. The final stage, disability, is an inability to perform or a limitation in
performing roles and tasks that are socially expected. For example, a person with deafness is
unable to use the telephone. Under the Nagi model, those with a pathology that causes a physical
or mental impairment that subsequently limits one or more life activities—such as work—but who

2This measure closely resembles what Verbrugge (1990) calls social disability, or the intersectionof an individual’s physical impairment (e.g., deafness) and the environmental challenges of the activitiesrequired by a social role, such as work.
3For example, a person with deafness who is accommodated at the workplace with a TTY machinethat permits him or her to use the telephone.
-4-
nevertheless work would not be considered to have a work disability.2 (This is the case whether
work was possible though changes in the work environment, access to rehabilitation, or individual
adaptability.)3
Tracking the Population with Disabilities Using National Survey Data
The NHIS and CPS Data
The National Health Interview Survey (NHIS) is an annual cross-sectional survey of
approximately 100,000 non-institutionalized civilians conducted by the U. S. Centers for Disease
Control and Prevention. Useful and comparable data are available from 1983 through 1996; the
NHIS was changed substantially in 1997, making time-series comparisons after 1996
questionable. The NHIS contains a standard work limitations question: "Does any impairment or
health problem now keep [person] from working at a job or business? Is [person] limited in the
kind or amount of work [person] can do because of any impairment?" A person with an
affirmative response to either question is considered to have a work limitation. This type of
question is consistent with the Nagi framework of disability developing from a pathology that
limits a social activity—work—but may systematically miss people with pathologies and
impairments who are nevertheless working and do not consider themselves to be work-limited.
This question has been used by numerous researchers to study trends in disability and active life
expectancy (see, for example, Crimmins et al. 1989, 1997, Verbrugge 1991, Hayward and Heron
1999).

-5-
In addition, the NHIS contains detailed impairment-specific information (e.g., "deaf in
both ears," "blind in both eyes," etc.) on a subset of survey respondents. Individuals in this NHIS
subsample are asked directly about specific impairments. This allows us to capture a random
sample of the population with a given set of impairments including those who, despite their
impairment, report that they do not have a work limitation. These data also have been used in
studies of health and disability.
Like the NHIS, the CPS is a large annual cross-sectional survey; the CPS annually surveys
approximately 50,000 households (about 150,000 non-institutionalized civilians). Unlike the
NHIS, the CPS was not designed specifically to follow health trends in the U.S. population, but
rather is the main source of official employment and income statistics in the United States. In
1981 the March Demographic Supplement of the CPS began to ask a question about work
limitations: "Does anyone in this household have a health problem or disability which prevents
them from working or which limits the kind or amount of work they can do? [If so,] who is that?
(Anyone else?)" The work limitation question appears as one of the screeners for the non-
government disability income questions.
Although the CPS is a cross-sectional survey, it does interview respondents over the
course of a year. Specifically, the CPS follows housing units over a four-month period and then
returns eight months later to follow them for another four months. This allows for matching of
housing units and multi-period analysis. A subsample of the households administered the March
Supplement are asked the work limitation question in two consecutive years (March to March).
We use these individuals to construct a “matched” CPS sample and define those with work
limitation-based disabilities as those who respond positively to the question in March of two

4It should be noted that there is some debate about whether self-reported pathology andimpairment-based measures of disability accurately identify the true population with disabilities (Baker,Stabile, and Deri, 2001).
5The NHIS comparisons are based on a representative one-sixth subsample of respondents for theyears 1983-1996. Because the prevalence of specific impairments is very low in any given year, we mustpool the NHIS data over a number of years to establish a sample size sufficient for analysis.
-6-
consecutive years. We use the CPS matched sample to check the robustness of the CPS cross-
sectional results based on single-period disability.
In both the NHIS and CPS analyses we restrict our sample to adults between the ages of
25 and 61, inclusively. This restriction reduces the risk of noise (due to entry from school or exits
to retirement) in the employment variable we use to compare disability measures across data sets
and over time. Throughout the paper we refer to our sample as working-age adults.
Empirical Relationships among Tractable Disability Populations
Differences in Levels across Disability Populations. To begin to assess whether the
population with disabilities defined by the self-reported work limitation question is a reasonable
proxy for the population with significant impairments, we focus on the relationship between the
broad population that reports having an impairment and the subset of this population that reports
a work limitation. This analysis relies on the two components of the NHIS survey described
earlier.4
Table 1 shows the prevalence of self-reported work limitations among working-age men
and women with various impairments using a pooled NHIS sample (1983-1996) of these
individuals.5 (See Houtenville 2001 for a detailed description of the NHIS data used in our
analysis.) The first cell in column one indicates the percentage of men and women who report
having any of the impairments in the list. The remaining cells in column one show the percentage

-7-
of men and women who say they have that specific impairment. Columns three and five show the
percentage of those with the listed impairment(s) who report having (column 3) or not having
(column 5) a work limitation.
In general, these results show that the population with impairments is substantially
understated by estimates based on the work limitation question in the NHIS. While the severity of
the impairment explains much of the variance in work limitations in columns 3 and 5, it does not
explain all of it. For example, among those who report being deaf in both ears or blind in both
eyes—impairments many would expect to be work limiting—only 38 (69) percent, respectively,
also report being “unable to work or to be limited in the kind or amount of work they do.” This is
consistent with the notion that the self-report of a work limitation may be influenced by the work
environment, rehabilitation opportunities, or the inner capacity of individuals to overcome both
their impairments and the barriers to work.
To investigate whether this misestimation of the level of disability translates to outcome
measures, Table 1 also shows employment rates for the three groups. Column 2 reports the
employment rates of men and women who say they have one of the impairments on the list.
Columns 4 and 6 show the employment rates of those with an impairment who report having
(column 4) or not having (column 6) a work limitation. As illustrated in the first row, controlling
for having an impairment, those who say they are not work limited are much more likely to be
employed (employment rate of 83.4%) than those who say they are work limited (employment
rate of 41.5%). Returning to the specific examples of those deaf in both ears or blind in both
eyes, those who report these impairments but report no work limitation are 2.07 (4.0) times more
likely (ratio of column 2 to column 3), respectively, to be employed than such persons who do
-8-
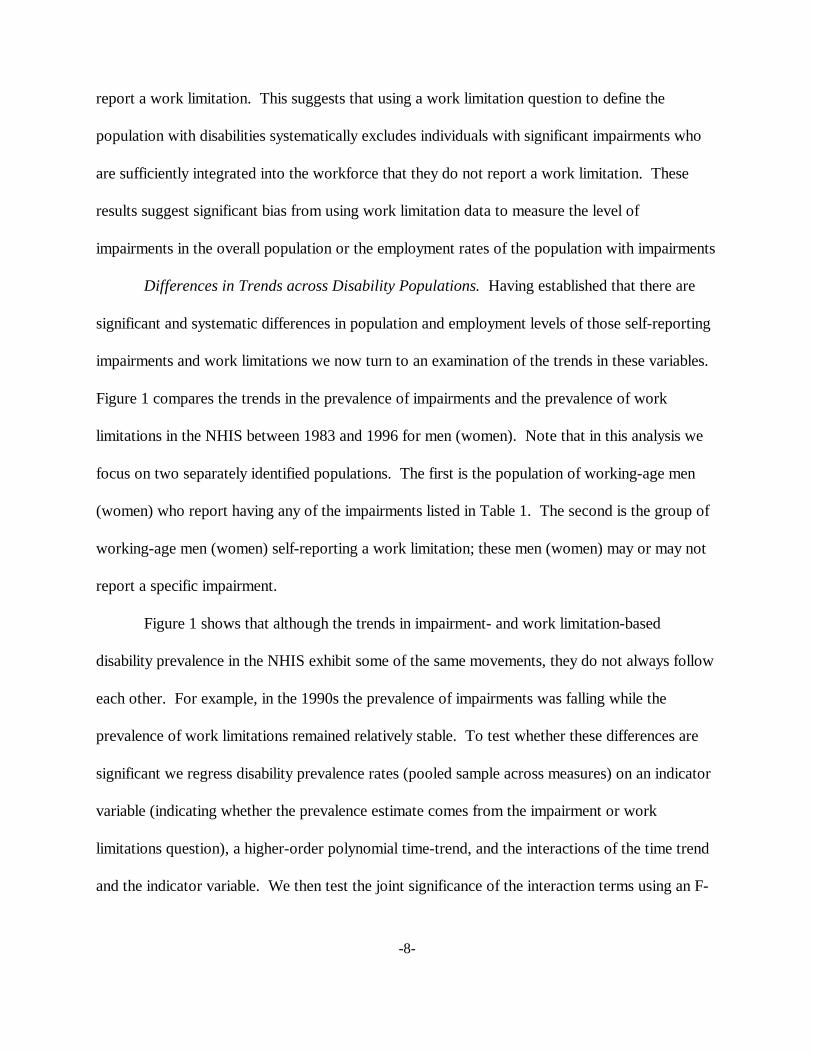
report a work limitation. This suggests that using a work limitation question to define the
population with disabilities systematically excludes individuals with significant impairments who
are sufficiently integrated into the workforce that they do not report a work limitation. These
results suggest significant bias from using work limitation data to measure the level of
impairments in the overall population or the employment rates of the population with impairments
Differences in Trends across Disability Populations. Having established that there are
significant and systematic differences in population and employment levels of those self-reporting
impairments and work limitations we now turn to an examination of the trends in these variables.
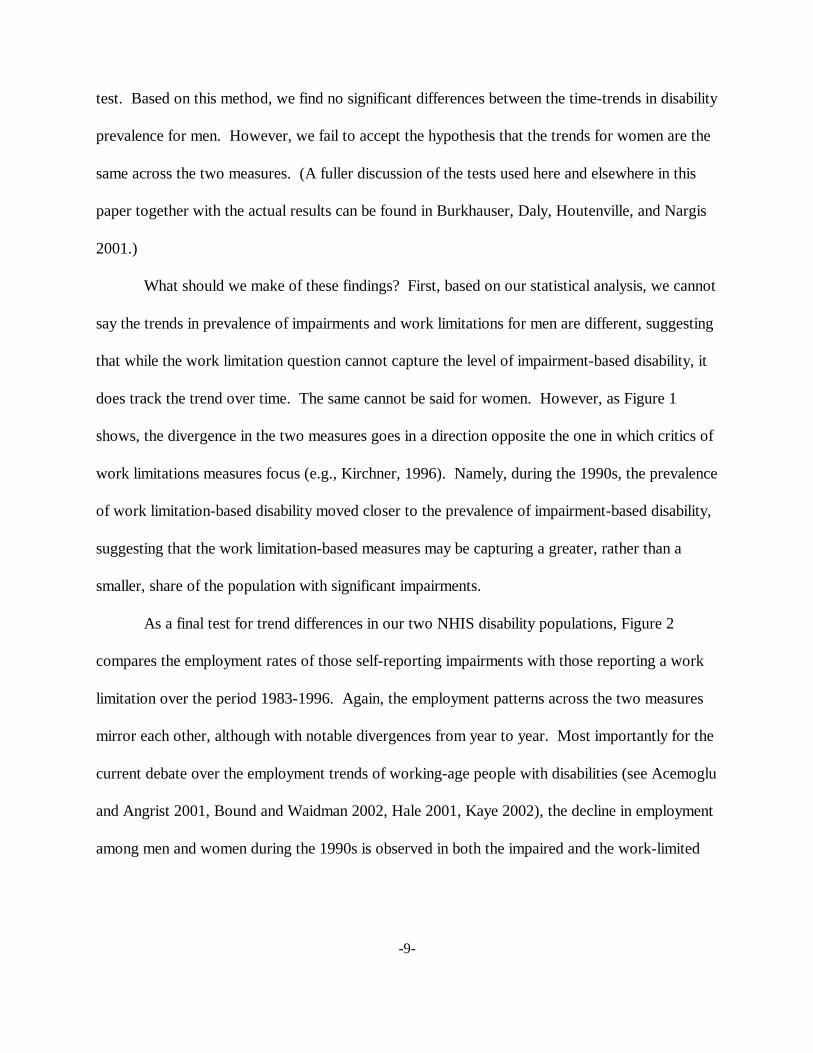
Figure 1 compares the trends in the prevalence of impairments and the prevalence of work
limitations in the NHIS between 1983 and 1996 for men (women). Note that in this analysis we
focus on two separately identified populations. The first is the population of working-age men
(women) who report having any of the impairments listed in Table 1. The second is the group of
working-age men (women) self-reporting a work limitation; these men (women) may or may not
report a specific impairment.
Figure 1 shows that although the trends in impairment- and work limitation-based
disability prevalence in the NHIS exhibit some of the same movements, they do not always follow
each other. For example, in the 1990s the prevalence of impairments was falling while the
prevalence of work limitations remained relatively stable. To test whether these differences are
significant we regress disability prevalence rates (pooled sample across measures) on an indicator
variable (indicating whether the prevalence estimate comes from the impairment or work
limitations question), a higher-order polynomial time-trend, and the interactions of the time trend
and the indicator variable. We then test the joint significance of the interaction terms using an F-
-9-
test. Based on this method, we find no significant differences between the time-trends in disability
prevalence for men. However, we fail to accept the hypothesis that the trends for women are the
same across the two measures. (A fuller discussion of the tests used here and elsewhere in this
paper together with the actual results can be found in Burkhauser, Daly, Houtenville, and Nargis
2001.)
What should we make of these findings? First, based on our statistical analysis, we cannot
say the trends in prevalence of impairments and work limitations for men are different, suggesting
that while the work limitation question cannot capture the level of impairment-based disability, it
does track the trend over time. The same cannot be said for women. However, as Figure 1
shows, the divergence in the two measures goes in a direction opposite the one in which critics of
work limitations measures focus (e.g., Kirchner, 1996). Namely, during the 1990s, the prevalence
of work limitation-based disability moved closer to the prevalence of impairment-based disability,
suggesting that the work limitation-based measures may be capturing a greater, rather than a
smaller, share of the population with significant impairments.
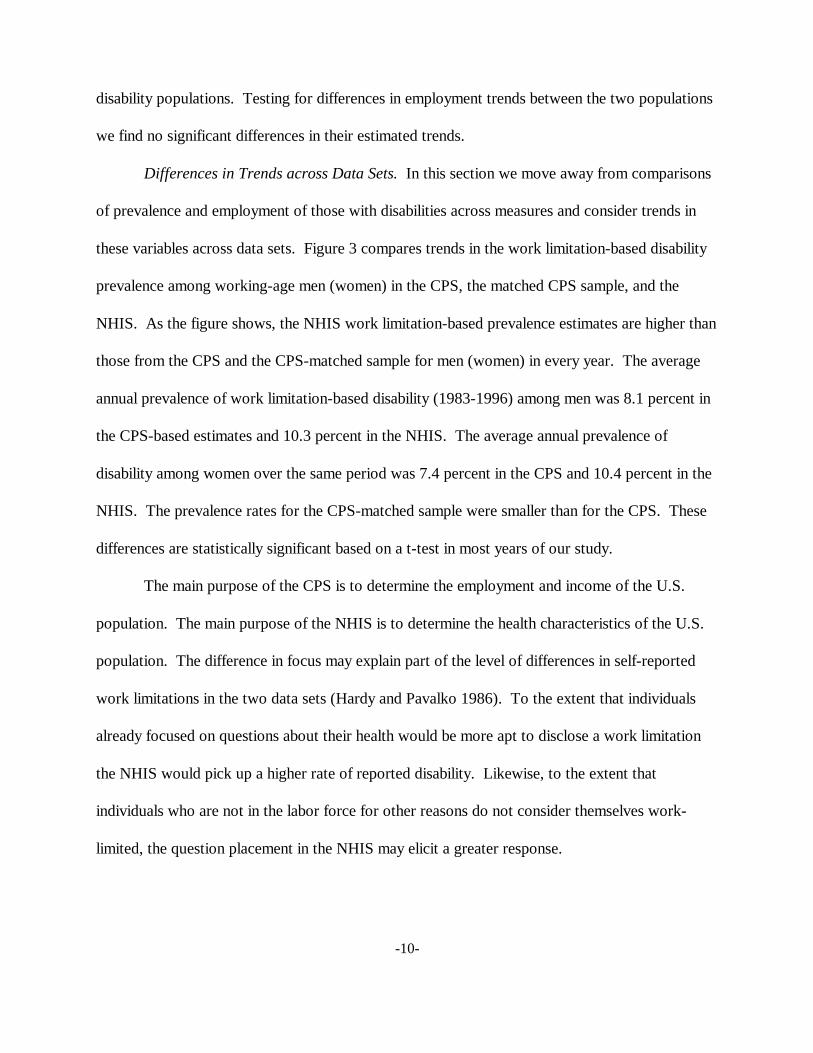
As a final test for trend differences in our two NHIS disability populations, Figure 2
compares the employment rates of those self-reporting impairments with those reporting a work
limitation over the period 1983-1996. Again, the employment patterns across the two measures
mirror each other, although with notable divergences from year to year. Most importantly for the
current debate over the employment trends of working-age people with disabilities (see Acemoglu
and Angrist 2001, Bound and Waidman 2002, Hale 2001, Kaye 2002), the decline in employment
among men and women during the 1990s is observed in both the impaired and the work-limited
-10-
disability populations. Testing for differences in employment trends between the two populations
we find no significant differences in their estimated trends.
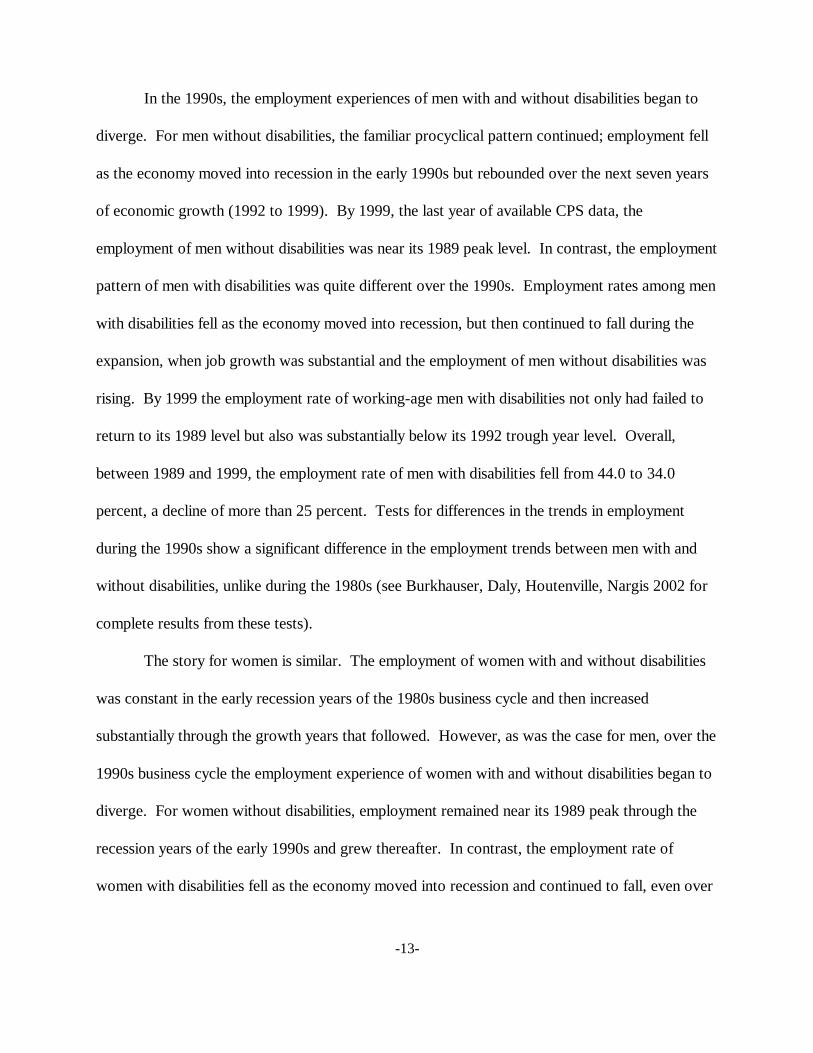
Differences in Trends across Data Sets. In this section we move away from comparisons
of prevalence and employment of those with disabilities across measures and consider trends in
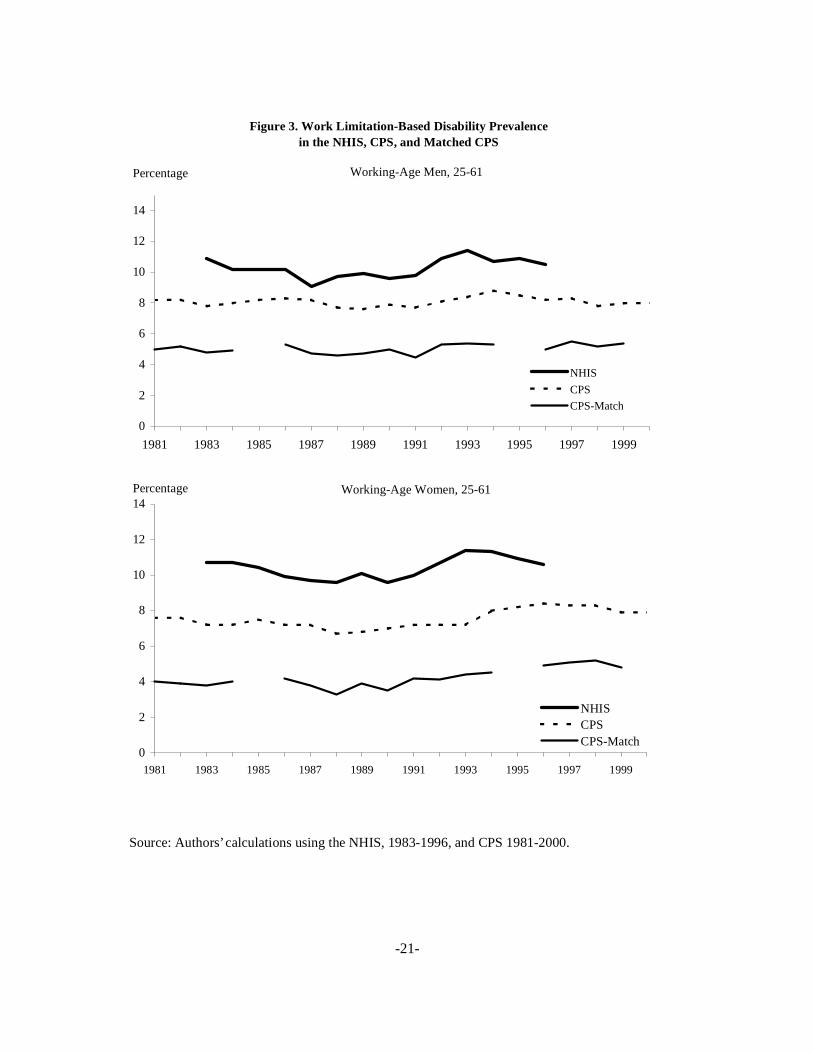
these variables across data sets. Figure 3 compares trends in the work limitation-based disability
prevalence among working-age men (women) in the CPS, the matched CPS sample, and the
NHIS. As the figure shows, the NHIS work limitation-based prevalence estimates are higher than
those from the CPS and the CPS-matched sample for men (women) in every year. The average
annual prevalence of work limitation-based disability (1983-1996) among men was 8.1 percent in
the CPS-based estimates and 10.3 percent in the NHIS. The average annual prevalence of
disability among women over the same period was 7.4 percent in the CPS and 10.4 percent in the
NHIS. The prevalence rates for the CPS-matched sample were smaller than for the CPS. These
differences are statistically significant based on a t-test in most years of our study.
The main purpose of the CPS is to determine the employment and income of the U.S.
population. The main purpose of the NHIS is to determine the health characteristics of the U.S.
population. The difference in focus may explain part of the level of differences in self-reported
work limitations in the two data sets (Hardy and Pavalko 1986). To the extent that individuals
already focused on questions about their health would be more apt to disclose a work limitation
the NHIS would pick up a higher rate of reported disability. Likewise, to the extent that
individuals who are not in the labor force for other reasons do not consider themselves work-
limited, the question placement in the NHIS may elicit a greater response.

-11-
Again, we also are interested in the extent to which the trends in prevalence observed in
the CPS are similar to those observed in the NHIS. Using the same test procedure applied earlier,
we find significant differences between the trends in the work limitations-based prevalence of
disability in the NHIS and the two CPS samples. Of the four comparisons, only the trends for
men in the NHIS and CPS-matched sample are not statistically different. The differences in trends
in the prevalence of work limitations-based disability across our three data sources is somewhat
surprising and suggests that more data are needed to decide which source is best for accurate
monitoring of disability levels or trends.
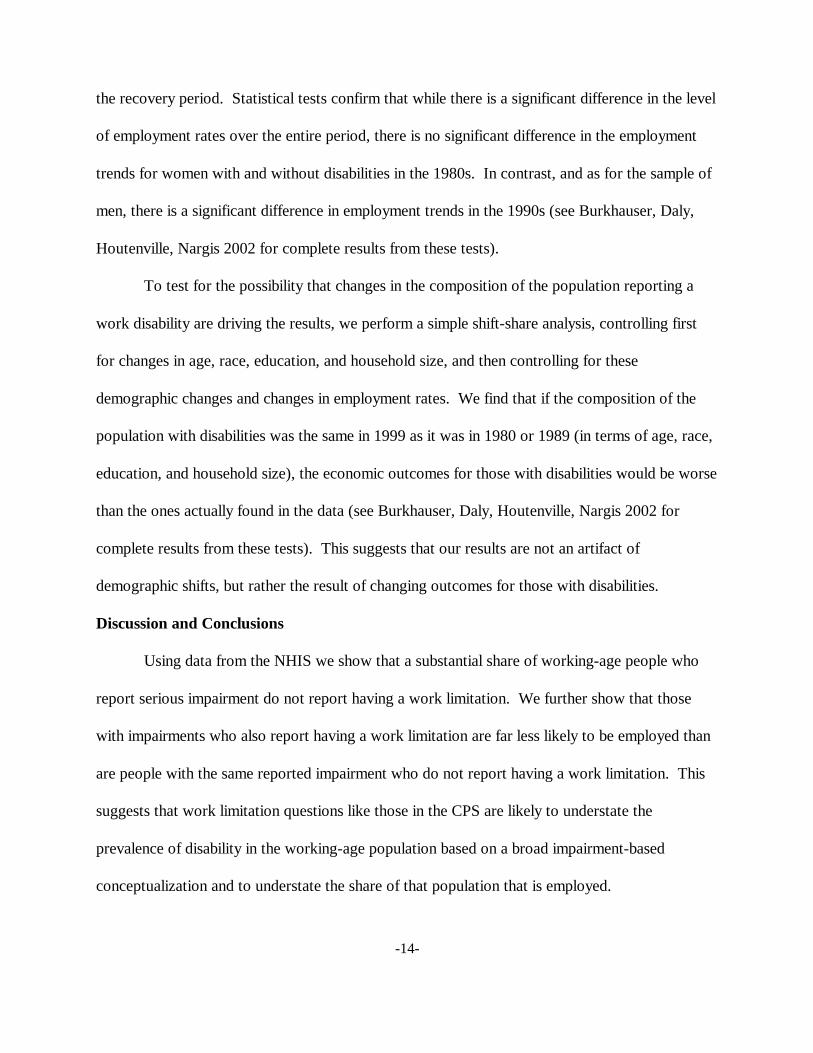
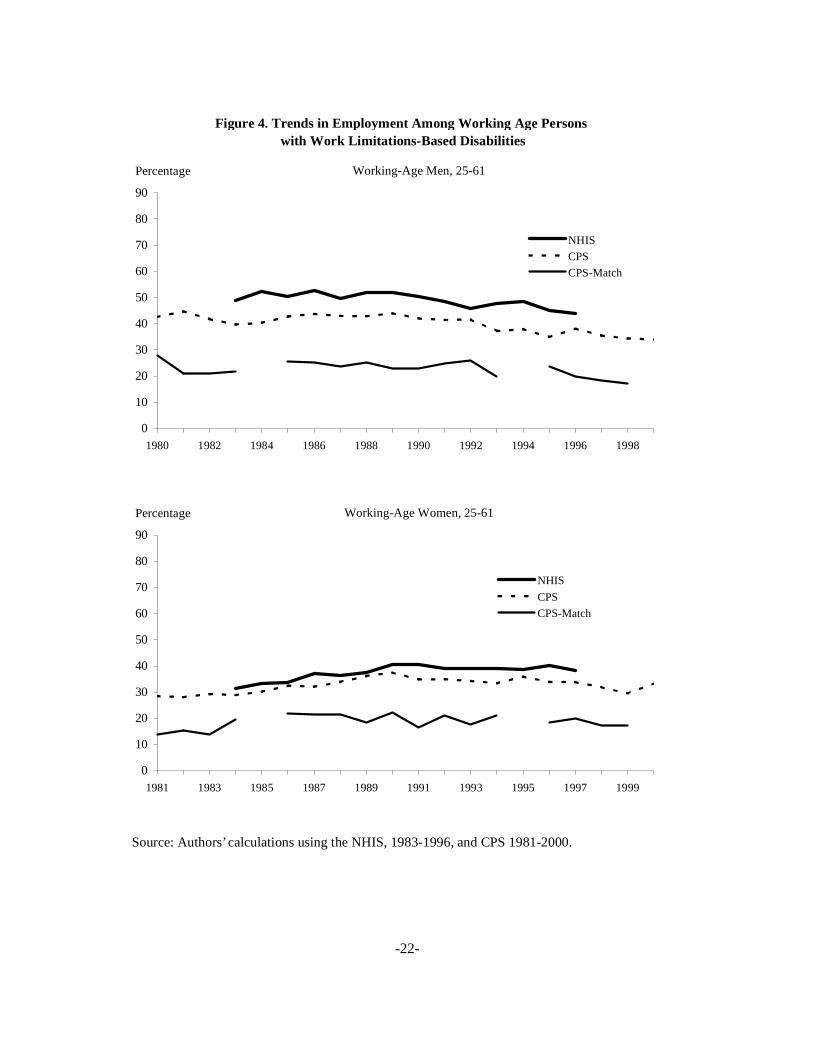
Although the prevalence trends clearly are different across the two data sets, we primarily
are interested in whether the CPS can be used to follow employment trends for those with
disabilities. Figure 4 shows employment rates for men and women with work limitation-based
disabilities in the NHIS, CPS, and CPS-matched sample. As the figure shows, there is a much
closer relationship between employment rates for those with disabilities than was true for the
prevalence rates. We find no significant differences in the employment trends (1983-1996) for the
work limitation-based populations of men (women) with disabilities in the NHIS and two CPS
samples.
Thus, despite significant differences in the level of self-reported work limitations between
the two data sets, the trends in employment found in the two CPS work limitation-based disability
populations are not significantly different from those found in the NHIS work limitation-based
disability population.

-12-
What Do Current Data Tell Us?
Trends in Employment among Those with Disabilities in the 1980s and 1990s
We now focus on the current debate over the employment trends of working-age people
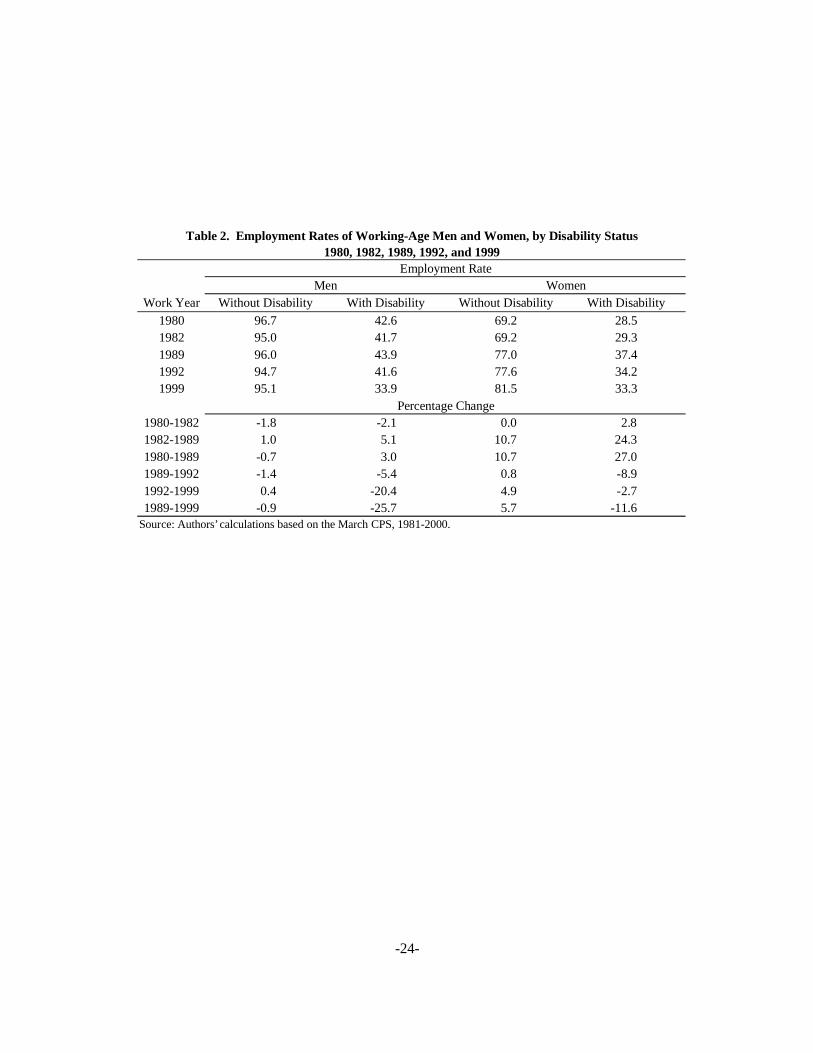
with disabilities. Table 2 shows the sensitivity of employment rates to economic fluctuations over
the past twenty years for working-age men and women with and without disabilities. To trace
economic outcomes of people with disabilities over the business cycle we focus on three years
representing peak or near peak points—1980, 1989, and 1999—and two years representing
trough points—1982 and 1991. An ideal analysis would make peak-to-peak comparisons (1979,
1989, and the next business cycle peak). However, data constraints limit the choice of years
compared to 1980 (the first year of data with disability information), 1989 (the peak of the 1980s
business cycle), and 1999 (the latest year of data available). As the table shows, during the 1980s
the employment of men with and without disabilities was procyclical, falling with recession and
rising with recovery. In 1980, the first year the economy began to slow, employment rates of men
with and without disabilities were relatively high—42.6 percent and 96.7 percent, respectively.
Employment for men with and without disabilities declined as the economy moved through a
recession, declining by about 2 percent for each group. Economic recovery once again boosted
employment rates among men, particularly those with disabilities. Between 1982 and 1989, the
employment rate among men with disabilities rose 5.1 percent, surpassing the 1980 peak. Tests
for differences in the levels and trends of employment between men with and without disabilities
during the 1980s show a significant difference in the level of employment, but no significant
difference in the trends.
-13-
In the 1990s, the employment experiences of men with and without disabilities began to
diverge. For men without disabilities, the familiar procyclical pattern continued; employment fell
as the economy moved into recession in the early 1990s but rebounded over the next seven years
of economic growth (1992 to 1999). By 1999, the last year of available CPS data, the
employment of men without disabilities was near its 1989 peak level. In contrast, the employment
pattern of men with disabilities was quite different over the 1990s. Employment rates among men
with disabilities fell as the economy moved into recession, but then continued to fall during the
expansion, when job growth was substantial and the employment of men without disabilities was
rising. By 1999 the employment rate of working-age men with disabilities not only had failed to
return to its 1989 level but also was substantially below its 1992 trough year level. Overall,
between 1989 and 1999, the employment rate of men with disabilities fell from 44.0 to 34.0
percent, a decline of more than 25 percent. Tests for differences in the trends in employment
during the 1990s show a significant difference in the employment trends between men with and
without disabilities, unlike during the 1980s (see Burkhauser, Daly, Houtenville, Nargis 2002 for
complete results from these tests).
The story for women is similar. The employment of women with and without disabilities
was constant in the early recession years of the 1980s business cycle and then increased
substantially through the growth years that followed. However, as was the case for men, over the
1990s business cycle the employment experience of women with and without disabilities began to
diverge. For women without disabilities, employment remained near its 1989 peak through the
recession years of the early 1990s and grew thereafter. In contrast, the employment rate of
women with disabilities fell as the economy moved into recession and continued to fall, even over
-14-
the recovery period. Statistical tests confirm that while there is a significant difference in the level
of employment rates over the entire period, there is no significant difference in the employment
trends for women with and without disabilities in the 1980s. In contrast, and as for the sample of
men, there is a significant difference in employment trends in the 1990s (see Burkhauser, Daly,
Houtenville, Nargis 2002 for complete results from these tests).
To test for the possibility that changes in the composition of the population reporting a
work disability are driving the results, we perform a simple shift-share analysis, controlling first
for changes in age, race, education, and household size, and then controlling for these
demographic changes and changes in employment rates. We find that if the composition of the
population with disabilities was the same in 1999 as it was in 1980 or 1989 (in terms of age, race,
education, and household size), the economic outcomes for those with disabilities would be worse
than the ones actually found in the data (see Burkhauser, Daly, Houtenville, Nargis 2002 for
complete results from these tests). This suggests that our results are not an artifact of
demographic shifts, but rather the result of changing outcomes for those with disabilities.
Discussion and Conclusions
Using data from the NHIS we show that a substantial share of working-age people who
report serious impairment do not report having a work limitation. We further show that those
with impairments who also report having a work limitation are far less likely to be employed than
are people with the same reported impairment who do not report having a work limitation. This
suggests that work limitation questions like those in the CPS are likely to understate the
prevalence of disability in the working-age population based on a broad impairment-based
conceptualization and to understate the share of that population that is employed.

-15-
However, we also find that the employment trends in these two distinct conceptualizations
of the working-age population with disabilities are not significantly different from one another.
Using NHIS data we find that the employment trends of this work limitation-based disability
population are not significantly different from the employment trends of the larger impairment-
based population. Moreover, we find that while disability prevalence and employment rates found
in the CPS data for this work limitation-based disability population are significantly different from
those found in the NHIS data, there is no significant difference between the trends in employment
found in these data sources. Based on these findings we argue that work limitation-based
questions are not the ideal way to identify the size of the working-age population with disabilities.
However, we also argue that nationally representative employment focused data sets like the CPS
can be used to monitor trends in the employment outcomes of the working-age population with
disabilities.
With that in mind and using the work limitation-based measure of disability in the CPS, we
find that during the 1980s and the 1990s, employment outcomes for those without disabilities
were procyclical, falling during recessionary years and rising during years of expansion. While
this also was the case for working-age men and women with disabilities during the 1980s, it failed
to hold for working-age men and women with disabilities in the 1990s. During the 1990s,
employment of men and women with disabilities fell continuously, declining in both recessionary
and expansionary periods. These results suggest that recent studies using the work limitation-
based disability population in the CPS to examine the decline in the relative employment of men
with disabilities in the 1990s cannot be dismissed out of hand.
-16-
References
Acemoglu, D. and J. Angrist. 2001. “Consequences of Employment Protection? The Case of theAmericans with Disabilities Act.” Journal of Political Economy, 109 (5): 915-57.
Autor, D. and M. Duggan. 2001. "The Rise in Disability and the Decline in Unemployment." Mimeo, Department of Economics. Cambridge, MA: Massachusetts Institute ofTechnology.
Baker, M. M. Stabile, and C. Deri. 2001. “What Do Self-Reported, Objective, Measures ofHealth Measure?” National Bureau of Economic Research Working Paper 8419.
Bound, J. and R.V. Burkhauser. 1999. “Economic Analysis of Transfer Programs Targeted onPeople with Disabilities.” In Handbook of Labor Economics, Vol. 3. Edited by OrleyAshenfelter and David Card. New York, Amsterdam: Elsevier Science, pp. 3417-3528.
Bound, J. and T. Waidmann,. 1992. “Disability Transfers, Self-Reported Health, and the LaborForce Attachment of Older Men: Evidence from the Historical Record.” QuarterlyJournal of Economics, 107(4), pp: 1393-419.
Bound, J. and T. Waidmann. 2002. “Accounting for Recent Declines in Employment Ratesamong the Working-aged Men and Women with Disabilities.” Journal of HumanResources, 37(2), pp: 231-250.
Burkhauser, R.V. and M.C. Daly. 1996. “Employment and Economic Well-Being Following theOnset of a Disability: The Role for Public Policy.” In Disability, Work, and CashBenefits, Jerry Mashaw, Virginia Reno, Richard V. Burkhauser, and Monroe Berkowitz,eds. Kalamazoo, MI: W.E. Upjohn Institute for Employment Research, pp. 59-102.
Burkhauser, R.V., M.C. Daly, and A. Houtenville. 2001. “How Working-Age People withDisabilities Fared over the 1990s Business Cycle.” In Ensuring Health and IncomeSecurity for an Aging Workforce. Edited by P. Budetti, R.V. Burkhauser, J. Gregory, andA. Hunt. Kalamazoo, MI: W.E. Upjohn Institute for Employment Research, pp. 291-346.
Burkhauser, R.V., M.C. Daly, A. Houtenville, and N. Nargis. 2001. “The Employment ofWorking-Age People with Disabilities in the 1980s and 1990s: What Current Data Canand Cannot Tell Us.” Federal Reserve Bank of San Francisco Working Paper 2001-20.
Crimmins, E.M., M.D. Hayward, and Y. Saito. 1994. Changing Mortality and Morbidity Ratessand the Health Status and Life Expectancy of the Older Population.” Demography, 31:159-75.
-17-
Crimmins, E.M., Y. Saito, and D. Ingegneri. 1989. “Changes in Life Expectancy and Disability-Free Life Expectancy in the United States.” Population and Development Review 15:235-67.
Crimmins, E.M., Y. Saito, and D. Ingegneri. 1997. “Trends in Disability-Free Life Expectancy inthe United States, 1970-1990.” Population and Development Review 23:555-72.
DeLeire, T. 2000. “The Wage and Employment Effects of the Americans with Disabilities Act.” Journal of Human Resources 35(4): 693-715.
Hale, T. 2001. “The Lack of a Disability Measure in Today’s Current Population Survey.” Monthly Labor Review. June: pp. 38-40.
Hardy, M. and E. Pavalko. 1986. “The Internal Structure of Self-Reported Health MeasuresAmong Older Male Workers and Retirees.” Journal of Health and Social Behavior,27(4): 346-357.
Hayward, M. and W. Grady. 1990. “Work and Retirement Among a Cohort of Older Men in theUnited States, 1966-1983.” Demography, 27(3): 337-356.
Hayward, M. and M. Heron. 1999. “Racial Inequality in Active Life among Adult Americans.” Demography 36(1): 77-91.
Houtenville, A. J. 2001. "The Economic Experience of Working Persons with Chronic Vision-Related Impairments." Report prepared for the National Research Council, Commissionon Behavioral and Social Science Education.
Jette, A. and E. Badley. 2000. “Conceptual Issues in the Measurement of Work Disability.” inSurvey Measurement of Work Disability, edited by Nancy Mathiowetz and GoolooWunderlich. Washington DC: National Academy Press.
Kaye, S. 2002. “Employment and the Changing Disability Environment.” Mimeo, DisabilityStatistics Center, University of California, San Francisco.
Kirchner, C. 1996. “Looking Under the Street Lamp: Inappropriate Uses of Measures JustBecause They are There.” Journal of Disability Policy Studies 7(1): 77-90.
Kruse, D. 1998. “Persons with Disabilities: Demographic, Income, and Health CareCharacteristics, 1993.” Monthly Labor Review, September.
Kruse, D. and L. Schur. 2000. “Employment of People with Disabilities Following the ADA.”Mimeo, School of Management and Labor Relations. New Brunswick, NJ: RutgersUniversity.

-18-
Lakdawalla, D., J. Bhattacharya, and D. Goldman. 2001. “Are the Young Becoming MoreDisabled?” NBER Working Paper 8247.
McNeil, J. 1993. “Americans with Disabilities: 1991-1992.” Bureau of the Census, CurrentPopulation Reports, Household Economic Studies p70-33.
McNeil, J. 2000. “Employment, Earnings, and Disability.” Presented at the 75th AnnualConference of the Western Economic Association. Available athttp://www.census.gov/hhes/www/disable/emperndis.pdf.
Moore, K. 2001. “Raising the Social Security Retirement Ages: Weighing the Costs andBenefits.” Arizona State Law Journal, 33(2): 544-612.
Nagi, S. 1965. “Some Conceptual Issues in Disability and Rehabilitation.” In Sociology andRehabilitation, M.B. Sussman, ed. Washington, DC: American Sociological Association.
Nagi, S. 1969. Disability and Rehabilitation: Legal, Clinical and Self-Concepts ofMeasurement. Columbus: Ohio State University Press.
Nagi, S. 1991. “Disability Concepts Revisited: Implications to Prevention.” In Disability inAmerica: Toward A National Agenda for Prevention. Edited by A.M. Pope and A.R.Tarlove. Washington, DC: National Academy Press.
Parsons, D. O. 1980. “The Decline of Male Labor Force Participation,” Journal of PoliticalEconomy, February, 88, pp. 117-34.
Stern, S. 1989. “Measuring the Effect of Disability on Labor Force Participation,” Journal ofHuman Resources, 24(3)(Summer): 361-395.
Verbrugge, L.M. 1984. “Long life but worsening health? Trends in health and mortality ofmiddle-aged and older persons.” Milbank Memorial Fund Quarterly/Health and Society,62:475-519.
Verbrugge, L.M. 1990. “Disability.” Epidemiology of Rheumatic Disease, 16:741-61.
Verbrugge, L.M. 1991. “Physical and Social Disability in Adults.” In Primary Care Research: Theory and Methods, edited by H. Hibbard, P.A. Nutting, and M.L. Grady. AHCRPPublication No. 91-0011. Rockville, MD: Agency for Health Care Policy and Research,U.S. Department of Health and Human Services.

-19-
Source: Authors’ calculations using the National Health Interview Survey, 1983-1996.
Figure 1. Trends in Impairment- and Work Limitation-Based Disability in the NHIS
Working-Age Men, 25-61
0
5
10
15
20
25
30
1983 1984 1985 1986 1987 1988 1989 1990 1991 1992 1993 1994 1995 1996
Percentage
ImpairmentWork Limitation
Working-Age Women, 25-61
0
5
10
15
20
25
30
1983 1984 1985 1986 1987 1988 1989 1990 1991 1992 1993 1994 1995 1996
Percentage
ImpairmentWork Limitation

-20-
Source: Authors’ calculations using the National Health Interview Survey, Condition List #2, 1983-1996.
Figure 2. Trends in Employment Among Impaired and Work Limited Working-Age AdultsNHIS Data
Working-Age Men, 25-61
0
10
20
30
40
50
60
70
80
90
1983 1984 1985 1986 1987 1988 1989 1990 1991 1992 1993 1994 1995 1996
Percentage
Impairment
Work Limitation
Working-Age Women, 25-61
0
10
20
30
40
50
60
70
80
90
1983 1984 1985 1986 1987 1988 1989 1990 1991 1992 1993 1994 1995 1996
Percentage
Impairment
Work Limitation
-21-
Source: Authors’ calculations using the NHIS, 1983-1996, and CPS 1981-2000.
in the NHIS, CPS, and Matched CPSFigure 3. Work Limitation-Based Disability Prevalence
Working-Age Men, 25-61
0
2
4
6
8
10
12
14
1981 1983 1985 1987 1989 1991 1993 1995 1997 1999
Percentage
NHIS
CPS
CPS-Match
Working-Age Women, 25-61
0
2
4
6
8
10
12
14
1981 1983 1985 1987 1989 1991 1993 1995 1997 1999
Percentage
NHISCPSCPS-Match
-22-
Source: Authors’ calculations using the NHIS, 1983-1996, and CPS 1981-2000.
with Work Limitations-Based DisabilitiesFigure 4. Trends in Employment Among Working Age Persons
Working-Age Men, 25-61
0
10
20
30
40
50
60
70
80
90
1980 1982 1984 1986 1988 1990 1992 1994 1996 1998
Percentage
NHIS
CPS
CPS-Match
Working-Age Women, 25-61
0
10
20
30
40
50
60
70
80
90
1981 1983 1985 1987 1989 1991 1993 1995 1997 1999
Percentage
NHIS
CPS
CPS-Match

-23-
Table 1. Impairment, Work Limitations, and Employment in the NHISMen and Women aged 25-61
(1) (2) (3) (4) (5) (6)
Of those reporting an impairment
GroupReporting an impairment
Reporting an impairment
and a work limitation
Reporting an impairment
and no work limitation
Percent Employment Rate Percent Employment Rate Percent Employment Rate
Any Impairment 19.52 72.5 25.9 41.5 74.1 83.4
Blind-Both Eyes 0.15 39.1 69.0 20.3 31.0 81.1
Other Visual Impairments 1.83 63.0 36.2 31.6 63.8 80.9
Deaf-Both Ears 0.37 68.0 38.0 40.8 62.0 84.6
Other Hearing Impairments 7.49 73.6 23.4 39.6 76.6 83.9
Stammering and Stuttering 0.42 65.4 33.4 23.7 66.6 86.3
Other Speech Impairments 0.26 44.0 64.9 29.1 35.1 71.6
Paraplegia, Hemiplegia, Quadriplegia 0.11 25.1 90.3 20.2 9.8 72.4
Paraparesis or Hemiparesis 0.05 31.2 88.6 26.6 11.5 66.7
Cerebral Palsy 0.09 42.4 74.5 32.4 25.5 71.7
Mental Retardation 0.29 30.6 90.2 28.4 9.8 51.6
Other Impairments 11.74 72.6 27.2 45.2 72.8 83.3
Source: Authors’ calculations using the NHIS pooled over 1983-1996.
-24-
Work Year
19801982198919921999
1980-1982 -1.8 -2.1 0.0 2.81982-1989 1.0 5.1 10.7 24.31980-1989 -0.7 3.0 10.7 27.01989-1992 -1.4 -5.4 0.8 -8.91992-1999 0.4 -20.4 4.9 -2.71989-1999 -0.9 -25.7 5.7 -11.6
Percentage Change
Source: Authors’ calculations based on the March CPS, 1981-2000.
Men
Table 2. Employment Rates of Working-Age Men and Women, by Disability Status
33.995.1
1980, 1982, 1989, 1992, and 1999Employment Rate
Women
42.641.743.941.6
96.795.096.094.7
81.5
28.529.337.434.233.3
69.269.277.077.6
Without Disability With Disability Without Disability With Disability