self storage - lok'nstore
TRANSCRIPT

Lok’nStore Group Plc
ANNUAL REPORT AND ACCOUNTS for the year ended 31 July 2018
Self Storage

Self Storage
We are a leading company in the fast growing UK self-storage market. We opened our first self-storage centre in February 1995 and have grown consistently over the last 23 years. We currently operate 29 self-storage centres and two serviced document stores in Southern England.
Overview
02 Chairman’s Statement 04 Group at a Glance
Strategic Report
08 The UK Self-Storage Market 10 Our Business Model 12 Our Strategy 13 Chief Executive Officer’s Review 17 Key Performance Indicators 18 Property Review 20 Financial Review 26 Principal Risks and Uncertainties 28 Corporate Social Responsibility Report
Governance
34 Board of Directors and Advisers 36 Corporate Governance 41 Directors’ Report 43 Remuneration Report 44 Statement of Directors’ Responsibilities 45 Independent Auditor’s Report to the Members of Lok’nStore Group Plc
Financial Statements
50 Consolidated Statement of Comprehensive Income 51 Consolidated Statement of Changes in Equity 52 Company Statement of Changes in Equity 53 Consolidated and Company Statements of Financial Position 54 Consolidated Statement of Cash Flows 55 Accounting Policies 64 Notes to the Financial Statements 94 Glossary 95 Our Stores
To find out more visit: www.loknstore.com/investors
Lok’nStore Group Plc Annual Report and Accounts 2018

STRONG BALANCE SHEET, EFFICIENT USE OF CAPITAL, CONSERVATIVE DEBT• Net debt £32.3 million (2017: £17.4 million)
• Loan to value6 ratio 19.7% (2017: 14.0%)
• Bank facility increased by £10 million to £50 million
• Cash available for distribution5 £5.60 million (2017: £5.17 million)
MORE NEW STORES TO COME DELIVERING FURTHER GROWTH • 3 new stores opened this year accounting for
29.2p of increase in NAV per shares
• 3 new stores opening this coming financial year
• Plus 5 new sites secured this financial year
• Expanding pipeline7 of 13 new landmark stores
Highlights
GROUP REVENUE
up 6.6%
ADJUSTED NET ASSET VALUE PER SHARE4
up 15.3%
ANNUAL DIVIDEND PER SHARE
up 10%
GROUP ADJUSTED EBITDA1
up 12.3%
NET ASSETS
up 15.9%
PROFIT BEFORE TAXATION
up 34.3%
17 17
17
17
17
17
18 18
18
18
18
18
£17.75M
£16.65M
£4.80
£4.16
11.0P
10.0P
£7.30M
£6.49M
£103.3M
£89.1M
£5.33M
£3.90M
Find out more about our key performance indicators on page 17
“ Lok’nStore Group has had an excellent year successfully implementing our strategic objectives. We have created a strong platform for an exciting period of growth for Lok’nStore with revenue, profits and asset values all moving ahead. Our adjusted net asset value per share has increased by a substantial 15.3% to £4.80 this year and we are raising the dividend by 10.0% to 11 pence per share.
We have achieved a notable acceleration in our new store pipeline to 13 sites which will increase operating space by 32.4% over the coming three years. This will add considerable momentum to sales and earnings growth. Lok’nStore’s strong balance sheet and strategy of opening new landmark stores position the Group well for future growth.”
Andrew Jacobs, CEO
Strategic R
eportO
verviewG
overnanceFinancial S
tatements
0101

Last year we committed to a period of rapid and sustainable growth based on the strong platform we have built. It is my pleasure to introduce this year’s results which show that we are fulfilling that commitment.
During the year we opened 3 new landmark stores which are all trading above expectations and have contributed to both the growth in turnover and the significant rise (15.3%) in our Adjusted Net Asset Value per share to £4.80 (2017: £4.16). Of this 64.4 pence increase, 29.2 pence was accounted for by the new store openings demonstrating the value creative capacity of our landmark store opening strategy. Our new store pipeline is 9 secured sites and we have 4 more progressing with our lawyers. Of these, 6 are scheduled to open in 2019 and 3 in 2020. This acceleration in new store openings is reflected in the increase in capital expenditure to £21.9 million this year up from £6.3 million last year (refer note 10(b)). When these stores open they will add further to our profits and asset value.
The detail behind these results is discussed further in our Chief Executive’s Review and the Financial Review on pages 13 and 20 respectively. For me the performance of Lok’nStore this year can be summarised under three headings:
• Strong operating performance resulting in an increase in turnover and profits
• Growing asset value driven by existing store performance and growth in new stores
• Many more stores under development and more acquisitions on the horizon
The increasing value of our assets is emphasised by further transactions in the market positively reflecting the demand for established self-storage assets, especially of the quality of our newly built stores. In their July 2018 Market Commentary Report JLL estimate, “there have been around €350m of self-storage transactions over the last 12 months in Europe” and note that they are “seeing a broad base of specialist self-storage investors, private equity and institutions looking to invest in the sector – with real appetite for scale of over £100m.
Managed Stores Our growth strategy includes increasing the number of stores we manage for third party owners. This enables the Company to earn revenue without having to commit our capital, to amortise fixed central costs over a wider operating base and drive further traffic to our website which benefits our entire operation. Our current pipeline includes an additional 4 managed stores which will take the total number of managed stores to 12.
For the first time in these accounts (note 2(c)) we are recognising a carried interest fee receivable of £361,000 relating to a managed store demonstrating the value of this strategy.
Committed People None of these results are possible without the commitment of our members of staff who deserve our thanks and importantly our continued investment in them. This year we have provided over 5,000 hours of training via our Academy and you can read more about this in our Corporate Social Responsibility Report. We have also reviewed our pay levels to ensure that all of our employees are paid fairly and we continue to promote equity ownership to our staff via our Share Investment Plan and the granting of options.
We will continue to invest in our people because it makes business sense, directly contributing to our strategic and operational objectives which are to:
• Steadily increase cash available for distribution (CAD) per share enabling a predictable growth of the dividend from a strong asset base with conservative levels of debt
• Fill existing stores and improve pricing
• Acquire more sites to build new landmark stores
• Increase the number of stores we manage for third parties
Chairman’s Statement
“ We are fulfilling our commitment to a period of sustainable growth based on the strong platform we have built.”
Simon G. ThomasChairman
02 Lok’nStore Group Plc Annual Report and Accounts 2018

Board GovernanceIn March 2018 the London Stock Exchange published AIM Notice 50 requiring companies to comply with a recognised corporate governance code. Your Board has decided to apply the Quoted Companies Alliance’s (QCA) Corporate Governance code which takes a proportionate principle based approach to the application and reporting of good governance. We believe this code is appropriate to the size and nature of the Company. Please refer to the Corporate Governance sections of this Report and our website for more information.
The composition of the Board is also my responsibility and once again this year I spent time reviewing the Board’s configuration with our team. An account of this work is given under board performance and evaluation; it has reconfirmed to me that the current composition of your Board continues to be in the best interest of Shareholders as a whole.
Progressive Dividend Policy For the seventh consecutive year and in line with our stated aim to provide a predictable growth in dividend, we are proposing to increase the annual dividend pay-out by one penny. The Group will therefore pay a final dividend of 7.67 pence per share on 11 January 2019 following the payment of an interim dividend of 3.33 pence per share in June 2018 making a total annual dividend of 11 pence per share, up 10% from 10 pence last year.
I hope you enjoy reading this year’s report and that you will feel as confident and optimistic as I do about the future of Lok’nStore Group Plc.
Simon G. ThomasChairman 26 October 2018
1995LOK’N STORE FOUNDED
#4£10mSELF STORAGE OPERATOR IN THE UK
EQUITY RAISED IN 2001
STORE OPENINGS IN PERIOD
3NEW LANDMARK STORES
150,000ADDITIONAL SQ. FT. OF LETTABLE SPACE
ALL TRADING AHEAD OF EXPECTATION
Strategic R
eportO
verviewG
overnanceFinancial S
tatements
03
GILLINGHAM
Our landmark stores
We opened our first self-storage centre in 1995 and have grown consistently over the last 23 years, currently with 29 self-storage centres open and trading and two serviced document stores in Southern England.
We have been listed on the AlM Market since June 2000 and the Board accounts for 29.3% of the Total Voting Rights (TVR) in the ordinary shares of the Company (2017: 29.4%).
We offer self-storage and serviced document storage from our own stores, and management services to third party storage owners. Self-storage and other storage services are available to both household and business customers at our highly branded Lok’nStore centres.
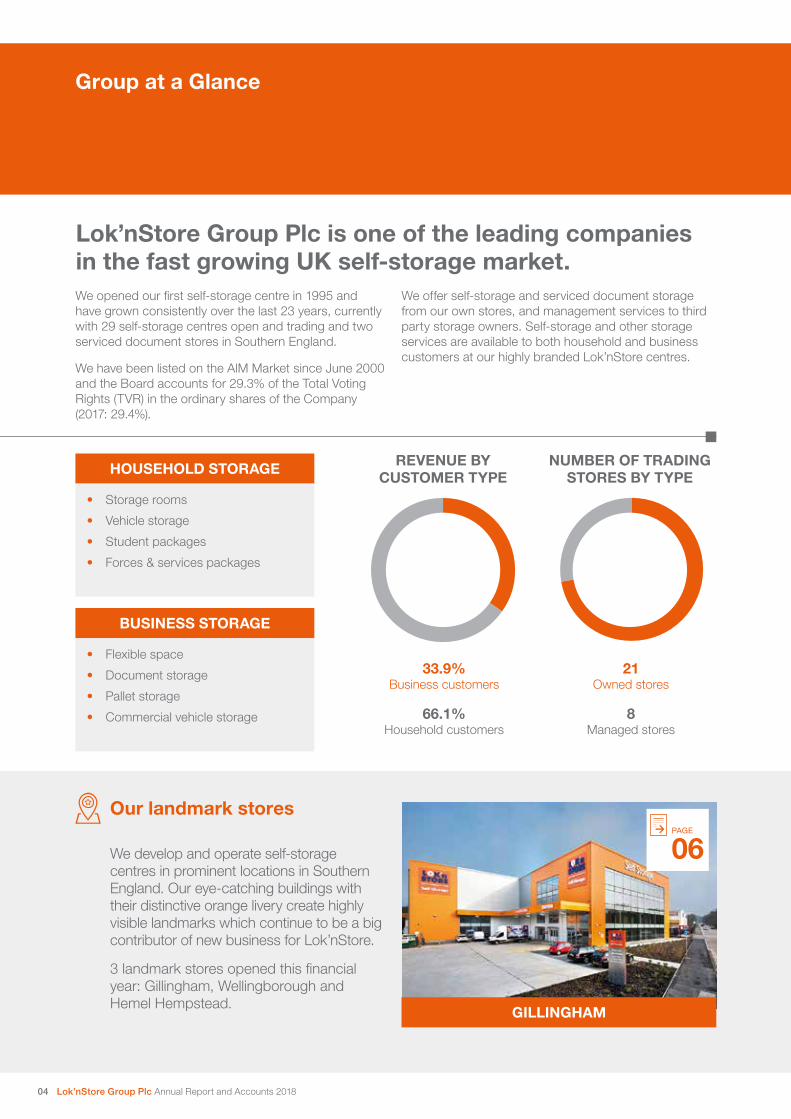
REVENUE BY CUSTOMER TYPE
NUMBER OF TRADING STORES BY TYPE
33.9% Business customers
21 Owned stores
HOUSEHOLD STORAGE
BUSINESS STORAGE
• Storage rooms
• Vehicle storage
• Student packages
• Forces & services packages
• Flexible space
• Document storage
• Pallet storage
• Commercial vehicle storage
Group at a Glance
66.1% Household customers
8 Managed stores
We develop and operate self-storage centres in prominent locations in Southern England. Our eye-catching buildings with their distinctive orange livery create highly visible landmarks which continue to be a big contributor of new business for Lok’nStore.
3 landmark stores opened this financial year: Gillingham, Wellingborough and Hemel Hempstead.
06PAGE
Lok’nStore Group Plc is one of the leading companies in the fast growing UK self-storage market.
04 Lok’nStore Group Plc Annual Report and Accounts 2018
HEMEL HEMPSTEAD
4832PAGEPAGE
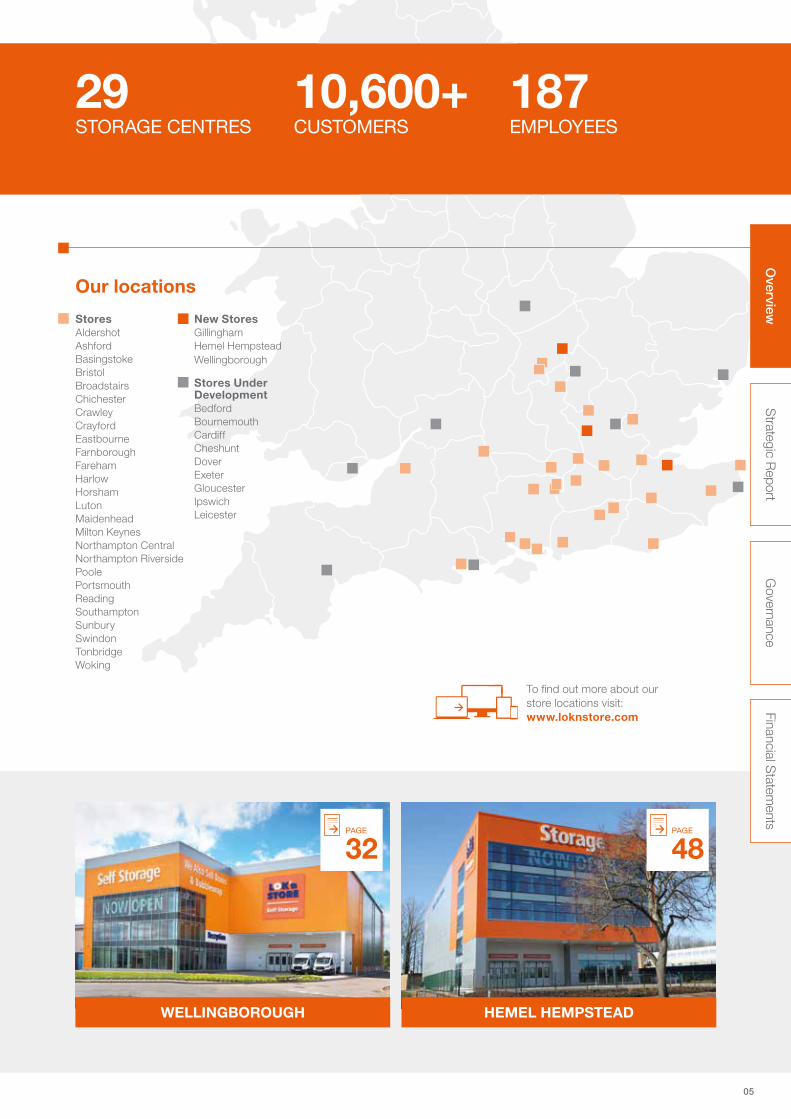
Stores Aldershot Ashford Basingstoke Bristol Broadstairs Chichester Crawley Crayford Eastbourne Farnborough Fareham Harlow Horsham Luton Maidenhead Milton Keynes Northampton Central Northampton Riverside Poole Portsmouth Reading Southampton Sunbury Swindon Tonbridge Woking
New Stores Gillingham Hemel Hempstead Wellingborough
Stores Under Development Bedford Bournemouth Cardiff Cheshunt Dover Exeter Gloucester Ipswich Leicester
Our locations
29STORAGE CENTRES
10,600+ CUSTOMERS
187EMPLOYEES
To find out more about our store locations visit: www.loknstore.com
WELLINGBOROUGH
Strategic R
eportO
verviewG
overnanceFinancial S
tatements
05

06 Lok’nStore Group Plc Annual Report and Accounts 2018

Lok’nStore Gillingham opened in December 2017 and early trading has been excellent.
Located 2 miles from the M2, this strongly branded freehold store is at the centre of the largest out of town retail offer in the area. Four floors high, this store dominates the skyline above Tesco Extra, McDonalds, KFC and Dobbie’s Garden Centre.
The store serves business and household customers across the Medway area, which has a population of in excess of 275,000. Offering a range of storage spaces from 20 sq. ft. – 5,000 sq. ft. the store will have 700 individual rooms when fully developed.
SQUARE FEET OF MAXIMUM LETTABLE AREA
61,000
Gillingham LANDMARK STORE
NOW
OPEN
Strateg
ic Rep
ort
Overview
Governance
Financial Statem
ents
Strategic Report
08 The UK Self-Storage Market10 Our Business Model11 Our Strategy 12 Chief Executive Officer’s Review17 Key Performance Indicators18 Property Review20 Financial Review26 Principal Risks and Uncertainties 28 Corporate Sustainability Report
07

The UK Self-Storage Market
The UK self-storage market at a glance
2.4m 3%
£750m
42%SQ FT OF ADDITIONAL SPACE USED BY CUSTOMERS IN 2017
RISE IN OCCUPANCY ACROSS THE INDUSTRY IN 2017
ANNUAL TURNOVER OF UK SELF STORAGE INDUSTRY
OF PEOPLE HAVE A REASONABLE OR GOOD AWARENESS OF SELF STORAGE
ONLY
The Self-Storage Association UK Annual Industry Survey 2018 reports that the UK Self Storage industry is made up of about 1,505 sites offering 44.6 million square feet of space. It calculates an 8.8% increase in space used by customers in 2017.
SQUARE FEET OF SELF STORAGE PER HEAD OF POPULATION
29,600 SQ. FT. AVERAGE STORE SIZE
UK AUSTRALIA US
1.80.7
9.3
08 Lok’nStore Group Plc Annual Report and Accounts 2018

Strateg
ic Rep
ort
Overview
Governance
Financial Statem
ents
Market overviewAs reported in the Self-Storage Association UK (SSA UK) Annual Industry Survey 2018 the UK self-storage market continues to grow but remains under-developed relative to Australia and the US. In the UK, there are an estimated 1,505 self-storage facilities providing approximately 44.6 million square feet of storage space. With a population of 65.2 million people in the UK this equates to only 0.7 square feet per person compared to 9.3 square feet per person in the USA and 1.8 square feet in Australia.
The structure of the UK industry is changing. When the industry first emerged companies were predominately single owner occupied sites often located in industrial areas but larger operators (defined as operators managing 10 or more sites), such as Lok’nStore, have recently been developing purpose built stores in retail facing locations offering customers a higher standard of product and service.
The main barriers to entry to the market remain the difficulty in finding and securing suitable sites as well as gaining the appropriate planning consents. As a result, according to the SSA UK, larger operators now own or manage around 30% of facilities which translates to 40% of market share in terms of revenue and space. Currently Lok’nStore is the 4th largest operator in the UK with 29 stores providing 1.4 million square feet of space.
Drivers of demand for self-storageDemand for self-storage by both business and household customers is driven by a specific need based on changing circumstances as well as economic activity and business confidence.
For household customers their need is often linked to a life event where they will need space temporarily, for example to support a house sale, but increasingly householders are using storage on a semi-permanent basis to free up space at home or store belongings they don’t have room for.
Business customers use self-storage for a variety of purposes including storage of goods, excess or seasonal stock, document archiving or storage of equipment and tools. Businesses tend to store for longer than household customers and take larger units, although they also take advantage of self-storage for temporary periods to support seasonal sales or office moves or refurbishments.
Lok’nStore’s Opportunity in the MarketThe Self-Storage Association UK (SSA UK) Annual Industry Survey 2018 notes that public awareness of and demand for self-storage is increasing. We know that on average customers chose a store within 5 miles of their home or business. With a pipeline of 9 secured stores and a further 4 stores progressing through the acquisitions process, Lok’nStore is well placed to attract these customers and add further momentum to the growth of our sales and profits.
Combining the Company’s competitive strengths (recognised brand, excellent customer service, rigorous cost control) and the attractive market dynamics of the storage sector (growing sector, under supply, proven resilience during an economic downturn) with our strong balance sheet and flexible operating and ownership model (see our portfolio strategy on page 18), we believe Lok’nStore can take advantage of the opportunities presented and grow at a rapid rate without significantly increasing risk.
09
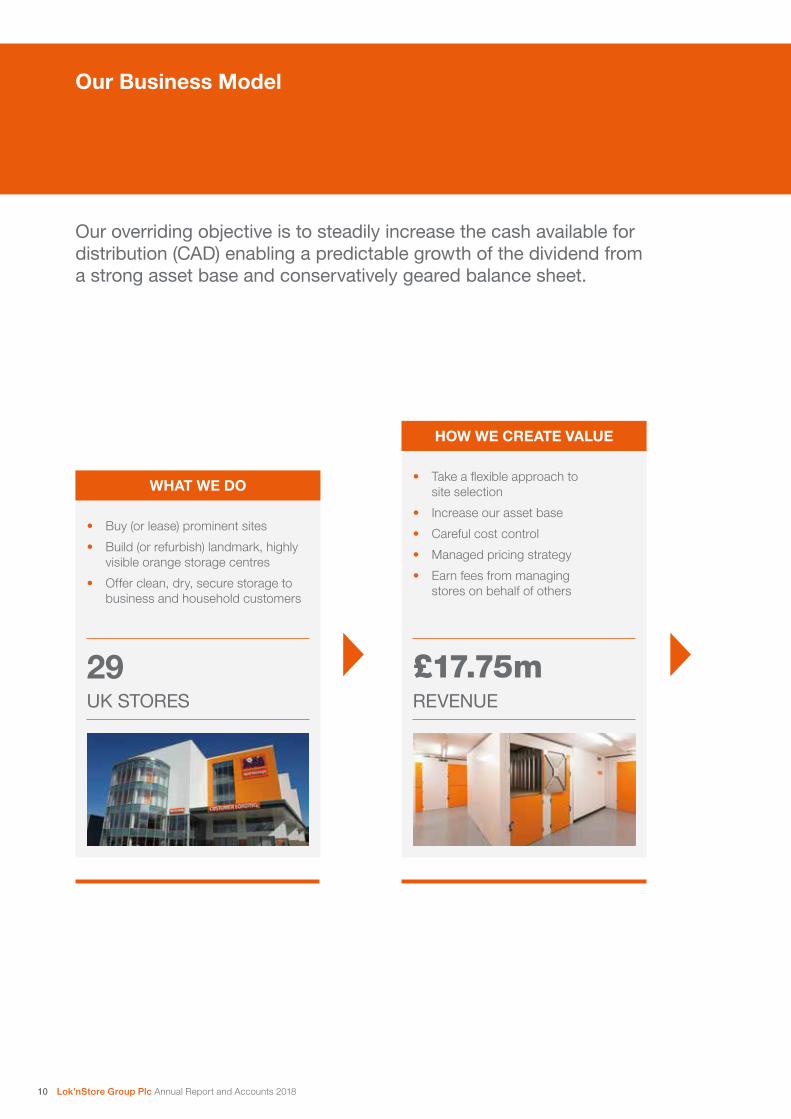
Our Business Model
Our overriding objective is to steadily increase the cash available for distribution (CAD) enabling a predictable growth of the dividend from a strong asset base and conservatively geared balance sheet.
WHAT WE DO
HOW WE CREATE VALUE
• Buy (or lease) prominent sites
• Build (or refurbish) landmark, highly visible orange storage centres
• Offer clean, dry, secure storage to business and household customers
• Take a flexible approach to site selection
• Increase our asset base
• Careful cost control
• Managed pricing strategy
• Earn fees from managing stores on behalf of others
£17.75m29REVENUEUK STORES
10 Lok’nStore Group Plc Annual Report and Accounts 2018
Strateg
ic Rep
ort
Overview
Governance
Financial Statem
ents
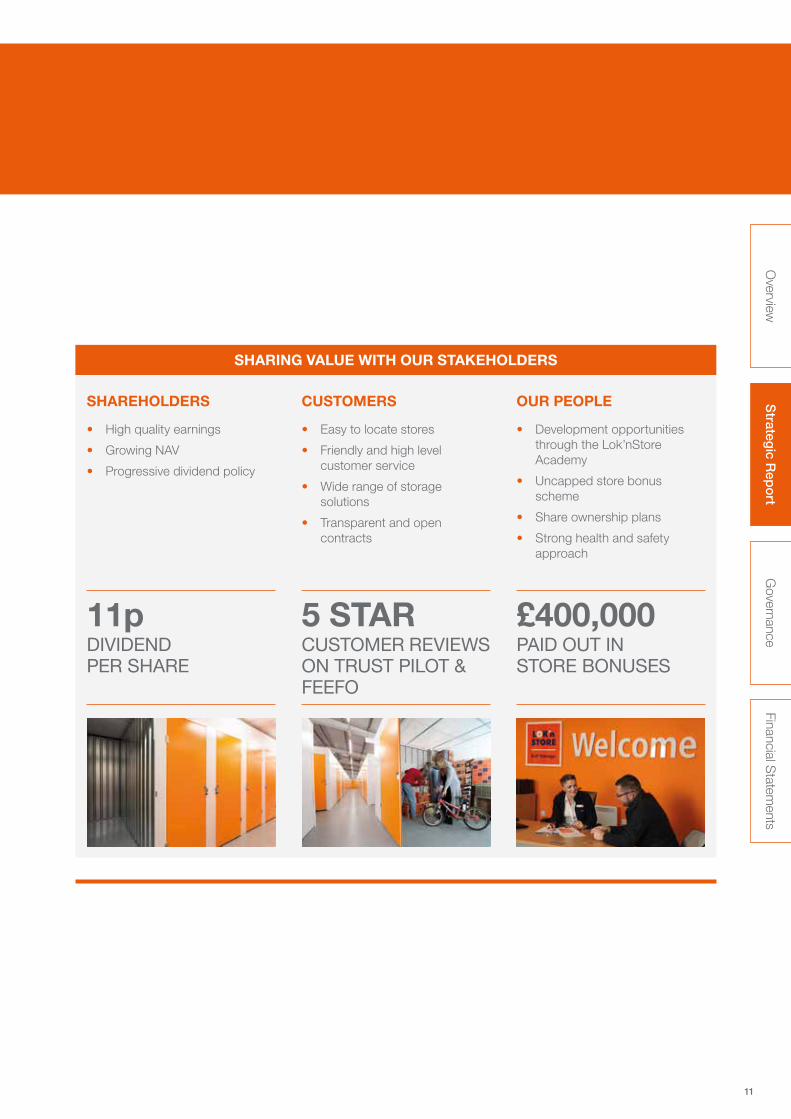
SHARING VALUE WITH OUR STAKEHOLDERS
CUSTOMERSSHAREHOLDERS OUR PEOPLE
• High quality earnings
• Growing NAV
• Progressive dividend policy
• Easy to locate stores
• Friendly and high level customer service
• Wide range of storage solutions
• Transparent and open contracts
• Development opportunities through the Lok’nStore Academy
• Uncapped store bonus scheme
• Share ownership plans
• Strong health and safety approach
11p 5 STAR £400,000DIVIDEND PER SHARE
CUSTOMER REVIEWS ON TRUST PILOT & FEEFO
PAID OUT IN STORE BONUSES
11
Our Strategy
OUR OBJECTIVES
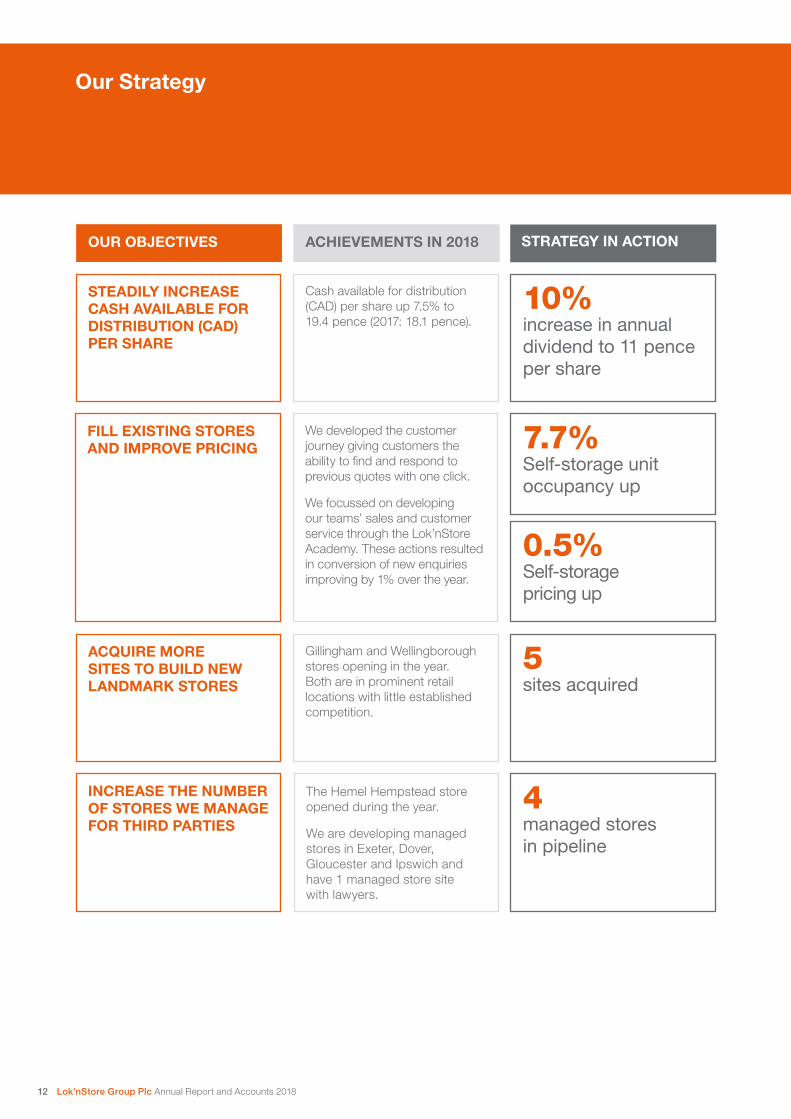
Cash available for distribution (CAD) per share up 7.5% to 19.4 pence (2017: 18.1 pence).
We developed the customer journey giving customers the ability to find and respond to previous quotes with one click.
We focussed on developing our teams’ sales and customer service through the Lok’nStore Academy. These actions resulted in conversion of new enquiries improving by 1% over the year.
Gillingham and Wellingborough stores opening in the year. Both are in prominent retail locations with little established competition.
The Hemel Hempstead store opened during the year.
We are developing managed stores in Exeter, Dover, Gloucester and Ipswich and have 1 managed store site with lawyers.
STEADILY INCREASE CASH AVAILABLE FOR DISTRIBUTION (CAD) PER SHARE
INCREASE THE NUMBER OF STORES WE MANAGE FOR THIRD PARTIES
FILL EXISTING STORES AND IMPROVE PRICING
ACQUIRE MORE SITES TO BUILD NEW LANDMARK STORES
ACHIEVEMENTS IN 2018 STRATEGY IN ACTION
10% increase in annual dividend to 11 pence per share
5 sites acquired
4 managed stores in pipeline
7.7% Self-storage unit occupancy up
0.5% Self-storage pricing up
12 Lok’nStore Group Plc Annual Report and Accounts 2018

Strateg
ic Rep
ort
Overview
Governance
Financial Statem
ents
Chief Executive Officer’s Review
Lok’nStore Group has had an excellent year successfully implementing all of our strategic objectives. Revenue, profits and asset values have all moved ahead steadily. Our rapidly expanding pipeline of new stores will substantially increase the proportion of our store space which is new or purpose-built and will add further momentum to the growth of sales and profits with plenty of new capacity contributing to growth over the coming three years.
Robust tradingGroup revenue for the year was £17.75 million, up 6.6% year on year (2017: £16.65 million) driven by occupancy increases in both old and new stores. This revenue growth led to a 12.3% increase in Group Adjusted EBITDA. Tight control over operating costs leading to a 2% increase in self-storage margins has also contributed in pushing the Group’s profits to record levels.
• Self-storage revenue £14.78 million up 5.6% (2017: £13.99 million)
• Adjusted Store EBITDA £8.42 million up 9.3% (2017: £7.70 million)
• Unit occupancy up 7.7%
• Unit pricing up 0.5%
With costs firmly under control revenue growth translates into healthy profit growth. Total adjusted store EBITDA in self-storage, a key performance indicator of profitability and cash flow of the business, increased 9.3% to £8.42 million (2017: £7.70 million). The overall adjusted EBITDA margin across all stores was nearly 2 percentage points higher at 57.0% (2017: 55.1%) with the adjusted Store EBITDA margins of the freehold stores at 64.1% (2017: 63.4%) and the leasehold stores at 44.1% (2017: 41.5%).
Over the course of the year unit occupancy rose by a healthy 7.7% and unit pricing increased 0.5%. Out of 29 stores open 15 were trading at above 70% occupancy. At the end of July 2018 33.9% of Lok’nStore’s self-storage revenue was from business customers (2017: 33.5%) and 66.1% was from household customers, (2017: 66.5%). By number of customers 17.8% of our customers were business customers (2017: 18.1%) and 82.2% household customers (2017: 81.9%).
By the year-end we had 8 managed stores following the opening of the Hemel Hempstead store in November 2017.
The average unexpired term of the Group’s operating leaseholds is approximately 11 years and 1 month as at 31 July 2018 (10 years and 8 months: 31 July 2017). The leaseholds produced 27.6% of the total store EBITDA in the year (2017: 28.5%).
In the table overleaf we show how the performance of the stores varies between freehold and leasehold stores. Currently 67.2% of Lok’nStore owned trading space is freehold and 32.8% is leasehold. Inevitably the leaseholds trade on lower margins due the rent payable, but nevertheless the 44.1% margins achieved is substantial, and leads to a higher return on capital than the freehold stores which require much larger capital expenditure to buy the land and buildings. The freehold stores produce 72.4% of the store EBITDA and account for 88.8% of valuations (including secured pipeline stores).
When the secured pipeline is fully developed the freeholds will account for 55.8% of trading space, leaseholds will be 19.5% and managed stores 24.7%. This mix of tenures with their different risk and return characteristics provides strength in the balance sheet and opportunities to create value throughout the cycle, and is always driven solely by consideration of the operating business.
“ Store visibility remains pivotal to our marketing efforts. Our new landmark stores are located in highly prominent locations and we continually invest in new signage and lighting at our existing stores.”
Andrew JacobsChief Executive Officer
13

Portfolio Analysis and Performance Breakdown
As at 31 July 2018Number
of stores% of
Valuation
% of Adjusted
store EBITDA
Adjusted store
EBITDA margin
(%)
% lettable space When fully developed
Lok owned
Number of stores
Total % lettable
space
Freehold and long leasehold 14 78.6 72.4 64.1 67.2 19 55.8
Operating Leaseholds 7 11.2 27.6 44.1 32.8 7 19.5
Managed Stores 8 – – 100 – 12 24.7
Total Stores Trading 29 – – – – 38 –
Pipeline Stores
Owned 5 10.2 – – – – –
Managed Stores 4 – – – – – –
Total Self-Storage 38 100 100 57.0 100 38 100
Document Storage 2 – – – – 2 –
Chief Executive Officer’s Review 6.7%INCREASE IN SELF-STORAGE REVENUE
Operating Performance at a glance (Lok’nStore owned stores only)
Weeks Old Pipeline Under 100 100 to 250 over 250 Total
Year Ended 31 July 2018
Sales £’000 180 1,607 12,992 14,779
Stores Adjusted EBITDA £'000 (75.91) 1,025 7,471 8,420
EBITDA Margin (%) (42%) 64% 58% 57%
Stores Adjusted EBITDAR £'000 (75.91) 1,025 8,662 9,611
EBITDAR Margin (%) (42%) 64% 67% 65%
As at 31 July 2018 ('000 sq ft)
Maximum Net Area 300 105 111 915 1,432
Freehold & Long Leasehold ('000 sq ft) 300 105 111 544 1,060
Short Leasehold ('000 sq ft) – – – 372 372
Number Stores
Freehold and Long Leasehold 5 2 2 10 19
Short Leasehold – – – 7 7
Total Stores 5 2 2 17 26
In respect of the Farnborough Store (>250 weeks) the total store revenue includes a £100,000 contribution receivable from Group Head Office.
In the table below we show how the performance breaks down between the age brackets of the stores. Clearly older stores have had time to fill up and produced a 67% EBITDAR profit (earnings before interest, tax, depreciation, amortisation and rent) margins. Over time as new stores goes through their life cycle they will progress towards the same margins as the fully established stores and add substantially to revenues and profits.
14 Lok’nStore Group Plc Annual Report and Accounts 2018

Strateg
ic Rep
ort
Overview
Governance
Financial Statem
ents
9.3%INCREASE IN ADJUSTED STORE EBITDA
7.7%23.7%INCREASE IN UNIT OCCUPANCY
INCREASE IN SERVICED DOCUMENT STORAGE EBITDA
Ancillary SalesAncillary sales which consist of boxes and packaging materials, insurance and other sales increased 4.0% (2017: 2.6%) over the year accounting for 11.0% of self-storage revenues (2017: 11.2%).
Serviced document storage revenue and profits up• Revenue £2.38 million up 2.4% (2017: £2.33 million)
• Adjusted EBITDA £0.662 million up 23.7% (2017: £0.54 million) (after adjustment for Lok’nStore Management charges)
Revenue and adjusted EBITDA have increased in our document storage business as operating metrics improve in response to the Company's more customer facing marketing stance. This approach has resulted in excellent customer feedback and puts us in a good position to win new business.
MarketingStore visibility remains pivotal to our marketing efforts. Our new landmark stores are located in highly prominent locations and we continually invest in new signage and lighting at our existing stores.
During the year our marketing efforts have continued to focus on the presentation of our buildings to attract passing traffic and internet marketing. With their prominent positions, distinctive design and bright orange elevations, our stores raise the profile of the Lok’nStore brand and generate a substantial proportion of our business. We continue to invest in new signage and lighting at our existing stores as well as creating striking designs for our new landmark stores to promote and enhance their visual prominence, and engage the local community.
The internet continues to be the main media channel for our advertising. Our website at www.loknstore.co.uk is one of the most established self-storage websites in the UK. The website delivers a high level of customer experience across desktop, tablet and smartphone devices. This is a very dynamic area and we are committed to its continued development. We believe the internet provides a strong competitive advantage for the major operators such as Lok’nStore with relatively large marketing budgets.
Pipeline of new storesAgainst this background of ever improving operating performance we have invested £21.7 million in store development this year and we have now seen a rapid increase in our new store pipeline to 9 secured stores by the reporting date, which will take the total to 38 stores. These will all be purpose built landmark stores in highly prominent locations and will add substantially to the Group’s capacity for revenue, profit and asset growth. We have 4 further store acquisitions progressing through the legal process.
15

Chief Executive Officer’s Review continued
The graph below shows the speed of fill-up of our stores broken down into their age groups. You can see that over time the stores have filled up faster with the most recently opened stores (on the left of the graph) filling fastest of all. We believe that this shows that the UK self-storage market is still in its infancy with low penetration and increased consumer awareness leading to faster fill. It also shows the strength of Lok’nStore’s newly developed landmark store model.
Management stores Lok’nStore manages an increasing number of stores for third party owners. Under this model Lok’nStore provides a turnkey package for investors wishing to own the underlying self-storage assets. The investor supplies all the capital for the project which Lok’nStore manages. Lok’nStore will buy, build and operate the stores under the Lok’nStore brand and within our current management structure.
The operating expenses of the store are paid for by the third party out of the store revenue with Lok’nStore receiving various fees and performance bonuses. Lok’nStore has no costs directly associated with this function and no equity capital at risk. Therefore this activity generates an increasing return at minimal risk increasing the overall risk adjusted return of the Group as a whole.
Notable in this year’s accounts (note 2(c)) is a carried interest receivable of £361,000 in relation to a management contract, over and above the £534,000 store management fees noted elsewhere. This is the first time the Group has recognised such a gain. As the number of managed stores increases rapidly over the coming years the revenue from them will rise commensurately.
FutureLok’nStore Group has had an excellent year successfully implementing our strategic objectives. We have created a strong platform for an exciting period of growth for Lok’nStore with revenue, profits and asset values all moving ahead.
Against this background of a strong performance from our existing stores, we have also achieved a notable increase in our pipeline to 13 new stores. This will increase operating space by 32.4% over the coming three years, adding considerable momentum to sales and earnings growth.
Lok’nStore’s strong operating performance and robust balance sheet underpin our strategy of new landmark store openings positioning the Group well for future growth.
Andrew JacobsChief Executive Officer26 October 2018
Time Open
Ave
rag
e W
eekl
y R
even
ue
Store Revenue Growth after Opening
2015–2018 2010–2015 2004–2010 1995–2004
16 Lok’nStore Group Plc Annual Report and Accounts 2018

Strateg
ic Rep
ort
Overview
Financial Statem
entsG
overnance
Key Performance Indicators
What we mean when we say… (and why we use these key performance indicators (KPIs))
1. Group Adjusted EBITDA – Earnings Before Interest, Tax, Depreciation and Amortisation – The measure is designed to give clarity on the operating cash flow of the business stripping away non-cash charges, finance charges and tax. Adjusted EBITDA is defined as EBITDA before losses or profits on disposal, share-based payments, acquisition costs, exceptional items, finance income, finance costs and taxation.
2. Exceptional Items – refers to ‘one-off’ items of a non-operational nature which arose during the year and are unlikely to be recurring (refer note 2(c) of the Financial Statements).
3. Adjusted Total Assets – The value of adjusted total assets of £181.4 million (2017: £153.5 million) is calculated by adding the independent valuation of the leasehold properties of £18.2 million (2017: £16.7 million) less their corresponding net book value (NBV) £2.7 million (2017: £2.9 million) to the total assets in the Statement of Financial Position of £165.9 million (2017: £139.7 million). This provides clarity on the significant value of the leasehold stores as trading businesses which under accounting rules on operating leases are only presented at their book values within the Statement of Financial Position.
4. NAV – Net Asset Value Per Share – Adjusted net asset value per share is the net assets adjusted for the valuation of leasehold stores (properties held under operating leases) and deferred tax divided by the number of shares at the year-end. The shares held in the Group’s employee benefits trust and treasury shares are excluded from the number of shares. The calculation of the Net Asset Value per share is set out in the Financial Review on page 24.
5. CAD – Cash Available for Distribution – is calculated as Adjusted EBITDA minus total net finance cost, less capitalised maintenance expenses, New Works Team costs and current tax. This measure is designed to give clarity to the capacity of the business to generate ongoing net operating cash that can be used to pay dividends to shareholders. The calculation of the Cash available for Distribution is set out in the Financial Review on page 22.
6. LTV – Loan to Value Ratio – measures the debt of the business expressed as a percentage of total property assets giving a perspective on the gearing of the business. The calculation is based on net debt of £32.3 million as set out in note 27(b) (2017: £17.4 million) as a percentage of the total properties independently valued by JLL and including development land assets totalling £162.8 million (2017: £124.8 million) as set out in the Financial Review on page 21.
7. Pipeline Sites – means sites for new stores that we have either exchanged contracts on or have agreed heads of terms on and are now with our lawyers for completion. We now have 13 pipeline sites which include 9 secured and 4 sites which are currently with lawyers.
8. Adjusted Store EBITDA – is Adjusted EBITDA (see 1 above) before the deduction of central and head office costs. This important information provides an insight into the underlying performance of the trading stores and shows the cash generating core of the business. Use of this metric enables us to provide additional information on store EBITDA contributions and the margins analysed between freehold and leasehold stores and according to the age of the stores. This analysis is set out in a table in the Chief Executive Officer’s Review on page 14.
9. Gearing – refers to the level of a company’s debt related to its equity capital, usually expressed in percentage form. It is a measure of a company’s financial leverage and shows the extent to which its operations are funded by lenders versus shareholders. Gearing can be measured by a number of ratios and we use the debt-to-equity ratio in this document. The calculation of the Gearing percentage, also referred to as the net debt to equity ratio is set out in note 16 of the Financial Statements.
10. Group Adjusted EBITDAR – EBITDAR is Earnings before interest, tax, depreciation amortisation and rent. The measure is designed to give clarity on the effect of the rent payable by leasehold stores and how its elimination enables an analytical comparison between freehold stores operating performance (which do not pay rent) and leasehold stores operating performance. This analysis is set out in a table in the Chief Executive Officer’s Review on page 14.
11. Cost Ratio – calculates the ratio of the total operating costs of the business as set out on page 21 of the Financial Review, expressed as a percentage of total group revenue (refer note 1(a)), giving a perspective on the cost efficiency of the business when compared to the cost ratio of the previous year.
See also the glossary on page 94.
In addition to IFRS accounting performance measures, we use some Alternative Performance Measures (APMs) to help us understand how the underlying business is performing. The following table identifies those measures and explains what we mean when we use them and importantly why we use them and what they tell you about our business and performance.
17

Property Review
Store and portfolio strategyIn the self-storage industry each operating store is a profitable unit in its own right. Therefore our strategy is to continue to increase the number of stores we operate without stretching our balance sheet. The core focus of this strategy is the acquisition of highly prominent freehold locations in busy towns in Southern England where we will build well branded landmark stores.
Flexible approach to site acquisitionAll of the projects detailed below are part of our strategy of actively managing our operating portfolio to ensure we are maximising both trading potential and value. This includes strengthening our distinctive brand, increasing the size and number of our stores and replacing stores or sites where it will increase shareholder value.
We prefer to own freeholds if possible, and where opportunities arise we will seek to acquire the freehold of our leasehold stores. However we are happy to take leases on appropriate terms and benefit from the advantages of a lower entry cost, with further options to create value later in the store’s development. We also consider selling established stores on sale and manage back contracts in order to recycle the capital and protect the balance sheet. Indeed some of our stores have been freehold, leasehold and managed stores during their operating life cycle! Our most important consideration is always the trading potential of the store rather than the property tenure.
The chart below illustrates the rapid growth of store numbers and the changing tenure mix over time. Noteworthy is the growth of managed stores over recent years.
40
1995 2001 20071996 2002 20112010200920081997 2003 20121999 2005 201520141998 2004 20132000 2006 2016 2018 Coming Soon
2017
35
30
25
20
15
10
5
0
Number of Stores Trading Since Inception by Tenure
Lok’nStore now operates 29 stores and 2 serviced document stores in Southern England. Of the 29 stores Lok’nStore owns the freehold or long leasehold interest in 14 stores, 7 stores are held under commercial leases with all of our leasehold stores inside the Landlord and Tenant Act providing us with a strong security of tenure. The average unexpired term of the Group’s operating leaseholds is approximately 11 years and 1 month as at 31 July 2018.
A further 5 freehold stores are under development which will be owned by Lok’nStore.
Freehold Leasehold Managed
18 Lok’nStore Group Plc Annual Report and Accounts 2018
Strateg
ic Rep
ort
Overview
Governance
Financial Statem
ents
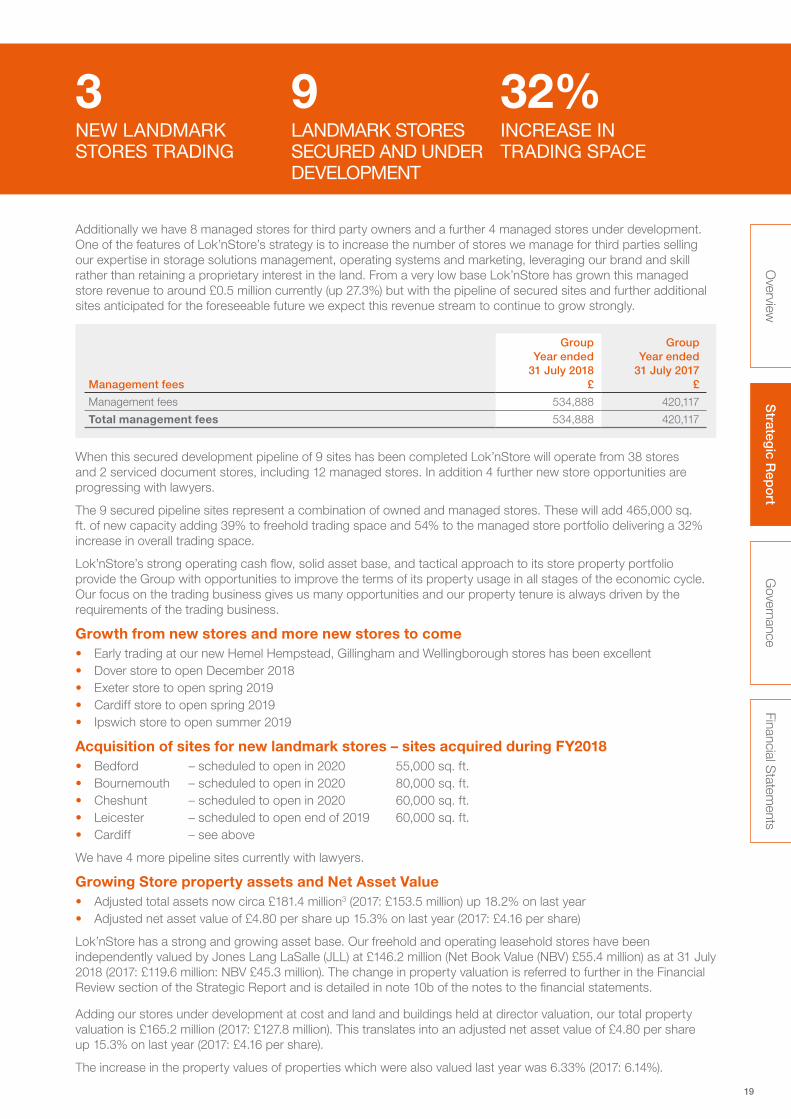
3NEW LANDMARK STORES TRADING
32%9INCREASE IN TRADING SPACE
LANDMARK STORES SECURED AND UNDER DEVELOPMENT
When this secured development pipeline of 9 sites has been completed Lok’nStore will operate from 38 stores and 2 serviced document stores, including 12 managed stores. In addition 4 further new store opportunities are progressing with lawyers.
The 9 secured pipeline sites represent a combination of owned and managed stores. These will add 465,000 sq. ft. of new capacity adding 39% to freehold trading space and 54% to the managed store portfolio delivering a 32% increase in overall trading space.
Lok’nStore’s strong operating cash flow, solid asset base, and tactical approach to its store property portfolio provide the Group with opportunities to improve the terms of its property usage in all stages of the economic cycle. Our focus on the trading business gives us many opportunities and our property tenure is always driven by the requirements of the trading business.
Growth from new stores and more new stores to come• Early trading at our new Hemel Hempstead, Gillingham and Wellingborough stores has been excellent• Dover store to open December 2018• Exeter store to open spring 2019• Cardiff store to open spring 2019• Ipswich store to open summer 2019
Acquisition of sites for new landmark stores – sites acquired during FY2018• Bedford – scheduled to open in 2020 55,000 sq. ft.• Bournemouth – scheduled to open in 2020 80,000 sq. ft. • Cheshunt – scheduled to open in 2020 60,000 sq. ft. • Leicester – scheduled to open end of 2019 60,000 sq. ft. • Cardiff – see above
We have 4 more pipeline sites currently with lawyers.
Growing Store property assets and Net Asset Value• Adjusted total assets now circa £181.4 million3 (2017: £153.5 million) up 18.2% on last year • Adjusted net asset value of £4.80 per share up 15.3% on last year (2017: £4.16 per share)
Lok’nStore has a strong and growing asset base. Our freehold and operating leasehold stores have been independently valued by Jones Lang LaSalle (JLL) at £146.2 million (Net Book Value (NBV) £55.4 million) as at 31 July 2018 (2017: £119.6 million: NBV £45.3 million). The change in property valuation is referred to further in the Financial Review section of the Strategic Report and is detailed in note 10b of the notes to the financial statements.
Adding our stores under development at cost and land and buildings held at director valuation, our total property valuation is £165.2 million (2017: £127.8 million). This translates into an adjusted net asset value of £4.80 per share up 15.3% on last year (2017: £4.16 per share).
The increase in the property values of properties which were also valued last year was 6.33% (2017: 6.14%).
Management fees
Group Year ended
31 July 2018£
Group Year ended
31 July 2017£
Management fees 534,888 420,117
Total management fees 534,888 420,117
Additionally we have 8 managed stores for third party owners and a further 4 managed stores under development. One of the features of Lok’nStore’s strategy is to increase the number of stores we manage for third parties selling our expertise in storage solutions management, operating systems and marketing, leveraging our brand and skill rather than retaining a proprietary interest in the land. From a very low base Lok’nStore has grown this managed store revenue to around £0.5 million currently (up 27.3%) but with the pipeline of secured sites and further additional sites anticipated for the foreseeable future we expect this revenue stream to continue to grow strongly.
19

Record financial results on all measures• Group Revenue £17.75 million up 6.6%
(2017: £16.65 million)
• Group Adjusted EBITDA £7.30 million up 12.3% (2017: £6.49 million)
• Operating profit (before exceptional items2) £5.17 million up 16.9% (2017: £4.38 million)
• Operating profit (after exceptional items) £5.71 million up 33.9% (2017: £4.26 million)
The Group has again delivered strong financial results.
Earnings per shareBasic earnings per share (EPS) were 13.05 pence up 18.4% (2017: 11.02 pence per share). Diluted EPS were 12.83 pence up 20.6% (2017: 10.64 pence per share). If 2018 figures are adjusted to eliminate the 2018 exceptional items of £0.59 million, the 2018 EPS is adjusted to 11.0 pence per share (2017: 11.43 pence per share) and the 2018 diluted EPS to 10.81 pence per share (2017: 11.03 pence per share).
Earnings per share (EPS)
Year ended 31 July 2018
£’000
Year ended 31 July 2017
£’000
Profit for the year 3,757 3,061
Exceptional (income)/costs (591) 113
Adjusted earnings 3,166 3,174
Weighted average number of shares
No. of shares
No. of shares
For basic earnings per share 28,792,029 27,780,676
Dilutive effect of share options 490,064 999,657
For diluted earnings per share 29,282,093 28,780,333
Basic EPS (pence) 13.05p 11.02p
Diluted EPS (pence) 12.83p 10.64p
Purchase of treasury sharesThe Group did not buy or sell any Treasury shares during the year. We are proposing to renew our ongoing authority to buy back shares at this year’s AGM to ensure the Group continues to have flexibility to make purchases should it be considered to be in the best interests of shareholders to do so.
Operating costs• Cost ratio11 reduced to 57% (2017: 59%)
We have a strong record of reducing our Group operating costs each year. We cautioned in our 2017 year end results that although we maintain a disciplined approach to costs, continuing to reduce them is increasingly challenging while delivering an acceleration of our store opening programme.
Group operating costs amounted to £10.1 million for the period, a 2.7% increase year on year (2017: £9.84 million) which derived from higher aggregate costs as we opened new landmark stores. We are also spending more on internet marketing. Nevertheless our tight discipline on costs has enabled us to reduce our cost ratio by 2.0% points to 57%.
In respect of property costs which mainly constitute rent and rates we had in the previous year felt the effects of higher rates bills as we opened our new landmark stores and had incurred rates on a development site. We have now negotiated rate reductions on these stores resulting in an overall cost reduction this year in property costs.
Financial Review
“ Capital expenditure of £21.7 million up from £6.3 million last year is reflective of our expanding pipeline of new stores.”
Ray Davies Finance Director
20 Lok’nStore Group Plc Annual Report and Accounts 2018
Strateg
ic Rep
ort
Overview
Governance
Financial Statem
ents
£7.30M£17.75MGROUP ADJUSTED EBITDA UP 12.3%
GROUP REVENUE UP 6.6%
£5.71MOPERATING PROFIT* UP 33.9%
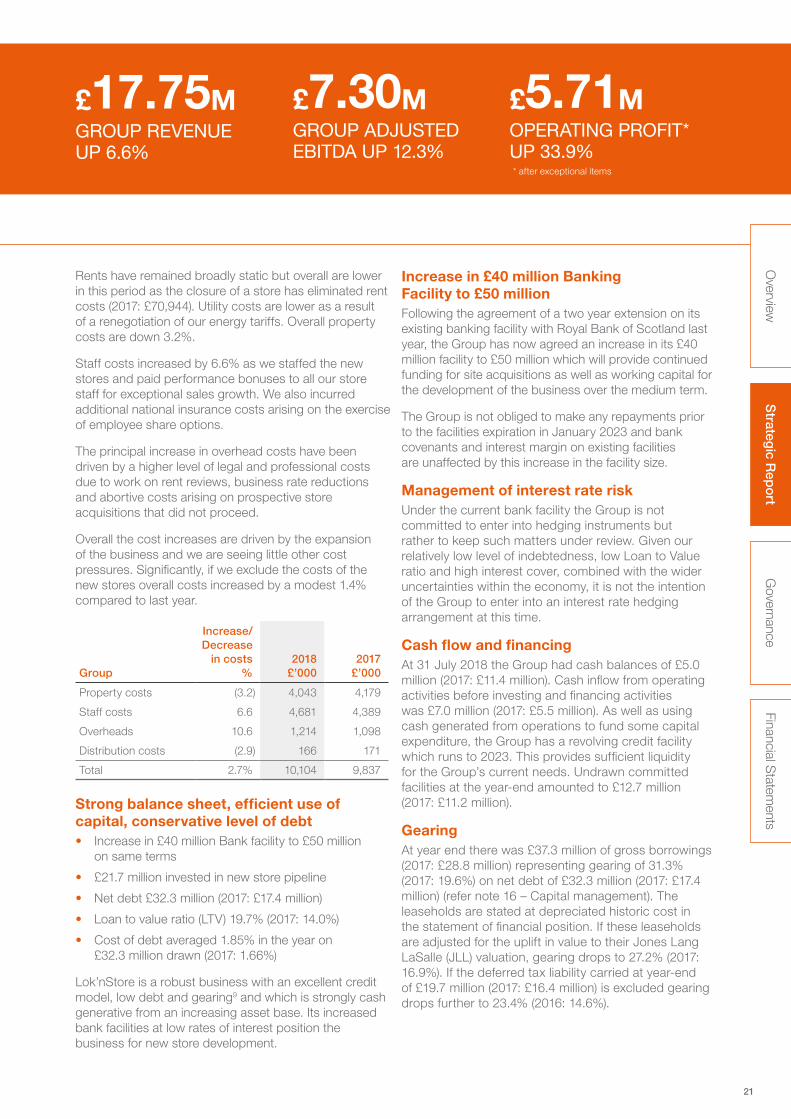
Rents have remained broadly static but overall are lower in this period as the closure of a store has eliminated rent costs (2017: £70,944). Utility costs are lower as a result of a renegotiation of our energy tariffs. Overall property costs are down 3.2%.
Staff costs increased by 6.6% as we staffed the new stores and paid performance bonuses to all our store staff for exceptional sales growth. We also incurred additional national insurance costs arising on the exercise of employee share options.
The principal increase in overhead costs have been driven by a higher level of legal and professional costs due to work on rent reviews, business rate reductions and abortive costs arising on prospective store acquisitions that did not proceed.
Overall the cost increases are driven by the expansion of the business and we are seeing little other cost pressures. Significantly, if we exclude the costs of the new stores overall costs increased by a modest 1.4% compared to last year.
Group
Increase/Decrease
in costs %
2018 £’000
2017£’000
Property costs (3.2) 4,043 4,179
Staff costs 6.6 4,681 4,389
Overheads 10.6 1,214 1,098
Distribution costs (2.9) 166 171
Total 2.7% 10,104 9,837
Strong balance sheet, efficient use of capital, conservative level of debt• Increase in £40 million Bank facility to £50 million
on same terms
• £21.7 million invested in new store pipeline
• Net debt £32.3 million (2017: £17.4 million)
• Loan to value ratio (LTV) 19.7% (2017: 14.0%)
• Cost of debt averaged 1.85% in the year on £32.3 million drawn (2017: 1.66%)
Lok’nStore is a robust business with an excellent credit model, low debt and gearing9 and which is strongly cash generative from an increasing asset base. Its increased bank facilities at low rates of interest position the business for new store development.
Increase in £40 million Banking Facility to £50 millionFollowing the agreement of a two year extension on its existing banking facility with Royal Bank of Scotland last year, the Group has now agreed an increase in its £40 million facility to £50 million which will provide continued funding for site acquisitions as well as working capital for the development of the business over the medium term.
The Group is not obliged to make any repayments prior to the facilities expiration in January 2023 and bank covenants and interest margin on existing facilities are unaffected by this increase in the facility size.
Management of interest rate riskUnder the current bank facility the Group is not committed to enter into hedging instruments but rather to keep such matters under review. Given our relatively low level of indebtedness, low Loan to Value ratio and high interest cover, combined with the wider uncertainties within the economy, it is not the intention of the Group to enter into an interest rate hedging arrangement at this time.
Cash flow and financingAt 31 July 2018 the Group had cash balances of £5.0 million (2017: £11.4 million). Cash inflow from operating activities before investing and financing activities was £7.0 million (2017: £5.5 million). As well as using cash generated from operations to fund some capital expenditure, the Group has a revolving credit facility which runs to 2023. This provides sufficient liquidity for the Group’s current needs. Undrawn committed facilities at the year-end amounted to £12.7 million (2017: £11.2 million).
Gearing At year end there was £37.3 million of gross borrowings (2017: £28.8 million) representing gearing of 31.3% (2017: 19.6%) on net debt of £32.3 million (2017: £17.4 million) (refer note 16 – Capital management). The leaseholds are stated at depreciated historic cost in the statement of financial position. If these leaseholds are adjusted for the uplift in value to their Jones Lang LaSalle (JLL) valuation, gearing drops to 27.2% (2017: 16.9%). If the deferred tax liability carried at year-end of £19.7 million (2017: £16.4 million) is excluded gearing drops further to 23.4% (2016: 14.6%).
* after exceptional items
21
Financial Review continued
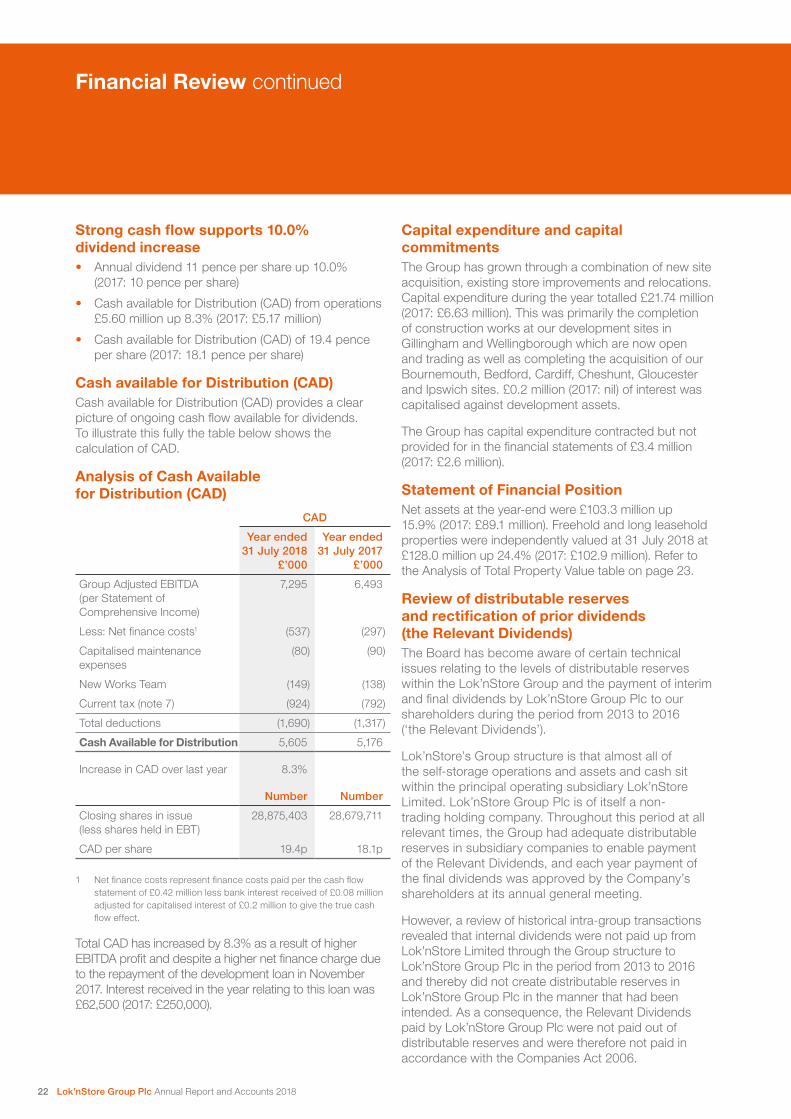
Strong cash flow supports 10.0% dividend increase • Annual dividend 11 pence per share up 10.0%
(2017: 10 pence per share)
• Cash available for Distribution (CAD) from operations £5.60 million up 8.3% (2017: £5.17 million)
• Cash available for Distribution (CAD) of 19.4 pence per share (2017: 18.1 pence per share)
Cash available for Distribution (CAD) Cash available for Distribution (CAD) provides a clear picture of ongoing cash flow available for dividends. To illustrate this fully the table below shows the calculation of CAD.
Analysis of Cash Available for Distribution (CAD)
CAD
Year ended 31 July 2018
£’000
Year ended 31 July 2017
£’000
Group Adjusted EBITDA (per Statement of Comprehensive Income)
7,295 6,493
Less: Net finance costs1 (537) (297)
Capitalised maintenance expenses
(80) (90)
New Works Team (149) (138)
Current tax (note 7) (924) (792)
Total deductions (1,690) (1,317)
Cash Available for Distribution 5,605 5,176
Increase in CAD over last year 8.3%
Number Number
Closing shares in issue (less shares held in EBT)
28,875,403 28,679,711
CAD per share 19.4p 18.1p
1 Net finance costs represent finance costs paid per the cash flow statement of £0.42 million less bank interest received of £0.08 million adjusted for capitalised interest of £0.2 million to give the true cash flow effect.
Total CAD has increased by 8.3% as a result of higher EBITDA profit and despite a higher net finance charge due to the repayment of the development loan in November 2017. Interest received in the year relating to this loan was £62,500 (2017: £250,000).
Capital expenditure and capital commitmentsThe Group has grown through a combination of new site acquisition, existing store improvements and relocations. Capital expenditure during the year totalled £21.74 million (2017: £6.63 million). This was primarily the completion of construction works at our development sites in Gillingham and Wellingborough which are now open and trading as well as completing the acquisition of our Bournemouth, Bedford, Cardiff, Cheshunt, Gloucester and Ipswich sites. £0.2 million (2017: nil) of interest was capitalised against development assets.
The Group has capital expenditure contracted but not provided for in the financial statements of £3.4 million (2017: £2.6 million).
Statement of Financial PositionNet assets at the year-end were £103.3 million up 15.9% (2017: £89.1 million). Freehold and long leasehold properties were independently valued at 31 July 2018 at £128.0 million up 24.4% (2017: £102.9 million). Refer to the Analysis of Total Property Value table on page 23.
Review of distributable reserves and rectification of prior dividends (the Relevant Dividends)The Board has become aware of certain technical issues relating to the levels of distributable reserves within the Lok’nStore Group and the payment of interim and final dividends by Lok’nStore Group Plc to our shareholders during the period from 2013 to 2016 (‘the Relevant Dividends’).
Lok’nStore’s Group structure is that almost all of the self-storage operations and assets and cash sit within the principal operating subsidiary Lok’nStore Limited. Lok’nStore Group Plc is of itself a non-trading holding company. Throughout this period at all relevant times, the Group had adequate distributable reserves in subsidiary companies to enable payment of the Relevant Dividends, and each year payment of the final dividends was approved by the Company’s shareholders at its annual general meeting.
However, a review of historical intra-group transactions revealed that internal dividends were not paid up from Lok’nStore Limited through the Group structure to Lok’nStore Group Plc in the period from 2013 to 2016 and thereby did not create distributable reserves in Lok’nStore Group Plc in the manner that had been intended. As a consequence, the Relevant Dividends paid by Lok’nStore Group Plc were not paid out of distributable reserves and were therefore not paid in accordance with the Companies Act 2006.
22 Lok’nStore Group Plc Annual Report and Accounts 2018

Strateg
ic Rep
ort
Overview
Governance
Financial Statem
ents
We are undertaking a series of procedural steps in order to rectify this issue and put the Company and its subsidiaries, in the position that was originally intended with respect to the creation of distributable reserves in Lok’nStore Group Plc.
We will put a resolution to shareholders at the forthcoming Annual General meeting to be held on 11 December 2018 which, if passed, would put all potentially affected parties, in so far as possible, in the position they would be had the Relevant Dividends been paid in accordance with the requirements of the Companies Act 2006. Full details will be included in the circular and notice of general meeting to be sent to shareholders.
TaxationThe Group will pay tax on its earnings and has made a tax provision of £0.92 million (2017: £0.79 million), an effective tax rate of 17.4% (2017: 20%). The deferred tax provision is calculated at forward corporation tax rates of 17% and is substantially a tax provision against the potential crystallisation (sales) of revalued properties and past ‘rolled over’ gains and amounts to £19.7 million (2017: £16.4 million) See note 18.
Market Valuation of Freehold and Operating Leasehold Land and Buildings It is the Group’s policy to commission an independent external valuation of its properties at each financial year-end.
Our thirteen freehold properties and one long leasehold are held in the statement of financial position at fair value and have been valued by JLL. Refer to note 10(b) – property, plant and equipment and also to the accounting policies for details of the fair value of trading properties.
The valuations of the leasehold stores held as ‘operating leases’ are not taken onto the statement of financial position. However these have also been valued and these valuations have been used to calculate the adjusted net asset value position of the Group. The value of our operating leases in the valuation totals £18.2 million (2017: £16.7 million) and we have reported by way of a note the underlying value of these leasehold stores in our revaluations and adjusted our Net Asset Value (NAV) calculation accordingly to include their value. This ensures comparable NAV calculations.
A deferred tax liability arises on the revaluation of the properties and on the rolled-over gain arising from the disposal of some trading stores. It is not envisaged that any tax will become payable in the foreseeable future on these disposals due to the availability of rollover relief. It is not the intention of the Directors to make any significant disposals of operational stores, although individual disposals may be considered where it is clear that added value can be created by recycling the capital into other store opportunities.
The Board will continue to commission independent valuations on its trading stores annually to coincide with its year-end reporting.
1 Includes related fixtures and fittings (refer to note 10b)
2 The seven leaseholds valued by JLL are all within the terms of the Landlord and Tenant Act (1954) giving a degree of security of tenure. The average length of the leases on the leasehold stores valued was 11 years and 1 month at the date of the 2018 valuation (2017 valuation: 10 years and 8 months).
3 For more details refer note 10b – Directors valuation
4 Includes £114,507 of capitalised interest
Total freeholds and long leasehold account for 89.1% of property valuations (2017: 87.0%).
Analysis of Total Property Value
No of stores/sites
31 July 2018 Valuation
£No of stores/
sites
31 July 2017 Valuation
£
Freehold & Long Leasehold valued by JLL1 14 128,000,000 12 102,900,000
Short Leasehold valued by JLL2 7 18,200,000 7 16,725,000
Freehold land and buildings at Director valuation 3 1 3,603,013 1 4,195,479
Subtotal 22 149,803,013 20 123,820,479
Sites in development at cost4 7 16,568,961 2 5,124,567
Total 29 166,371,974 22 128,945,046
23

Significant increase in Adjusted Net Asset Value per Share • Adjusted Net Asset Value per share up 15.3% to £4.80 (2017: £4.16)
Adjusted net assets per share are the net assets of the Group adjusted for the valuation of leasehold stores and deferred tax divided by the number of shares at the year-end. The shares currently held in the Group’s employee benefits trust (own shares held) and in treasury (zero) are excluded from the number of shares.
At July 2018 the adjusted net asset value per share (before deferred tax) increased 15.3% to £4.80 from £4.16 last year. This increase is a result of higher existing property values as well as the maiden valuations of our new stores as the strength of our landmark stores is recognised, and cash generated from operations, offset in part by an increase in the shares in issue due to the exercise of share options during the year.
Analysis of net asset value (NAV)
Group Year ended 31
July 2018 £’000
Group Year ended 31
July 2017£’000
Net assets 103,251 89,119
Adjustment to include operating/short leasehold stores at valuation
Add: JLL operating leasehold valuation 18,200 16,725
Deduct: leasehold properties and their fixtures and fittings at NBV (2,691) (2,878)
118,760 102,966
Deferred tax arising on revaluation of leasehold properties1 (2,636) (2,354)
Adjusted net assets 116,124 100,612
Shares in issueNumber
(‘000s)Number
(‘000s)
Opening shares in issue 29,303 29,109
Shares issued for the exercise of options 196 194
Closing shares in issue 29,499 29,303
Shares held in EBT (623) (623)
Closing shares for NAV purposes 28,876 28,680
Adjusted net asset value per share after deferred tax provision £4.02 £3.51
Adjusted net asset value per share before deferred tax provision
Adjusted net assets 116,124 100,612
Deferred tax liabilities and assets recognised by the Group 19,735 16,363
Deferred tax arising on revaluation of leasehold properties1 2,636 2,354
Adjusted net assets before deferred tax 138,495 119,329
Closing shares for NAV purposes 28,876 28,680
Adjusted net asset value per share before deferred tax provision £4.80 £4.16
1 A deferred tax adjustment in respect of the uplift in the value of the leasehold properties has been included, calculated by applying a tax rate of 17% (2017: 17%). Although this is a memorandum adjustment as leasehold properties are included in the Group’s financial statements at cost and not at valuation, this deferred tax adjustment is included in the adjusted net asset value calculation in order to maintain a consistency of tax treatment between freehold and leasehold properties.
Financial Review continued
24 Lok’nStore Group Plc Annual Report and Accounts 2018

Strateg
ic Rep
ort
Overview
Governance
Financial Statem
ents
IFRS UPDATE IFRS 16 LeasesAlthough not relevant for the year under review (or the next) when applied IFRS 16 will represent a significant change to the way that the Group will prepare its financial statements. The effective date of adoption is for accounting periods commencing after 1 January 2019 and will therefore apply to Lok’nStore’s financial statements for the year ended 31 July 2020.
Nevertheless it is important now to give the users of our financial statements sufficient overview of the effects of IFRS 16 on the profit and loss, balance sheet, financial performance and cash flows of the Group as a significant lessee in respect of our leased stores.
IFRS 16 will primarily affect the accounting by lessees and will result in the recognition of almost all leases on the balance sheet. The standard removes the current distinction between operating and financing leases and requires recognition of an asset (the right to use the leased item) and a financial liability to pay rentals for virtually all lease contracts.
The Statement of Profit or Loss: will also be affected because the total expense is typically higher in the earlier years of a lease and lower in later years. Additionally, the rent operating expense currently reported in these financial statements at £1.44 million (2017: £1.49 million) will be replaced with interest and depreciation as a consequence of the ‘capitalisation effect’ of the leases, so the Group’s key metric of Adjusted EBITDA will increase significantly by the removal of the rent expense from the operating profit and loss. Other performance measures including Operating Profit will also increase although reported interest and depreciation will be higher.
The Consolidated Statement of Cash Flows: While overall underlying cash flow is unaffected by the changes the presentation within the Consolidated Statement of Cash Flows will change. Reported operating cash flows will be higher as cash payments for the principal portion of the lease liability are classified within financing activities. Only the part of the payments that reflects interest can continue to be presented as operating cash flows.
The Statement of Financial Position: The Group’s operating leases on its leased stores will be recognised as a ‘right of use asset’ and as a corresponding liability at the year-end. Each lease payment is allocated between the liability and finance cost. The finance costs are charged to profit and loss over the lease period so as to produce a constant periodic rate of interest on the remaining liability for the period. The right-of-use asset is depreciated over the lease term on a straight line basis. Assets and liabilities arising from a lease will initially be measured on a present value basis which will include the fixed rental payments less any lease incentives receivable. If the interest rate implicit in the lease cannot be readily determined the lease payments will be discounted by the Group’s incremental borrowing rate (cost of debt) to obtain an asset of similar value over a similar term with similar security. Right of use assets will be measured at cost comprising the initial measurement of the lease liability plus any initial direct costs (if any). The Groups current operating lease commitments are reported in note 28.
The effect on financial ratios such as gearing or leverage will be to cause them to rise as the lease liability now forms part of net debt.
SummaryLok’nStore is a robust business with an excellent credit model, low debt and gearing and which is strongly cash generative from an increasing asset base. The business operates within the UK self-storage sector which is still relatively immature. With a low loan to value and flexible bank facilities through to 2023 this market presents an excellent opportunity for further growth of the business. Recently opened landmark stores in Gillingham and Wellingborough and our strong pipeline of more landmark stores demonstrate the Group’s ability to use those strengths to exploit the opportunities available.
25

Principal Risks and Uncertainties
Principal Risks and Uncertainties in operating our Business Risk management has been a fundamental part of the successful development of Lok’nStore. The process is designed to improve the probability of achieving our strategic objectives, keeping our employees safe, protecting the interests of our shareholders and key stakeholders, and enhancing the quality of our decision-making through understanding the risks inherent in both the day-to-day operations and the strategic direction of the Group as well as their likely impact.
Management of our risks helps us protect our reputation which is very important to the ability of the Group to attract customers particularly with the growth of social media. We always try to communicate clearly with our customers, suppliers, local authorities and communities, employees and shareholders and to listen and take account of their views. We operate strict Health and Safety policies and procedures and more information on these can be found on page 30.
Our Risk Management Governance The Board has overall responsibility for the management of the Group’s risks. As the Group’s strategic direction is reviewed and agreed the Board identifies the associated risks and works to reduce or mitigate them using an established risk management framework in conjunction with the executive management team. This is a continuing and evolving process as we review and monitor the underlying risk elements relevant to the business.
Risk Management Framework The Risk Register covers all areas of the business including property, finance, employees, insurance, customers, strategy, governance and disaster recovery. The risks are categorised by risk area and rated based on a combination of ‘likelihood’ and ‘consequences and impact’ on the business. The combination of these two becomes the ‘risk factor’ and any factor with a rating over 15 is reported to the Board.
Risk Management TeamRay Davies, Group Finance Director, is the Board member responsible for ensuring that the risk management and related control systems are effective and that the communication channels between the Board and the Executive Management team are open and working correctly. The Executive Management Team is responsible for the day to day management of the risk factors. Responsibility for identifying, managing and controlling the risk is assigned to an individual as shown on the risk register depending on the business area. Reporting against the risks forms part of the monthly executive management meeting and the risk factor may be amended if applicable. There are also sub-committees for particular risk areas which meet regularly. The Risk Management and Reporting Structure is shown below.
Our Risk Management and Reporting Structure
THE BOARD
CAPEX COMMITTEE PROPERTY RISK COMMITTEE
Reviews Risk Register in full twice a year Considers specific risk areas as raised by the Executive Board
Reviews risks at monthly executive management meetings and if material requests for the Board to consider risk at next scheduled Board Meeting (or earlier if necessary)
EXECUTIVE BOARD COMMITTEE
Meets Monthly
Manages proposed capital expenditure, actual spend, rolling capex requirements
Meets Quarterly
Considers: Risks associated with properties including Health & Safety
Environmental Impact
26 Lok’nStore Group Plc Annual Report and Accounts 2018

Strateg
ic Rep
ort
Overview
Governance
Financial Statem
ents
Principal RisksThe principal risks our business faces and our key mitigations are outlined in the table below.
Risk Description Key mitigation
Interest Rate and Liquidity Risk
The main risks arising from the Group’s financial instruments are interest rate risk and liquidity risk (for details please see note 16, page 80).
• Regular review by the Board (full details are set out in the Financial Review, page 21)
Tax Risk Changes to tax legislation may impact the level of corporation tax, capital gains tax, VAT and stamp duty land tax which would in turn affect the profits of the company.
• Regular monitoring of changes in legislation
• Use of appointed professional advisers and trade bodies
Property Acquisition
Acquiring new sites is a key strategic objective of the business but we face significant competition from other uses such as hotels, car showrooms and offices as well as from other self-storage operators.
• We hold weekly property meetings to manage the search process and property purchases
• Use of property acquisition consultants
• Regular communication with agents
• Attendance at industry relevant property events
Planning Permission
The process of gaining planning permissions remains challenging.
• Where we can we acquire sites subject to planning
• We work with an established external planning consultant
• Our property team has over 20 years’ experience
Construction Poor construction may affect the value of the property and/ or the efficient operation of the centre.
• We use a design and build contract with a variety of established contractors
• We use external project managers
• All projects are overseen by our property team which has over 20 years’ experience
Maintenance/Damage
Damage to properties through poor maintenance or flood or fire could render a centre inoperable.
• Regular site checks by staff
• Rolling maintenance plan for all stores
• Comprehensive disaster recovery plan
• Appropriate Insurance cover
Increased Competition
An increasing number of competitors in the industry may negatively impact Lok’nStore’s existing operations (e.g. pricing / available sites).
• Prominent locations
• High visibility
• Distinctive designs and bright orange elevations and strong signage to attract customers
• Continued investment in internet marketing
• Ensure high levels of customer service through training & monitoring
Employee Retention
Loss of employees may affect our ability to operate our stores and provide the high levels of customer service expected.
• Agreed aim to offer a good work/life balance and career development
• Regular reviews of remuneration levels against market
• Achievable bonus systems
• Generous Employee Share Schemes
• High quality training via Lok’nStore Academy (for further information see page 28)
• New Intranet for improved communications
• Established Employee rewards program
IT System Breach
A breach of our IT systems might adversely affect the operations of the business and our reputation.
• Strong and regularly reviewed IT security systems
• Well communicated policies and procedures for handling and managing a systems breach
27
Corporate Social Responsibility Report
Corporate and Social ResponsibilitiesLok’nStore conducts its business in a manner that reflects honesty, integrity and ethical conduct. Our Corporate Social Responsibility Report sets out our environmental policy and how we manage our impact on the environment and our policies and principles in relation to our responsibilities to stakeholders including suppliers, customers and employees.
We believe that the long-term success of our business is best served by respecting the interests of all of our stakeholders. Management of social, environmental and ethical issues is of high importance to Lok’nStore. These issues are dealt with on a day-to-day basis by the Group’s managers with principal accountability lying with the Board of Directors. We look for opportunities to address our responsibility to the environment, and we pay close attention to our energy use, carbon dioxide emissions, water use and waste production. A full assessment is set out below in our Environmental Policy.
CustomersWe believe in clarity and transparency. Brochures and literature are written in plain English, explaining clearly our terms of business without hiding anything in the small print. We are open and honest about our products and services and do not employ pressure selling techniques or attempt to take advantage of any vulnerable groups. If we make a mistake we acknowledge it, deal with the problem quickly, and learn from our error. We listen to our customers as we know that they can help us improve our service to them. In return a substantial amount of our business comes from previous customers, existing customers taking more space and customer referrals.
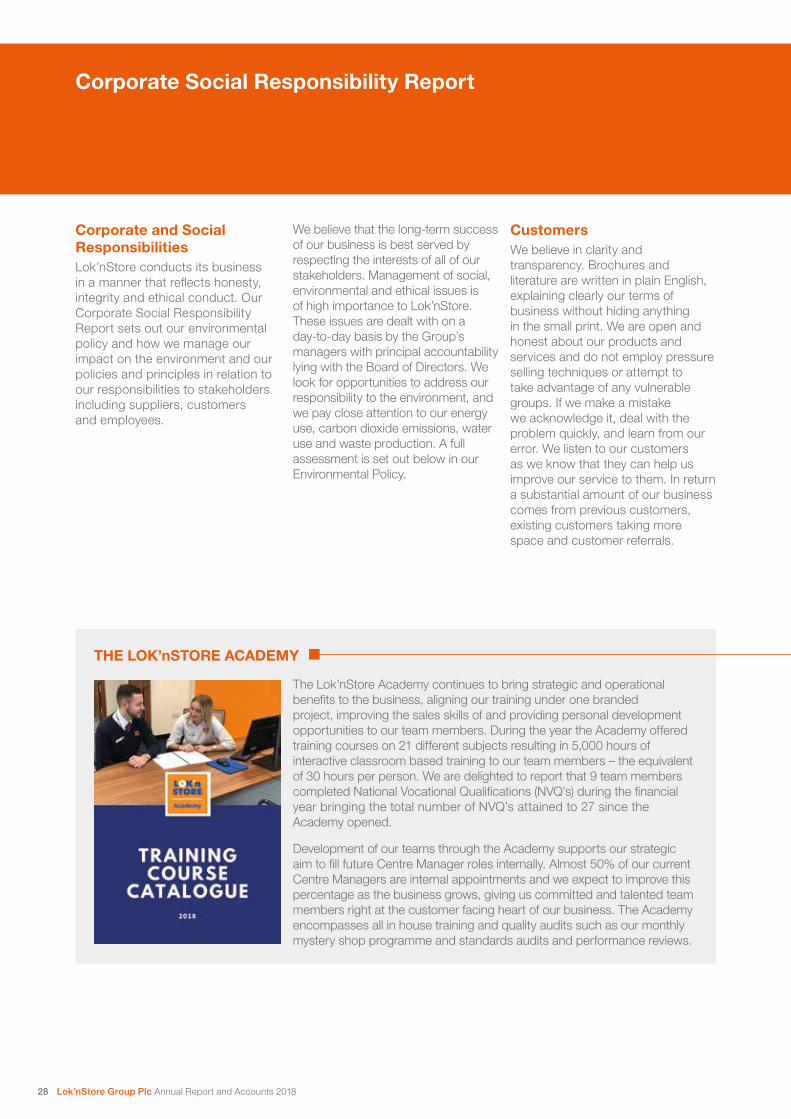
THE LOK’nSTORE ACADEMY
The Lok’nStore Academy continues to bring strategic and operational benefits to the business, aligning our training under one branded project, improving the sales skills of and providing personal development opportunities to our team members. During the year the Academy offered training courses on 21 different subjects resulting in 5,000 hours of interactive classroom based training to our team members – the equivalent of 30 hours per person. We are delighted to report that 9 team members completed National Vocational Qualifications (NVQ’s) during the financial year bringing the total number of NVQ’s attained to 27 since the Academy opened.
Development of our teams through the Academy supports our strategic aim to fill future Centre Manager roles internally. Almost 50% of our current Centre Managers are internal appointments and we expect to improve this percentage as the business grows, giving us committed and talented team members right at the customer facing heart of our business. The Academy encompasses all in house training and quality audits such as our monthly mystery shop programme and standards audits and performance reviews.
28 Lok’nStore Group Plc Annual Report and Accounts 2018
Strateg
ic Rep
ort
Overview
Governance
Financial Statem
ents
ENVIRONMENTAL CASE STUDY
As a socially responsible company Lok’nStore is committed to reducing the impact our operations have on the environment. To ensure this commitment is fulfilled for this year and in the future we are proud to confirm that electricity for the entire Lok’nStore Group now comes from 100% renewable energy.
Our electricity supplier obtains its energy either from renewable generators or from combined heat and power sources. The Group stipulates that all energy supplied must be from renewable generation. We believe that a large part of being a socially responsible company is ensuring our suppliers share our commitment to our green policies.
We continue to install photovoltaic (PV) solar panels on the roofs of our new buildings and are proud that we have managed to eliminate greenhouse gas emissions from our electricity consumption whilst exporting clean green energy to the national grid.
Further information on our environmental management and performance can be found on page 31.
SuppliersWe are committed to conducting our business with suppliers in a fair and honest manner, with openness and integrity, operating in accordance with the terms and conditions agreed upon. We expect our suppliers to operate to these same principles.
Policy on Payment of SuppliersThe Group does not follow any formal code or standard on payment practice. The Company’s policy, which is also applied by the Group, is to ensure that, in the absence of dispute, all suppliers are dealt with in accordance with standard payment practice, whereby all outstanding trade accounts are settled within the terms agreed with the supplier at the time of the supply or otherwise 30 days from invoice date. At the year-end the credit taken from suppliers by the Group was 40 days (2017: 43 days).
EmployeesAt 31 July 2018 we had 187 employees (2017: 167).
We treat our employees with dignity and respect and are committed to providing a positive attitude in the business and an enjoyable working environment. We have a professional open culture where staff can exchange ideas and offer suggestions for work and business improvement. This encourages our staff to build on their skills, through appropriate training and regular performance review. Regular training courses at our Farnborough Head Office support these objectives and we talk below about the contribution Lok’nStore Academy makes to this (see the case study on the work of the Academy). We have a large conference room which
can accommodate all our training requirements for the foreseeable future. This reduces outgoings and increases and improves contact between Head Office and the stores by bringing staff into Head Office for their training. This in turn contributes to attracting and retaining the right people which is key to the success of Lok’nStore.
A review of our pay levels was also undertaken in the year to ensure all of our employees are paid fairly and to check our levels are comparable in the market. Where necessary, pay levels were adjusted but the effect on employment costs was minimal.
This year we launched our company Intranet to provide a central point of knowledge for all employees across the organisation. The system is regularly updated with news, events and files making it a first point of reference for company communication and documents.
Share Ownership PlansWe are proud to have share ownership plans in which all employees are eligible to participate. Almost two thirds of our employees are members of our Share Incentive Plan (SIP) – a tax efficient equity scheme. SIP members purchased a total of 52,000 shares in the year and received a further 46,000 free shares on top of dividend reinvestment. This high level of participation is testament to the loyalty and commitment of our staff.
Our personnel are committed and motivated and help maintain the exemplary levels of friendly service that Lok’nStore provides to its customers. The Board would like to thank all of our staff for their commitment to our business and for their hard work and efforts over the year.
29

Corporate Social Responsibility Report continued
Employee Benefit Trust The Employee Benefit Trust owns 623,212 shares (2017: 623,212), the costs of which are shown as a deduction from shareholders’ funds. Full details are provided in note 26 – Own Shares.
Health and SafetyThe Board recognises the prime importance of maintaining high standards of Health & Safety and healthy working conditions for staff, customers, visitors, contractors and other people who may be affected by our business activities. Lok’nStore has a Property Risk Committee which meets every other month and considers issues relevant to Health and Safety and other risk issues within the Group under the overall supervision of Ray Davies, Finance Director, who carries Board responsibility for risk management.
The Health and Safety policy is reviewed by the Committee on an annual basis. It is also amended to include changes to Health and Safety Law as they occur. The Health and Safety policy clearly sets out the duties and responsibilities of the Chief Executive Officer, Managers and all staff within the Group.
Environmental Performance Lok’nStore remains committed to reducing waste and ensuring commitment to its green policies. We have been actively monitoring and measuring our environmental impacts since 2005. By monitoring environmental key performance indicators (eKPIs) including greenhouse gas emissions (GHG), water use and waste, and reviewing them against our stated Environmental Policy, we continue to achieve our stated aims; to manage waste effectively, control polluting emissions and to encourage suppliers to minimise their impact on the environment.
The UK government requires all quoted companies to report on their GHG emissions as part of their annual director’s report under the Companies Act 2006 (Strategic Report and Director’s Report) Regulations 2013. As in previous years, Lok’nStore engaged Trucost to review its reporting of environmental impacts for the financial year ending 31 July 2018. A summary of their findings is included on page 31. More detail can be found on our website.
30 Lok’nStore Group Plc Annual Report and Accounts 2018

Strateg
ic Rep
ort
Overview
Governance
Financial Statem
ents
5,000HOURS OF ACADEMY TRAINING
65% 100%OF EMPLOYEES ARE MEMBERS OF SHARE INCENTIVE PLAN
OF ELECTRICITY FROM RENEWABLE SOURCES
Environmental Management and Performance Highlights for the year ending 31 July 2018:
Impact Trend Comment
Direct Operational GHG Emissions (scope 1)
This year we worked with our customers to reduce the use of heating from gas sources whenever possible. This combined with an active reduction in mileage of Head Office staff countered the slight increase in mileage of our maintenance and service vans to effect an overall reduction in our direct operational GHG emissions.
Indirect Operational GHG Emissions (scope 2)
We continue to emit no indirect operational GHG emissions due to all our electricity coming from renewable feed stocks and onsite photovoltaic electricity generation. Where possible PV solar panels will be installed on all new sites going forward.
Water Consumption By identifying and resolving waste and leakage at the earliest opportunity we have continually reduced our consumption of water since 2005. Since 2005, absolute water consumption and water use intensity have decreased by 34% and 68% respectively.
Waste Generation Total waste generation decreased by 35% in the year and during the year we sent more waste to recycling than to landfill. We continue to promote recycling in our stores and offices to both our staff and our customers.
The company’s environmental reporting is consistent with, “Environmental Key Performance Indicators: Reporting Guidelines for UK Business 2006”
Lok’nStore’s GHG reporting for 2017–18 aligns with government guidelines
Trucost found that Lok’nStore assessed and disclosed all material environmental impacts – GHG emissions, water consumption and waste generation for its own facilities
Operational GHG emissions decreased by 8%. Since 2005, GHG emissions have decreased by 83% and when normalised by annual revenue have decreased by 92%
GHG emissions from the consumption of purchased electricity remains at 0 due to the Group’s use of electricity derived from renewable sources
The Board is committed to considering the impact our operations have on the environment and minimising them wherever possible. We will continue to monitor and report our environmental impacts in line with government guidelines.
The Strategic Report as set out in pages 7 to 31 was approved by the Board of Directors and authorised for issue on 26 October 2018 and signed on its behalf by:
Andrew Jacobs Ray DaviesChief Executive Officer Finance Director
31

32 Lok’nStore Group Plc Annual Report and Accounts 2018

Strategic R
eportO
verviewG
overnanceFinancial S
tatements
34 Board of Directors and Advisers36 Corporate Governance41 Directors’ Report43 Remuneration Report44 Statement of Directors’ Responsibilities 45 Independent Auditor’s Report to the
Members of Lok’nStore Group Plc
Governance
Lok’nStore Wellingborough opened in spring 2018 and early trading has been very good.
The prominent store, with its strong orange livery, can be seen from almost two miles away on the A509! Following the success of our two centres in Northampton, this becomes our third store to open in Northamptonshire.
Located just off the A45, the store sits in a perfect location on the main entrance to the Victoria Retail Park, home to a large Tesco Extra as well as Halfords and a B&M Homestore. With little established competition, the store offers storage space from 16 sq. ft. to over 5,000 sq. ft. and will attract customers from across Wellingborough and the surrounding areas.
SQUARE FEET OF MAXIMUM LETTABLE AREA
45,000
Wellingborough LANDMARK STORE
NOW
OPEN
33

Edward Luker (69) Senior Non-Executive Director
Andrew Jacobs (59) Chief Executive Officer
Simon Thomas (58) Non-Executive Chairman
Board of Directors and Advisers
NON-EXECUTIVE DIRECTORS
EXECUTIVE DIRECTORS
Ray Davies (61) Finance Director
Neil Newman-Shepherd (41) Director
Richard Holmes (58) Non-Executive Director
ExperienceAndrew established Lok’nStore over 20 years ago after 8 years working in the Japanese equity market. Andrew is responsible for strategy, corporate finance and property. He has an MPhil in Economics from Cambridge University and a BSc in Economics from LSE.
Key Areas of Expertise Strategy, corporate finance, economics and property.
ExperienceSimon joined Lok’nStore in 1997 following successful careers in the publishing and finance sectors. He worked at Reed International, Swiss Bank Corporation, Nomura International and co-founded the emerging markets investment trust business at LCF Edmond de Rothschild. Simon is responsible for the composition and performance of the Board.
Key Areas of Expertise Corporate Finance.
ExperienceEdward is a Fellow of the Royal Institution of Chartered Surveyors. Edward is a well-known figure in the UK property industry, having worked for CB Richard Ellis for 33 years, where he has been a Director and Partner for 20 years. Edward joined Lok’nStore in 2007.
Key Areas of Expertise Commercial Property.
ExperienceRichard joined Lok’nStore in 2000 having held senior marketing and commercial roles in Unilever, Boots (as Marketing Director and Commercial Director) and latterly Specsavers (as Group Marketing Director).
Key Areas of Expertise Marketing including digital marketing, and customer experience.
ExperienceRay is a Fellow of the Institute of Chartered Accountants and the Institute of Chartered Secretaries & Administrators. Prior to joining Lok’nStore in 2004, Ray held several senior finance positions in listed companies in the construction, health and fitness sectors.
Key Areas of Expertise Finance and accounting, corporate reporting, risk management, legal, tax and compliance.
ExperienceNeil joined the Lok’nStore Group in October 2006 becoming Sales Director in November 2015. Prior to joining Lok’nStore, Neil gained retail experience at Wickes and Woolworths plc. Neil is responsible for sales, marketing and our people.
Key Areas of Expertise Sales, Marketing and Human Resource Management.
34 Lok’nStore Group Plc Annual Report and Accounts 2018

Strategic R
eportO
verviewG
overnanceFinancial S
tatements
Secretary and Registered OfficeDentons Secretaries Limited One Fleet Place London EC4M 7WS
Nominated Adviser and BrokerfinnCap Ltd 60 New Broad Street London EC2M 1JJ
SolicitorsDentons UKMEA LLP (formerly Maclay Murray Spens LLP) One Fleet Place London EC4M 7WS
SolicitorsGlovers LLP 6 York Street London W1U 6QD
AuditorRSM UK Audit LLP 25 Farringdon Street London EC4A 4AB
RegistrarsLink Asset Services (Formerly Capita Registrars) Link Group 6th Floor, 65 Gresham Street, London EC2V 7NQ
SolicitorsGoodman Derrick LLP 10 St Bride Street London EC4A 4AD
To find out more visit: www.loknstore.com/investors/the-board
DIRECTORS AND ADVISERS
DirectorsThe Board of Directors is supported by an Assistant Company Secretary who assists the Chairman with the setting of meeting agendas and provides the information to the Board members prior to the meetings. A procedure to enable Directors to take independent professional advice if required has been agreed by the Board and formally confirmed by all Directors.
S.G. Thomas Non-Executive Chairman
A. Jacobs Chief Executive Officer
R.A. Davies Finance Director
N. Newman-Shepherd Director
E.T.D. Luker Senior Non-Executive Director
R.J. Holmes Non-Executive Director
C.P. Peal Non-Executive Director
In addition the Board is advised by:
Charles Peal (63) Non-Executive Director
ExperienceCharles joined Lok’nStore in 2007. Charles started his career in 1977 at 3i Group, the leading UK quoted Venture Capital Company. He was Chief Executive of Legal and General Ventures from 1988 to 2000 and has served on several boards since then.
Key Areas of Expertise Capital Markets and Fund Management.
Audit Committee
Remuneration Committee
Find out more about the Company’s committees on page 40.
The Board has over 100 years of self-storage experience.
35

Corporate Governance
The Board of Lok’nStore Group Plc has always sought to operate the highest level of governance standards appropriate to the size and nature of the Company. Although the Company has not been obliged to comply with a recognised code, its annual reporting has previously detailed how the company has followed the UK Corporate Governance Code and where it has departed from the code explained why.
In March 2018, the London Stock Exchange published Aim Notice 50 which requires AIM companies to state which of the recognised corporate governance codes the Board of directors has decided to apply, how the company complies with that code and where it departs from the code an explanation of the reasons for doing so. Having reviewed the two recognised codes, the Board has decided to apply the Quoted Companies Alliance’s Corporate Governance code (‘QCA Code’).
As Chairman it is my responsibility to ensure the Company complies with the QCA code and where the company deviates to explain why the Director’s believe this to be in the best interests of the Company. In this section, we hope to demonstrate our company’s good corporate governance structure and where our practices differ from the expectations set by the QCA Code, why they do so. You can find more information including our reporting directly referenced to the 10 principles of the QCA code on the corporate governance page in the investor section on our website.
Our Governance Structure
Internal ControlThe Board is responsible for ensuring that the Group has established and operates a system of internal control. In this context, internal control is defined as those policies and processes established to ensure that business objectives are achieved cost effectively, assets and shareholder value are safeguarded, and laws, regulations and policies are complied with. Controls can provide reasonable but not absolute assurance that risks are identified and adequately managed to achieve business objectives and to minimise material errors, losses and fraud or breaches of laws and regulations.
The Group operates a strict system of internal financial control, which is designed to ensure that the possibility of misstatement or loss is kept to a minimum. There is a comprehensive system in place for financial reporting and the Board receives a number of reports to enable it to carry out these functions in the most efficient manner. These procedures include the preparation of management accounts, forecast variance analysis and other ad hoc reports. There are clearly defined authority limits throughout the Group.
The Group continues to develop the internal audit function utilising operational management to make unannounced store visits as part of a process supported by audit control checklists and other procedures. This undertaking has contributed to sales by promoting efficient store management, but also addresses risk and credit control, cash and store banking, and space and customer management. The internal audit checks are designed to ensure any fraud or mismanagement is quickly identified. The Group has a whistle-blowing procedure within its staff handbook, which is issued to all staff. All employees may raise concerns about malpractice or improper or potentially illegal behaviour in confidence without concern of victimisation or disciplinary action.
THE BOARD
Remuneration Committee
Meets Once a Year
Chaired by Edward Luker
Capex Committee
Meets Monthly
Considers: proposed capital
expenditure, actual spend against budgets
Property Committee
Meets Weekly
Considers: Sites under
development New acquisitions
Property Risk Committee
Meets Quarterly
Considers: Risks associated with properties including HS&E
Audit Committee
Meets Twice a Year
Chaired by Charles Peal
See page 40 for more information See page 40 for more information
Meets Monthly
Considers: Strategy, Management accounts, Store operations,
Customer Issues & Human Resources
EXECUTIVE BOARD COMMITTEE
OPERATIONAL MANAGEMENTDay-to-day Business Delivery
36 Lok’nStore Group Plc Annual Report and Accounts 2018

Strategic R
eportO
verviewG
overnanceFinancial S
tatements
The DirectorsThe Board consists of three Executive Directors and Four Non-Executive Directors. The expertise of the directors covers Company Law, Corporate Finance, Economics, Finance and Accounting, Corporate Reporting, Risk Management, Tax and Compliance, Marketing, Operations, Property Law and Strategy.
Activities The Non-Executive Directors provide considerable support to the Chief Executive Officer and while much of this is via informal meetings, telephone calls and email correspondence, the Non-Executive Directors also lend their expertise and experience to other members of the management team (see ‘Our Board in Action’ for an account of this).
Conflicts of InterestThe Directors have a responsibility to act in the best interests of the Group and its Shareholders and in keeping with this responsibility it is imperative that Directors are aware of and properly manage potential conflicts of interest.
The table below shows the directorships that the current Group Directors hold in other Companies both inside and outside the Group:
The BoardThree Executive Directors and Four Non-Executive Directors
Meets: Considers: Receives:
5 times a year with teleconferences when required
• Financial strategy
• Company performance
• Major investments
• Capital resources
• Risk Management
• Reporting to shareholders
• Detailed management accounts against budgets
• A current trading appraisal
• Minutes of all subcommittees
• The Risk Register
• The Conflicts Register
Andrew Jacobs Andrew Jacobs (UK) Limited Lok’nStore Limited* Saracen DataStore Limited*
Ray Davies Ash Road SS Limited Davies Elise Consulting Limited Lincoln Space Solutions Limited Lok’nStore Limited* Lok’nStore Trustee Limited* ParknCruise Limited* Saracen DataStore Limited* Semco Engineering Limited* Semco Machine Tools Limited* Southern Engineering and Machinery Co. Limited*
Neil Newman-Shepherd Lok’nStore Limited*
Simon Thomas Lok’nStore Limited* Simon Thomas (UK) Limited
Edward Luker Edward Luker Consultancy Limited St George’s School Ascot Trust Limited
Richard Holmes Lok’nStore Limited* Lok’nStore Trustee Limited* First Contact Limited**
Charles Peal Warnborough Asset Management Limited
* Lok’nStore Group Companies
**Guernsey registered company
37
Corporate Governance continued
Conflicts of interest arise where an individual’s personal interests or those interests related to legitimate outside roles may conflict with the interests of the Group. This could, for example, inhibit open discussions or lead to a perception that the individual is acting outside of the Group’s interests.
It is recognised that conflicts of interest will inevitably occur from time to time and that Directors legitimately undertake roles outside of the Group. The Board therefore believes it is important to be transparent in terms of such interests and to ensure they are properly recorded and, where necessary, Directors will withdraw from decision-making if there is a danger of perceived conflict.
A register of interests is maintained by the Assistant Company Secretary and is circulated to the Directors in advance of each Board meeting. Conflicts of Interest are considered and authorised by the Board as they arise.
We report in note 29 related party transactions. Additionally, within note 29, in the interests of transparency we include items which, while not strictly falling within the definition of a related party transaction, are still considered matters of interest.
Board Evaluation and Composition
Board Attendance BoardAudit
CommitteeRemuneration
Committee
Annual General Meeting
% Attendance
Total Number of Meetings in 2017/2018
5 (2 Telecon) 2 1 1
Executive Directors
Andrew Jacobs 5 (2) n/a n/a 1 100%
Ray Davies 5 (2) n/a n/a 1 100%
Neil Newman-Shepherd 5 (2) n/a n/a 1 100%
Non-Executive Directors
Simon Thomas 5 (2) n/a n/a 1 100%
Edward Luker 5 (2) 2 1 1 100%
Charles Peal 5 (2) 2 n/a 1 100%
Richard Holmes 5 (1) n/a 1 1 89%
The 2018 QCA Code expects companies to, ‘evaluate board performance based on clear and relevant objectives, seeking continuous improvement.’ Our Executive Directors are evaluated on a quarterly basis via the company’s senior management review system in which objectives are set and performance against these objectives is subsequently measured. Remuneration is linked to these objectives and may include relevant performance targets such as number of new properties acquired or turnover growth. Our Non-executives were evaluated informally within this year’s review of our Board composition and we report on this below.
We have previously reported (against The UK Corporate Governance Code’s requirement that a smaller company should have at least 2 Non-Executive Directors that are deemed independent) that all of our non-executive directors have served for longer than 9 years and were therefore no longer deemed
independent. Our new code, the Quoted Companies Alliance Code, takes a more pragmatic approach stating that, ‘length of tenure does not automatically affect independence’ and that the Board should, ‘make a decision regarding such director’s independence.’
Therefore as part of our review of the Board composition this year we looked at the ability of our Non-Executive directors to be objective, the experience each of our non-executive directors brings to the business and the contribution they have made in the year. We established that the broad range of skills, expertise and attitude amongst the Executive and Non-Executive Directors includes all the matters that the Company deals with – strategy, property, finance, human resources, marketing, and organisation. Further the long experience of Board Members continues to be considered an asset and all express challenges freely and robustly.
38 Lok’nStore Group Plc Annual Report and Accounts 2018

Strategic R
eportO
verviewG
overnanceFinancial S
tatements
We also met with potential non-executive directors to explore what expertise they might bring to the Board and discussed the balance between new experiences and increasing costs. After careful consideration we concluded that the current composition of the Board remains in the best interest of shareholders and the company as a whole.
Non-Executive Directors who have served over 9 years must offer themselves for re-election at every Annual General Meeting and accordingly Simon Thomas, Edward Luker, Charles Peal and Richard Holmes offer themselves for re-election at every AGM.
Directors’ Remuneration The Remuneration Committee consists of Edward Luker (Chairman of the Committee) and Richard Holmes. The Committee meets and considers, within existing terms of reference, the remuneration policy and makes recommendations to the Board for each Executive Director. The Committee’s remuneration policy aims to design a package that will align the interests of Executive Directors and those of shareholders. The Executive Directors’ remuneration consists of a package of basic salary, bonuses and share options, which are linked to corporate achievements and these levels are determined by the Remuneration Committee.
Performance related bonuses are calculated in accordance with strict and measurable performance criteria. There are no specific performance conditions relating to the historic grant of share options beyond the share price performance. The Remuneration Committee has introduced appropriate performance criteria to apply for the grant of future share options as part of long term performance awards in order to meet the objectives of the business and accord with accepted corporate governance. The details of each Director’s remuneration are set out in note 6 in the financial statements.
The Committee meets once a year and considers proposals from the Chairman and Chief Executive Officer.
Shareholder RelationsWe aim to provide balanced, clear and transparent communications which allow our shareholders to understand our performance, strategy and prospects. Further aiding transparency is the fact that the Group has a straight forward capital structure; one class of shares and one lending bank.
The Directors also meet and discuss the performance of the Group with shareholders throughout the year with specific schedules to visit institutional investors, analysts and the media being held after the announcement of the half year and full year results. At the AGM the Board give a presentation of events and progress during the year. Attendee shareholders are encouraged to mix and engage with the Directors after the formal business of the AGM has concluded.
Regular Regulatory News Service announcements (RNS) are made via the London Stock Exchange throughout the year keeping all shareholders informed about acquisitions, trading conditions, director dealings etc. Queries raised by a shareholder, either verbally or in writing, are promptly answered by whoever is best placed on the Board to do so.
Accounting Dates and Reporting Calendar 2018
January H1 Period-End
February Pre-close Trading Statement (H1)
March
April Interim Results announced Institutional Investor visits
May
June Institutional Investor & Media Site visits
July Financial Year-End
August Pre-close Trading Statement
September
October Preliminary Statement Institutional Investor visits
November
December AGM
Accountability and AuditThe Board believes that the audited Annual Report and Accounts play an important part in presenting all shareholders with an assessment of the Group’s position and prospects. The Strategic Review contains a detailed consideration of the Group’s position and prospects.
39

Corporate Governance continued
Audit CommitteeThe Company has an Audit Committee, to whom the external auditor, RSM UK Audit LLP, reports. The Committee consists of Charles Peal (Chairman of the Committee) and Edward Luker. Charles Peal is the Committee’s Nominated Financial Expert (for details of Charles’s experience please see his biography on page 35).
The Committee is responsible for the relationship with the Group’s external auditor and the review of the Group’s financial reporting and internal controls.
The Committee meets prior to the announcement of the Group’s financial results to consider the Auditors’ Findings Report and consider any corresponding recommendations. It also convenes to discuss and review the findings of the external JLL Valuation Report prior to the Group’s year-end results. The Committee, would convene at other times should it be necessary.
The Audit Committee also undertakes a formal assessment of the auditor’s independence each year, which includes:
• a review of non-audit services provided to the Group and related fees;
• discussion with the auditor of a written report detailing all relationships with the Company and any other parties that could affect independence or the perception of independence;
• a review of the auditor’s own procedures for ensuring the independence of the audit firm and partners and staff involved in the audit, including the regular rotation of the audit partner every five years; and
• obtaining written confirmation from the auditor that, in their professional judgement, they are independent.
An analysis of the fees payable to the external audit firm in respect of both audit and non-audit services during the year is set out in note 5 to the financial statements.
The Committee is satisfied that the external auditor remains independent in the discharge of their audit responsibilities.
The Board will continue to review the Company’s corporate governance and annual reporting against the QCA Code and to implement appropriate systems in order to support the Directors in executing their responsibilities to all of the Company’s Stakeholders.
On behalf of the Board.
Simon G ThomasChairman26 October 2018
OUR BOARD IN ACTIONAs the Director responsible for Specsavers’ compliance with the General Data Protection Act (GDPR) our Non-Executive Director Richard Holmes’ knowledge and experience was invaluable in our own GDPR compliance project. Richard spent time with our team discussing the implications of the new rules and how our data collection and management processes might have to change in order to comply. He reviewed our project plan and supported the team towards compliance when the Act came into force in May this year.
Board Committees The following section introduces the Group’s committees, members and the terms of reference.
Nomination Committee A Nomination Committee would oversee the appointment of a new Director. Due to the relatively small size of the Company, the Board do not believe that a Nomination Committee is necessary. In the event of a proposal to appoint a new Director, this is discussed at a full Board meeting with each member being given the opportunity to meet the individual concerned prior to any formal decision being taken.
Each member of the Board is subject to the re-election provisions of the Articles of Association, which require them to offer themselves for re-election at least once every three years.
Remuneration CommitteeThe Remuneration Committee consists of Edward Luker (Chairman of the Committee) and Richard Holmes. The Committee meets once a year and considers, within existing terms of reference, the remuneration policy and makes recommendations to the Board for each Executive Director. Further the committee considers proposals from the Chief Executive Officer on the remuneration of the operational management team especially in relation to bonus share option awards under the long term performance related pay schemes.
The Committee’s remuneration policy aims to design a package that will align the interests of Executive Directors and those of shareholders. The Executive Directors’ remuneration consists of a package of basic salary, bonuses and long term performance related pay including share options, which are linked to corporate achievements and these levels are determined by the Remuneration Committee. The details of each Director’s remuneration are set out in the Remuneration Report on page 43 and more details are given in note 6 in the financial statements.
40 Lok’nStore Group Plc Annual Report and Accounts 2018

Strategic R
eportO
verviewG
overnanceFinancial S
tatements
Directors’ Report
The Directors submit their report and the audited financial statements of the Company and of the Group for the year ended 31 July 2018.
Principal ActivityThe principal activity of the Group during the year was that of providing self-storage and related services.
Review of the Business and Future DevelopmentsA detailed account of the Group’s progress during the year and its future prospects are set out in the Chairman’s Statement on page 2 and the Strategic Report on pages 7 to 31.
The key performance indicators are set out in the Highlights on page 1 and discussed in more detail in the Financial Review on page 20 and the Chief Executive’s Review on page 13. Commentary on financial risk management is included on page 26 and disclosures on financial instruments are provided in note 16.
Going ConcernA review of the Group’s business activities, together with the matters likely to influence its future development, performance and its position in the wider market are set out in the Strategic Report. The financial position of the Group, its cash flows and borrowing facilities are shown in the Statement of Financial Position, Cash Flow Statement and corresponding notes and policies contained within the financial statements.
Further information concerning the Group’s objectives, policies, its financial risk management objectives as well as details of financial instruments and credit and liquidity risk are also found in the Strategic Report and in the notes to the financial statements.
The Directors can report that, based on the Group’s budgets and financial projections, they have satisfied themselves that the business is a going concern. The Board has a reasonable expectation that the Company and the Group have adequate resources and facilities to continue in operational existence for the foreseeable future based on Group cash balances of £5.0 million, (2017: £11.4 million) undrawn committed facilities at 31 July 2018 of £12.7 million (2017: £11.2 million) and cash generated from operations (2018: £7.0 million 2017: £5.5 million). In February 2018, the Group increased its bank facility by £10 million to £50 million with Royal Bank of Scotland on equivalent terms; the Group will now operate its £50 million revolving credit facility with RBS plc until 14 January 2023. The Group is fully compliant
with all bank covenants and undertakings and is not obliged to make any repayments prior to expiration. The financial statements are therefore prepared on a going concern basis.
Dividend In respect of the current year, the Directors propose that a final dividend of 7.67 pence per share (2017: 6.33 pence) will be paid on 11 January 2019 to shareholders on the register on 30 November 2018. The corresponding ex-dividend date is 29 November 2018. The total estimated dividend to be paid is £2.22 million based on the number of shares in issue on 17 October 2018 as adjusted for shares held in the Employee Benefits Trust. This dividend is subject to approval by shareholders at the Annual General Meeting and has not been included as a liability in these financial statements.
Events after the Reporting DateReportable events after the reporting date are set out in note 31 in the financial statements.
DirectorsThe following Directors held office during the year and subsequently:
SG Thomas ETD LukerA Jacobs RJ HolmesRA Davies CP PealN Newman-Shepherd
Details of the interests of the Directors in the shares of the Company are set out below and details of their remuneration are disclosed in note 6 of the financial statements.
Biographical details of the Directors are set out on pages 34 and 35.
Reappointment of DirectorsRichard Holmes, Edward Luker and Charles Peal who have over 14, 11 and 11 years tenure respectively as Non-Executives are required under the Companies Act 2006 to offer themselves for re-election at every AGM and accordingly offer themselves for re-election at the next AGM. Simon Thomas by virtue of his accumulated tenure both as an executive and a non-executive director also offers himself for re-election at the next AGM.
Directors’ and Officers’ Liability InsuranceThe Company has liability insurance covering the Directors and Officers of the Company and its subsidiaries.
41

Substantial Shareholdings The Directors have been notified or are aware that the following are interested in 3% or more of the issued Ordinary Share capital of the Company as at 17 October 2018:
Current rank
% at 17 Oct 2018
Number of shares
Total shares in issue)
% at 13 Oct 2017
Number of shares
Total shares in issue)
Andrew Jacobs 1 17.64 5,204,600 17.75 5,205,600
Miton Asset Management 2 8.50 2,509,455 10.46 3,067,171
Simon Thomas 3 6.03 1,780,000 6.14 1,800,000
Canaccord Genuity Wealth Management (previously Hargreave Hale Investment Managers)
4 5.56 1,640,000 5.59 1,640,000
Cavendish Asset Management 5 5.07 1,496,500 5.14 1,507,750
Slater Investments 6 4.16 1,228,750 4.19 1,228,750
Downing 7 4.15 1,225,250 2.24 656,399
29,505,919 29,323,9231
1 Represents total shares in issue.
Market Valuation of Freehold Land and BuildingsThe changes in property, plant and equipment during the year and details of property valuations at 31 July 2018 are shown in note 10(b) to the Financial Statements. Further commentary on the property portfolio is contained in the Property Review on page 18 and in the Financial Review on page 22.
Share Buy-back AuthorityAuthority will be sought at the Company’s AGM on 11 December 2018 from shareholders to approve a share buyback authority. The buy-back authority will only be exercised in circumstances where the Directors regard such purchases to be in the best interests of shareholders as a whole.
Statement of Disclosure of Information to the AuditorThe Directors who were in office at the date of approval of these financial statements have confirmed that, as far as they are aware, there is no relevant audit information of which the auditor is unaware. Each of the Directors has confirmed that they have taken all the steps that they ought to have taken as Directors in order to make themselves aware of any relevant audit information and to establish that it has been communicated to the auditor.
Annual General MeetingThe Company’s Annual General Meeting will be held on 11 December 2018 at 5.30pm at the offices of Goodman Derrick LLP 10, St Bride Street London EC4A 4AD.
AuditorA resolution to reappoint RSM UK Audit LLP as auditor will be put to the members at the Annual General Meeting.
A formal notice together with explanatory circular and Form of Proxy will be sent to shareholders.
On behalf of the Board:
Ray DaviesDirector26 October 2018
Directors’ Report continued
42 Lok’nStore Group Plc Annual Report and Accounts 2018

Strategic R
eportO
verviewG
overnanceFinancial S
tatements
Remuneration Report
Although the Group is not required to set out a formal Remuneration Report we set out below the key components of the Directors’ remuneration in accordance with AIM Rule 19.
Base Salary: Provides competitive fixed remuneration to retain key employees and reflect their experience and expertise in the context of the role and set by reference to the market.
Annual and Monthly Bonuses: Aligns reward to key Group strategic objectives and drives short-term performance.
Long Term Incentive Plan: Following strict performance criteria aligns Executive Director interests with those of shareholders and rewards achievement of the long term plan. (See below and note 22(b) of the financial statements).
All Employee Scheme: The Group operates an HMRC approved Share Incentive Plan (SIP). This encourages share ownership by all employees and allows them to
share in the long term success of the Group. R Davies and N Newman, Executive Directors, also participate in this scheme.
Other Benefits: The benefits reported in the table below all relate to medical insurance premiums paid on behalf of the Directors. An additional benefit is Death in Service Insurance typically at four times base salary (subject to a cap of £0.5 million).
Service Contracts: Executive Directors’ service contracts operate on a rolling basis without a specific end-date providing for one year’s notice on the part of the Company and 6 months’ notice on the part of the employee. Non executives do not have service contracts with the Company but rather their appointments are governed by letters of appointment.
Directors’ remuneration
2018Emoluments
£Bonuses
£Pension
£Benefits
£Sub total
£
Gains on share options
£Total
£Executive:A Jacobs 216,487 26,000 – 4,272 246,759 – 246,759RA Davies 131,280 19,222 31,190 4,090 185,782 20,415 206,197Neil Newman-Shepherd 75,172 42,477 2,255 1,933 121,837 71,317 193,154Non-Executive:SG Thomas 30,000 – – 4,009 34,009 – 34,009RJ Holmes 21,648 – – – 21,648 – 21,648ETD Luker 27,061 – – – 27,061 – 27,061CP Peal 21,648 – – – 21,648 – 21,648
523,296 87,699 33,445 14,304 658,744 91,732 750,476
Details of the Directors remuneration is shown above. Key management personnel are defined as the Directors of the Group and the additional participants in the Long Term Partnership Performance Plan (LTPPP).
The following table shows a summary of the options held by Directors under all schemes. Refer notes 20 to 23 for details.
Total at 31 July 2018
A Jacobs 206,087
SG Thomas 25,217
RA Davies 254,719
N Newman-Shepherd 183,082
Total 669,105
The grant of options to Executive Directors and senior management is recommended by the Remuneration Committee on the basis of their contribution to the Group’s success. The options vest after two and a half or three years.
Unapproved Share Options – Long Term Partnership Performance Plan (LTPPP)On 2 July 2018 the Group adopted a Company Long Term Partnership Performance Plan (LTPPP). The Plan is a discretionary benefit offered by the Company for the benefit of selected key employees including Executive Directors. Its main purpose is to increase the interest of the employees in the Groups long term business goals and performance through share ownership. It contains specific performance criteria. Further details are set out in note 22(b) of the financial statements.
On behalf of the Board and signed on its behalf by:
Andrew Jacobs Ray DaviesChief Executive Officer Finance Director
43
Statement of Directors’ Responsibilities
The Directors are responsible for preparing the Strategic Report and Directors’ Report and the financial statements in accordance with applicable law and regulations.Company law requires the directors to prepare Group and Company Financial Statements for each financial year. The Directors are required by the AIM Rules of the London Stock Exchange to prepare Group financial statements in accordance with International Financial Reporting Standards (“IFRS”) as adopted by the European Union (“EU”) and have elected under company law to prepare the Company financial statements in accordance with IFRS as adopted by the EU.
The financial statements are required by law and IFRS adopted by the EU to present fairly the financial position of the Group and the Company and the financial performance of the Group. The Companies Act 2006 provides in relation to such financial statements that references in the relevant part of that Act to financial statements giving a true and fair view are references to their achieving a fair presentation.
Under company law the Directors must not approve the financial statements unless they are satisfied that they give a true and fair view of the state of affairs of the Group and the Company and of the profit or loss of the Group for that period.
In preparing the Group and Company financial statements the directors are required to:
a. select suitable accounting policies and then apply them consistently;
b. make judgements and accounting estimates that are reasonable and prudent;
c. state whether they have been prepared in accordance with IFRSs adopted by the EU; and
d. prepare the financial statements on the going concern basis unless it is inappropriate to presume that the Group and the Company will continue in business.
The Directors are responsible for keeping adequate accounting records that are sufficient to show and explain the Group’s and the Company’s transactions and disclose with reasonable accuracy at any time the financial position of the Group and the Company and enable them to ensure that the financial statements comply with the Companies Act 2006. They are also responsible for safeguarding the assets of the Group and the Company and hence for taking reasonable steps for the prevention and detection of fraud and other irregularities.
The Directors are responsible for the maintenance and integrity of the corporate and financial information on the Lok’nStore Group Plc websites.
Legislation in the United Kingdom governing the preparation and dissemination of financial statements may differ from legislation in other jurisdictions.
44 Lok’nStore Group Plc Annual Report and Accounts 2018
Strategic R
eportO
verviewG
overnanceFinancial S
tatements
Independent Auditor’s Report to the Members of Lok’nStore Group Plc
OpinionWe have audited the financial statements of Lok’nStore Group Plc (the ‘parent company’) and its subsidiaries (the ‘group’) for the year ended 31 July 2018 which comprises the consolidated statement of comprehensive income, the consolidated and company statements of change in equity, the consolidated and company statements of financial position, the consolidated statement of cash flows and notes to the financial statements, including a summary of significant accounting policies. The financial reporting framework that has been applied in their preparation is applicable law and International Financial Reporting Standards (IFRSs) as adopted by the European Union and, as regards the parent company financial statements, as applied in accordance with the provisions of the Companies Act 2006.
In our opinion:
• the financial statements give a true and fair view of the state of the group’s and of the parent company’s affairs as at 31 July 2018 and of the group’s profit for the year then ended;
• the group financial statements have been properly prepared in accordance with IFRSs as adopted by the European Union;
• the parent company financial statements have been properly prepared in accordance with IFRSs as adopted by the European Union and as applied in accordance with the Companies Act 2006; and
• the financial statements have been prepared in accordance with the requirements of the Companies Act 2006.
Basis for opinionWe conducted our audit in accordance with International Standards on Auditing (UK) (ISAs (UK)) and applicable law. Our responsibilities under those standards are further described in the Auditor’s responsibilities for the audit of the financial statements section of our report. We are independent of the group and the parent company in accordance with the ethical requirements that are relevant to our audit of the financial statements in the UK, including the FRC’s Ethical Standard as applied to SME listed entities and we have fulfilled our other ethical responsibilities in accordance with these requirements. We believe that the audit evidence we have obtained is sufficient and appropriate to provide a basis for our opinion.
Conclusions relating to going concernWe have nothing to report in respect of the following matters in relation to which the ISAs (UK) require us to report to you where:
• the directors’ use of the going concern basis of accounting in the preparation of the financial statements is not appropriate; or
• the directors have not disclosed in the financial statements any identified material uncertainties that may cast significant doubt about the group’s or the parent company’s ability to continue to adopt the going concern basis of accounting for a period of at least twelve months from the date when the financial statements are authorised for issue.
Key audit mattersKey audit matters are those matters that, in our professional judgment, were of most significance in our audit of the financial statements of the current period and include the most significant assessed risks of material misstatement (whether or not due to fraud) we identified, including those which had the greatest effect on the overall audit strategy, the allocation of resources in the audit and directing the efforts of the engagement team. These matters were addressed in the context of our audit of the financial statements as a whole, and in forming our opinion thereon, and we do not provide a separate opinion on these matters.
The key audit matter identified is the valuation of properties as set out below:
Property valuationRiskFair values are calculated using actual and forecast inputs such as: occupancy, capitalisation rates, maximum lettable area, operating expenses and net rent per square foot by property as at 31 July 2018. In addition, the external valuer applies professional judgement concerning market conditions and factors impacting individual properties.
We consider property valuation to be a significant and key risk of material misstatement as the valuation process is subjective and inherently judgemental in nature.
Refer to note 10(b) to the financial statements for the disclosures relating to the property valuations.
45

ApproachOur approach to auditing the valuations involved the following:
• We tested the integrity of the information provided to the external valuer by management by agreeing key inputs such as actual occupancy and profitability to underlying records and source evidence;
• We evaluated the competence, capabilities and objectivity of external valuation experts;
• We assessed the scope of the work which the external valuer was requested to perform by management and the valuation methodology applied;
• We discussed the valuations with the external valuer and challenged them on the key assumptions applied and focussed on properties we identified as having significant or unusual valuation movements (compared to underlying performance or previous periods); and
• We challenged management to justify the assumptions used in the model (particularly in respect of trading forecasts and comparison of those forecasts to actual results).
Our application of materialityWhen establishing our overall audit strategy, we set certain thresholds which help us to determine the nature, timing and extent of our audit procedures and to evaluate the effects of misstatements, both individually and on the financial statements as a whole. During planning we determined a magnitude of uncorrected misstatements that we judge would be material for the financial statements as a whole (FSM). During planning FSM was calculated at £559,500 which was not changed during the course of our audit. We agreed with the Audit Committee that we would report to them all unadjusted differences in excess of £20,000, as well as differences below those thresholds that, in our view, warranted reporting on qualitative grounds.
An overview of the scope of our auditOur audit was scoped by obtaining an understanding of the Group and its control environment, including Group-wide controls, and assessing the risks of material misstatement. The scope of our audit covered 100% of both consolidated profit before tax and consolidated net assets. Subsidiaries that were subject to audit exemption were audited to group materiality as part of the audit of the consolidated financial statements.
Other informationThe directors are responsible for the other information. The other information comprises the information included in the annual report, other than the financial statements and our auditor’s report thereon. Our opinion on the financial statements does not cover the other information and, except to the extent otherwise explicitly stated in our report, we do not express any form of assurance conclusion thereon.
In connection with our audit of the financial statements, our responsibility is to read the other information and, in doing so, consider whether the other information is materially inconsistent with the financial statements or our knowledge obtained in the audit or otherwise appears to be materially misstated. If we identify such material inconsistencies or apparent material misstatements, we are required to determine whether there is a material misstatement in the financial statements or a material misstatement of the other information. If, based on the work we have performed, we conclude that there is a material misstatement of this other information, we are required to report that fact. We have nothing to report in this regard.
Opinions on other matters prescribed by the Companies Act 2006In our opinion, based on the work undertaken in the course of the audit:
• the information given in the Strategic Report and the Directors’ Report for the financial year for which the financial statements are prepared is consistent with the financial statements; and
• the Strategic Report and the Directors’ Report have been prepared in accordance with applicable legal requirements.
Independent Auditor’s Report continuedto the Members of Lok’nStore Group Plc
46 Lok’nStore Group Plc Annual Report and Accounts 2018

Strategic R
eportO
verviewG
overnanceFinancial S
tatements
Matters on which we are required to report by exceptionIn the light of the knowledge and understanding of the group and the parent company and its environment obtained in the course of the audit, we have not identified material misstatements in the Strategic Report or the Directors’ Report.
We have nothing to report in respect of the following matters in relation to which the Companies Act 2006 requires us to report to you if, in our opinion:
• adequate accounting records have not been kept by the parent company, or returns adequate for our audit have not been received from branches not visited by us; or
• the parent company financial statements are not in agreement with the accounting records and returns; or
• certain disclosures of directors’ remuneration specified by law are not made; or
• we have not received all the information and explanations we require for our audit.
Responsibilities of directorsAs explained more fully in the directors’ responsibilities statement (set out on page 44), the directors are responsible for the preparation of the financial statements and for being satisfied that they give a true and fair view, and for such internal control as the directors determine is necessary to enable the preparation of financial statements that are free from material misstatement, whether due to fraud or error.
In preparing the financial statements, the directors are responsible for assessing the group’s and the parent company’s ability to continue as a going concern, disclosing, as applicable, matters related to going concern and using the going concern basis of accounting unless the directors either intend to liquidate the group or the parent company or to cease operations, or have no realistic alternative but to do so.
Auditor’s responsibilities for the audit of the financial statementsOur objectives are to obtain reasonable assurance about whether the financial statements as a whole are free from material misstatement, whether due to fraud or error, and to issue an auditor’s report that includes our opinion. Reasonable assurance is a high level of assurance, but is not a guarantee that an audit conducted in accordance with ISAs (UK) will always detect a material misstatement when it exists. Misstatements can arise from fraud or error and are considered material if, individually or in the aggregate, they could reasonably be expected to influence the economic decisions of users taken on the basis of these financial statements.
A further description of our responsibilities for the audit of the financial statements is located on the Financial Reporting Council’s website at: http://www.frc.org.uk/auditorsresponsibilities. This description forms part of our auditor’s report.
Use of our reportThis report is made solely to the company’s members, as a body, in accordance with Chapter 3 of Part 16 of the Companies Act 2006. Our audit work has been undertaken so that we might state to the company’s members those matters we are required to state to them in an auditor’s report and for no other purpose. To the fullest extent permitted by law, we do not accept or assume responsibility to anyone other than the company and the company’s members as a body, for our audit work, for this report, or for the opinions we have formed.
Graham Ricketts(Senior Statutory Auditor)For and on behalf of RSM UK Audit LLP, Statutory Auditor Chartered Accountants 25 Farringdon Street EC4A 4AB
26 October 2018
47

48 Lok’nStore Group Plc Annual Report and Accounts 2018

Financial Statements
50 Consolidated Statement of Comprehensive Income
51 Consolidated Statement of Changes in Equity52 Company Statement of Changes in Equity53 Statements of Financial Position54 Consolidated Statement of Cash Flows55 Accounting Policies64 Notes to the Financial Statements 94 Glossary95 Our Stores
Strategic R
eportO
verviewG
overnanceFinancial S
tatements
Lok’nStore Hemel Hempstead opened in November 2017 and is our tallest storage centre so far.
Located just off junction 8 of the M1 this striking centre, with its powerful cantilevered façade, is accessible from the main road off the motorway into the heart of Hemel Hempstead. Opposite is the soon-to-open Maylands Gateway Retail Park. With brands such as Aldi, Costa and McDonalds this will bring excellent footfall to the immediate area. With over 40% of new customers coming from passing traffic, this development will bring even more new customers to the store.
Hemel Hempstead is the 8th store we have opened under a management contract. Standing an impressive 18 metres above the ground, the store offers storage spaces of all sizes from 16sq ft. up to 5,000sq ft. over five floors.
SQUARE FEET OF MAXIMUM LETTABLE AREA
Hemel HempsteadLANDMARK STORE
NOW
OPEN45,000
49

Consolidated Statement of Comprehensive Income For the year ended 31 July 2018
Notes
GroupYear ended
31 July 2018£’000
GroupYear ended
31 July 2017£’000
Revenue 1(a) 17,754 16,654
Total property, staff, distribution and general costs 2(a) (10,459) (10,161)
Adjusted EBITDA1 7,295 6,493
Amortisation of intangible assets 10(a) (165) (165)
Depreciation 10(b) (1,980) (1,856)
Equity settled share based payments 21 (33) (97)
Carried interest – fees receivable 2(c) 361 –
Receivables from warranty claims 2(c) 230 –
Property disposal costs 2(c) – (15)
Store relocation costs 2(c) – (29)
Director retirement costs 2(c) – (69)
(1,587) (2,231)
Operating profit1 5,708 4,262
Finance income 3 80 309
Finance cost 4 (463) (606)
Profit before taxation 5 5,325 3,965
Income tax expense 7 (1,568) (904)
Profit for the year 3,757 3,061
Profit attributable to:
Owners of the parent 25 3,757 3,061
Other Comprehensive Income
Items that will not be reclassified to profit and loss
Increase in property valuation 15,723 7,772
Deferred tax relating to change in property valuation (2,698) (932)
13,025 6,840
Items that may be subsequently reclassified to profit and loss
Increase in fair value of cash flow hedges – 37
– 37
Other comprehensive income 13,025 6,877
Total comprehensive income for the year 16,782 9,938
Attributable to owners of the parent 16,782 9,938
Earnings per share
Basic 9 13.05p 11.02p
Diluted 9 12.83p 10.64p
1 Adjusted EBITDA and operating profit are defined in the accounting policies section of the notes to the financial statements.
50 Lok’nStore Group Plc Annual Report and Accounts 2018
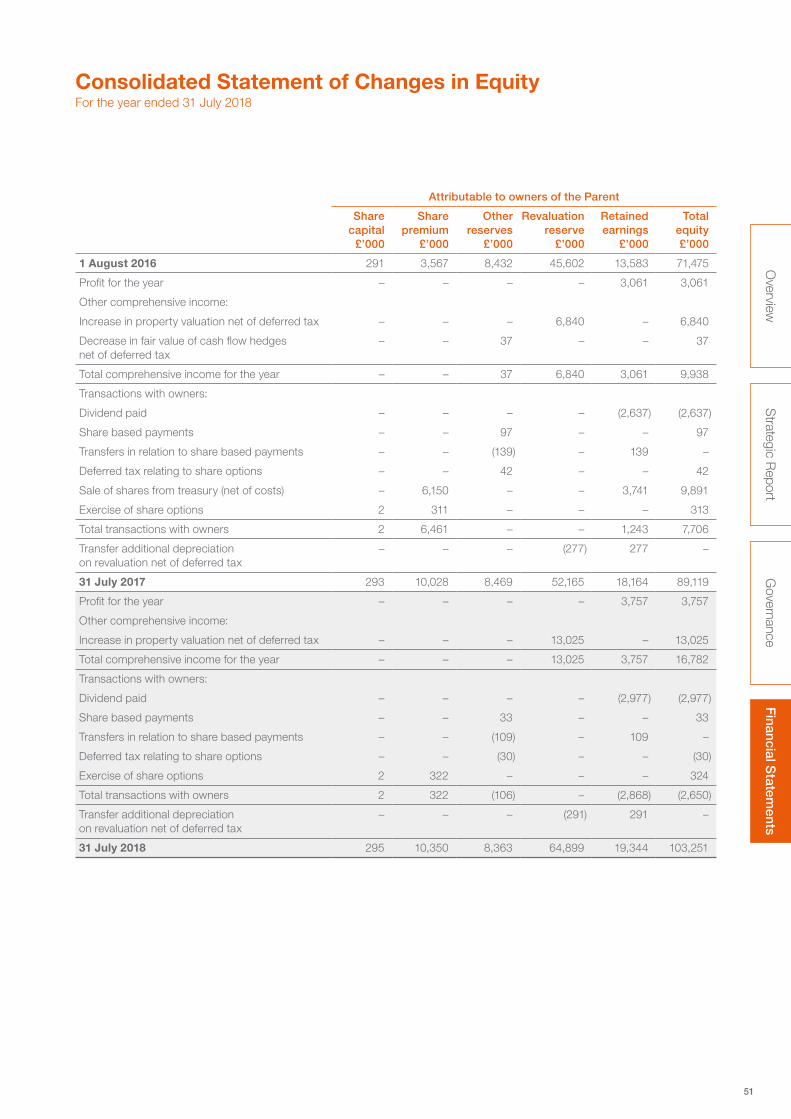
Strategic R
eportO
verviewG
overnanceFinancial S
tatements
Consolidated Statement of Changes in Equity For the year ended 31 July 2018
Attributable to owners of the Parent
Share capital
£’000
Share premium
£’000
Other reserves
£’000
Revaluation reserve
£’000
Retained earnings
£’000
Total equity £’000
1 August 2016 291 3,567 8,432 45,602 13,583 71,475
Profit for the year – – – – 3,061 3,061
Other comprehensive income:
Increase in property valuation net of deferred tax – – – 6,840 – 6,840
Decrease in fair value of cash flow hedges net of deferred tax
– – 37 – – 37
Total comprehensive income for the year – – 37 6,840 3,061 9,938
Transactions with owners:
Dividend paid – – – – (2,637) (2,637)
Share based payments – – 97 – – 97
Transfers in relation to share based payments – – (139) – 139 –
Deferred tax relating to share options – – 42 – – 42
Sale of shares from treasury (net of costs) – 6,150 – – 3,741 9,891
Exercise of share options 2 311 – – – 313
Total transactions with owners 2 6,461 – – 1,243 7,706
Transfer additional depreciation on revaluation net of deferred tax
– – – (277) 277 –
31 July 2017 293 10,028 8,469 52,165 18,164 89,119
Profit for the year – – – – 3,757 3,757
Other comprehensive income:
Increase in property valuation net of deferred tax – – – 13,025 – 13,025
Total comprehensive income for the year – – – 13,025 3,757 16,782
Transactions with owners:
Dividend paid – – – – (2,977) (2,977)
Share based payments – – 33 – – 33
Transfers in relation to share based payments – – (109) – 109 –
Deferred tax relating to share options – – (30) – – (30)
Exercise of share options 2 322 – – – 324
Total transactions with owners 2 322 (106) – (2,868) (2,650)
Transfer additional depreciation on revaluation net of deferred tax
– – – (291) 291 –
31 July 2018 295 10,350 8,363 64,899 19,344 103,251
51
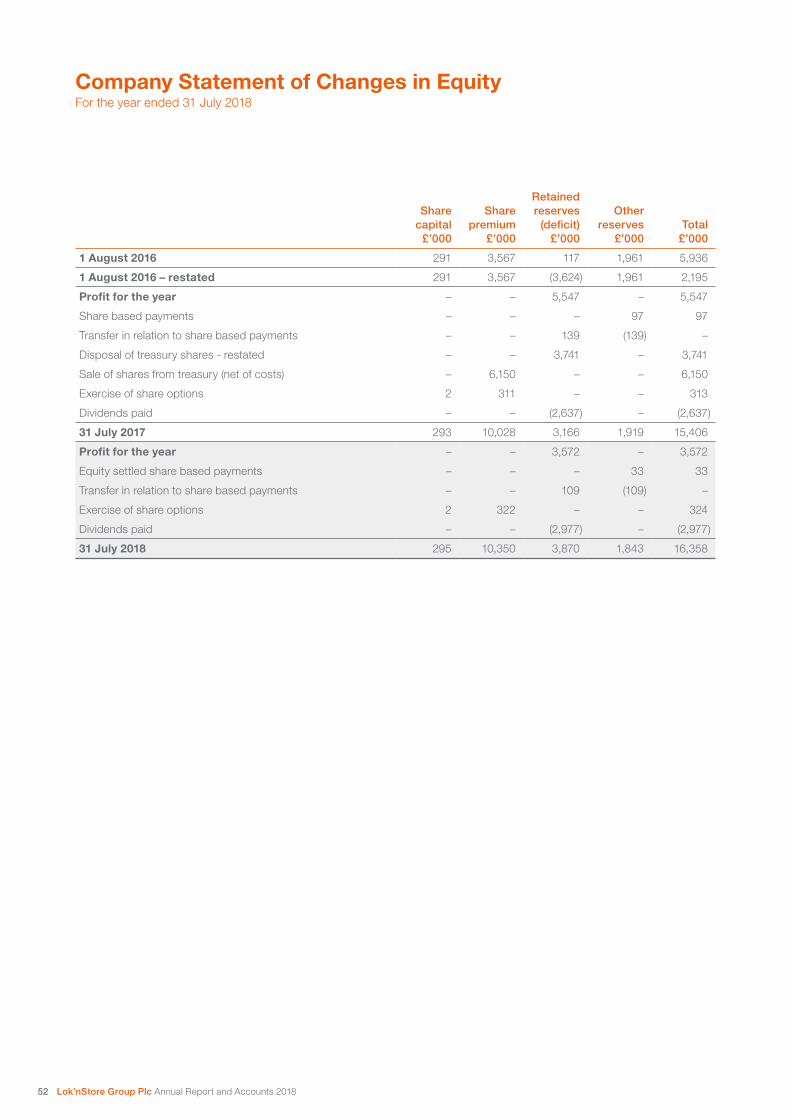
Share capital
£’000
Share premium
£’000
Retained reserves
(deficit) £’000
Other reserves
£’000Total
£’000
1 August 2016 291 3,567 117 1,961 5,936
1 August 2016 – restated 291 3,567 (3,624) 1,961 2,195
Profit for the year – – 5,547 – 5,547
Share based payments – – – 97 97
Transfer in relation to share based payments – – 139 (139) –
Disposal of treasury shares - restated – – 3,741 – 3,741
Sale of shares from treasury (net of costs) – 6,150 – – 6,150
Exercise of share options 2 311 – – 313
Dividends paid – – (2,637) – (2,637)
31 July 2017 293 10,028 3,166 1,919 15,406
Profit for the year – – 3,572 – 3,572
Equity settled share based payments – – – 33 33
Transfer in relation to share based payments – – 109 (109) –
Exercise of share options 2 322 – – 324
Dividends paid – – (2,977) – (2,977)
31 July 2018 295 10,350 3,870 1,843 16,358
Company Statement of Changes in Equity For the year ended 31 July 2018
52 Lok’nStore Group Plc Annual Report and Accounts 2018

Strategic R
eportO
verviewG
overnanceFinancial S
tatements
Notes
Group Company
2018 £’000
2017 £’000
2018 £’000
2017 £’000
Assets
Non-current assets
Intangible assets 10(a) 3,263 3,428 – –
Property, plant and equipment 10(b) 152,580 116,901 – –
Investments 11 – – 2,418 2,385
Development loan capital 12 – 3,463 – –
Financial assets 2(c)1 361 – – –
156,204 123,792 2,418 2,385
Current assets
Inventories 13 257 203 – –
Trade and other receivables 14 4,476 4,266 13,940 13,021
Cash and cash equivalents 16 4,990 11,386 – –
Total current assets 9,723 15,855 13,940 13,021
Total assets 165,927 139,647 16,358 15,406
Liabilities
Current liabilities
Trade and other payables 15 (5,159) (5,032) – –
Current tax liabilities (612) (463) – –
(5,771) (5,495) – –
Non-current liabilities
Borrowings 17 (37,170) (28,670) – –
Deferred tax 18 (19,735) (16,363) – –
(56,905) (45,033) – –
Total liabilities (62,676) (50,528) –
Net assets 103,251 89,119 16,358 15,406
Equity attributable to owners of the parent
Called up share capital 19 295 293 295 293
Share premium 10,350 10,028 10,350 10,028
Other reserves 24(a) 8,363 8,469 1,843 1,919
Retained earnings 25 19,344 18,164 3,870 3,166
Revaluation reserve 64,899 52,165 – –
Total equity attributable to owners of the parent 103,251 89,119 16,358 15,406
As permitted by section 408 Companies Act 2006, the parent company's statement of comprehensive income has not been included in these financial statements. The profit and comprehensive income for the year ended 31 July 2018 was £3.6 million (2017: £5.5 million).
Approved by the Board of Directors and authorised for issue on 26 October 2018 and signed on its behalf by:
Andrew Jacobs Ray DaviesChief Executive Officer Finance Director
Consolidated and Company Statements of Financial Position 31 July 2018Company Registration No. 04007169
53

Notes
Group 2018
£’000
Group 2017
£’000
Operating activities
Cash generated from operations 27(a) 6,982 5,523
Income tax paid (775) (502)
Net cash generated from operations 6,207 5,021
Investing activities
Development loan capital repaid / invested 3,463 (304)
Purchase of property, plant and equipment (21,935) (6,628)
Proceeds from warranty claims 342 –
Interest received 80 25
Net cash outflow from investing activities (18,050) (6,907)
Financing activities
Proceeds from new borrowings 8,519 –
Loans repaid from projects under management contracts – 944
Finance costs paid (419) (574)
Equity dividends paid (2,977) (2,637)
Proceeds from issue of ordinary shares (net) 324 313
Proceeds from sale of shares from treasury (net of expenses) – 9,891
Net cash inflow from financing activities 5,447 7,937
Net (decrease) / increase in cash and cash equivalents in the year (6,396) 6,051
Cash and cash equivalents at beginning of the year 11,386 5,335
Cash and cash equivalents at end of the year 4,990 11,386
No statement of cash flows is presented for the Company as it had no cash flows in either year.
Consolidated Statement of Cash Flows For the year ended 31 July 2018
54 Lok’nStore Group Plc Annual Report and Accounts 2018

Strategic R
eportO
verviewG
overnanceFinancial S
tatements
General InformationLok’nStore Group Plc is an AIM listed company incorporated and domiciled in England and Wales. The address of the registered office is One Fleet Place, London, EC4M 7WS, UK. Copies of this Annual Report and Accounts may be obtained from the Company’s head office at 112 Hawley Lane, Farnborough, Hants, GU14 8JE or the investor section of the Company’s website at http://www.loknstore.co.uk. The principal activities of the Group are described in the Strategic Report.
Basis of accountingThe annual financial statements have been prepared in accordance with International Financial Reporting Standards (IFRS) and International Financial Reporting Interpretations Committee (IFRIC) Interpretations as adopted by the European Union and comply with those parts of the Companies Act 2006 that are applicable to companies reporting under IFRS. The Group has applied all accounting standards and interpretations issued by the International Accounting Standards Board and International Financial Reporting Interpretation Committee relevant to its operations and effective for accounting periods beginning on or after 1 August 2017.
The financial statements have been prepared on the historic cost basis except that certain trading properties non-current financial assets are stated at fair value.
Standards adopted in the year Amendments to IAS 7 Disclosure Initiative (issued in January 2016) requires entities to provide information that enables users of financial statements to evaluate changes in liabilities arising from the entity’s financing activities. The effect of the amendments on the Group’s consolidated financial statements has been the inclusion of additional disclosures where appropriate.
Standards in issue but not yet effectiveAt the date of approval of these financial statements, the following principal standards and interpretations were in issue but not yet effective:
Standards, interpretations and amendments Endorsed
Effective date: Periods commencing on or after
IFRS 9 Financial Instruments 1 Jan 2018
IFRS15 Revenue from contracts with customers 1 Jan 2018
IFRS 2 Amendments, classification and measurement of share based payment transactions 1 Jan 2018
IFRS 16 Leases 1 Jan 2019
IFRIC 23 Uncertainty over income tax treatments 1 Jan 2019
Standards, interpretations and amendments Not Yet Endorsed
Effective date: Periods commencing on or after
IFRIC 23 Uncertainty over income tax treatments 1 Jan 2019
Subject to the adoption in due course of IFRS 16, the Directors do not anticipate that the adoption of these Standards will have a significant impact on the financial statements of the Group. With regard to IFRS 16, although the Group will not be adopting the Standard until its year ended 31 July 2020 the Directors consider that this will have a significant impact on the financial statements of the Group at that time and have provided an initial overview of the impact on the 2020 financial statements which is set out on page 25.
There were no other Standards or Interpretations issued but not yet effective at the date of authorisation of these financial statements that the Directors anticipate will have a material impact on the financial statements of the Group.
Basis of consolidationThe consolidated financial statements incorporate the financial statements of the Company and entities controlled by the Company (and its subsidiaries) made up to 31 July each year. Control is achieved where the Company has power over the investee, exposure or rights to variable returns from the investee and the ability to use its power to vary those returns.
Intra-group transactions, balances, and unrealised gains and losses on transactions between Group companies are eliminated on consolidation, except to the extent that intra-group losses indicate an impairment.
Accounting Policies
55

GoodwillGoodwill arising on consolidation represents the excess of the consideration transferred, the amount of any non-controlling interest and the fair value of any previous interest in the acquired entity over the fair value of the identifiable assets and liabilities of a subsidiary at the date of acquisition. Goodwill is recognised as a non-current asset.
Any deficiency of the consideration transferred, the amount of any non-controlling interest and the fair value of any previous interest in the acquired entity below the fair value of identifiable assets and liabilities of a subsidiary (i.e. discount on acquisition) is recognised directly in profit or loss.
Goodwill is reviewed for impairment at least annually. For the purposes of impairment testing, assets are grouped at the lowest levels for which there are separately identifiable cash flows, known as cash generating units, and goodwill is allocated to these units. If the recoverable amount of the cash generating unit is less than the carrying amount of the unit, the impairment loss is allocated first to reduce the carrying amount of any goodwill allocated to the unit and then to the other assets of the unit pro-rata on the basis of the carrying amount of each asset in the unit. Impairment losses in relation to goodwill are recognised immediately in profit or loss and are not reversed in subsequent periods.
Recoverable amount is the higher of fair value less costs to sell and value in use. In assessing value in use, the estimated future cash flows are discounted to their present value using a pre-tax discount rate that reflects current market assessment of the time value of money and the risks specific to the asset or CGU for which the estimate of future cash flows have not been adjusted.
Going concernThe Directors can report that, based on the Group’s budgets and financial projections, they have satisfied themselves that the business is a going concern. The Board has a reasonable expectation that the Company and the Group have adequate resources and facilities to continue in operational existence for the foreseeable future based on Group cash balances and cash equivalents of £5.0 million (2017: £11.4 million), undrawn committed bank facilities at 31 July 2018 of £12.7 million (2017: £11.2 million), and cash generated from operations in the year ended 31 July 2018 of £7.0 million (2017: £5.5 million).
Following the agreement last year of a two-year extension to its facilities with Royal Bank of Scotland on equivalent terms, the Group can continue to operate its £50 million revolving credit facility with RBS plc for a further 5 years. The facility has been in place since 15 January 2016 and will run until 14 January 2023. The Group is fully compliant with all bank covenants and undertakings and is not obliged to make any repayments prior to expiration. The financial statements are therefore prepared on a going concern basis.
Revenue recognitionRevenue comprises the fair value of the consideration received or receivable for goods and services provided in the ordinary course of the Group’s activities, net of discount, VAT and after eliminating sales within the Group.
The Group recognises revenue when the amount of the revenue can be reliably measured and when goods are sold and title has passed. Revenue from services provided is recognised evenly over the period in which the services are provided.
a) Self-storage revenueSelf-storage services are provided on a time basis. The price at which customers store their goods is dependent on size of unit and store location. Customers are invoiced on a four-weekly cycle in advance and revenue is recognised based on time stored to date within the cycle. When customers vacate they are rebated the unexpired portion of their four-weekly advance payment (subject to a seven day notice requirement).
b) Retail salesThe Group operates a packaging shop within each of its storage centres for selling storage related goods such as boxes, tape and bubble-wrap. Sales include sales to the public at large as well as self-storage customers. Sales of goods are recognised at point of sale when the product is sold to a customer.
Accounting Policies continued
56 Lok’nStore Group Plc Annual Report and Accounts 2018

Strategic R
eportO
verviewG
overnanceFinancial S
tatements
c) InsuranceCustomers may choose to insure their goods in storage. The weekly rate of insurance charged to customers is calculated based on the tariff per week for each £1,000 worth of goods stored by the customer. This charge is retained by Lok’nStore and covers the cost of the block policy and other costs. Customers are invoiced on a four-weekly basis for the insurance cover they use and revenue is recognised based on time stored to date within the cycle.
The Group provides insurance to customers through a block policy purchased from its insurer. Block policyholders supply VAT exempt insurance transactions as principals rather than insurance related services as intermediaries and accordingly insurance income received from the customer is recognised as revenue rather than offset against the costs of the block policy.
The key characteristics of a block policy are that:
• There is a contract between the block policyholder and the insurer which allows the block policyholder to effect insurance cover subject to certain conditions
• The Group acting in our own name as the block policyholder procures insurance cover for third parties from the insurer
• There is a contractual relationship between the block policyholder and third parties under which the insurance is procured
• The block policyholder stands in place of the insurer in effecting the supply of insurance to the third parties
The Group is not exposed to any insured losses arising from its insurance activity.
d) Management fee incomeManagement fees earned for managing stores not owned by the Group are recognised over the period for which the services are provided.
e) Serviced archive and records managementCustomers are invoiced typically monthly in advance for the archive storage of their boxes, tapes and files and revenue is recognised based on time stored to date within the monthly cycle. In respect of the provision of additional services, such as document box or tape collection and retrieval from archive, customers are invoiced typically monthly in arrears and revenue is recognised in line with the provision of these services.
Segmental informationIn accordance with the requirements of IFRS8 Operating Segments, the Group has reviewed its identifiable business segments and the information used and provided internally to the Board, which is considered to be the Chief Operating Decision Maker, in order to make decisions about resource allocation and performance management. Financial information is reported to the Board with revenue and profit analysed between self-storage activity and serviced archive and records management activity. All activities arise in the United Kingdom.
Adjusted EBITDAEarnings before interest, tax, depreciation and amortisation (EBITDA), is defined as defined as EBITDA before losses or profits on disposal, share-based payments, acquisition costs, and exceptional items, finance income, finance costs and taxation.
Adjusted Store EBITDAAdjusted Store EBITDA is defined as adjusted EBITDA (see above) but before central and head office costs.
Operating profitOperating profit is defined as profit after all costs except finance income, finance costs and taxation.
57

TaxationIncome tax expense represents the sum of the current tax payable and deferred tax.
Current tax payable or recoverable is based on taxable profit for the year. Taxable profit differs from profit as reported in the statement of comprehensive income because some items of income or expense are taxable or deductible in different years or may not be taxable or deductible. The Group’s liability for current tax is calculated using tax rates and laws that have been enacted or substantively enacted by the reporting date.
Deferred tax is the tax which may be payable or recoverable in the future arising from the temporary differences between the carrying amounts of assets and liabilities in the financial statements and the corresponding tax bases used in the computation of taxable profit. It is accounted for using the ‘balance sheet liability method’. Deferred tax is provided in full on the differences between the revalued amount of trading property assets carried in the Statement of Financial Position and their corresponding tax bases. Deferred tax liabilities are generally recognised for all taxable temporary differences and deferred tax assets are recognised to the extent that it is probable that taxable profits will be available against which deductible temporary differences can be utilised.
The carrying amount of deferred tax assets is reviewed at each reporting date and reduced to the extent that it is no longer probable that sufficient taxable profits will be available to allow all or part of the asset to be recovered.
Deferred tax is calculated at the tax rates that are expected to apply in the period when the liability is settled or the asset realised, based on tax rates that have been enacted or substantively enacted by the reporting date.
Tax is charged or credited to profit or loss, except when it relates to items charged or credited directly to other comprehensive income, in which case the tax is also recognised directly in other comprehensive income.
Retirement benefitsThe amount charged to profit or loss in respect of pension costs is the contributions payable to money purchase schemes in the year. Differences between contributions payable in the year and contributions actually paid are shown as either accruals or prepayments in the statement of financial position. There are no defined benefits schemes.
Equity share-based paymentsThe cost of providing share-based payments to employees is charged to profit or loss over the vesting period of the related share options. The cost is based on the fair value of the options determined at grant date using the Black-Scholes pricing model, which is appropriate given the vesting and other conditions attaching to the options. The value of the charge may be adjusted to reflect expected and actual levels of vesting.
Property lease premiumsCosts relating to the acquisition of long leases are classified as a non-current asset in the Statement of Financial Position. Costs may include lease premiums paid on entering such a lease and other related costs. Following the opening of a store during the year amounts held under lease premiums are transferred to property plant and equipment.
Property, plant and equipmentFreehold properties and long leasehold properties (classified as finance leases) are measured at fair value which represents the Group’s assessment of the highest and best use of the asset. Gains or losses arising from the changes in fair value of the trading properties are included in the Consolidated Statement of Changes in Equity for the period in which they arise. A comprehensive external valuation is performed annually at each reporting date. Once a store is opened lease premiums are transferred to property, plant and equipment and carried at their transferred cost less any accumulated depreciation.
Short leasehold improvements, fixtures, fittings and equipment, and motor vehicles are carried at cost less accumulated depreciation. Expenditure related to the improvement of the buildings is capitalised and depreciated over the remaining period of the lease term.
Assets in the course of construction and land held for development of new stores (‘development property assets’) are carried at cost, less any recognised impairment loss. Depreciation of these assets commences when the assets are ready for their intended use.
Accounting Policies continued
58 Lok’nStore Group Plc Annual Report and Accounts 2018

Strategic R
eportO
verviewG
overnanceFinancial S
tatements
Depreciation is provided on all property, plant and equipment other than freehold land and development property assets at rates calculated to write each asset down to its estimated residual value evenly over its expected useful life as follows:
Freehold property over 50 years straight lineLong leasehold property and lease premium over unexpired lease period or renewal termShort leasehold improvements over unexpired lease period or renewal termFixtures, fittings and equipment 5% to 15% reducing balanceComputer equipment over two years straight lineMotor vehicles 25% reducing balance
The assets’ residual values, useful lives and methods of depreciation are reviewed and adjusted if appropriate on an annual basis. An item of property, plant and equipment is derecognised upon disposal or when no future economic benefits are expected from its use or disposal.
The additional depreciation arising from the revaluation of freehold and long leasehold properties of £363,963 (2017: £346,219) is included within total depreciation on the face of the statement of comprehensive income and transferred from the revaluation reserve to retained earnings each year.
Intangible assets (other than goodwill)Customer relationships acquired in a business combination are measured initially at fair value and are subsequently amortised on a straight-line basis over their estimated useful lives (20 years).
Impairment of property, plant and equipment and intangible assets (other than goodwill)At each reporting date the Group reviews the carrying amounts of its property, plant and equipment and intangible assets to determine whether there is any indication that those assets have suffered an impairment loss. If any such indication exists the recoverable amount of the asset is estimated in order to determine the extent, if any, of the impairment loss. Where it is not possible to estimate the recoverable amount of an individual asset the Group estimates the recoverable amount of the cash-generating unit to which the asset belongs. If the recoverable amount of an asset or cash-generating unit is estimated to be less than its carrying amount, the carrying amount of the asset or cash-generating unit is reduced to its recoverable amount. An impairment loss is recognised immediately in profit or loss. Where an impairment loss is subsequently reversed, the carrying amount of the assets or cash-generating unit is increased to the revised estimate of its recoverable amount, not to exceed the carrying amount that would have been determined had no impairment loss been recognised for the asset or cash-generating unit in prior years. A reversal of an impairment loss is recognised immediately in profit or loss.
Leased assets and obligationsAnnual rentals under ‘operating leases’ are charged to profit or loss on a straight-line basis over the lease term. Payments made on entering into or acquiring a leasehold that is accounted for as an operating lease are amortised over the lease term once the property is brought into use. Whenever land and buildings are acquired by the Group they will not be acquired under finance leases but rather through a combination of operational cash generated by the Group business supported by bank debt drawn from its revolving credit facility.
InvestmentsShares in subsidiary undertakings are considered long-term investments and are classified as non-current assets in the parent company’s statement of financial position. All investments are stated at cost. Provision is made for any impairment in the value of non-current asset investments.
Inventories Inventories are stated at the lower of cost and net realisable value. Cost is determined on a first in, first out basis. Net realisable value is based upon estimated selling prices less any costs of disposal. Provision is made for obsolete and slow moving items.
59

Financial instrumentsFinancial assets and financial liabilities are recognised when the Group becomes a party to the contractual provision of the instrument.
Bank borrowings and finance costsInterest-bearing bank loans are recorded at the proceeds received net of direct issue costs. Issue costs are amortised against the carrying value amount of the loan over the period of the loan with the cost recognised in profit and loss as part of finance costs.
Borrowing costs are recognised in profit or loss in the year in which they are incurred, unless the costs are incurred as part of the development of a qualifying asset, when they will be capitalised. A qualifying asset is an asset that necessarily takes a substantial period of time to get ready for its intended use. Commencement of capitalisation is the date when the Group incurs expenditure for the qualifying asset, incurs borrowing costs and undertakes activities that are necessary to prepare the assets for their intended use. In the case of suspension of activities during extended periods, the Group suspends capitalisation. The Group ceases capitalisation of borrowing costs when substantially all of the activities necessary to prepare the asset for use are complete.
The Group has an active store development programme and in accordance with IAS 23 has material qualifying assets that take a substantial period of time to develop from acquisition to ultimate store opening. Accordingly borrowing costs have been capitalised in the current year that are directly attributable to the acquisition, construction and fit-out of these qualifying store assets. The Group funds these developments from a general bank revolving credit facility and the capitalisation rate applied is the average cost of these funds. When an individual store development is complete and the store has opened capitalisation of attributable borrowing costs ceases. In the current year £197,209 interest was capitalised in respect of nine qualifying development assets.
Derivative financial instruments and hedge accountingThe Group’s activities expose it to interest rate risk. The Group has used interest rate swap contracts to hedge these exposures. The Group does not use derivative financial instruments for speculative or for any other purposes.
The use of financial derivatives is governed by the Group’s policies as approved by the Board of Directors. The Group documents its risk management objectives and strategy for undertaking hedging transactions within the Group’s Risk Register. The Group also documents its assessment both at hedge inception and on an on-going basis to assess whether the derivatives that are used are effective in offsetting changes in fair value or cash flows of the hedged items.
There were no financial derivatives held by the Group at 31 July 2017 or 31 July 2018.
Cash flow hedgesHedges of exposures to variable cash flows attributable to a particular risk associated with a recognised asset or liability or a highly probable forecast transaction that could affect profit or loss are accounted for as cash flow hedges when the hedging criteria has been achieved. The Group designates certain derivative instruments as hedges of the variable rate borrowings. The effective portion of changes in the fair value is recognised in other comprehensive income whilst the gain or loss on the ineffective portion is recognised immediately in profit or loss.
Amounts accumulated in other comprehensive income are recycled to profit or loss in the periods when the hedged item affects profit or loss. However when a forecast transaction that is hedged results in the recognition of a non-financial asset, the gains and losses previously deferred into other comprehensive income are transferred from other comprehensive income and included in the initial measurement of the cost of the asset.
Loans and receivablesTrade receivables, loans, and other receivables that have fixed or determinable payments that are not quoted in an active market are classified as loans and receivables. Loans and receivables are initially recognised at fair value plus transaction costs and subsequently measured at amortised cost using the effective interest method, less any impairment. Interest income is recognised by applying the effective interest rate, except for short-term receivables when the recognition of interest would be immaterial.
Accounting Policies continued
60 Lok’nStore Group Plc Annual Report and Accounts 2018

Strategic R
eportO
verviewG
overnanceFinancial S
tatements
Liabilities and equityFinancial liabilities and equity instruments issued by the Group are classified according to the substance of the contractual arrangements entered into. An equity instrument is any contract that evidences a residual interest in the assets of the Group after deducting all of its liabilities and includes no obligation to deliver cash or other financial assets. Equity instruments issued by the Group are recorded at the proceeds received, net of direct issue costs. Interest bearing loans and overdrafts are initially measured at fair value net of direct transaction costs and are subsequently measured at amortised cost, using the effective interest rate method. Any difference between the proceeds net of transaction costs and the settlement or redemption of borrowings is recognised over the term of the borrowing.
Trade and other payables are initially recognised at fair value and are subsequently stated at amortised cost using the effective interest rate method.
Cash and cash equivalentsCash and cash equivalents comprises cash and short-term deposits and other short term highly liquid investments that are readily convertible to a known amount of cash. The carrying amounts of these assets approximate to their fair value and the risk of changes in value is not significant.
Financial assetsTrade, group and other debtors which are receivable within one year and which do not constitute a financing transaction are initially measured at the transaction price and subsequently measured at amortised cost being the transaction price less any amounts settled and any impairment losses. Where the Group is entitled to receive cash under a management services agreement at a future specified date this is recorded as a financial asset at the current fair value of the cash ultimately receivable. Where this amount is receivable in more than one year hence the financial asset is presented as a non-current asset.
Impairment of financial assetsFinancial assets are assessed for indications of impairment at each reporting date. Financial assets are impaired where there is objective evidence that, as a result of one or more events that occurred after the initial recognition of the financial asset, the estimated amount or timing of future cash flows from the asset have been reduced.
The carrying amount of the financial asset is reduced by the impairment loss directly for all financial assets with the exception of trade receivables, where the carrying amount is reduced through the use of an allowance account. When a trade receivable is considered uncollectible, it is written off against the allowance account. Subsequent recoveries of amounts previously written off are credited against the allowance account. Changes in the carrying amount of the allowance account are recognised in profit or loss.
Net debtNet debt comprises the borrowings of the Group less cash and cash equivalents.
ProvisionsProvisions are recognised when the Group has a present obligation as a result of a past event which it is probable will result in an outflow of economic benefits that can be reliably estimated.
Employee Benefit TrustThe Group operates an employment benefit trust and has de facto control of the shares held by the trust and bears their benefits and risks. The Group records certain assets and liabilities of the trust as its own. Finance costs and administrative expenses are charged as they accrue.
Own sharesThe cost of own shares held by the employee benefit trust (‘ESOP shares’) and treasury shares is shown as a deduction from retained earnings. Earnings per share are calculated on the net shares in issue.
61

Critical accounting estimates and judgementsThe preparation of financial statements under EU-IFRS requires management to make estimates and assumptions that may affect the application of accounting policies and the reported amounts of assets and liabilities, income and expenses. Actual outcomes may differ from these estimates and assumptions. The estimates and assumptions that have a significant risk of causing a material adjustment to the carrying amounts of assets and liabilities within the next financial year are discussed below.
a) Estimate of fair value of trading propertiesThe Group commissions an external valuation of its self-storage stores. This valuation uses a discounted cash flow methodology which is based on current and projected net operating income. Principal assumptions underlying management’s estimation of the fair value are those relating to stabilised occupancy levels; expected future growth in storage rents and operating costs, maintenance requirements, capitalisation rates and discount rates. A more detailed explanation of the background and methodology adopted in the valuation of the Group’s trading properties is set out in note 10(b). The carrying value of land and buildings held at valuation at the reporting date was £108.5 million (2017: £87.5 million) as shown in the table in note 10(b).
b) Assets in the course of construction and land held for store development (‘Development property assets’)The Group’s development property assets are held in the statement of financial position at historic cost and are not valued externally. In acquiring sites for redevelopment into self-storage facilities, the Group estimates and makes judgements on the potential net lettable storage space that it can achieve in its planning negotiations, together with the time it will take to achieve maturity occupancy level. In addition, assumptions are made on the storage rent that can be achieved at the store by comparison with other stores within the portfolio and within the local area. These judgements, taken together with estimates of operating costs and the projected construction cost, allow the Group to calculate the potential net operating income at maturity, projected returns on capital invested and hence to support the purchase price of the site at acquisition. Following the acquisition, regular reviews are carried out taking into account the status of the planning negotiations, and revised construction costs or capacity of the new facility, for example, to make an assessment of the recoverable amount of the development property. The Group reviews all development property assets for impairment at each reporting date in the light of the results of these reviews. Once a store is opened it is valued as a trading store.
The carrying value of development property assets at the reporting date was £16.6 million (2017: £5.1 million). Please see note 10(b) for more details.
c) Estimate of useful lives of intangible assets acquired in business combinationThe relative size of the Group’s intangible assets excluding goodwill make the estimates of useful lives important to the Group’s financial position and performance. At 31 July 2018 intangible assets, excluding goodwill, amounted to £2.15 million (2017: £2.32 million). The valuation method used and key assumptions are described in note 10(a).
The useful life used to amortise intangible assets relates to the expected future performance of the assets acquired and management’s judgement of the period over which economic benefit will be derived from the asset. The estimated useful life of customer relationships principally reflects management’s view of the average economic life of the customer base and is assessed by reference to customer churn rates. Typically the customer base for a serviced archive business is relatively inert. Corporate customers do not tend to switch service providers and indeed they incur charges should they do so. An increase in churn rates may lead to a reduction in the estimated useful life and an increase in the amortisation charge.
Accounting Policies continued
62 Lok’nStore Group Plc Annual Report and Accounts 2018
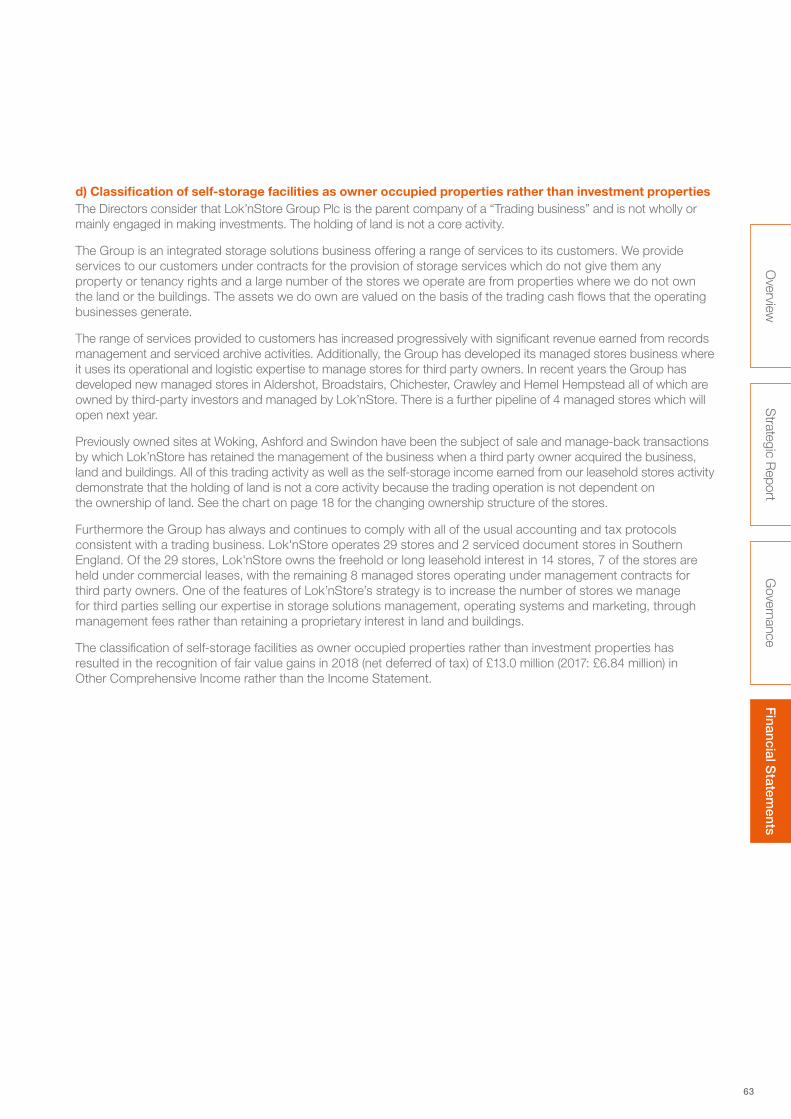
Strategic R
eportO
verviewG
overnanceFinancial S
tatements
d) Classification of self-storage facilities as owner occupied properties rather than investment propertiesThe Directors consider that Lok’nStore Group Plc is the parent company of a “Trading business” and is not wholly or mainly engaged in making investments. The holding of land is not a core activity.
The Group is an integrated storage solutions business offering a range of services to its customers. We provide services to our customers under contracts for the provision of storage services which do not give them any property or tenancy rights and a large number of the stores we operate are from properties where we do not own the land or the buildings. The assets we do own are valued on the basis of the trading cash flows that the operating businesses generate.
The range of services provided to customers has increased progressively with significant revenue earned from records management and serviced archive activities. Additionally, the Group has developed its managed stores business where it uses its operational and logistic expertise to manage stores for third party owners. In recent years the Group has developed new managed stores in Aldershot, Broadstairs, Chichester, Crawley and Hemel Hempstead all of which are owned by third-party investors and managed by Lok’nStore. There is a further pipeline of 4 managed stores which will open next year.
Previously owned sites at Woking, Ashford and Swindon have been the subject of sale and manage-back transactions by which Lok’nStore has retained the management of the business when a third party owner acquired the business, land and buildings. All of this trading activity as well as the self-storage income earned from our leasehold stores activity demonstrate that the holding of land is not a core activity because the trading operation is not dependent on the ownership of land. See the chart on page 18 for the changing ownership structure of the stores.
Furthermore the Group has always and continues to comply with all of the usual accounting and tax protocols consistent with a trading business. Lok'nStore operates 29 stores and 2 serviced document stores in Southern England. Of the 29 stores, Lok'nStore owns the freehold or long leasehold interest in 14 stores, 7 of the stores are held under commercial leases, with the remaining 8 managed stores operating under management contracts for third party owners. One of the features of Lok’nStore’s strategy is to increase the number of stores we manage for third parties selling our expertise in storage solutions management, operating systems and marketing, through management fees rather than retaining a proprietary interest in land and buildings.
The classification of self-storage facilities as owner occupied properties rather than investment properties has resulted in the recognition of fair value gains in 2018 (net deferred of tax) of £13.0 million (2017: £6.84 million) in Other Comprehensive Income rather than the Income Statement.
63

1(a) Revenue Analysis of the Group’s revenue is shown below:
Self-storage
Group 2018
£’000
Group 2017
£’000
Self-storage revenue 13,094 12,343
Other storage related revenue 1,585 1,550
Total self-storage revenue 14,679 13,893
Ancillary revenue 159 14
Management fees 534 420
Sub-total 15,372 14,327
Serviced archive & records management revenue 2,382 2,327
Total revenue per statement of comprehensive income 17,754 16,654
1(b) Segmental informationIFRS 8 Operating Segments requires operating segments to be identified on the basis of internal reports about components of the Group that are regularly reviewed by the Board to allocate resources to the segments and to assess their performance. All of the Group’s activities occur in the United Kingdom.
Financial information is reported to the Board with revenue and profit analysed between self-storage activity and serviced document storage activity. Segment revenue comprises of sales to external customers and excludes gains arising on the disposal of assets and finance income. Segment profit reported to the Board represents the profit earned by each segment before acquisition costs and other non-recurring set-up costs, finance income, finance costs and tax. For the purposes of assessing segment performance and for determining the allocation of resources between segments, the Board uses a measure of adjusted EBITDA (as defined in the accounting policies) and reviews the non-current assets attributable to each segment as well as the financial resources available. All assets are allocated to reportable segments. Assets that are used jointly by segments are allocated to the individual segments on a basis of revenues earned. All liabilities are allocated to individual segments other than borrowings and tax. Information is reported to the Board of Directors on a product basis as management believe that the activity of self-storage and the activity of serviced document storage expose the Group to differing levels of risk and rewards due to the length, nature, seasonality and customer base of their respective operating cycles.
Notes to the Financial StatementsFor the year ended 31 July 2018
64 Lok’nStore Group Plc Annual Report and Accounts 2018

Strategic R
eportO
verviewG
overnanceFinancial S
tatements
The segment information for the year ended 31 July 2018 is as follows:
2018
Self-storage 2018
£’000
Serviced archive & records
management 2018
£’000
Total 2018
£’000
Revenue from external customers 15,372 2,382 17,754
Adjusted EBITDA 6,608 687 7,295
Management charges 25 (25) –
Segment Adjusted EBITDA 6,633 662 7,295
Depreciation (1,880) (100) (1,980)
Amortisation of intangible assets – (165) (165)
Equity settled share based payments (33) – (33)
Carried interest - fees receivable 361 – 361
Receipts from warranty claims – 230 230
Segment operating profit per the income statement 5,081 627 5,708
Central costs not allocated to segments:
Finance income 80
Finance costs (463)
Profit before taxation 5,325
Income tax expense (1,568)
Consolidated profit for the financial year 3,757
The segment information for the year ended 31 July 2017 is as follows:
2017
Self-storage 2017
£’000
Serviced archive & records
management 2017
£’000
Total 2017
£’000
Revenue from external customers 14,327 2,327 16,654
Adjusted EBITDA 5,933 560 6,493
Management charges 25 (25) –
Segment Adjusted EBITDA 5,958 535 6,493
Depreciation (1,760) (96) (1,856)
Amortisation of intangible assets – (165) (165)
Equity settled share based payments (97) – (97)
Store relocation costs (29) – (29)
Property disposal costs – (15) (15)
Director retirement costs (69) – (69)
Segment operating profit per the income statement 4,003 259 4,262
Central costs not allocated to segments:
Finance income 309
Finance costs (606)
Profit before taxation 3,965
Income tax expense (904)
Consolidated profit for the financial year 3,061
65
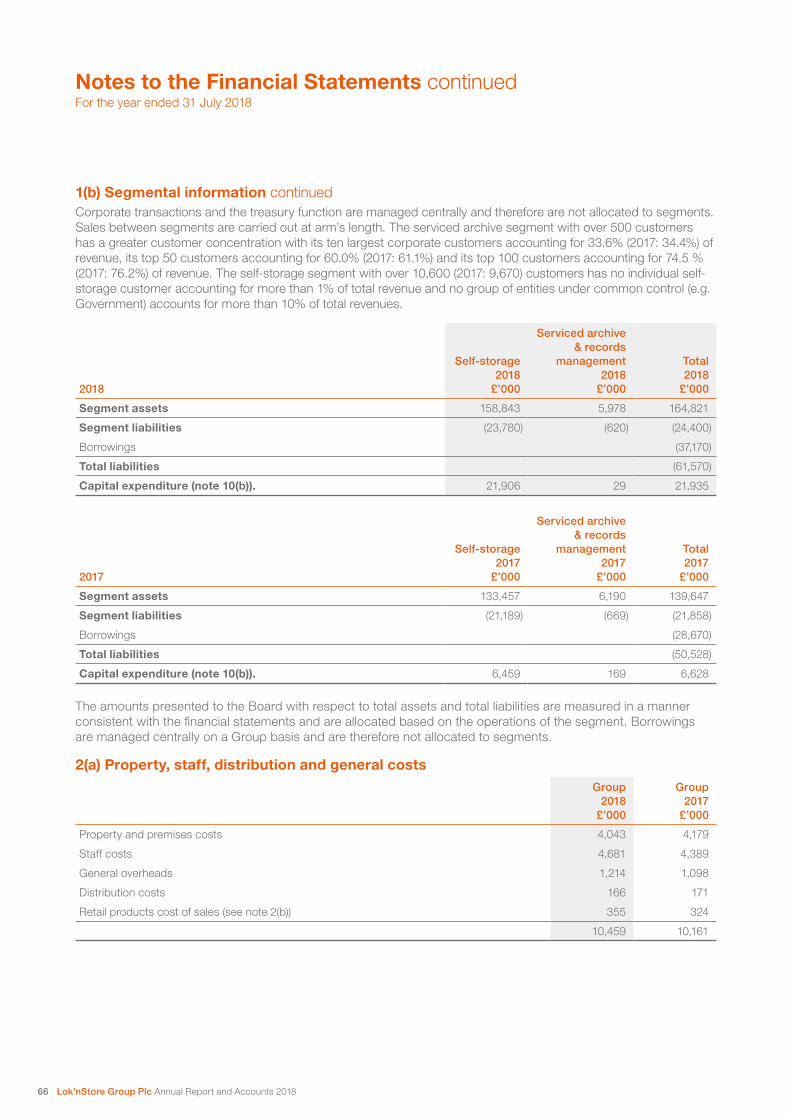
Notes to the Financial Statements continuedFor the year ended 31 July 2018
1(b) Segmental information continuedCorporate transactions and the treasury function are managed centrally and therefore are not allocated to segments. Sales between segments are carried out at arm’s length. The serviced archive segment with over 500 customers has a greater customer concentration with its ten largest corporate customers accounting for 33.6% (2017: 34.4%) of revenue, its top 50 customers accounting for 60.0% (2017: 61.1%) and its top 100 customers accounting for 74.5 % (2017: 76.2%) of revenue. The self-storage segment with over 10,600 (2017: 9,670) customers has no individual self-storage customer accounting for more than 1% of total revenue and no group of entities under common control (e.g. Government) accounts for more than 10% of total revenues.
2018
Self-storage 2018
£’000
Serviced archive & records
management 2018
£’000
Total 2018
£’000
Segment assets 158,843 5,978 164,821
Segment liabilities (23,780) (620) (24,400)
Borrowings (37,170)
Total liabilities (61,570)
Capital expenditure (note 10(b)). 21,906 29 21,935
2017
Self-storage 2017
£’000
Serviced archive & records
management 2017
£’000
Total 2017
£’000
Segment assets 133,457 6,190 139,647
Segment liabilities (21,189) (669) (21,858)
Borrowings (28,670)
Total liabilities (50,528)
Capital expenditure (note 10(b)). 6,459 169 6,628
The amounts presented to the Board with respect to total assets and total liabilities are measured in a manner consistent with the financial statements and are allocated based on the operations of the segment. Borrowings are managed centrally on a Group basis and are therefore not allocated to segments.
2(a) Property, staff, distribution and general costsGroup
2018 £’000
Group 2017
£’000
Property and premises costs 4,043 4,179
Staff costs 4,681 4,389
General overheads 1,214 1,098
Distribution costs 166 171
Retail products cost of sales (see note 2(b)) 355 324
10,459 10,161
66 Lok’nStore Group Plc Annual Report and Accounts 2018

Strategic R
eportO
verviewG
overnanceFinancial S
tatements
2(b) Cost of sales of retail productsCost of sales represents the direct costs associated with the sale of retail products (boxes, packaging etc.), and the ancillary sales of insurance cover for customer goods, all of which fall within the Group’s ordinary activities.
Group 2018
£’000
Group 2017
£’000
Retail 116 128
Insurance 45 37
Other 20 2
181 167
Serviced archive consumables and direct costs 174 157
355 324
2(c) Other Income and costs Group
2018 £’000
Group 2017
£’000
Carried interest - fees receivable1 (361) –
Receipts from warranty claims2 (230) –
Property disposal costs3 – 15
Store relocation costs4 – 29
Director retirement costs5 – 69
(591) 113
2018:
1 Carried interest fees receivable:
Upon the sale of one of the ‘Managed stores’ Lok’nStore will be entitled to receive a fee of 5% of the proceeds of the sale (less reasonable selling costs). Due to the uncertainty of the property market and the timing of the ultimate sale the directors have in previous years believed that it would not yet be appropriate to recognise this as an asset, on the basis that it could not be reliably measured. However there is a backstop date of 2022 at which time a realisation (or a payment based on an independent valuation) must be made to Lok’nStore. Accordingly, the directors have given due consideration as to the current fair value of the Carried interest - fee receivable and have recognised £361,460 as a non-current financial asset in the financial statements.
2 Receipts from warranty claims relates to receipts due and payable under a mediated settlement agreement.
2017:
3 Property disposal costs relate to the closure and surrender of the lease on Unit 4 Leatherhead site and the consolidation of its warehouse capacity into Unit 6 Leatherhead.
4 Store relocation costs relate to the closure and surrender of the lease on the Staines store and the relocation of customers to alternative stores within the store portfolio.
5 Directors retirement costs relate to the retirement of CM Jacobs on 4 July 2017.
67

Notes to the Financial Statements continuedFor the year ended 31 July 2018
3 Finance incomeGroup
2018 £’000
Group 2017
£’000
Bank interest 7 25
Other interest 73 284
80 309
Interest receivable arises on cash and cash equivalents (see note 16) and on development loan capital deployed (see note 12).
4 Finance costsGroup
2018 £’000
Group 2017
£’000
Bank interest 342 520
Non-utilisation fees and amortisation of bank loan arrangement fees 116 86
Other interest 5 –
463 606
5 Profit before taxationGroup
2018 £’000
Group 2017
£’000
Profit before taxation is stated after charging:
Depreciation and amounts written off property, plant and equipment:
Owned assets 1,980 1,856
Amortisation of intangible assets 165 165
Operating lease rentals – land and buildings 1,436 1,488
Amounts payable to RSM UK Audit LLP and their associates for audit and non-audit services:
Audit services
– UK statutory audit of the Company and consolidated accounts 52 50
Other services
– the auditing of accounts of subsidiaries of the Company pursuant to legislation 15 14
Other services supplied pursuant to such legislation
– interim review 11 10
– other services 7 –
Tax services
– compliance services 29 28
– advisory services 10 18
124 120
Comprising:
Audit services 67 64
Non-audit services 57 56
124 120
68 Lok’nStore Group Plc Annual Report and Accounts 2018

Strategic R
eportO
verviewG
overnanceFinancial S
tatements
6 EmployeesGroup
2018 No.
Group 2017
No.
The average monthly number of persons (including Directors) employed by the Group during the year was:
Store management 143 131
Administration 31 31
174 162
Group2018
£’000
Group2017
£’000
Costs for the above persons:
Wages and salaries 3,808 3,724
Social security costs 456 453
Pension costs 100 96
4,364 4,273
Share based remuneration (options) 33 97
4,397 4,370
Share based remuneration is separately disclosed in the statement of comprehensive income. Wages and salaries of £149,492, (2017: £138,137) have been capitalised as additions to property, plant and equipment as they are directly attributable to the acquisition of these assets. All other employee costs are included in staff costs in the Statement of Comprehensive Income.
In relation to pension contributions, there was £13,894 (2017: £11,949) outstanding at the year-end.
There were no employees employed by the Company in the year (2017: nil).
69

Notes to the Financial Statements continuedFor the year ended 31 July 2018
6 Employees continuedDirectors’ remuneration
2018Emoluments
£Bonuses
£Pension
£Benefits
£Sub total
£
Gains on share options
£Total
£
Executive:
A Jacobs 216,487 26,000 – 4,272 246,759 – 246,759
RA Davies 131,280 19,222 31,190 4,090 185,782 20,415 206,197
N Newman-Shepherd 75,172 42,477 2,255 1,933 121,837 71,317 193,154
Non-Executive:
SG Thomas 30,000 – – 4,009 34,009 – 34,009
RJ Holmes 21,648 – – – 21,648 – 21,648
ETD Luker 27,061 – – – 27,061 – 27,061
CP Peal 21,648 – – – 21,648 – 21,648
523,296 87,699 33,445 14,304 658,744 91,732 750,476
2017Emoluments
£Bonuses
£Pension
£Benefits
£Sub total
£
Gains on share options
£Total
£
Executive:
A Jacobs 212,242 14,000 – 3,403 229,645 – 229,645
RA Davies 123,838 12,000 30,977 3,551 170,366 78,503 248,869
N Newman-Shepherd 71,592 29,704 2,148 1,826 105,270 27,296 132,566
CM Jacobs 115,284 – – 2,593 117,877 35,250 153,127
Non-Executive:
SG Thomas 53,060 – – 3,228 56,288 143,437 199,725
RJ Holmes 21,224 – – – 21,224 – 21,224
ETD Luker 26,530 – – – 26,530 – 26,530
CP Peal 21,224 – – – 21,224 – 21,224
644,994 55,704 33,125 14,601 748,424 284,486 1,032,910
Details of the Directors remuneration is shown above. Key management personnel are defined as the Directors of the Group and the additional participants in the Long Term Partnership Performance Plan (LTPPP).
The highest paid Director did not accrue any pension rights during the year. The benefits in kind all relate to medical insurance premiums paid on behalf of the Directors. The number of Directors to whom retirement benefits are accruing under money purchase pension schemes in respect of qualifying service is two (2017: two).
70 Lok’nStore Group Plc Annual Report and Accounts 2018

Strategic R
eportO
verviewG
overnanceFinancial S
tatements
7 TaxationGroup
2018 £’000
Group 2017
£’000
Current tax:
UK corporation tax at 17.4% (2017: 20%) 924 792
Deferred tax:
Origination and reversal of temporary differences 311 204
Adjustments in respect of prior periods 333 173
Impact of change in tax rate on closing balance – (265)
Total deferred tax 644 112
Income tax expense for the year 1,568 904
The charge for the year can be reconciled to the profit for the year as follows:
2018 £’000
2017 £’000
Profit before tax 5,325 3,965
Tax on ordinary activities at the effective standard rate of corporation tax in the UK of 19% (2017: 20 /19%) 985 793
Expenses not deductible for tax purposes – 2
Depreciation of non-qualifying assets 322 104
Share based payment charges in excess of corresponding tax deduction 6 19
Impact of change in tax rate on closing deferred tax balance – (264)
Adjustments in respect of prior periods – deferred tax 333 173
Other (48) 72
Small companies relief (30) –
Share option scheme – 5
Income tax expense for the year 1,568 904
Effective tax rate 29 % 23 %
In addition to the amount charged to profit or loss for the year, deferred tax relating to the revaluation of the Group’s properties of £2.7 million (2017: £932,089) has been recognised as a debit/credit directly in other comprehensive income (see note 18 on deferred tax).
71

Notes to the Financial Statements continuedFor the year ended 31 July 2018
8 Dividends2018
£’0002017
£’000
Amounts recognised as distributions to equity holders in the year:
Final dividend for the year ended 31 July 2016 (6.33 pence per share) – 1,777
Interim dividend for the six months to 31 January 2017 (3 pence per share) – 860
Final dividend for the year ended 31 July 2017 (7.00 pence per share) 2,016 –
Interim dividend for the six months to 31 January 2018 (3.33 pence per share) 961 –
2,977 2,637
In respect of the current year the Directors propose that a final dividend of 7.67 pence per share will be paid to the shareholders. The total estimated dividend to be paid is £2.22 million based on the number of shares in issue at 17 October 2018 as adjusted for shares held in the Employee Benefits Trust. This is subject to approval by shareholders at the Annual General Meeting and has not been included as a liability in these financial statements. The ex-dividend date will be 29 November 2018; the record date 30 November 2018; with an intended payment date of 11 January 2019. The final deadline for Dividend Reinvestment Election (DRIP) is 14 December 2018.
9 Earnings per shareThe calculations of earnings per share are based on the following profits and numbers of shares.
Group 2018
£’000
Group 2017
£’000
Profit for the financial year attributable to owners of the parent 3,757 3,061
2018 No. of shares
2017 No. of shares
Weighted average number of shares
For basic earnings per share 28,792,029 27,780,676
Dilutive effect of share options1 490,064 999,657
For diluted earnings per share 29,282,093 28,780,333
1 Further options that could potentially dilute EPS in the future are excluded from the above because they are not dilutive in the period presented.
Full details of share options are included in notes 20 to 23
623,212 (2017: 623,212) shares are held in the Employee Benefit Trust (see note 26).
Group 2018
Group 2017
Earnings per share
Basic 13.05p 11.02p
Diluted 12.83p 10.64p
72 Lok’nStore Group Plc Annual Report and Accounts 2018

Strategic R
eportO
verviewG
overnanceFinancial S
tatements
10(a) Intangible assets
GroupGoodwill
£’000
Contractual customer
relationships £’000
Total £’000
Cost at 1 August 2016 1,110 3,309 4,419
Amortisation at 1 August 2016 – (826) (826)
Amortisation charge – (165) (165)
Amortisation at 31 July 2017 – (991) (991)
Net book value at 31 July 2017 1,110 2,318 3,428
Cost at 1 August 2017 1,110 3,309 4,419
Amortisation at 1 August 2017 – (991) (991)
Amortisation charge – (165) (165)
Amortisation at 31 July 2018 – (1,156) (1,156)
Net book value at 31 July 2018 1,110 2,153 3,263
All goodwill and customer relationships are allocated to the serviced document storage cash-generating unit (CGU) identified as a separate business segment.
The remaining amortisation period of the contractual customer relationships at 31 July 2018 is 12 years and 11 months (2017: 13 years 11 months).
The values for impairment testing purposes are based on past and current experience of trading, recognising the long term stability and retention of the customer base, estimated future cash flows and external information where relevant and derived from the following key assumptions:
• a discount rate of 11% (2017: 11%)
• estimated useful lives of customer relationships (20 years) (2017: 20 years)
• medium term sustainable growth rates of 3% (next 10 years) (2017: 3%)
• thereafter long term sustainable growth rates of 2.0% (2017: 2%)
• cost increases of 2.75% – 3.0% pa (2017: 2.75% – 3.0% pa)
The Group has conducted a sensitivity analysis on the impairment test of each CGU’s carrying value. A cut in projected sales growth by around 13.5% (2017: 7%) would result in the carrying value of goodwill being reduced to its recoverable amount.
On the basis of the assumptions and corresponding calculations made it is estimated that the recoverable amount exceeds the carrying amount of the CGU by over £3 million.
73

Notes to the Financial Statements continuedFor the year ended 31 July 2018
10(b) Property, plant and equipment
Group
Development property
assets at cost
£’000
Land and buildings at
valuation £’000
Long leasehold land and buildings
at valuation £’000
Short leasehold
improvements at cost
£’000
Fixtures, fittings and
equipment at cost
£’000
Motor vehicles
at cost £’000
Total £’000
Cost or valuation
1 August 2016 458 80,953 9,263 2,563 22,758 17 116,012
Additions 4,666 685 – 36 1,241 – 6,628
Disposals – – – – (15) – (15)
Reclassification – – – – – – –
Revaluations – 5,910 1,030 – – – 6,940
31 July 2017 5,124 87,548 10,293 2,599 23,984 17 129,565
Depreciation
1 August 2016 – – – 1,781 9,856 12 11,649
Depreciation – 705 125 99 926 1 1,856
Disposals – – – – (11) – (11)
Reclassification – – – – – – –
Revaluations – (705) (125) – – – (830)
31 July 2017 – – – 1,880 10,771 13 12,664
Net book value at 31 July 2017 5,124 87,548 10,293 719 13,213 4 116,901
Cost or valuation
1 August 2017 5,124 87,548 10,293 2,599 23,984 17 129,565
Additions 18,513 183 – 49 3,190 – 21,935
Reclassification (7,067) 7,055 – – 12 – –
Revaluations – 13,700 1,145 – – – 14,845
31 July 2018 16,570 108,486 11,438 2,648 27,186 17 166,345
Depreciation
1 August 2017 – – – 1,880 10,771 13 12,664
Depreciation – 753 126 99 1,001 1 1,980
Revaluations – (753) (126) – – – (879)
31 July 2018 – – – 1,979 11,772 14 13,765
Net book value at 31 July 2018 16,570 108,486 11,438 669 15,414 3 152,580
The Group has an active store development programme and in accordance with IAS 23 has material qualifying assets that take a substantial period of time to develop from acquisition to ultimate store opening. Accordingly borrowing costs of £197,209 (2017: nil) have been capitalised in the current year that are directly attributable to the acquisition, construction and fit-out of these qualifying store assets. £114,507 of the total amount is carried in development property assets and £82,702 is carried in land and buildings following the opening of the Gillingham and Wellingborough stores.
If all property, plant and equipment were stated at historic cost the carrying value would be £74.1 million (2017: £53.9 million).
Capital expenditure during the year totalled £21.9 million (2017: £6.6 million). This was primarily the completion of construction works at our development sites in Gillingham and Wellingborough which are now open and trading as well as completing the acquisition of our Bournemouth, Bedford, Cardiff and Cheshunt sites.
Property, plant and equipment (non-current assets) with a carrying value of £152.6 million (2017: £116.9 million) are pledged as security for bank loans.
74 Lok’nStore Group Plc Annual Report and Accounts 2018

Strategic R
eportO
verviewG
overnanceFinancial S
tatements
Market Valuation of Freehold, Long Leasehold and Operating Leasehold Land and BuildingsOn 31 July 2018 a professional valuation was prepared by Jones Lang LaSalle Limited (JLL) in respect of eleven freehold, one long leasehold and seven operating leasehold properties. The valuation was prepared in accordance with the RICS Valuation – Global Standards 2017, published by The Royal Institution of Chartered Surveyors (“the RICS Red Book”) and the valuation methodology is explained in more detail below. The valuations were prepared on the basis of Fair Value as a fully equipped operational entity having regard to trading potential. The valuation was provided for accounts purposes and as such, is a Regulated Purpose Valuation as defined in the Red Book. In compliance with the disclosure requirements of the RICS Red Book JLL have confirmed that:
• This is the third year that JLL has been appointed to value the properties
• The valuers who prepared the valuation have the necessary skills and experience having been significantly involved in the sector
• JLL do not provide other significant professional or agency services to the Company
• In relation to the preceding financial year of JLL the proportion of the total fees payable by the Company to the total fee income of the firm is less than 5% and is minimal
The valuation report indicates a total valuation for all properties valued of £146.2 million (2017: £119.6 million) of which £128.0 million (2017: £102.9 million) relates to freehold and long leasehold properties, and £18.2 million (2017: £16.7 million) relates to properties held under operating leases.
Freehold and long leasehold land and buildings are carried at valuation in the statement of financial position. Short leasehold improvements at properties held under operating leases are carried at cost rather than valuation in accordance with IFRS.
For the trading properties the valuation methodology explained in more detail below is based on fair value as fully equipped operational entities, having regard to trading potential. Of the £128.0 million valuation of the freehold and long leasehold properties £11.7 million (2017: £9.3 million) relates to the net book value of fixtures, fittings and equipment, and the remaining £116.3 million (2017: £93.6 million) relates to freehold and long leasehold properties.
The 2018 valuation includes and reflects movements in value which have resulted from the operational performance of the stores and movements in the investment environment.
Valuation MethodologyJones Lang LaSalle Limited (JLL) have adopted the profits method of valuation, and cross checked with the direct comparison method based on recent transactions in the sector, which is the main method of pricing adopted by purchasers of self storage properties.
JLL have valued the assets on an individual basis and have disregarded any portfolio effect.
The profits method of valuation considers the cash flow generated by the trading potential of the self storage facility. Due to the specialised design and use of the buildings, the value is typically based on their ability to generate a net income from operating as self storage facilities.
JLL have constructed a discounted cash flow model. This sets out their explicit assumptions on the underlying cash flow that they believe could be generated by a Reasonably Efficient Operator at each of the properties, both at the valuation date and in the near future as the properties increase their occupancy and rates charged to customers. Judgements are made as to the trading potential and likely long term sustainable occupancy.
Stable occupancy depends upon the nature of demand, size of property and nearby competition, and allows for a reasonable vacancy rate to enable the operator to sell units to new customers. In the valuation the assumed stabilised occupancy level for the 21 trading stores (both freeholds and leaseholds) averages 84.1% (2017: 81.2%).
Expenditure is deducted (such as business rates, staff costs, repair and maintenance, utilities, marketing and bad debts) as well as an operator’s charge which takes account of central costs. JLL also make an allowance for long term capex requirements where applicable.
75

Notes to the Financial Statements continuedFor the year ended 31 July 2018
10(b) Property, plant and equipment continuedValuation Methodology continued• The cash flow for freeholds runs for an explicit period of 10 years, after which it is capitalised at an all risks yield
which reflects the implicit future growth of the business, or a hypothetical sale
• The cash flow for leaseholds continues for the unexpired term of the lease
• The discount rate applied has had regard to recent transactions, weighted average costs of capital and target return in other asset types with adjustments made to reflect differences in the risk and liquidity profile
• The weighted average annual discount rate adopted (for both freeholds and leaseholds) is 10.58% (2017: 11.09%). The yield arising from the first year of the projected cash flow is 6.35% (2017: 7.19%), rising to 9.39% (2017: 10.49%) in year five
• JLL have assumed purchasers costs of 6.8% (2017: 6.8%)
• The average stabilised occupancy is 84.1% (2017: 81.2%)
• The average exit yield assumed is 7.42% (2017: 7.67%)
The comparison method considers recent transactions where self storage properties have sold, and then adjusts them based on a multiple of current earnings, and a capital value per square foot. They are adjusted to reflect differences in location, physical characteristics, local supply and demand, tenure and trading levels.
JLL reported that the Lok’nStore portfolio has generally performed very well in terms of increasing occupancy over the course of the year which has driven the assumed stabilised occupancy higher.
For leaseholds the same methodology has been used as for freehold property, except that no sale of the assets in the 10th year is assumed, but the discounted cash flow is extended to the expiry of the lease. The average unexpired term of the Group’s operating leaseholds is approximately 11 years and 1 month as at 31 July 2018 (10 years and 8 months: 31 July 2017). Valuations for stores held under operating leases are not reflected in the statement of financial position and the assets in relation to these stores are carried at cost less accumulated depreciation.
In 2011, one of the Group store’s leases was renegotiated and includes a ten year option to renew the leases from March 2026 to March 2036. The option to extend is only operable in the event that all four of the leases applicable to this store are extended and this option is personal to Lok’nStore or another “major self-storage operator”, to be approved by the landlord (approval not to be unreasonably withheld). The JLL valuation on this store is based on this Special Assumption that the option to extend the lease for 10 years is exercised. This is consistent with the approach taken in previous years.
On 22 February 2018, the Group completed the Deed of Variation, Reversionary Lease and Rent Review Memorandum extending the lease term of the Fareham Store by ten years to 2036.
The fair value hierarchy within which the Fair Value measurements are categorised is level 3, in accordance with IFRS 13 fair value measurements.
Directors’ valuation of land and propertyThe old Southampton store: Following the opening of the new Southampton store with the corresponding transfer of all customers from the old Southampton store, the vacant building was redeveloped for cruise parking. Market evidence suggested that there is a substantial market in Southampton for car parking for cruise liner passengers and that this property was appropriate to this use. The Directors have placed a valuation on the site at the 2018 year-end at £2.0 million. The building was converted to this use costing £1.195 million (£1.103 million net of depreciation) and started trading as “ParknCruise” in May 2017. Accordingly the Directors placed their valuation on the current developed site at the 2018 year-end at £3.103 million.
The new Southampton store: Following the development and opening of the new Southampton store there remains surplus land to the rear of the building which may be ultimately utilised for an expansion of the store or could be sold or used for alternative use. The Directors have considered the advice given and recommendations of value obtained by local agents and in weighing this with their own view are satisfied to continue to place a value at year-end on this land of £0.5 million.
The total value of land and property carried at Director Valuation at 31 July 2018 is £3.603 million (2017: £4.195 million).
76 Lok’nStore Group Plc Annual Report and Accounts 2018
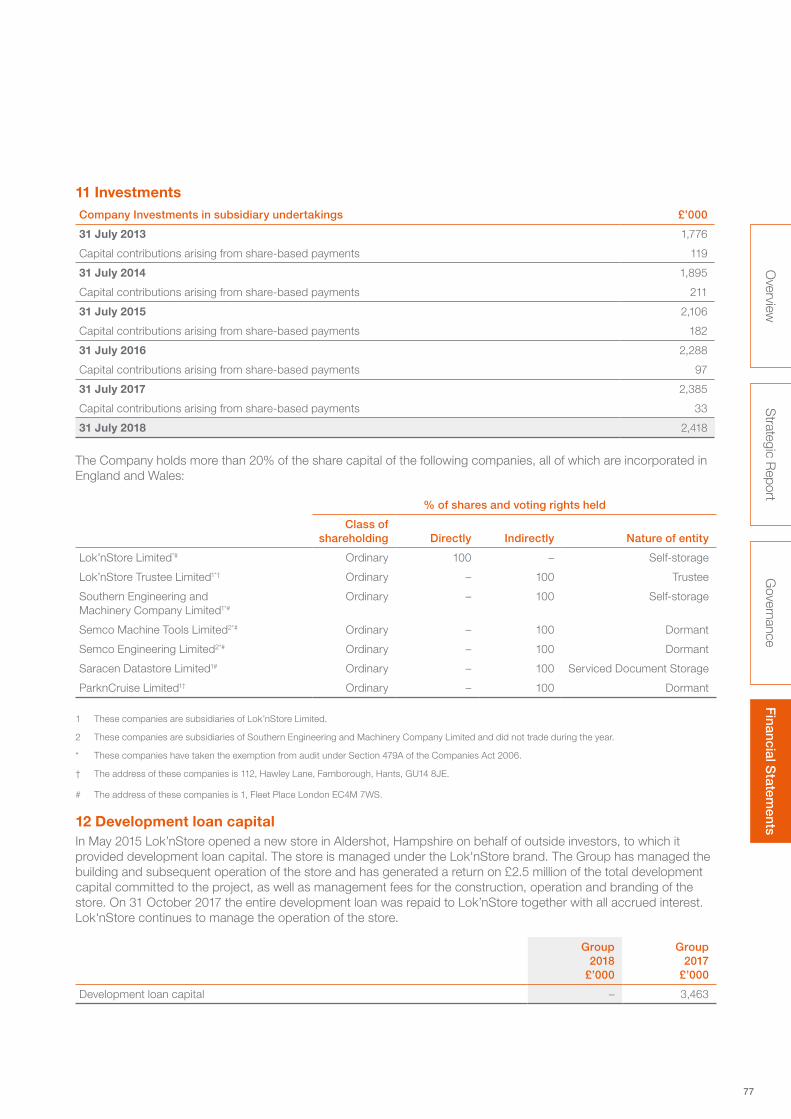
Strategic R
eportO
verviewG
overnanceFinancial S
tatements
11 InvestmentsCompany Investments in subsidiary undertakings £’000
31 July 2013 1,776
Capital contributions arising from share-based payments 119
31 July 2014 1,895
Capital contributions arising from share-based payments 211
31 July 2015 2,106
Capital contributions arising from share-based payments 182
31 July 2016 2,288
Capital contributions arising from share-based payments 97
31 July 2017 2,385
Capital contributions arising from share-based payments 33
31 July 2018 2,418
The Company holds more than 20% of the share capital of the following companies, all of which are incorporated in England and Wales:
% of shares and voting rights held
Class of shareholding Directly Indirectly Nature of entity
Lok’nStore Limited*# Ordinary 100 – Self-storage
Lok’nStore Trustee Limited1*† Ordinary – 100 Trustee
Southern Engineering and Machinery Company Limited1*#
Ordinary – 100 Self-storage
Semco Machine Tools Limited2*# Ordinary – 100 Dormant
Semco Engineering Limited2*# Ordinary – 100 Dormant
Saracen Datastore Limited1# Ordinary – 100 Serviced Document Storage
ParknCruise Limited1† Ordinary – 100 Dormant
1 These companies are subsidiaries of Lok’nStore Limited.
2 These companies are subsidiaries of Southern Engineering and Machinery Company Limited and did not trade during the year.
* These companies have taken the exemption from audit under Section 479A of the Companies Act 2006.
† The address of these companies is 112, Hawley Lane, Farnborough, Hants, GU14 8JE.
# The address of these companies is 1, Fleet Place London EC4M 7WS.
12 Development loan capitalIn May 2015 Lok’nStore opened a new store in Aldershot, Hampshire on behalf of outside investors, to which it provided development loan capital. The store is managed under the Lok'nStore brand. The Group has managed the building and subsequent operation of the store and has generated a return on £2.5 million of the total development capital committed to the project, as well as management fees for the construction, operation and branding of the store. On 31 October 2017 the entire development loan was repaid to Lok’nStore together with all accrued interest. Lok'nStore continues to manage the operation of the store.
Group 2018 £’000
Group 2017
£’000
Development loan capital – 3,463
77

Notes to the Financial Statements continuedFor the year ended 31 July 2018
13 InventoriesGroup
2018 £’000
Group 2017
£’000
Consumables and goods for resale 257 203
The amount of inventories recognised in cost of sales as an expense during the year was £160,177 (2017: £164,225). (See note 2(b)).
14 Trade and other receivablesGroup
2018 £’000
Group 2017
£’000
Trade receivables 1,969 1,693
Other receivables 1,927 1,822
Prepayments and accrued income 580 751
4,476 4,266
The Directors consider that the carrying amount of trade and other receivables approximates their fair value.
The following balances existed between the Company and its subsidiaries at 31 July:
Company 2018
£’000
Company 2017
£’000
Net amount due from Lok’nStore Limited 13,940 13,021
The amount due from Lok’nStore Limited is interest free. The balance is repayable on demand.
Trade receivablesIn respect of its self-storage business the Group does not typically offer credit terms to its customers and hence the Group is not exposed to significant credit risk. All customers are required to pay in advance of the storage period. Late charges are applied to a customer’s account if they are more than 10 days overdue in their payment. The Group provides for receivables based upon sales levels and estimated recoverability. There is a right of lien over the customers’ goods, so if they have not paid within a certain time frame the Company has the right to sell the items they store to cover the debt owed by the customer. Trade receivables that are overdue are provided for based on estimated irrecoverable amounts, determined by reference to past default experience.
For individual self-storage customers the Group does not perform credit checks. However this is mitigated by the fact that all customers are required to pay in advance, and also to pay a deposit of four weeks’ storage income. Before accepting a new business customer who wishes to use a number of the Group’s stores, the Group uses an external credit rating to assess the potential customer’s credit quality and defines credit limits by customer. There are no customers who represent more than 5% of the total balance of trade receivables.
In respect of its document storage business, customers are invoiced typically monthly in advance for the storage of their boxes, tapes and files. The provision of additional services, such as document boxes or tape collection and retrieval from archive, typically are invoiced monthly in arrears. The serviced archive segment with over 450 customers has a greater customer concentration – refer note 1(b) segmental analysis.
Included in the Group’s trade receivables balance are receivables with a carrying amount of £223,092 (2017: £268,252) which are past due at the reporting date for which the Group has not provided as there has not been a significant change in credit quality and the amounts are still considered recoverable. The Group holds a right of lien over its self-storage customers’ goods if these debts are not paid. The average age of these receivables is 41 days past due (2017: 43 days past due).
78 Lok’nStore Group Plc Annual Report and Accounts 2018

Strategic R
eportO
verviewG
overnanceFinancial S
tatements
Ageing of past due but not impaired receivables
Group 2018
£’000
Group 2017
£’000
0–30 days 100 97
30–60 days 85 121
60+ days 38 50
Total 223 268
Movement in the allowance for bad debts
Group 2018
£’000
Group 2017
£’000
Balance at the beginning of the year 188 186
Impairment losses recognised 40 34
Amounts written off as uncollectible (36) (32)
Balance at the end of the year 192 188
The concentration of credit risk is limited due to the customer base being large and unrelated. Accordingly, the Directors believe that there is no further provision required.
Ageing of impaired trade receivables
Group 2018
£’000
Group 2017
£’000
0–30 days – –
30–60 days – –
60+ days 192 188
Total 192 188
15 Trade and other payablesGroup
2018 £’000
Group 2017
£’000
Trade payables 1,102 818
Taxation and social security costs 313 288
Other payables 1,340 1,692
Accruals and deferred income 2,404 2,234
5,159 5,032
The Directors consider that the carrying amount of trade and other payables approximates fair value.
79

Notes to the Financial Statements continuedFor the year ended 31 July 2018
16 Financial instrumentsThe Group manages its capital to ensure that entities in the Group will be able to continue as a going concern while maximising the return to shareholders through the optimisation of the debt and equity balance. The capital structure of the Group consists of debts, which include the borrowings disclosed in note 17, cash and cash equivalents and equity attributable to the owners of the parent, comprising issued capital, reserves and retained earnings as disclosed in the Consolidated Statement of Changes in Equity. The Group’s banking facilities require that management give regular consideration to interest rate hedging strategy. The Group has complied with this during the year.
The Group’s Board reviews the capital structure on an on-going basis. As part of this review, the Board considers the cost of capital and the risks associated with each class of capital. The Group seeks to have a relatively conservative gearing ratio (the proportion of net debt to equity) balancing the overall level with the opportunities for the growth of the business. The Board considers at each review the appropriateness of the current ratio in light of the above. The Board is currently satisfied with the Group’s gearing ratio.
The gearing ratio at the year-end is as follows:
Capital Management
Group 2018
£’000
Group 2017
£’000
Gross borrowings (37,335) (28,816)
Cash and cash equivalents 4,990 11,386
Net debt (32,345) (17,430)
Total equity 103,251 89,119
Net debt to equity ratio 31.3 % 19.6 %
The increase in the Group’s gearing ratio arises principally through the acquisition of our Bournemouth, Bedford, Cardiff, Cheshunt and Leicester sites funded by bank borrowings, mitigated by the combined effect of an increase in the value of its properties, and the cash generated from operations.
Exposure to credit and interest rate risk arises in the normal course of the Group’s business.
A Derivative financial instruments and hedge accountingThe Group’s activities expose it primarily to the financial risks of interest rates. Historically the Group has hedged through the deployment of interest rate swaps although the Group had no such instruments in place at 31 July 2017 or 31 July 2018. The Board continues to keep its hedging policy under periodic review.
B Debt managementDebt is defined as non-current and current borrowings, as detailed in note 17. Equity includes all capital and reserves of the Group. The Group is not subject to externally imposed capital requirements.
The Group borrows through a revolving credit facility with Royal Bank of Scotland plc secured on its store portfolio and other Group assets, excluding intangibles, with a net book value of £161.6 million (2017: £136.2 million). Borrowings are arranged to ensure the Group fulfils its strategy of growth and development of its stores and to maintain short-term liquidity. As at the reporting date the Group has a committed revolving credit facility of £50 million (2017: £40 million). This facility expires on 15 January 2023. Undrawn committed facilities at the year-end amounted to £12.7 million (2017: £11.2 million).
C Interest rate risk managementThe Group’s policy on interest rate management is agreed at Board level and is reviewed on an on-going basis. All borrowings are denominated in Sterling and are detailed in note 17. The Group has a number of revolving loans within its overall revolving credit facility and as such is exposed to interest rate risks at the time of renewal arising from any upward movement in the LIBOR rate.
80 Lok’nStore Group Plc Annual Report and Accounts 2018

Strategic R
eportO
verviewG
overnanceFinancial S
tatements
Cash balances held in current accounts attract no interest but surplus cash is transferred daily to a treasury deposit account which earns interest at the prevailing money market rates1. All amounts are denominated in Sterling. The balances at 31 July 2018 are as follows:
Group 2018
£’000
Group 2017
£’000
Variable rate treasury deposits1 4,337 11,048
SIP trustee deposits 40 5
Cash in operating current accounts 582 285
Other cash and cash equivalents 31 48
Total cash and cash equivalents 4,990 11,386
1 Money market rates for the Group’s variable rate treasury deposit track Royal Bank of Scotland plc base rate. The rate attributable to the variable rate
deposits at 31 July 2018 was 0.1% (2017: 0.1%).
The Group reviews the current and forecast projections of cash flow, borrowing and interest cover as part of its monthly management accounts review. In addition, an analysis of the impact of significant transactions is carried out regularly, as well as a sensitivity analysis of the impact of movements in interest rates on gearing and interest cover.
D Interest rate sensitivity analysisOver the longer term, significant changes in interest rates may have an impact on consolidated earnings.
At 31 July 2018, it is estimated that an increase of one percentage point in interest rates would have reduced the Group’s annual profit before tax by £373,345 (2017: £288,156) and conversely a decrease of one percentage point in interest rates would have increased the Group’s annual profit before tax by £373,345 (2017: £288,156). There would have been no effect on amounts recognised directly in other comprehensive income. The sensitivity has been calculated by increasing by 1% the average variable interest rate of 1.85% applying to the variable rate borrowings of £37.3 million in the year (2017: £28.8 million / 1.66%).
E Cash management and liquidityUltimate responsibility for liquidity risk management rests with the Board of Directors, which has built an appropriate liquidity risk management framework for the management of the Group’s short, medium and long-term funding and liquidity management requirements. The Group manages liquidity risk by maintaining adequate reserves, banking facilities and reserve borrowing facilities by continuously monitoring forecast and actual cash flows and matching the maturity profiles of financial assets and liabilities. Included in note B above is a description of additional undrawn facilities that the Group has at its disposal to further reduce liquidity risk.
Short-term money market deposits are used to manage liquidity whilst maximising the rate of return on cash resources, giving due consideration to risk.
F Foreign currency managementThe Group operates solely in the United Kingdom and as such all of the Group’s financial assets and liabilities are denominated in Sterling and there is no exposure to exchange risk.
G Credit riskThe credit risk management policies of the Group with respect to trade receivables are discussed in note 14. The credit risk on liquid funds is limited because the counterparty is a bank with high credit ratings assigned by international credit-rating agencies, in line with the Group’s policy which is to borrow from major institutional banks when arranging finance.
The Group’s maximum exposure to credit risk at 31 July 2018 was £3.06 million (2017: £2.34 million) on receivables and £4.99 million (2017: £11.39 million) on cash and cash equivalents.
81

Notes to the Financial Statements continuedFor the year ended 31 July 2018
16 Financial instruments continuedH Maturity analysis of financial liabilitiesThe undiscounted contractual cash flow maturities are as follows:
2018 - Group
Trade and other payables
£’000Borrowings
£’000
Interest on borrowings
£’000
Over five years – – –
From two to five years – 37,335 1,307
From one to two years – – 532
Due after more than one year – 37,335 1,839
Due within one year 2,728 – 532
Total contractual undiscounted cash flows 2,728 37,335 2,371
2017 - Group
Trade and other payables
£’000Borrowings
£’000
Interest on borrowings
£’000
Over five years – 28,816 219
From two to five years – – 1,438
From one to two years – – 479
Due after more than one year – 28,816 2,136
Due within one year 2,934 – 479
Total contractual undiscounted cash flows 2,934 28,816 2,615
I Fair values of financial instruments
Group 2018
£’000
Group 2017
£’000
Categories of financial assets and financial liabilities
Financial assets – loans and receivables
Trade and other receivables1 4,616 3,967
Cash and cash equivalents 4,990 11,386
Development loan capital – 3,463
Financial liabilities – other financial liabilities at amortised cost
Trade and other payables (2,728) (2,934)
Bank loans (37,170) (28,670)
1 Includes £361,460 relating to fees receivable in 2022 from the Aldershot managed store currently classified as a non-current asset (measured at fair value).
The fair values of the Group’s cash and short-term deposits and those of other financial assets equate to their carrying amounts. The Group’s receivables and cash and cash equivalents are all classified as loans and receivables and carried at amortised cost. The amounts are presented net of provisions for doubtful receivables and allowances for impairment are made where appropriate. Trade and other payables and bank borrowings are all classified as financial liabilities measured at amortised cost.
82 Lok’nStore Group Plc Annual Report and Accounts 2018

Strategic R
eportO
verviewG
overnanceFinancial S
tatements
J Company’s financial instrumentsThe Company’s financial assets are amounts owed by subsidiary undertakings amounting to £13.9 million (2017: £13.0 million) which are classified as loans and receivables, and the investment in its subsidiary undertaking of £0.1 million (excluding capital contributions). These amounts are denominated in Sterling, are non-interest bearing, are unsecured and fall due for repayment within one year. No amounts are past due or impaired. The Company has no financial liabilities.
17 BorrowingsGroup
2018 £’000
Group 2017
£’000
Non-current
Bank loans repayable in more than five years (Gross) – 28,816
Bank loans repayable in more than two years but not more than five years (Gross) 37,335 –
Deferred financing costs (165) (146)
Net bank borrowings 37,170 28,670
Non-current borrowings 37,170 28,670
The Group has an existing banking facility with Royal Bank of Scotland plc (RBS). The facility runs until January 2023 providing funding for more site acquisitions and working capital. The Group is not obliged to make any repayments prior to its expiration in January 2023.
In February 2018 the Group executed its £10 million accordion increasing its £40 million Banking Facility to £50 million. The increased facility will provide funding for site acquisitions and working capital to support the Group’s ambitious growth plans for more landmark site acquisitions and working capital.
Bank covenants and margin are unaffected following the increased facility with the interest rate margin at the London Inter-Bank Offer Rate (LIBOR) plus 1.40%–1.65% based on a loan to value covenant test. This rate is 1.40% currently and the all in debt cost on £37.3 million drawn averaged 1.85% in the year.
The Group currently has £37.3 million drawn against its existing £50 million facility. The £50 million revolving credit facility with RBS is secured by legal charges and debentures over the freehold and leasehold properties and other tangible assets of the business with a net book value of £152.6 million (2017: £120.4) million together with cross-company guarantees from Group companies.
83
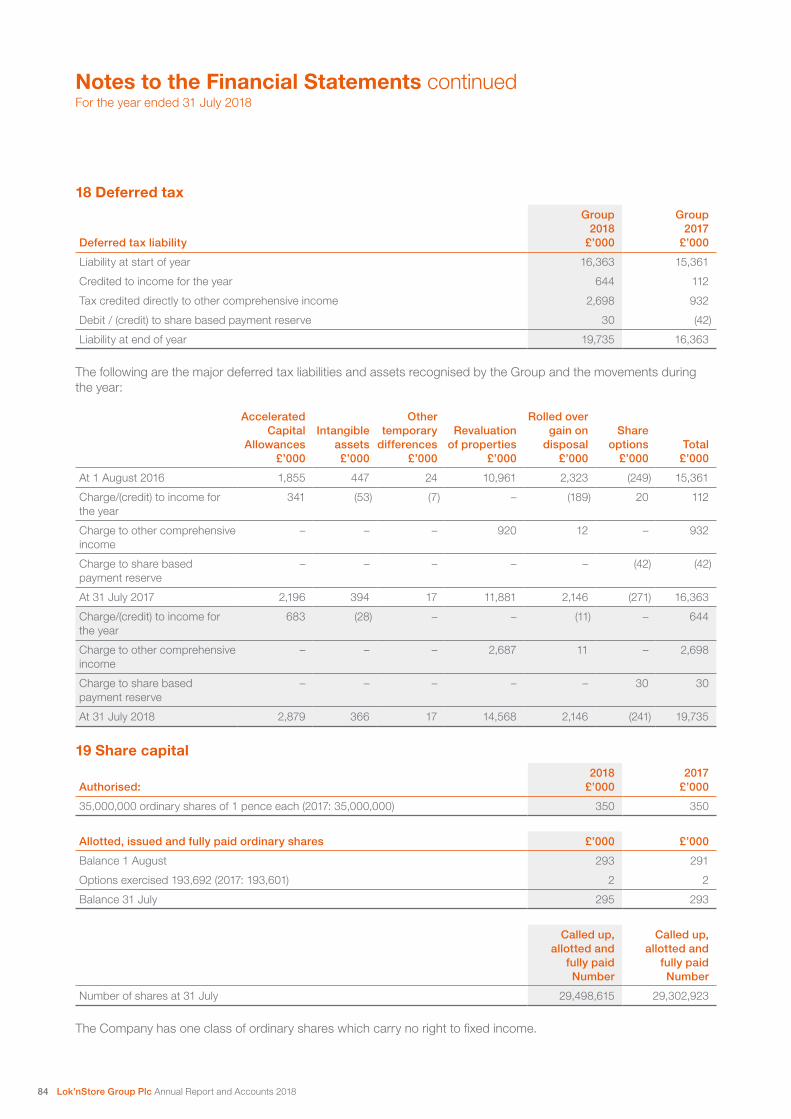
Notes to the Financial Statements continuedFor the year ended 31 July 2018
18 Deferred tax
Deferred tax liability
Group 2018
£’000
Group 2017
£’000
Liability at start of year 16,363 15,361
Credited to income for the year 644 112
Tax credited directly to other comprehensive income 2,698 932
Debit / (credit) to share based payment reserve 30 (42)
Liability at end of year 19,735 16,363
The following are the major deferred tax liabilities and assets recognised by the Group and the movements during the year:
Accelerated Capital
Allowances £’000
Intangible assets £’000
Other temporary
differences £’000
Revaluation of properties
£’000
Rolled over gain on
disposal £’000
Share options
£’000Total
£’000
At 1 August 2016 1,855 447 24 10,961 2,323 (249) 15,361
Charge/(credit) to income for the year
341 (53) (7) – (189) 20 112
Charge to other comprehensive income
– – – 920 12 – 932
Charge to share based payment reserve
– – – – – (42) (42)
At 31 July 2017 2,196 394 17 11,881 2,146 (271) 16,363
Charge/(credit) to income for the year
683 (28) – – (11) – 644
Charge to other comprehensive income
– – – 2,687 11 – 2,698
Charge to share based payment reserve
– – – – – 30 30
At 31 July 2018 2,879 366 17 14,568 2,146 (241) 19,735
19 Share capital
Authorised:2018
£’0002017
£’000
35,000,000 ordinary shares of 1 pence each (2017: 35,000,000) 350 350
Allotted, issued and fully paid ordinary shares £’000 £’000
Balance 1 August 293 291
Options exercised 193,692 (2017: 193,601) 2 2
Balance 31 July 295 293
Called up, allotted and
fully paid Number
Called up, allotted and
fully paid Number
Number of shares at 31 July 29,498,615 29,302,923
The Company has one class of ordinary shares which carry no right to fixed income.
84 Lok’nStore Group Plc Annual Report and Accounts 2018

Strategic R
eportO
verviewG
overnanceFinancial S
tatements
20 Equity settled share-based payment plans The Group operates two equity-settled share-based payment plans, an approved and an unapproved share option scheme, the rules of which are similar in all material respects.
The Company has the following share options:
2018 Summary
As at31 July 2017
No of options Granted ExercisedLapsed/
surrendered
As at31 July 2018
No of options
Unapproved Share Options (refer note 22(a)) 964,108 4,343 (145,095) (5,805) 817,551
Unapproved Share Options (LTPRP Scheme – refer note 22(b))
140,000 – – 140,000
Approved CSOP Share Options (refer note 23) 135,378 21,493 (55,814) (8,858) 92,199
Total 1,099,486 165,836 (200,909) (14,663) 1,049,750
2017 Summary
As at31 July 2016
No of options Granted ExercisedLapsed/
surrendered
As at31 July 2017
No of options
Unapproved Share Options 1,094,482 44,031 (150,408) (23,997) 964,108
Approved CSOP Share Options 166,011 20,486 (43,193) (7,926) 135,378
Total 1,260,493 64,517 (193,601) (31,923) 1,099,486
The following table shows options held by Directors under all schemes:
Total at 31 July
2017Options granted
Options Exercised/
lapsedUnapproved
Scheme
Approved CSOP share
options
Total at 31 July
2018
2018
Executive Directors
A Jacobs – Unapproved 206,087 – – 206,087 – 206,087
RA Davies – Unapproved 256,977 – (10,000) 246,977 – 246,977
RA Davies – CSOP 7,742 – – – 7,742 7,742
RA Davies total 264,719 – (10,000) 246,977 7,742 254,719
N Newman-Shepherd – Unapproved 197,421 – (25,000) 172,421 – 172,421
N Newman-Shepherd – CSOP 13,661 – (3,000) – 10,661 10,661
N Newman-Shepherd total 211,082 – (28,000) 172,421 10,661 183,082
Non-Executive Directors
SG Thomas – Unapproved 25,217 – – 25,217 – 25,217
ETD Luker – Unapproved 15,000 – (15,000) – – –
All Directors total 722,105 (53,000) 650,702 18,403 669,105
The grant of options to Executive Directors and senior management is recommended by the Remuneration Committee on the basis of their contribution to the Group’s success. The options vest after two and a half or three years.
The exercise price of the options is equal to the closing mid-market price of the shares on the trading day previous to the date of the grant. Exercise of an option is subject to continued employment or in the case of unapproved options at the discretion of the Board. The life of each option granted is six and a half to seven years. There are no cash settlement alternatives.
The expected volatility is based on a historical review of share price movements over a period of time, prior to the date of grant, commensurate with the expected term of each award. The expected term is assumed to be six years which is part way between vesting (two and a half to three years after grant) and lapse (10 years after grant). The risk free rate of return is the UK gilt rate at date of grant commensurate with the expected term (i.e. six years).
The total charge for the year relating to employer share-based payment schemes was £33,339 (2017: £96,985), all of which relates to equity-settled share-based payment transactions.
85

Notes to the Financial Statements continuedFor the year ended 31 July 2018
21 Enterprise Management Initiative Scheme The Company operated a share option scheme under the Enterprise Management Initiative (EMI).
The Group has for some years no longer met the EMI Scheme qualifying criteria. Accordingly, there were no options issued under this scheme during the year, and no options remained at the year end. The scheme is now closed.
22(a) Unapproved Share OptionsThe Company issues unapproved share options, the vesting conditions of which have been met.
Movements in the year are shown below:
Options 2018
number
Weighted average exercise price
2018 pence
Options 2017
number
Weighted average exercise price
2017 pence
Outstanding at 1 August 964,108 167.57 1,094,482 159.85
Granted during the year 4,343 402.50 44,031 387.50
Forfeited during the year (5,805) 387.50 (23,997) 223.37
Exercised during the year (145,095) 126.23 (150,408) 166.92
Outstanding at 31 July 817,551 174.59 964,108 167.57
Exercisable at 31 July 718,453 150.79 758,366 146.63
The options outstanding at 31 July 2018 had a weighted average remaining contractual life of 6.6 years (2017: 6.3 years). The exercise prices for shares exercisable at 31 July 2018 ranged from 56.0 pence per share to 287.5 pence per share.
The following sets out the movements in the year in respect of unapproved share options held by the Directors of the Company.
As at 31 July
2017 GrantedExercised/
lapsed
As at 31 July
2018Exercise
price (pence)
Date from which exercisable
Expiry date
A Jacobs 206,087 – – 206,087 1.085 – 2.855 31/7/15 – 6/8/18 31/7/22 – 6/8/25
S Thomas 25,217 – – 25,217 2.070 – 2.855 31/7/17 – 6/8/18 31/1/24 – 6/8/25
R Davies 256,977 – (10,000) 246,977 0.850 – 2.135 31/7/10 – 31/7/17 31/7/17 – 31/7/27
N Newman-Shepherd 197,421 – (25,000) 172,421 1.070 – 3.875 31/7/11 – 31/7/20 31/7/18 – 31/7/27
ETD Luker 15,000 – (15,000) – 0.565 31/7/12 31/7/19
Total 700,702 (50,000) 650,702
22(b) Unapproved Share Options – Long Term Partnership Performance Plan (LTPPP)On 2 July 2018 the Group adopted a Company Long Term Partnership Performance Plan (LTPPP).
The Plan is a discretionary benefit offered by the Company for the benefit of selected key employees. Its main purpose is to increase the interest of the employees in the Group’s long term business goals and performance through share ownership.
Shares purchased or received under the Plan, any cash received under the Plan and any gains obtained under the Plan are not part of salary for any purpose except to any extent required by statute. The Remuneration Committee of the Board of the Company shall have the right to decide, in its sole discretion, whether or not awards will be granted and to which employees those awards will be granted.
86 Lok’nStore Group Plc Annual Report and Accounts 2018

Strategic R
eportO
verviewG
overnanceFinancial S
tatements
A summary of the structure and rules of the Plan are set out below:
Structure • Options are granted on Lok’nStore Group Plc shares
• The exercise price is at £6 is well above the current price to allow the issuance of more options increasing member returns if ambitious targets are hit
• Options are to be issued to participants in 5 annual tranches from July 2018 to July 2022
• Participants will have 10 years to exercise from vesting dates
• Performance criteria are geared to achievement of ambitious long term plan
• Twin performance targets of share price and CAD thresholds for each award. CAD thresholds to be determined each year by the Remuneration Committee
• Alternative exercise methods can be considered by the Group:
– Participants may exercise and hold – paying tax arising
– Participants may exercise and sell – paying tax arising
– Group delivers net profit to participants in cash or shares
Main Rules & Conditions • Conditional on participants remaining in employment with the Group
• Replaces LTPRP for participating members
• Existing cash bonus schemes remain in place
• All options vest if there is a change of control
• Includes Good / Bad Leaver clauses
• The Scheme is entirely at the discretion of the Remuneration Committee who act on behalf of the Board
Movements in the year are shown below:
Options 2018 number
Weighted average exercise price
2018 pence
Outstanding at 1 August – –
Granted during the year 140,000 600.00
Outstanding at 31 July 140,000 600.00
Exercisable at 31 July – –
Post Balance Sheet: The following unapproved share options have been granted to Directors of the Company on 7 August 2018.
As at 31 July
2018 Granted
As at 7 August
2018Exercise
price (pence)
Date from which exercisable
Expiry date
A Jacobs – 40,000 40,000 600.00 31/07/2023 31/07/2033
R Davies – 40,000 40,000 600.00 31/07/2023 31/07/2033
N Newman-Shepherd – 60,000 60,000 600.00 31/07/2023 31/07/2033
Total – 140,000 140,000
87

Notes to the Financial Statements continuedFor the year ended 31 July 2018
23 CSOP Approved Share OptionsOn 2 June 2010 the Group adopted a Company Share Option Plan (CSOP). The CSOP achieved HMRC approval on 28 June 2010. There are no performance conditions attached to share options issued under CSOP.
Movements in the year are shown below:
Options 2018
number
Weighted average exercise price
2018 pence
Options 2017
number
Weighted average exercise price
2017 pence
Outstanding at 1 August 135,378 250.22 166,009 206.05
Granted during the year 21,493 402.50 20,488 387.50
Forfeited/surrendered during the year (8,858) 338.65 (7,926) 260.51
Exercised during the year (55,814) 193.46 (43,193) 143.66
Outstanding at 31 July 92,199 311.59 135,378 250.22
Exercisable at 31 July 39,537 222.27 81,880 191.90
The options outstanding at 31 July 2018 had a weighted average remaining contractual life of 9.9 years (2017: 8.7 years). The exercise prices for shares exercisable at 31 July 2018 ranged from 107.00 pence per share to 287.50 pence per share.
The inputs into the Black-Scholes model used to value the options granted during the year are as follows:
Date of grant
Expected life
(years)
Share price at date of grant
(pence)
Exercise price
(pence)
Expected volatility
(%)
Expected dividend
yield (%)
Risk free interest
rate (%)
Fair value charge per
award (pence)
31 July 2018 6.50 402.50 402.50 24.59 2.57 1.15 72.0
The following CSOP approved share options have been granted to Directors of the Company.
As at 31 July
2017 GrantedExercised/
lapsed
As at 31 July
2018
Exercise price
(pence)
Date from which exercisable Expiry Date
R Davies 7,742 – – 7,742 3.875 31/7/20 31/7/27
N Newman-Shepherd 13,661 – (3,000) 10,661 1.070 – 3.875 31/7/14 – 31/7/20 31/7/21 – 31/7/27
21,403 – (3,000) 18,403
24(a) Other reserves
Group
Cash flowhedge
reserve£’000
Mergerreserve
£’000
Otherreserve
£’000
Capitalredemption
reserve£’000
Share-basedpayment
reserve£’000
Total£’000
1 August 2016 (37) 6,295 1,294 34 846 8,432
Share based remuneration (options) – – – – 97 97
IFRS 2 – transfer (to)/ from retained earnings – – – – (139) (139)
Cash flow hedge reserve net of tax 37 – – – – 37
Tax charge relating to share options – – – – 42 42
31 July 2017 – 6,295 1,294 34 846 8,469
Share based remuneration (options) – – – – 33 33
IFRS 2 – transfer (to)/ from retained earnings – – – – (109) (109)
Cash flow hedge reserve net of tax – – – – – –
Tax charge relating to share options – – – – (30) (30)
31 July 2018 – 6,295 1,294 34 740 8,363
88 Lok’nStore Group Plc Annual Report and Accounts 2018

Strategic R
eportO
verviewG
overnanceFinancial S
tatements
The merger reserve represents the excess of the nominal value of the shares issued by Lok’nStore Group Plc over the nominal value of the share capital and share premium of Lok’nStore Limited as at 31 July 2001.
The other distributable reserve and the capital redemption reserve arose in the year ended 31 July 2004 from the purchase of the Company’s own shares and a cancellation of share premium.
Share based payment reserveUnder IFRS2 there is the option to make transfers from the share based payment reserve to retained earnings in respect of accumulated share option charges where the options have either been exercised or have lapsed post-vesting. The total amounts calculated and accordingly transferred to retained earnings amounted to £109,218 (2017: £138,755).
24(b) Other reserves
Company
Otherreserve
£’000
Share-basedpayment reserve
£’000Total
£’000
1 August 2016 1,114 847 1,961
Share based remuneration (options) – 97 97
IFRS 2 – transfer to retained earnings – (139) (139)
31 July 2017 1,114 805 1,919
Share based remuneration (options) – 33 33
IFRS 2 – transfer to/from retained earnings – (109) (109)
31 July 2018 1,114 729 1,843
25(a) Retained earnings
Group
Retained earnings before
deduction of own shares
£’000
Own shares(note 26)
£’000
Retainedearnings Total
£’000
1 August 2016 17,824 (4,241) 13,583
Profit attributable to owners of Parent for the financial year 3,061 – 3,061
Transfer from revaluation reserve
(Additional depreciation on revaluation) 277 – 277
Transfer from share based payment reserve (note 24(a)) 139 – 139
Transfer realised gain on asset disposal – 3,741 3,741
Dividend paid (2,637) – (2,637)
31 July 2017 18,664 (500) 18,164
Profit attributable to owners of Parent for the financial year 3,757 – 3,757
Transfer from revaluation reserve
(Additional depreciation on revaluation) 291 – 291
Transfer from share based payment reserve (note 24(a)) 109 – 109
Dividend paid (2,977) – (2,977)
31 July 2018 19,844 (500) 19,344
The transfer from revaluation reserve represents the additional depreciation charged on revalued assets net of deferred tax.
The Own Shares Reserve represents the cost of shares in Lok’nStore Group Plc purchased in the market and held in the Employee Benefit Trust to satisfy awards made under the Group’s share incentive plan and shares purchased separately by Lok’nStore Limited for Treasury Account. These treasury shares were not cancelled and have been released back into the market to assist liquidity of the Company’s stock and to provide availability of a reasonable line of stock to satisfy investor demand.
89

Notes to the Financial Statements continuedFor the year ended 31 July 2018
25(b) Retained earnings
Company
Retained earnings before
deduction of own shares
£’000
Own shares(note 26)
£’000
Retainedearnings Total
£’000
1 August 2016 117 – 117
1 August 2016 – As restated 117 (3,741) (3,624)
Profit attributable to owners of Company for the financial year 5,547 – 5,547
Transfer from share based payment reserve (note 24(a)) 139 – 139
Disposal of treasury shares – restated – 3,741 3,741
Dividend paid (2,637) – (2,637)
31 July 2017 3,166 – 3,166
Profit attributable to owners of Company for the financial year 3,572 – 3,572
Transfer from share based payment reserve (note 24(a)) 109 – 109
Dividend paid (2,977) – (2,977)
31 July 2018 3,870 – 3,870
Restatement of 2016 Retained EarningsAt the start of the 2017 financial year a total of 2,466,869 of Lok’nStore Group Plc ordinary shares of 1p each were held for treasury with an aggregate nominal value of £24,669 purchased for an aggregate cost of £3,741,036 at an average price of £1.503 per share (excluding broker’s commission and stamp duty costs). These shares were sold in November 2016 and April 2017 to a range of institutional investors, as described in the 2017 Annual Report.
The treasury shares amount of £3,741,000 was previously reported as an investment by Lok’nStore Limited (the subsidiary) but should have been recognised in Lok’nStore Group Plc’s accounts since they were registered in the name of the parent company.
The impact of the prior period adjustment in plc is to change the amounts shown as the intercompany balance with Lok’nStore Limited and the amount shown as own shares at 1 August 2016, which is included within Retained Earnings on the Statement of Financial Position and disclosed separately in the notes to the accounts.
Accordingly, the comparative 2016 amounts have been restated in the parent company’s accounts. The directors do not believe that this adjustment would cause the reader of the financial statements to form a different view of the Statement of Financial Position of the parent company and therefore have not presented a restated balance sheet at 31 July 2016 as they do not believe it is material in the context of the financial statements as a whole.
Review of distributable reserves and rectification of prior dividends (the Relevant Dividends)The Board has become aware of certain technical issues relating to the levels of distributable reserves within the Lok’nStore Group and the payment of interim and final dividends by Lok’nStore Group Plc to our shareholders during the period from 2013 to 2016 ('the Relevant Dividends').
Lok’nStore’s Group structure is that almost all of the self-storage operations and assets and cash sit within the principal operating subsidiary Lok’nStore Limited. Lok’nStore Group Plc is of itself a non-trading holding company. Throughout this period at all relevant times, the Group had adequate distributable reserves in subsidiary companies to enable payment of the Relevant Dividends, and each year payment of the final dividends was approved by the Company's shareholders at its annual general meeting.
90 Lok’nStore Group Plc Annual Report and Accounts 2018

Strategic R
eportO
verviewG
overnanceFinancial S
tatements
However, a review of historical intra-group transactions revealed that dividends were not paid up from Lok’nStore Limited to Lok’nStore Group Plc in the period from 2013 to 2016 and thereby did not create distributable reserves in Lok’nStore Group Plc in the manner that had been intended. As a consequence, the Relevant Dividends paid by Lok’nStore Group Plc were not paid out of distributable reserves and were therefore not paid in accordance with the Companies Act 2006.
We are undertaking a series of procedural steps in order to rectify this issue and put the Company and its subsidiaries, in the position that was originally intended with respect to the creation of distributable reserves in Lok’nStore Group Plc.
We will put a resolution to shareholders at the forthcoming Annual General meeting to be held on 11 December 2018 which, if passed, would put all potentially affected parties, in so far as possible, in the position they would be had the Relevant Dividends been paid in accordance with the requirements of the Companies Act 2006.
Full details will be included in the circular and notice of general meeting to be sent to shareholders.
26 Own shares EBT
sharesNumber
EBTshares
£
Treasuryshares
Number
Treasuryshares
£
Own sharestotal
£
31 July 2017 and 31 July 2018 623,212 499,910 – – 499,910
Employee Benefit Trust (EBT): The Group operates an Employee Benefit Trust (EBT) under a settlement dated 8 July 1999 between Lok’nStore Limited and Lok’nStore Trustee Limited, constituting an employees’ share scheme.
Funds are placed in the trust by way of deduction from employees’ salaries on a monthly basis as they so instruct for purchase of shares in the Company. Shares are allocated to employees at the prevailing market price when the salary deductions are made.
As at 31 July 2018, the Trust held 623,212 (2017: 623,212) ordinary shares of 1 pence each with a market value of £2,508,428 (2017: £2,414,947). No shares were transferred out of the scheme during the year (2017: nil).
No options have been granted under the EBT. The EBT waived its dividends in full. No other dividends were waived during the year.
27 Cash flows (a) Reconciliation of profit before tax to cash generated from operations
Group 2018
£’000
Group 2017
£’000
Profit before tax 5,325 3,965
Depreciation 1,980 1,856
Amortisation of intangible assets 165 165
Equity settled share based payments 33 97
Warranty Claims (230) –
Carried interest – fees receivable (361) –
Property disposal costs – 15
Store relocation costs – 29
Director retirement costs – 69
Finance income (80) (309)
Finance cost 463 606
Increase in inventories (54) (38)
Increase in receivables (571) (284)
Increase/decrease in payables 312 (648)
Cash generated from operations 6,982 5,523
91

Notes to the Financial Statements continuedFor the year ended 31 July 2018
27 Cash flows continued(b) Reconciliation of net cash flow to movement in net debtNet debt is defined as non-current and current borrowings, as detailed in note 17 less cash and cash equivalents.
Group 2018
£’000
Group 2017
£’000
(Decrease) / increase in cash in the year (6,396) 6,051
Change in net debt resulting from cash flows (8,519) –
Movement in net debt in year (14,915) 6,051
Net debt brought forward (17,430) (23,481)
Net debt carried forward (32,345) (17,430)
28 Commitments under operating leasesAt 31 July 2018 the total future minimum lease payments as a lessee under non-cancellable operating leases were as follows:
Group 2018
£’000
Group 2017
£’000
Land and buildings
Amounts due:
Within one year 1,467 1,469
Between two and five years 5,868 5,868
After five years 7,036 6,600
Total 14,371 13,937
Operating lease payments represent rentals payable by the Group for certain of its properties. Typically leases are negotiated for a term of 20 years and rentals are fixed for an average of five years.
29 Related party transactionsThe Company provides share options for the employees of Lok’nStore Limited. The capital contributions arising from these share-based payments are separately disclosed under investments in note 11.
The aggregate remuneration of the Directors, and the other key management personnel of the Group, is set out below. Further information on the remuneration of individual Directors is found in note 6.
Group 2018
£’000
Group 2017
£’000
Short term employee benefits – Directors 717 1,000
Short term employee benefits – Other key management 320 312
Post-employment benefits – Directors 33 33
Post-employment benefits – Other key management 6 6
Share-based payments 33 97
Total 1,109 1,448
As part of a review of its management personnel the Group recognised a number of management personnel that it felt were important to retain within the business in order for it to achieve its strategic plan. Accordingly these were recognised as key personnel and are participants in the new Long Term Performance Plan (see note 22(b)). They are included in the table above. For consistency the 2017 figures include their comparative figures.
92 Lok’nStore Group Plc Annual Report and Accounts 2018

Strategic R
eportO
verviewG
overnanceFinancial S
tatements
Group Director shareholdings – dividends receivedIn respect of the total dividends paid during the year of £2,976,689, the Group directors received the amounts set out in the table below:
Director's Dividend Income Holding No.
Final 2017 7.67 pence
per share£
Interim 2017 3.33 pence
per share
Executive:
A Jacobs 5,204,600 364,392 171,752
RA Davies 62,934 4,325 2,064
N Newman-Shepherd 9,300 231 307
Non-Executive:
SG Thomas 1,780,000 126,000 58,740
RJ Holmes 273,674 19,157 9,031
ETD Luker 28,800 966 455
CP Peal 513,561 35,949 16,948
Total 7,872,869 551,020 259,297
Managed Stores – Group Director shareholdings.Although the director holdings in Managed Stores falls outside of the definition of related party transactions they are disclosed here for transparency and are set out in the table below:
DirectorChichester
No of sharesBroadstairs
No of sharesExeter
No of shares
Andrew Jacobs 36,800 38,160 240,000
Charles Peal – – 500,000
Simon Thomas – – 160,000
Total shareholding 36,800 38,160 900,000
Issued Share Capital 189,341 189,690 3,970,000
% of Issued Share Capital 19.4% 20.1% 22.7%
30a Capital commitments and guaranteesThe Group has capital expenditure contracted but not provided for in the financial statements of £3.38 million (2017: £2.60 million) relating to building contracts on its Cardiff development site as well as building retentions outstanding on the completed Bristol, Southampton, Gillingham and Wellingborough stores.
30b Bank borrowingsThe Company has guaranteed the bank borrowings of Lok’nStore Limited, a subsidiary company. As at the year-end, that company had gross bank borrowings of £37.3 million (2017: £28.8 million).
31 Events after the reporting datea) Planning permission obtained on the Leicester siteOn 17 August 2018, planning permission was granted for the construction of a self-storage centre.
b) Planning permission obtained on the Cardiff siteOn 22 August 2018, planning permission was granted for the change of use of the trading site to B8 Self Storage use.
c) Planning permission obtained on the Gloucester siteOn 5 September 2018, planning permission was granted for the construction of a self-storage centre.
d) Sale of surplus land at rear of Southampton storeFollowing the development and opening of the new Southampton store there remained surplus land to the rear of the building which could be sold or used for alternative use. On 25 October 2018, the surplus land was sold for £800,000. The Directors have placed a value at the year-end in the financial statements on this land of £0.5 million.
93

Glossary
Abbreviation
Adjusted EBITDA Earnings before all depreciation and amortisation charges, losses or profits on disposal, share-based payments, acquisition costs, and non-recurring professional costs, finance income, finance costs and taxation
Adjusted Store EBITDA Adjusted EBITDA (see above) but before central and head office costs
AGM Annual General Meeting
APD Auditing Practices
Bps Basis Points
CAC Contributory asset charges
CAD Cash available for Distribution
Capex Capital Expenditure
CGU Cash generating units
CO e Carbon Dioxide Emissions
CSOP Company Share Option Plan
EBT Employee Benefit Trust
EMI Enterprise Management Incentive Scheme
ESOP Employee Share Option Plan
EU European Union
GHG Greenhouse gas
HMRC Her Majesty’s Revenue & Customs
IAS International Accounting Standard
IFRIC International Financial Reporting Interpretations Committee
IFRS International Financial Reporting Standards
JLL Jones Lang LaSalle Limited
LIBOR London Interbank Offered Rate
LFL Like for like
LTV Loan to Value Ratio
MWh Megawatt Hour
NAV Net Asset Value
NBV Net book value
Operating Profit Earnings before interest and tax (EBIT)
PV Photovoltaic
RICS Royal Institution of Chartered Surveyors
sq. ft. Square Feet
TVR Total voting rights
VAT Value Added Tax
94 Lok’nStore Group Plc Annual Report and Accounts 2018
Strategic R
eportO
verviewG
overnanceFinancial S
tatements
Head OfficeLok’nStore Plc 112 Hawley Lane Farnborough Hampshire GU14 8JE
Tel 01252 521010 www.loknstore.co.uk www.loknstore.com
Central Enquiries 0800 587 3322 [email protected] www.loknstore.co.uk
Owned Stores – TradingBasingstokeCrockford Lane Chineham Basingstoke Hampshire RG24 8NA
Tel 01256 474700 [email protected]
BristolLongwell Green Trade Park Aldermoor Way Bristol BS30 7ET
Tel 01179 677055 [email protected]
CrayfordBlock B Optima Park Thames Road Crayford Kent DA1 4QX
Tel 01322 525292 [email protected]
EastbourneUnit 4, Hawthorn Road Eastbourne East Sussex BN23 6QA
Tel 01323 749222 [email protected]
Fareham26 + 27 Standard Way Fareham Industrial Park Fareham Hampshire PO16 8XJ
Tel 01329 283300 [email protected]
Farnborough112 Hawley Lane Farnborough Hampshire GU14 8JE
Tel 01252 511112 [email protected]
GillinghamCourtney Road Gillingham Kent ME8 0RT
Tel 01634 366044 [email protected]
HarlowEdinburgh Way Temple Fields Harlow Essex CM20 2GF
Tel 01279 882366 [email protected]
HorshamBlatchford Road Redkiln Estate Horsham West Sussex RH13 5QR
Tel 01403 272001 [email protected]
Luton27 Brunswick Street Luton Bedfordshire LU2 0HG
Tel 01582 721177 [email protected]
MaidenheadStafferton Way Maidenhead Berkshire SL6 1AY
Tel 01628 878870 [email protected]
Milton KeynesEtheridge Avenue Brinklow Milton Keynes Buckinghamshire MK10 0BB
Tel 01908 281900 [email protected]
Northampton Central16 Quorn Way Grafton Street Industrial Estate Northampton NN1 2PN
Tel 01604 629928 [email protected]
Northampton RiversideUnits 1–4, Carousel Way Northampton Northamptonshire NN3 9HG
Tel 01604 785522 [email protected]
Our Stores
95

Our Stores continued
Owned Stores – Trading continuedParknCruiseManor House Avenue Millbrook Southampton Hampshire SO15 0LF
Tel 02380 789966 [email protected]
Poole50 Willis Way Fleetsbridge Poole Dorset BH15 3SY
Tel 01202 666160 [email protected]
PortsmouthRudmore Square Portsmouth Hampshire PO2 8RT
Tel 02392 876783 [email protected]
Reading251 A33 Relief Road Reading Berkshire RG2 0RR
Tel 01189 58999 [email protected]
SouthamptonThird Avenue Southampton Hampshire SO15 0JX
Tel 02380 783388 [email protected]
SunburyUnit C, The Sunbury Centre Hanworth Road Sunbury on Thames Middlesex TW16 5DA
Tel 01932 808466 [email protected]
TonbridgeUnit 6 Deacon Trading Estate Vale Road Tonbridge Kent TN9 1SW
Tel 01732 771007 [email protected]
Wellingborough19/21 Whitworth Way Wellingborough NN8 2EF
Tel: 01634 366044 [email protected]
Owned Stores – Under DevelopmentBedford 69 Cardington Road BedfordNK42 0BQ
BournemouthLand at Wessex Field Deansleigh Road Bournemouth BH7 7DU
Cardiff234, Penarth Road Cardiff CF11 8LR
CheshuntLand lying on the South Side of Halfhide Lane Turnford Hertfordshire
LeicesterPart of land forming part of Freemens Common Road, Leicester LE2 7SL
Managed Stores – TradingAldershot251, Ash Road Aldershot Hampshire GU12 4DD
Tel 0845 4856415 [email protected]
AshfordWotton Road Ashford Kent TN23 6LL
Tel 01233 645500 [email protected]
BroadstairsUnit 2, Pyramid Business Park Poorhole Lane Broadstairs Kent CT10 2PT
Tel 01843 863253 [email protected]
Chichester17, Terminus Road Chichester West Sussex PO19 8TX
Tel 01243 771840 [email protected]
CrawleySussex Manor Business Park Gatwick Road Crawley RH10 9NH
Tel 01293 738530 [email protected]
Hemel HempsteadFortius Point 47, Maylands Avenue Hemel Hempstead Hertfordshire HP2 7DE
Tel 01442 240768 [email protected]
96 Lok’nStore Group Plc Annual Report and Accounts 2018

Strategic R
eportO
verviewG
overnanceFinancial S
tatements
Swindon Kembrey Street Elgin Industrial Estate Swindon Wiltshire SN2 8UYTel 01793 421234 [email protected]
WokingMarlborough Road Woking GU21 5JG
Tel 01483 378323 [email protected]
Managed Stores – Under DevelopmentDoverHoneywood Parkway Whitfield Dover Kent CT16 3FJ
ExeterLand on the West Side of Matford Park Road Marsh Barton Exeter Devon
GloucesterLand at Triangle Park Metz Way Gloucester
Ipswich, Part of Site 7 Futura Park Ipswich P3 9QH
97

Self Storage
Head OfficeLok’nStore Plc112 Hawley Lane Farnborough Hampshire GU14 8JE
T. 01252 521010www.loknstore.co.uk www.loknstore.com