self-supported pt-coo networks combining high specific
TRANSCRIPT

General rights Copyright and moral rights for the publications made accessible in the public portal are retained by the authors and/or other copyright owners and it is a condition of accessing publications that users recognise and abide by the legal requirements associated with these rights.
Users may download and print one copy of any publication from the public portal for the purpose of private study or research.
You may not further distribute the material or use it for any profit-making activity or commercial gain
You may freely distribute the URL identifying the publication in the public portal If you believe that this document breaches copyright please contact us providing details, and we will remove access to the work immediately and investigate your claim.
Downloaded from orbit.dtu.dk on: Nov 16, 2021
Self-supported Pt-CoO networks combining high specific activity with high surfacearea for oxygen reduction
Sievers, Gustav W.; Jensen, Anders W.; Quinson, Jonathan; Zana, Alessandro; Bizzotto, Francesco;Oezaslan, Mehtap; Dworzak, Alexandra; Kirkensgaard, Jacob J.K.; Smitshuysen, Thomas Erik Lyck;Kadkhodazadeh, ShimaTotal number of authors:21
Published in:Nature Materials
Link to article, DOI:10.1038/s41563-020-0775-8
Publication date:2021
Document VersionPeer reviewed version
Link back to DTU Orbit
Citation (APA):Sievers, G. W., Jensen, A. W., Quinson, J., Zana, A., Bizzotto, F., Oezaslan, M., Dworzak, A., Kirkensgaard, J.J. K., Smitshuysen, T. E. L., Kadkhodazadeh, S., Juelsholt, M., Jensen, K. M. Ø., Anklam, K., Wan, H., Schäfer,J., épe, K., Escribano, M. E., Rossmeisl, J., Quade, A., ... Arenz, M. (2021). Self-supported Pt-CoO networkscombining high specific activity with high surface area for oxygen reduction. Nature Materials, 20, 208-213.https://doi.org/10.1038/s41563-020-0775-8

1
Self-supported Pt-CoO networks for oxygen reduction: electrocatalysts combine
high specific activity with high surface area
Gustav W. Sievers a,b, Anders W. Jensen a, Jonathan Quinson a, Alessandro Zana a,c, Francesco Bizzottoc,
Mehtap Oezasland,e, Alexandra Dworzakd,e, Jacob J. K. Kirkensgaard f,g, Thomas E. L. Smitshuysenh, Shima
Kadkhodazadehh, Mikkel Juelsholta , Kirsten M. Ø. Jensen a, Kirsten Anklamb, Hao Wan a, Jan Schäferb,
Klára Čépei, María Escudero-Escribanoa, Jan Rossmeisla, Antje Quade b, Volker Brüserb, Matthias Arenza,c
a Department of Chemistry, University of Copenhagen, Universitetsparken 5, DK-2100 Copenhagen Ø
Denmark
b Leibniz Institute for Plasma Science and Technology, Felix-Hausdorff-Strasse 2, 17489 Greifswald,
Germany
c Department of Chemistry and Biochemistry, University of Bern, Freiestrasse 3, CH-3012 Bern,
Switzerland
d Department of Chemistry, School of Mathematics and Science, Carl von Ossietzky University of
Oldenburg, 26111 Oldenburg, Germany
e Institute of Technical Chemistry, Technische Universität Braunschweig, D-38106 Braunschweig
f Niels Bohr Institute, University of Copenhagen, Universitetsparken 5, DK-2100 Copenhagen, Denmark
g Department of Food Science, University of Copenhagen, Rolighedsvej 30, DK-1958 Frederiksberg C, Denmark
h Technical University of Denmark, Anker Engelunds Vej 1, 2800 Lyngby
i Regional Centre of Advanced Technologies and Materials, Šlechtitelů 27, 783 71 Olomouc, Czech
Republic

2
Corresponding authors: [email protected]; [email protected]
Substantial progress has been achieved in the development of Pt-based catalysts for the oxygen
reduction reaction (ORR) – the process taking place at the cathode of fuel cells. In the last years, several
concepts based on Pt-alloy catalysts have been presented that significantly exceed the Department of
Energy (DOE) targets for Pt related ORR mass activity (MA). With few exceptions, most concepts achieve
their high ORR activity by increasing Pt specific activity (SA) at the expense of a lower electrochemically
active surface area (ECSA). In the potential region controlled by kinetics, which is used in the DOE targets
for fuel-cell performance, such lower surface area is more than counterbalanced by the high SA. At
higher overpotentials, which are often applied in real systems, however, a low ECSA leads to limitations
in the reaction rate not by kinetics, but mass transport in form of a local O2 resistance. Herein we report
on self-supported, nanoporous platinum-cobalt-oxide (Pt-CoO) networks that combine high SA with
unprecedentedly high ECSA. Our investigations reveal that the unprecedentedly high ECSA is achieved
by a Pt-CoO bone structure with a diameter of only a few nm. Using this concept, we achieved
unprecedentedly high mass activity values for self-supported ORR catalyst layer. This material concept
promises stable and low platinum fuel cell operation at high temperature, high current density and low
humidification.
Graphical Abstract

3
4
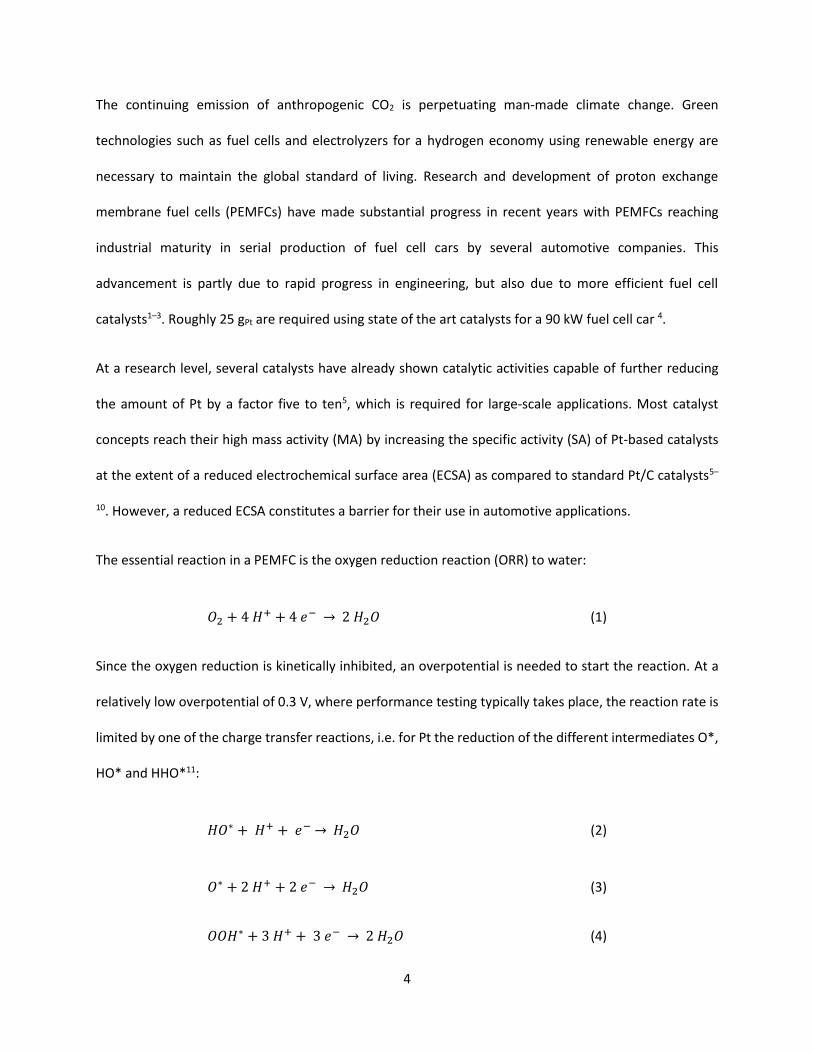
The continuing emission of anthropogenic CO2 is perpetuating man-made climate change. Green
technologies such as fuel cells and electrolyzers for a hydrogen economy using renewable energy are
necessary to maintain the global standard of living. Research and development of proton exchange
membrane fuel cells (PEMFCs) have made substantial progress in recent years with PEMFCs reaching
industrial maturity in serial production of fuel cell cars by several automotive companies. This
advancement is partly due to rapid progress in engineering, but also due to more efficient fuel cell
catalysts1–3. Roughly 25 gPt are required using state of the art catalysts for a 90 kW fuel cell car 4.
At a research level, several catalysts have already shown catalytic activities capable of further reducing
the amount of Pt by a factor five to ten5, which is required for large-scale applications. Most catalyst
concepts reach their high mass activity (MA) by increasing the specific activity (SA) of Pt-based catalysts
at the extent of a reduced electrochemical surface area (ECSA) as compared to standard Pt/C catalysts5–
10. However, a reduced ECSA constitutes a barrier for their use in automotive applications.
The essential reaction in a PEMFC is the oxygen reduction reaction (ORR) to water:
𝑂2 + 4 𝐻+ + 4 𝑒− → 2 𝐻2𝑂 (1)
Since the oxygen reduction is kinetically inhibited, an overpotential is needed to start the reaction. At a
relatively low overpotential of 0.3 V, where performance testing typically takes place, the reaction rate is
limited by one of the charge transfer reactions, i.e. for Pt the reduction of the different intermediates O*,
HO* and HHO*11:
𝐻𝑂∗ + 𝐻+ + 𝑒− → 𝐻2𝑂 (2)
𝑂∗ + 2 𝐻+ + 2 𝑒− → 𝐻2𝑂 (3)
𝑂𝑂𝐻∗ + 3 𝐻+ + 3 𝑒− → 2 𝐻2𝑂 (4)

5
Figure 1: Volcano Plot showing experimental activity data relative to Pt as a function of the hydroxyl
intermediate binding energy ΔGHO; Data for Pt/Au(111), Pt3Y, Pt3Ni, dealloyed PtCu, Pt3Fe, Pt3Co and
Pt/Ir(111) is taken from Stephens et al.11(black); Data for Pt/C and Pt3Co/C is as used in this publication
assuming the same hydroxyl binding energy as bulk Pt or Pt3Co respectively (grey); Data for Pt-CoO is
taken from DFT calculations and electrochemical activity evaluation.
As the binding energies of the individual reaction intermediates are not independent of each other but
are connected via the scaling relation11, the discussion is usually based on a single reaction intermediate,
e.g. the hydroxyl binding energy. If the hydroxyl binding energy is too small, the reaction is limited by the
OH* reduction, if it is too large, the reaction is limited by the HHO* formation. As a consequence, the
experimental (and theoretical) data for the ORR activity display a volcano-type dependence on the
hydroxyl intermediate binding energy, see Figure 1. In order to optimize the intermediate binding
-0.1 0.0 0.1 0.2 0.3
0.1
1
10
100
Pt-CoO
Pt
Pt3Co
Pt3Fe
Pt3Ni
Pt/Au(111)
dealloyed PtCu
Pt3Y
Pt/Ir(111)
Pt/C
Pt3Co/C
Activity limited
by HO* reduction
Activity limited
by HHO* formationS
pe
cific
Activity r
ela
tive
to P
t
GHO* - GPtHO* / eV

6
energies, the electronic structure of Pt has to be slightly changed. Main principles for achieving this and
to design Pt-based ORR electrocatalysts are the strain and the ligand effects12, which are discussed later
on in more detail.
Automotive fuel-cell systems, however, operate at high current densities and thus relatively large
overpotentials. As the overpotential increases, the nature of the rate determining step changes and mass
transfer becomes crucial for the performance4,13,14. As a consequence, at low overpotentials up to 0.3 V
and thus low current densities, the reduced ECSA of most catalyst concepts does not impact their
performance4. However, at higher overpotential, e.g. 0.5 V, which is often reached under fuel-cell
operation, the charge transfer steps are fast on an active catalyst11 and mass transfer, especially the
oxygen resistance, becomes more and more rate limiting4. Thus, the power density in this potential regime
depends on the ECSA per mass. As a consequence, it is key to achieve improved SA and high ECSA for
realizing high performance in an automotive PEMFC application. As also outlined in recent work of
Kongkanand et al.4, a sole focus on optimizing the SA at low overpotentials (0.9 VRHE) disregards the oxygen
mass transport resistance occurring at higher overpotentials. Additionally, it was found that ionomer-free
catalysts such as nanostructured thin film (NSTF) catalysts by 3M have the lowest oxygen resistance4. For
the goal of achieving high current densities of > 1.5 A cm-2 in fuel-cell operation, high dispersion of the
catalytically active material (high ECSA) combined with a high specific activity is therefore crucial4.
Here, we present a concept for a self-supported catalyst capable of combining high SA with an
unprecedentedly high ECSA. The catalyst is inspired by developments for carbon-free ORR catalysts, such
as nanostructured thin film (NSTF) catalysts introduced by 3M9. Such catalysts utilize the high SA of bulk
Pt9, but perhaps equally important and technologically relevant, they circumvent inherent carbon
corrosion problems of standard carbon supported catalysts9. In addition, it was recently demonstrated
that, in carbon-supported catalysts, not only oxygen diffusion can be rate limiting, but also proton

7
transport15. Using new catalyst layer engineering methods, oxygen-related mass transport resistances can
be to some extent overcome16,17. A disruptive change of the catalyst layer concept towards self-supported
catalyst layers would allow new operation regimes for PEMFCs with regard to temperature and
humidification. The presented catalyst layer consists of a nanoporous (np) Pt-CoO network, which is
achieved by alternating magnetron sputtering of Co and Pt layers and subsequent acid leaching of the
non-noble cobalt-oxide component, see methods section and supporting information (SI) for more details.
This method was recently shown for synthesis of highly active self-supported iridium-based catalysts for
oxygen evolution18 and nanostructured Pt-Cu for ORR19, the latter presenting a low ECSA as compared to
this work. Compared to complex wet-chemical approaches, the magnetron sputtering technique is easily
up-scalable and allows the use of different substrates, such as glassy carbon, but also gas diffusion layers
(GDLs), transfer foils or even membranes. The metal network is self-supported, i.e. it does not require any
carbon support material, and is directly prepared onto such substrates. In the presented work, we used
glassy carbon (GC) disk electrodes and GDLs as substrates. In Figure 2, scanning transmission electron
microscopy (STEM) and scanning electron microscopy (SEM) micrographs, respectively, are shown to
visualize the porous structure. In addition, a tomographic 3D movie is shown in the SI and Figure S1 – S4.

8
Figure 2. Morphology of self-supported nanoporous Pt-CoO networks a) Scanning transmission electron
microscopy high-angle anular dark-field imaging (STEM HAADF) with elemental distribution of np Pt-CoO
measured by EDX of b) Cobalt (red), c) Pt (green) and d) a combined elemental distribution graph of Pt
and Co; e) Scanning electron microscopy (SEM) top-view and f) side-view
In order to investigate and optimize the np Pt-CoO network, various catalysts with different Pt:Co starting
compositions as well as heat treatment steps were prepared as summarized in Table 1. It is demonstrated
that, after acid leaching (see Methods section), the catalyst can still contain up to 28.4 at. % Co as indicated
by energy dispersive X-ray spectroscopy (EDX). However, X-ray photoelectron spectroscopy (XPS) reveals
that, in all cases, the near surface concentration of Co is very low, see Table 1; an observation that is in
agreement with the formation of Pt-CoO encapsulated structures, where Co is preferably located in the
core and Pt dominates at the surface. A similar conclusion is suggested by STEM HAADF micrographs, see
Figure 2 d, showing the elemental distribution at nanometer scale. The presence of cobalt oxide under
electrochemical conditions is confirmed by in situ X-ray absorption spectroscopy (XAS), see Figure 7 and
SI, whereas small angle X-ray scattering (SAXS) indicates that a nanoporous structure is formed with a
9
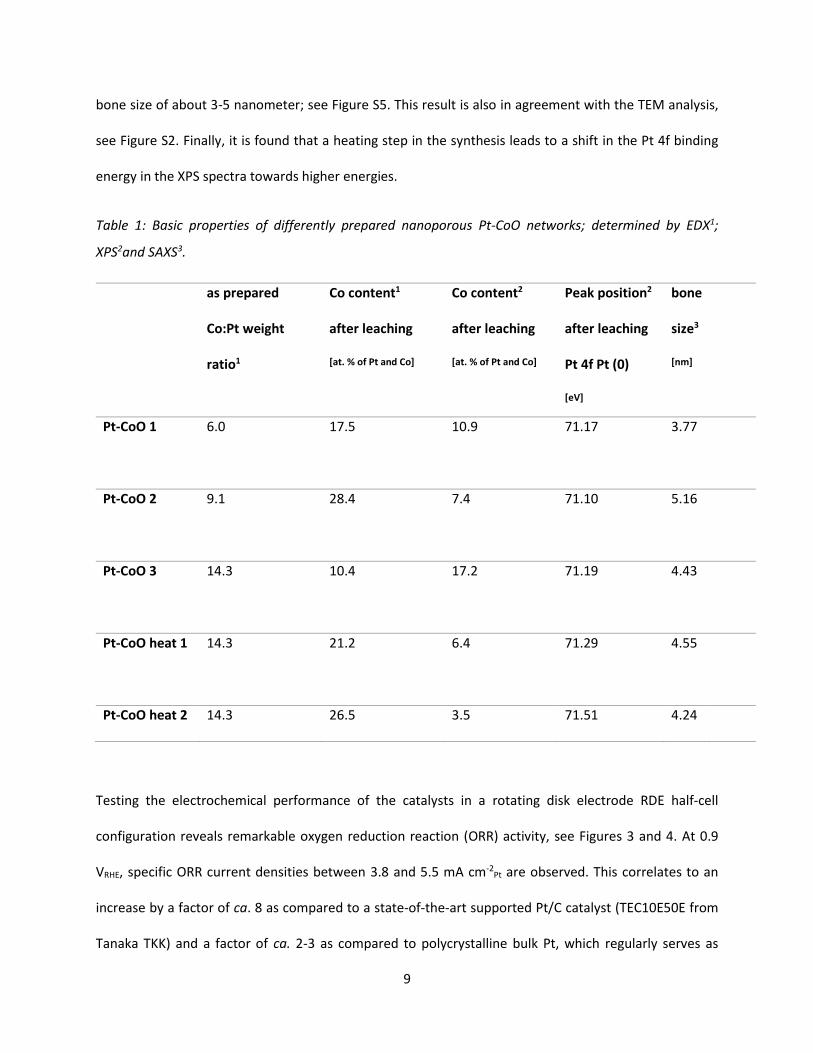
bone size of about 3-5 nanometer; see Figure S5. This result is also in agreement with the TEM analysis,
see Figure S2. Finally, it is found that a heating step in the synthesis leads to a shift in the Pt 4f binding
energy in the XPS spectra towards higher energies.
Table 1: Basic properties of differently prepared nanoporous Pt-CoO networks; determined by EDX1;
XPS2and SAXS3.
as prepared
Co:Pt weight
ratio1
Co content1
after leaching
[at. % of Pt and Co]
Co content2
after leaching
[at. % of Pt and Co]
Peak position2
after leaching
Pt 4f Pt (0)
[eV]
bone
size3
[nm]
Pt-CoO 1 6.0 17.5 10.9
71.17
3.77
Pt-CoO 2 9.1 28.4 7.4
71.10 5.16
Pt-CoO 3 14.3 10.4 17.2
71.19 4.43
Pt-CoO heat 1 14.3 21.2 6.4
71.29 4.55
Pt-CoO heat 2 14.3 26.5 3.5 71.51 4.24
Testing the electrochemical performance of the catalysts in a rotating disk electrode RDE half-cell
configuration reveals remarkable oxygen reduction reaction (ORR) activity, see Figures 3 and 4. At 0.9
VRHE, specific ORR current densities between 3.8 and 5.5 mA cm-2Pt are observed. This correlates to an
increase by a factor of ca. 8 as compared to a state-of-the-art supported Pt/C catalyst (TEC10E50E from
Tanaka TKK) and a factor of ca. 2-3 as compared to polycrystalline bulk Pt, which regularly serves as
10
benchmark for the ORR20. Such ORR specific activities are typical for highly active bulk Pt-alloy catalysts,
such as Pt3Co-alloys. For instance, Stamenkovic et al. reported a specific ORR activity of around 4.5 mA
cm-2Pt at 0.9 VRHE for a polycrystalline Pt3Co bulk alloy3. The high specific ORR performance can be related
to an optimization of the binding energy of the catalyst surface with the reaction intermediate O, OH and
OOH, which functions as descriptor in the optimization of Pt based ORR catalysts21. Alloying Pt with a
second, less noble element, tunes the electronic structure of Pt and improves its ORR performance22.
Furthermore, recently, it was shown that surface distortion has a positive effect on the ORR activity as
well2. As mentioned above, the XPS results indicate that in particular a heat treatment of the Pt-CoO
networks leads to such a change of the electronic properties of platinum. The main enhancement of the
specific activity, however, is not assigned to a ligand effect. Instead, it is suggested that the observed
increase in ORR activity is related to a structural effect of the Co-Oxide core on the Pt skin layer: i.e. the
underlying Co-Oxide core causes a compressive strain on the outer Pt layer, which is generally known to
increase the ORR activity23. Before discussing further experimental and theoretical evidence of this
hypothesis, our efforts to test the stability of the np Pt-CoO networks are presented.

11
Figure 3. Pt surface area-based specific ORR activities of different np Pt-CoO networks. The value for Pt/C
(TEC10E50E 2-3nm) is prepared in the same lab and taken from literature24. Due to the high reduction
current at 0.9 VRHE the calculated SA is less reliable5, see also experimental data shown in Figure S8 – S11.
Therefore, we include the SAs determined at 0.95 VRHE as well. The error bars are determined from three
independent measurements. The label heat indicates that sample Pt-CoO 3 was heated to 573 K for 8 or
16 min, respectively Pt-CoO heat 1 and Pt-CoO heat 2; see also methods section.
Stability measurements were performed at 80°C applying the accelerated stress (AST) protocols proposed
by the FCCJ25 which are described in detail in the SI. A commercial Pt/C catalyst (TEC10E50E, 2-3nm) was
used as benchmark. Applying an AST simulating load-cycles (0.6 VRHE – 1 VRHE), a similar ca. 45 % loss in the
ECSA is found for the np Pt-CoO networks as for the commercial Pt/C catalyst after 3,600 cycles.
Nevertheless, the observed trend in ECSA loss during the AST treatment is different. While under the
applied conditions for the Pt/C catalyst a more or less continuous “exponential decrease” in ECSA is
Pt/C
Pt-CoO heat 2
Pt-CoO heat 1
Pt-CoO 3
Pt-CoO 2
Pt-CoO 1
0 1 2 3 4 5 6 7
0.0 0.1 0.2 0.3 0.4 0.5 0.6 0.7
[email protected] / mAcm-2
[email protected] / mAcm-2 [email protected] VRHE
[email protected] VRHE
12
observed, the main ECSA loss of the np Pt-CoO networks occurs in the first 600 AST cycles, see Figure S12.
Thereafter, the decrease in ECSA becomes significantly slower. Investigating the degraded np Pt-CoO
networks by TEM it is found that the degradation is related to an increase in the average bone size of the
networks, most likely originating from the dissolution of platinum followed by re-deposition on the bones
as well as dealloying, see Figure S13. Such an effect is in good agreement with previous reports stating
that an AST treatment simulating load-cycles (AST 1) mainly induces Pt dissolution and electrochemical
Ostwald ripening26. It should be further noted that the TEM micrographs indicate no sign of changes in
the structural morphology of the np networks. Applying an AST treatment simulating start-stop cycles (1
VRHE – 1.5 VRHE; AST 2) the advantage of the np Pt-CoO networks over conventional catalyst concepts
becomes evident, in particular the absence of a carbon support. While under the applied conditions the
Pt/C benchmark degrades very rapidly, 53% of the ECSA is lost after 800 cycles, the self-supported np Pt-
CoO network catalyst is significantly more stable and loses only 15% of its surface area, see Figure S14
and S15. Furthermore, the decrease in specific ORR activity is relatively moderate; after the AST 2 the SA
is still 3.6 mA cm-2Pt as compared to a SA of 2.4 mA cm-2
Pt after AST 1, see Figure S16.
Comparing the electrocatalytic mass activity to previous efforts to optimize ORR catalysts, it is essential
to note that with the presented catalysts the high SA of the np Pt-CoO network is not achieved at the
expense of a reduced ECSA, see Figure 4. Typically, going from bulk surfaces to nanoparticle-based
catalysts, the specific ORR activity decreases with a decrease in active surface area (decrease in particle
size27). In contrast, for the np Pt-CoO networks, the achieved surface area is comparable with highly
dispersed carbon-supported Pt nanoparticles, i.e. > 100 m2 g-1Pt. Therefore, an initial loss of active surface
area during “load cycle treatments” is difficult to avoid. However, also after degradation the catalyst
remains superior to standard catalysts. The high surface area of the Pt-CoO networks can be correlated
to their nanoporous nature and fine Pt-CoO “bone” structure with chain diameters of approximately 4 nm
as measured by SAXS and TEM, see Table 1 and Figures S1 – S4. The pore diameter was averaged to be

13
approximately 16 nm, see Figures S1 and S3. An estimation based on TEM Tomography indicates that the
mean volume of the bone structure is 20.4%, see Figure S4. This combination of a fine bone structure and
relatively large pore volume allows high oxygen transport and high electronic conductivity. Furthermore,
the presence of Nafion-ionomer in the catalyst layer of a fuel cell is expected to be less crucial as compared
to standard Pt/C or Pt-alloy/C catalysts as the proton transport can be established via proton diffusion on
the surface of the catalyst or via adsorbed water as emphasized by Debe et al.28 for ionomer-free catalyst
layers.
Figure 4. Comparison of ORR performance at 0.9 VRHE for different standard and model catalysts with the
best performing np Pt-CoO network. a) Specific ORR activity (bar) and electrochemically available surface
area (red cross), b) Pt mass related ORR activity calculated from a). The values for Pt/C (TEC10E50E 2-
3nm), Pt3Co/C, Pt (polycrystalline, MA n/a) and Pt3Co (polycrystalline, MA n/a ) are taken from literature:
Pt and Pt/C24, Pt3Co3, Pt3Co/C29.
As self-supported nanoporous Pt-CoO networks are a new concept for ORR catalysts, we have extensively
characterized them further by both ex situ and in situ XAS, ex situ pair distribution function analysis as
well as computational modelling with density functional theory (DFT). The aim is to gain a further
Pt/C Pt3Co/C Pt Pt3Co Pt-CoO0
2
4
6
8
b)
this work
high ECSA
high SA
bulk
no ECSA
high SA
SA
/ m
Acm
-2P
t
HSAC
high ECSA
low SA
a)0
50
100
150
200
EC
SA
/ m
2 g
-1
Pt/C
Pt 3Co/
C
Pt-CoO
0
1
2
3
4
5
6
7
8
9
10
MA
/ A
mg
-1P
t

14
knowledge on the structure-activity relationship as well as understanding better the nature of the active
phase.
Figure 5. Bottom: Fourier Transform (FT) magnitudes of the k2-weighted extended X-ray absorption fine
structure (EXAFS) data of the leached np Pt-CoO networks, see color coding for the individual samples. A
pure Pt foil (grey line) and Pt nanoparticles supported on carbon (Pt/C) with a mean particle size of 3-4 nm
(dark grey line) serve as reference. Dashed lines indicate the typical atomic Pt-Pt distance for 3-4 nm Pt/C
and Pt foil. It is noted, that the mean diameters of the Pt-CoO bones are similar like the mean diameter of
the nanoparticles. The k-range for the Fourier-transformed EXAFS spectra at the Pt L3 edge was from 3 to
13 Å-1.
Ex situ X-ray absorption near edge structure (XANES) and extended X-ray absorption fine structure (EXAFS)
spectroscopy of the leached Pt-CoO networks at the Pt L3 edge and Co K edge, see Figure 5 and Figure
S17—S19 and Table S1, indicate that the Pt is partially oxidized, while the Co largely appears as Co oxide,
0 1 2 3 4 5 6
0.0
0.5
1.0
1.5
2.0
2.5
FT
Ma
gn
itu
de
R + R / Å
Pt-CoO 1
Pt-CoO 2
Pt-CoO 3
Pt-CoO heat 1
Pt-CoO heat 2
Pt foil
3-4 nm Pt NP/C
Pt L3 edge

15
see Figure S18. The atomic Pt-Pt distances of the network catalyst are significantly reduced as compared
to those of a Pt foil or even Pt nanoparticles supported on carbon, indicating a mean Pt-Pt lattice strain,
see Table S1. It should also be noted that no Pt-Co alloy is formed; the EXAFS spectra for the np Pt-CoO
networks reveal the absence of hetero-metallic Pt-Co pairs. That is, the alternated magnetron sputtering
and dealloying largely leads to mono-metallic Pt-CoO bone structures without alloy formation. PDF
analysis of x-ray total scattering data (see Figure 6 and table S4 and S5) show that the leached, np Pt-CoO
networks exhibit mainly an fcc structure corresponding to a strained Pt nanostructure with a smaller unit
cell parameter compared to that of bulk Pt, confirming the EXAFS results. The structure is highly strained:
While all peaks in the PDF can be assigned to an fcc structure, the apparent unit cell parameter changes
as structure modelling are done over different ranges of the PDF (table S54 and S5). Such behavior may
be explained by the presence of a cobalt or cobalt oxide core in the structures or a curvature of the thin
bones in the structure. Note that the lower X-ray scattering power of Co compared to Pt and low
concentration of Co makes it difficult to establish the structure of Co-containing phases from the current
X-ray total scattering data.

16
Figure 6. A) Fit of the fcc structure to the experimental PDF from a leached Pt-CoO sample. The fcc structure
fits to the most intense peaks in the low r-region. B) Zoom of the fit from (A) at the r-range from 18-40 Å,
where the model fails to fit the experimental data. C) The high r data can be fitted by a fcc model, although
with a smaller unit cell parameter.
The catalyst structure is also investigated by DFT calculations to model the strain effect of CoO core on
the thin Pt skin, see Figure S20 and S21 and discussion in the SI. The calculations indicate that the strain
(- 1.28%) weakens the adsorption of OH by 0.038 eV leading to an estimated reduction of around 38 mV
in overpotential as compared to an unstrained Pt layer. The relative strain is in agreement with the one
of electronically modified electrocatalysts to Pt as found for PtxY30 and dealloyed Pt-Cu31. The calculations

17
are in line with in situ EXAFS measurements, see Figure 7 and SI, which show that indeed on the np Pt-
CoO networks the Pt-O coordination as function of the applied potential is significantly lower than on a
Pt/C benchmark sample. As no contribution of Co-Pt pairs is observed from the ex-situ XAS data, we
assumed that the coordination number of the Pt is altered by the anodic potential applied during the ORR,
where oxygen species adsorb at the electrode surface. Therefore, the high specific ORR activity of the self-
supported np Pt-CoO networks can be understood as a result of local strain due to decreased Pt-Pt
distances in the Pt shell.
Figure 7: Potential dependent N(Pt-O)/N(Pt-Pt) ratio measured with in-situ X-Ray Absorption Spectroscopy.
The coordination number of Pt-O and Pt-N are acquired by fitting the acquired EXAFS spectra. Pt-CoO (blue)
and Pt/C 30wt% (black) shown at the measured potentials with the sweeping direction indicated by the
arrows.
0.0 0.2 0.4 0.6 0.8 1.0 1.2-0.1
0.0
0.1
0.2
0.3
0.4
0.5
0.6
0.7
0.8
0.9
ratio
N(P
t-O
)/N
(Pt-
Pt)
E / VRHE
Pt-CoOxide
30 wt.% Pt/C

18
The combination of high SA with high ECSA leads to extremely high mass activities (MA) for the ORR. As
summarized in Figure 8 and Table 2, the highest achieved MA reaches 8 A mg-1Pt at 0.9 VRHE. This exceeds
the performance of conventional, carbon supported Pt-alloy catalysts by a factor of ca. 15, see Figure 4.
To the best of our knowledge, the mass activity of the here presented self-supported Pt-CoO are far
superior to previously reported carbon-free ORR catalysts. Similar or higher mass activity was previously
observed only for systems that require a carbon support, such as reported Pt-Ni nanoframes
(Nanoframes)5 or ultrafine jagged Pt nanowires (J-PtNWs/C)32.
20 40 60 80 100 120 140 160 1800
2
4
6
8
10
12
14
PtCo NW
Pt-CoO heat2
Pt-CoO heat1
Pt-CoO 3
Pt-CoO 2
PALD
LP@PF
Nanoplate
J-PtNWs/C
Mo-Pt3Ni/C
Nanocages
PtxY
PtCuAerogel
Pt 2.5Ni
PtxGd
Pt/C
Pt-CoO network
MA
/ A
mg
-1P
t
ECSA / m2g-1Pt
NSTF
Nanoframes
Pt-CoO 1
Figure 8. Comparison of ORR mass activity (MA) at 0.9 VRHE and electrochemical active surface area (ECSA)
for different supported and self-supported (underlined) catalysts and np Pt-CoO network. The inserted
values are for Nanocages6, Nanoframes5, Pt2.5Ni7, PtxGd8, NSTF9, Pt/C24, J-PtNWs/C32, PtxY30, PtCu19, PtCo
NW33, Aerogel34, Mo-Pt3Ni/C35, LF@PF36, Nanoplate37 and PALD38.

19
Table 2: Electrochemical properties of differently prepared Pt-CoO networks as stated in Table 1.
SA
@0.9VRHE
[mAcm-2Pt]
SA
@0.95VRHE
[mAcm-2Pt]
ECSA
CO-Stripping
[m2g-1Pt]
ECSA
H-UPD
[m2g-1Pt]
MA
@0.9VRHE
[Amg-1Pt]
Pt-CoO 1 4.57 ± 0.67 0.52 ± 0.09 101 ± 6 85 ± 10 4.60 ± 0.96
Pt-CoO 2 4.52 ± 0.30 0.51 ± 0.02 115 ± 4 111 ± 28 5.19 ± 0.52
Pt-CoO 3 3.77 ± 0.25 0.49 ± 0.06 152 ± 10 147 ± 28 5.74 ± 0.76
Pt-CoO heat 1 4.59 ± 0.17 0.59 ± 0.02 147 ± 6 134 ± 25 6.75 ± 0.51
Pt-CoO heat 2 5.38 ± 0.21 0.62 ± 0.01 156 ± 4 156 ± 27 8.37 ± 0.55
To conclude, the combination of high ORR SA and high ECSA leads to high MA values of the self-supported
np Pt-CoO networks. The higher SA could be assigned to a slightly strained platinum surface which is
caused by the cobalt-oxide core. Although being a model catalyst, this new type of self-supported catalyst
is a significant step towards applications of PEMFCs because the key property of improved SA and high
ECSA is not only important for obtaining high MA. It is expected to be also crucial for realizing such
performance in a PEMFC application. Optimizing these kind of catalyst layers for PEMFCs will require
larger catalyst layers that enable extensive MEA testing, as it has been done with carbon supported
catalysts for decades. For more realistic benchmarking test, we also measured the np Pt-CoO network
catalyst in a gas diffusion electrode half-cell setup14,39. As a promising result, it is confirmed that the
activity of this catalyst is indeed superior to Pt/C at low temperature and dry conditions. However, under
humidified conditions and high temperature such as 80 °C the catalyst layer has to be further optimized
to avoid flooding. Nevertheless, the target in automotive industry is to develop PEMFCs operable above
100 °C to reduce problems in heat management, conditions at which flooding should not be a problem
but carbon corrosion is expected to increase40. At such conditions, the carbon-free self-supported catalyst

20
will be a particularly interesting concept. The presented technology is industrially scalable and can be
applied on all planar surfaces as gas diffusion layers, transfer foils or membranes. Thus, it combines all
necessary ingredients to enable a further decrease in the Pt content of future PEMFC technology for
mobile applications.
21
Methods
Sample preparation. Glassy carbon electrodes (3 mm and 5 mm diameter, HTW, Germany) were polished
and ultrasonicated in acetone, isopropanol, ethanol and ultrapure H2O (Millipore 18.2 MΩcm resistance
and 5 ppb TOC). The electrodes were thereafter transferred to a vacuum chamber and for 3 minutes,
plasma-activated at a pressure of 20 Pa in O2 atmosphere and a radio frequency (RF) power of 300 W.
Samples were then transferred to the deposition chamber. To prepare the Pt-Co catalysts, the reactor
chamber was evacuated to a base pressure of 5 · 10−3 Pa. An argon plasma was ignited in the chamber at
a working pressure of 5 Pa. First, a 15 nm Ti (99.9 % Mateck GmbH, Germany) interlayer was deposited
onto the glassy carbon by magnetron sputtering. For the Pt-Co film deposition, two magnetrons were
equipped with planar targets of Co (99.9 %, Mateck GmbH, Germany) and Pt (99.95 %, Junker Edelmetalle,
Germany). They were located at the superior part of the recipient. The RF generators (Advanced Energy)
had a driving frequency of 13.56 MHz. The recipient (Neoplas GmbH, Germany) was configurated in a way
that the substrate holder is turned automatically towards the respective magnetron with the sputtering
being initiated when the sample is in position below the magnetron. To obtain the nanoporous metal film,
Co and Pt sputtering were alternated with the respective loading deposition of Pt and Co. The alternating
process was repeated 11 times so that the total Pt loading of the as-deposited electrode was 22 µgPt cm-
2geo. We varied the deposition time of Co to obtain different Co:Pt compositions, respectively 6:1, 9:1, 14:1
by weight. Directly after preparation Pt-CoO heat 1 and Pt-CoO heat 2 metal films were treated in the
vacuum chamber at 573 K for 8 (heat 1) and 16 minutes (heat 2). After deposition of the Pt-CoO networks,
the glassy carbon electrode was inserted into a Teflon holder. Then samples were electrochemically
leached by inserting them under potential control into the electrochemical cell and cycling them between
0.05 VRHE and 1.00 VRHE with a scan rate of 50 mV s-1, directly after immersion into a de-aerated 0.1 M
HClO4 electrolyte until a stable cyclic voltammogram (CV) was achieved. As control the Pt and Co contents

22
of the metal films were determined by EDX before and after leaching. Each sample was prepared and
tested at least three times.
Electrochemical investigations. The tips were mounted as working electrodes into the rotating disk
electrode and placed in a separate three-compartment electrochemical Teflon cell. The reference
electrode was separated by a Nafion membrane from the working electrode41. All measurements were
performed at room temperature using a Nordic-EC potentiostat, a saturated Calomel reference electrode
and a carbon rod as the counter electrode. Prior to each experiment the potential was calibrated to the
reversible hydrogen potential (RHE). The solution resistance was electronically compensated by a positive
feedback scheme. The potentials in this study are given with respect to the RHE. 0.1 M HClO4 was used as
the electrolyte in all measurements. The electrolytes were made from MilliQ water (> 18.2 MΩcm, < 5
ppb TOC) and ultrapure 70% HClO4 (Suprapur, Merck). Specific activity (SA) was defined as the quotient
of the kinetic activity as calculated by the Koutecky-Levich equation divided by the electrochemically
active surface area (ECSA) determined by the CO stripping method. The ECSA was defined as the surface
area determined by CO stripping divided by the measured Pt mass with ICP-MS after leaching and ORR
testing. The mass activity (MA) was defined as specific activity multiplied by the ECSA. For the calculation
of the ECSA we used the loading as measured by ICP-MS after leaching because more than half of the Pt
was lost during leaching. For further information see Supporting Information.
SEM and TEM characterization. The SEM (JSM7500F, Jeol) was employed with a field-emission gun, a semi
in-lens conical objective lens and a secondary electron in-lens detector for high-resolution and high-
quality imaging of structural features. The maximum specified resolution was 1.0 nm at 15 keV. Glassy
carbon electrodes were directly positioned on the substrate holder without any preparative coating. The
TEM (Jeol 2100) was operated at 200 kV. Samples were characterized by recording images with a
minimum of 3 different magnifications in at least 5 different areas of the TEM grid. The size analysis was

23
performed by measuring the size of the skeleton. The TEM grids were prepared as follows. The glassy
carbon disc with the nanoporous catalyst layer was sonicated in ca. 200 – 500 µl isopropanol for 5 minutes
until the isopropanol turned slightly grey indicating the dispersion of the sample. This dispersion was then
drop casted onto a holey carbon support film of Cu 300 mesh grids (Quantifoil). In addition, we deposited
Pt-Co templates directly onto TEM grids and leached them in 0.1 M perchloric acid prior to TEM
investigations. The size of the different structures in the TEM images was analyzed using imageJ software
by manually measuring the size of the different structures and classifying them into pore, bone and
agglomerate.
Scanning Transmission Electron Tomography. The electron tomography data was acquired in HAADF
STEM mode on a Thermo Fisher Titan (S)TEM instrument fitted with a field emission electron gun and
operated at 300 kV. The electron probe size and convergence angle were ~ 1.5 Å and 17 mrad,
respectively, and the HAADF collection angle was 50 mrad. Tilt series in the angular range -68° to +68°
were acquired with 2° increment steps. The shift between the images in the tilt series and their rotation
axis were corrected using the Thermo Fisher Inspect3D program. The SIRT algorithm was used to
reconstruct the 3-dimensional (3D) structure from the aligned tilt series. The 3D visualization and volume
rendering was performed in the program Aviso Lite 9.0.1.
Scanning Transmission Electron Microscopy High Angle Angular Dark-Field Imaging. STEM HAADF. The
samples were measured by High Resolution Transmition Electron Microscope (HRTEM) Titan G2 (FEI) with
Image corrector on accelerating voltage 80 kV. Scanning TEM (STEM) images were taken with HAADF
detector Model 3000 (Fishione). The qualitative EDX mapping was obtained by Super-X system with four
silicon drift detectors (Bruker) in STEM mode at 80kV (Titan G2, FEI). Thereby the collected data were
evaluated by Cliff-Lorimer model and averaged at lateral maps resolution of 1 nm.
EDX and XPS characterization. Pt to Co ratios were analyzed by EDX and XPS. EDX was performed with the
SEM (JSM7500F, JEOL) using 10 keV and higher beam current. X-Ray photoelectron spectroscopy (XPS)

24
was carried out using an Axis Ultra (Kratos, GB) for element analysis and determination of electronic
density of states. The spectra were recorded by means of monochromatic Al Kα excitation (1.486.6 eV)
with a medium magnification (field of view 2) lens mode and by selecting the slot mode, providing an
analysis area of approximately 250 μm in diameter. A pass energy of 80 eV was used for estimating the
chemical elemental composition; 10 eV was used for the high-energy resolution of the Pt 4f region to
investigate Pt chemical state.
ICP-MS measurements. The Pt loading of the catalysts was determined by using inductively coupled
plasma mass spectrometry (ICP-MS) measurements. For this, the catalysts were digested in aqua regia
freshly mixed with 30 % HCl (Suprapur, Merck) and 65 % HNO3 (Suprapur, Merck) in a volumetric ratio of
3:1, respectively. This process was repeated once. Then the samples were dissolved in 5-10 ml dest. Aqua.
The samples were thereafter diluted 1:10 for the ICP-MS analysis. The concentration of platinum in the
diluted aqua regia solution was analyzed by ICP-MS (NexION 300X, Perkin Elmer) through a Meinhard
quartz nebulizer and a cyclonic spray chamber, operating at nebulizer gas flow rates of between 1.00 and
1.02 L min-1 (Ar, purity grade 5.0).
SAXS analysis. Small-angle X-ray scattering (SAXS) profiles were measured using the SAXSLab instrument
at the Niels Bohr Institute. The instrument uses a Rigaku 40 W micro-focused Cu-source producing X-
rays with a wavelength of λ = 1.54 Å detected by a moveable Pilatus 300 k pixel-detector allowing
different q-ranges to be measured. Here the magnitude of the scattering vector is defined as q = 4π sinΘ
/ λ with Θ being half of the scattering angle. The q-calibration of the instrument was done using silver
behenate. The scattering data are analyzed using the following expression:
𝐼 (𝑞) = 𝐴𝑞−𝑛 + 𝐵 +𝐶
(1 + 𝑅2𝑞2)2

25
where A, B, C are constants. n is the Porod exponent of the power law describing surface scattering, B is
a small constant term accounting for the background scattering from the thin quartz plates the samples
are mounted on, and finally, the last term describes the scattering from the metal network with the main
fit parameter, the network radius R. The term originates from pore structure analysis42, but from Babinet's
principle the scattering signal is the same whether the pore is empty, or as in this case, filled.
XAS analysis. X-ray adsorption near edge structure (XANES) and extended X-ray absorption fine structure
(EXAFS) measurements were carried out at the B18 beamline, Diamond Light Source (DLS), Didcot
(England) and at the beamline SuperXAS X10DA, Swiss Light Source (Switzerland). The in situ XAS
experiments were performed at the ROCK beamline, SOLEIL Light Source (France). The Co edge XAS
spectra were recorded in fluorescence mode, while depending on the loading the Pt edge XAS spectra
were measured in transmission and fluorescence mode. A Si(111) double crystal monochromator was
used in combination with a Ge 36 element or 5-element detector for fluorescence measurements, while
for the transmission the ionization chambers with lengths of 15 and 30 cm were filled with N2. The
averaged XAS spectra were analyzed by using the IFEFFIT software package43. In principle, the raw spectra
were aligned, averaged, background corrected and normalized by the edge step. After conversion of the
energy units (eV) into photoelectron wave number k units (Å-1), the resulting χ(k) functions for XAS spectra
were weighted with k2 and then Fourier-transformed to obtain pseudo-radial structure functions (RSFs).
EXAFS spectra of the pure Pt and Co foils as references were used to estimate the amplitude reduction
factors (S02).
X-ray total scattering. X-ray total scattering data were obtained at beamline 11-ID-B at the Advanced
Photon Source (APS), Argonne National Laboratory. The data were collected from a sample dispersed on
Kapton foil, and the signal from the foil was subtracted before further treatment. The data were obtained
using an X-ray wavelength of 0.2112 Å, using the RA-PDF setup44. PDF analysis was done in PDFgetX345
and PDFgui46. The show that the Pt networks contain nanocrystalline Pt in the expected fcc structure

26
(Figure 6b). Due to the much higher X-ray scattering power of Pt compared to Co, as well as the lower
amount of Co present in the leached sample, Pt completely dominates the PDF. The refined unit cell
parameter is 3.85 Å, which is much lower than the 3.92 Å reported for bulk Pt. This agrees with the EXAFS
results, where short Pt-Pt distances were also observed. Considering the fit using the simple fcc Pt
structure in Figure 6b, the model describes the intense peaks in the low r-region well, while the smaller
features seen in the PDF from ca. 18 Å are not described by the model. However, if fitting the fcc structure
to the range from 18-40 Å, the structure fits these features very well, just with a lower refined unit cell
parameter of 3.83 Å. Further details on the PDF modelling is given in the supplementary information.
Acknowledgments
This work was supported by the Danish DFF through grant # 4184-00332 and the Villum center for the
science of sustainable fuels and chemicals (grant no. 9455). M.A. acknowledges funding from the Swiss
National Science Foundation (SNSF) via the project No. 200021_184742. G.W.S. and V.B.
acknowledge support by BMBF for funding the validation (VIP+) project 3DnanoMe. The authors would
like to acknowledge the collaboration with Prof. L. T. Kuhn and Dr. S. B. Simonsen concerning TEM
measurements, Andrea Mingers for ICP-MS measurements, Dr. Giannantonio Cibin, Stéphanie Belin and
Dr. Maarten Nachtegal for the technical support at the Quick EXAFS beam line, B18, Diamond Light Source
(DLS), Didcot (England), the ROCK beam line (proposal ID 20180795) of Synchrotron SOLEIL (France) and
the Super XAS beamline, X10DA, of the Swiss light source (SLS) of the Paul Scherrer Institute in Villigen
(Switzerland), respectively. The work at the ROCK beamline was supported by a public grant overseen by
the French National Research Agency (ANR) as part of the “Investissements d`Avenir” program (reference,
ANR10-EQPX45). A.D. and M.O. have received funding from the DFG (FOR2213, TP9) and the Federal
Ministry of Education and Research (BMBF, ECatPEMFC, FKZ 03SF0539).
References
27
1. Banham, D. W. H. & Ye, S. Current Status and Future Development of Catalyst Materials and Catalyst Layers for PEMFCs: An Industrial Perspective. ACS Energy Lett. 2, 629–638 (2017).
2. Chattot, R. et al. Surface distortion as a unifying concept and descriptor in oxygen reduction reaction electrocatalysis. Nat. Mater. 17, 827–833 (2018).
3. Stamenkovic, V. R. et al. Trends in electrocatalysis on extended and nanoscale Pt-bimetallic alloy surfaces. Nat. Mater. 6, 241–247 (2007).
4. Kongkanand, A. & Mathias, M. F. The Priority and Challenge of High-Power Performance of Low-Platinum Proton-Exchange Membrane Fuel Cells. J. Phys. Chem. Lett. 7, 1127–1137 (2016).
5. Chen, C. et al. Highly crystalline multimetallic nanoframes with three-dimensional electrocatalytic surfaces. Science 343, 1339–43 (2014).
6. Zhang, L. et al. Platinum-based nanocages with subnanometer-thick walls and well-defined, controllable facets. Science 349, 412–416 (2015).
7. Choi, S.-I. et al. Synthesis and Characterization of 9 nm Pt–Ni Octahedra with a Record High Activity of 3.3 A/mg Pt for the Oxygen Reduction Reaction. Nano Lett. 13, 3420–3425 (2013).
8. Velázquez-Palenzuela, A. et al. The enhanced activity of mass-selected PtxGd nanoparticles for oxygen electroreduction. J. Catal. 328, 297–307 (2015).
9. Debe, M. K. Electrocatalyst approaches and challenges for automotive fuel cells. Nature 486, 43–51 (2012).
10. Liu, W. et al. Noble metal aerogels-synthesis, characterization, and application as electrocatalysts. Acc. Chem. Res. 48, 154–162 (2015).
11. Stephens, I., Bondarenko, A., U, G., Rossmeisl, J. & Chorkendorff, I. Understanding the electrocatalysis of oxygen reduction on platinum and its alloys. Energy … 5, 6744–6762 (2012).
12. Escudero-Escribano, M., Jensen, K. D. & Jensen, A. W. Recent advances in bimetallic electrocatalysts for oxygen reduction: design principles, structure-function relations and active phase elucidation. Curr. Opin. Electrochem. 8, 135–146 (2018).
13. Zalitis, C. M., Kramer, D. & Kucernak, A. R. Electrocatalytic performance of fuel cell reactions at low catalyst loading and high mass transport. Phys. Chem. Chem. Phys. 15, 4329–40 (2013).
14. Inaba, M. et al. Benchmarking high surface area electrocatalysts in a gas diffusion electrode: measurement of oxygen reduction activities under realistic conditions. Energy Environ. Sci. 11, 988–994 (2018).
15. Costentin, C., Di Giovanni, C., Giraud, M., Savéant, J. M. & Tard, C. Nanodiffusion in electrocatalytic films. Nat. Mater. 16, 1016–1021 (2017).
16. Ott, S. et al. Ionomer distribution control in porous carbon-supported catalyst layers for high-power and low Pt-loaded proton exchange membrane fuel cells. Nat. Mater. (2019). doi:10.1038/s41563-019-0487-0
17. Orfanidi, A., Rheinländer, P. J., Schulte, N. & Gasteiger, H. A. Ink solvent dependence of the

28
ionomer distribution in the catalyst layer of a PEMFC. J. Electrochem. Soc. 165, F1254–F1263 (2018).
18. Jensen, A. W. et al. Self-supported nanostructured iridium-based networks as highly active electrocatalysts for oxygen evolution in acidic media. J. Mater. Chem. A 8, 1066–1071 (2020).
19. Sievers, G., Bowen, J. R., Brüser, V. & Arenz, M. Support-free nanostructured Pt–Cu electrocatalyst for the oxygen reduction reaction prepared by alternating magnetron sputtering. J. Power Sources 413, 432–440 (2019).
20. Gasteiger, H. A., Kocha, S. S., Sompalli, B. & Wagner, F. T. Activity benchmarks and requirements for Pt, Pt-alloy, and non-Pt oxygen reduction catalysts for PEMFCs. Appl. Catal. B Environ. 56, 9–35 (2005).
21. Nørskov, J. K. et al. Origin of the overpotential for oxygen reduction at a fuel-cell cathode. J. Phys. Chem. B 108, 17886–17892 (2004).
22. Stamenkovic, V. et al. Changing the activity of electrocatalysts for oxygen reduction by tuning the surface electronic structure. Angew. Chemie - Int. Ed. 45, 2897–2901 (2006).
23. Escudero-Escribano, M. et al. Tuning the activity of Pt alloy electrocatalysts by means of the lanthanide contraction. Science 352, 73–76 (2016).
24. Nesselberger, M. et al. The particle size effect on the oxygen reduction reaction activity of Pt catalysts: influence of electrolyte and relation to single crystal models. J. Am. Chem. Soc. 133, 17428–33 (2011).
25. Zana, A., Speder, J., Reeler, N. E. A., Vosch, T. & Arenz, M. Investigating the corrosion of high surface area carbons during start/stop fuel cell conditions: A Raman study. Electrochim. Acta 114, 455–461 (2013).
26. Zana, A. et al. Probing Degradation by IL-TEM: The Influence of Stress Test Conditions on the Degradation Mechanism. J. Electrochem. Soc. 160, F608–F615 (2013).
27. Wang, C. et al. Monodisperse Pt3Co nanoparticles as a catalyst for the oxygen reduction reaction: Size-dependent activity. J. Phys. Chem. C 113, 19365–19368 (2009).
28. Debe, M. K. Tutorial on the Fundamental Characteristics and Practical Properties of Nanostructured Thin Film (NSTF) Catalysts. J. Electrochem. Soc. 160, F522–F534 (2013).
29. Spanos, I., Kirkensgaard, J. J. K., Mortensen, K. & Arenz, M. Investigating the activity enhancement on PtxCo1−x alloys induced by a combined strain and ligand effect. J. Power Sources 245, 908–914 (2014).
30. Hernandez-Fernandez, P. et al. Mass-selected nanoparticles of PtxY as model catalysts for oxygen electroreduction. Nat. Chem. 6, 732 (2014).
31. Strasser, P. et al. Lattice-strain control of the activity in dealloyed core-shell fuel cell catalysts. Nat. Chem. 2, 454–460 (2010).
32. Li, M. et al. Ultrafine jagged platinum nanowires enable ultrahigh mass activity for the oxygen reduction reaction. Science 354, 1414 (2016).
29
33. Bu, L. et al. Surface engineering of hierarchical platinum-cobalt nanowires for efficient electrocatalysis. Nat. Commun. 7, 1–10 (2016).
34. Liu, W. et al. Bimetallic aerogels: High-performance electrocatalysts for the oxygen reduction reaction. Angew. Chemie - Int. Ed. 52, 9849–9852 (2013).
35. Huang, X. et al. High-performance transition metal – doped Pt3Ni octahedra for oxygen reduction reaction. Science 348, 1230–1234 (2015).
36. Chong, L. et al. Ultralow-loading platinum-cobalt fuel cell catalysts derived from imidazolate frameworks. Science 1281, 1276–1281 (2018).
37. Bu, L. et al. Biaxially strained PtPb/Pt core/shell nanoplate boosts oxygen reduction catalysis. Science 354, (2016).
38. Xu, S. et al. Extending the limits of Pt/C catalysts with passivation-gas-incorporated atomic layer deposition. Nat. Catal. 1, 624–630 (2018).
39. Sievers, G., Jensen, A. W., Brüser, V., Arenz, M. & Escudero-Escribano, M. Sputtered Platinum Thin-films for Oxygen Reduction in Gas Diffusion Electrodes: A Model System for Studies under Realistic Reaction Conditions. Surfaces 2, 336–348 (2019).
40. Suzuki, T. et al. Toward the Future Fuel Cell -Challenge for 2040. in 236th ECS Meeting (2019).
41. Mayrhofer, K. J. J., Ashton, S. J., Kreuzer, J. & Arenz, M. An electrochemical cell configuration incorporating an ion conducting membrane separator between reference and working electrode. Int. J. Electrochem. Sci. 4, 1–8 (2009).
42. Kalliat, M., Kwak, C. & Schmidt, P. in New approaches in coal chemistry (eds. Blaustein, D., Bockrathand, B. & Friedman, S.) 3–22 (American Chemical Society, 1981).
43. Newville, M. IFEFFIT: Interactive XAFS analysis and FEFF fitting. J. Synchrotron Radiat. 8, 322–324 (2001).
44. Chupas, P. J. et al. Rapid-acquisition pair distribution function (RA-PDF) analysis. J. Appl. Crystallogr. 36, 1342–1347 (2003).
45. Juhás, P., Farrow, C. L., Yang, X., Knox, K. R. & Billinge, S. J. L. Complex modeling: A strategy and software program for combining multiple information sources to solve ill posed structure and nanostructure inverse problems. Acta Crystallogr. Sect. A Found. Adv. 71, 562–568 (2015).
46. Farrow, C. L. et al. PDFfit2 and PDFgui: Computer programs for studying nanostructure in crystals. J. Phys. Condens. Matter 19, (2007).