selling the sewing machine around the world: … · 1 selling the sewing machine around the world:...
TRANSCRIPT
Selling the sewing machine around the world: Singer’s international marketing
strategies, 1850-1914
ABSTRACT
The sewing machine was the world’s first mass produced and mass marketed complex
consumer durable, diffusing more widely around the world than any other consumer good
before 1914. This global diffusion was almost the sole responsibility of one firm, Singer.
The company’s international marketing strategies are analyzed here. Despite its reputation
for marketing sophistication, Singer did not engage in price discrimination strategies,
extensive advertising campaigns, or pre-emptive investments in retail networks. Singer’s
remarkable success was more associated with the development of the world’s first global
brand. The characteristics of consumer demand for sewing machines meant that its
strategic investments in market support services associated with the Singer brand yielded a
disproportionate success in foreign markets.
Dr Andrew Godley,
Department of Economics, University of Reading,Reading, RG6 6AA UKTel.: ++44 (0) 118 987 5123 (x4051)Fax.: ++44 (0) 118 975 0236E-mail: [email protected]
Word Count: 9,990 (not including abstract but including all notes, tables and charts).
1
Selling the sewing machine around the world: Singer’s international marketing
strategies, 1850-1914
The sewing machine was the world’s first mass produced and mass marketed
complex consumer good. Its economic and social significance comes, however, not just
from being first but also from the sheer ubiquity of sewing machines around the world
before 1914. This global spread was quite remarkable. The sewing machine diffused
entirely through advanced economies, with their relatively high per capita incomes, such as
the United States, Canada, Australia, and New Zealand, as well as industrialized western
Europe. More impressive though is how the sewing machine met with unabated popularity
in nations on the less developed periphery of this industrial and advanced core. By 1914
demand in Russia, Italy, Spain, and Portugal, for instance, had led to more than one-in-five
households purchasing machines there. More surprising still is the extent of diffusion in
undeveloped economies, where around 15 percent of households in countries as poor and
diverse as Greece, Turkey, South Africa, and the Philippines had purchased machines
before the end of the first world war.1 Remarkably, one company and one alone was
almost entirely responsible for the spread of machine stitching to these millions and
millions of families around the world, the Singer Manufacturing Company.2
Singer was the seventh largest firm in the world in 1912 by capitalization and is
prominent in the general histories of the emergence of the modern corporation having
become a byword for both global market dominance and a fully integrated operation.3 One
feature that marks Singer’s experience as atypical, however, is the firm’s extraordinary
commitment to international marketing. It began in the 1850s as a manufacturing firm, but
2
the balance of employment in Singer began to change from the 1880s as its global retail
network grew. In contrast to all other emerging giant manufacturers of this era, Singer’s
resources were focused on sales not production. By 1905 Singer employed twice as many
in its marketing compared to production operations.4
The traditional interpretation by economists of such a redeployment of scarce
capital by a manufacturer into marketing emphasizes attempts by firms to capture market
share and, ultimately, secure streams of supernormal profits from an monopolistic market
structure. In a world of perfect information, advertising spend is best interpreted as
anticompetitive, of course.5 Singer, indeed, dominated world markets; but whether this
was linked to the company’s “aggressive marketing” strategies that drove out competitors
is, frankly, unknown.6
Weight of empirical evidence suggests that marketing was certainly important to
late nineteenth century business, and business historians do give the market-making
function more emphasis than economists in their account of the firm. Nonetheless, the
conventional business history account of the emergence of modern business relegates the
marketing function to subservience.7 The basis of Tedlow’s account of the emergence of
mass marketing in the United States, for example, is that mass production technologies
generated the possibilities of low-margin-high-volume strategies. This gave manufacturers
a strong incentive to better control distribution. This view of the emergence of mass
marketing and advertising remains the dominant paradigm. 8 The development of modern
mass marketing was, according to Tedlow and others, dependent on the creation of scale
economies in mass production.9
3
The causality of this relationship is, however, neither universal nor proven. The
existence of considerable selection bias in Chandler’s work has been highlighted recently
by Kim. Neither Chandler nor Tedlow nor indeed any of their followers have sought to
compile representative populations of firms. Kim, by contrast, begins with Census of
Manufacturing data, hitherto unused by historians, and concludes that it was the existence
of economies in marketing, and not in manufacturing, that were the primary determinants
of firm size in the United States before 1950.10
Recent research by British business historians also appears to suggest that
marketing investments were more important than hitherto understood. Building on earlier
pleas for more systematic research in marketing history, Church’s recent reinterpretation
of the long Victorian boom credits much of British industrial development to the outcome
of marketing investments by provincial branded consumer goods manufacturers attempting
to dislodge dominant London merchants.11
For producers the importance of marketing is wholly proportionate to the
importance of brands. Without a brand the incentive to develop the marketing function is
absent. For most unbranded commodities, for instance, the market-making function is
almost wholly subcontracted out to specialized intermediaries. The presence of a brand
transforms the set of incentives facing producers, however, and does so fundamentally
because of the extraordinary difficulty in pricing the value of a brand with any efficiency
whatsoever.
Brands represent a complex bundling of dedicated market support services (such
as advertising, demonstration and after-sales service) with the actual product consumed.
The relative importance of each of these to building a brand varies according to the kind
4
of consumer good.12 Marketing theorists differentiate between search goods, such as
foodstuffs, and experience goods, such as appliances. The distinction is built on the
recognition that the costs to the consumer to sample a product vary according to the kind
of good it is. For search goods, the essential market support service provided by the
producer is advertising. For experience goods, producers need to provide additional
services, such as demonstration and after sales services, in order to minimize consumer
search and sampling costs. Together the market support services and the actual product
yield a complex and intangible set of product attributes. When marketing is successful it
adds enormous value to the, by comparison, relatively straightforward manufacturing
function.13 It is, however, the uncertainty associated with the commercialization of market
support services with a brand that gives producers a strong incentive to retain the
marketing function. Only when the advantages of a producer’s specialist knowledge of
their product are outweighed by the specialist skills of market-makers would they be
better off subcontracting the marketing function.
Most international trade before 1914 was carried out through just such a network
of subcontracted relations between producers and market-makers. The emergence of
branded consumer goods from the mid-nineteenth century onwards, however, with their
ever more complex product attributes, increasingly led to producers investing scarce
capital in non-core distribution activities. Britain, for example, saw a host of marketing
and retailing inward direct investments by foreign consumer goods producers, or “hybrid-
multinationals”, retaining manufacturing facilties in their home market, yet pursuing
extensive marketing and retailing investments in key foreign markets.14 Given the absence
of necessary expertise among indigenous advertising agencies and retail chains, the
5
institutional structure in the late nineteenth century even in advanced economies compelled
consumer goods manufacturers to trade-off costly investments in marketing against losing
sales.15 For manufacturers in these sectors, the returns from marketing investments
exceeded any further economies in manufacturing expansion.16
Recent business history research highlights therefore the possibility of reversing the
conventional causality of late nineteenth century growth in firm size. The emergence of the
modern corporation, with its multi-plant manufacturing capability and extensive vertical
integration, may have been dependent more on the creation of international product
markets than mass production technology. In particular, it may have been the case for
producers of branded consumer goods that it was mass marketing which led to increasing
manufacturing capacity rather than the other way round.
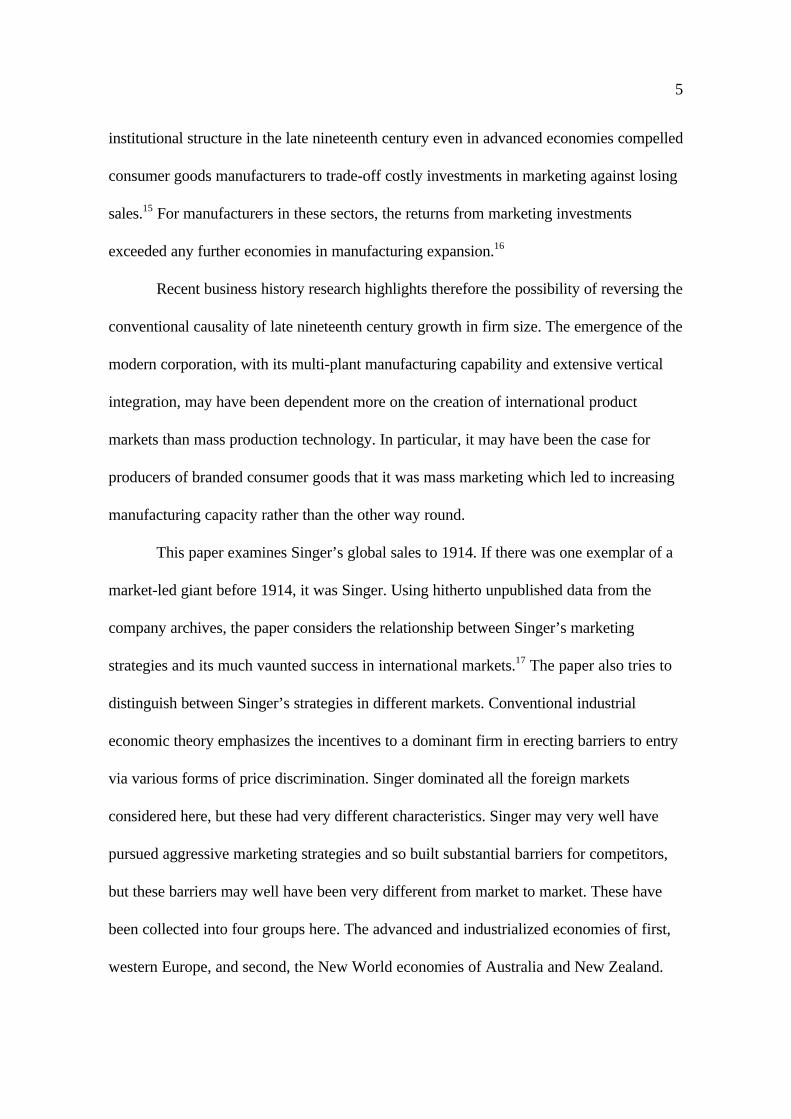
This paper examines Singer’s global sales to 1914. If there was one exemplar of a
market-led giant before 1914, it was Singer. Using hitherto unpublished data from the
company archives, the paper considers the relationship between Singer’s marketing
strategies and its much vaunted success in international markets.17 The paper also tries to
distinguish between Singer’s strategies in different markets. Conventional industrial
economic theory emphasizes the incentives to a dominant firm in erecting barriers to entry
via various forms of price discrimination. Singer dominated all the foreign markets
considered here, but these had very different characteristics. Singer may very well have
pursued aggressive marketing strategies and so built substantial barriers for competitors,
but these barriers may well have been very different from market to market. These have
been collected into four groups here. The advanced and industrialized economies of first,
western Europe, and second, the New World economies of Australia and New Zealand.
6
Then, third, the much less industrialized economies on Europe’s periphery, and, finally, the
undeveloped and non-industrialized economies in Africa, the Near East and Asia.
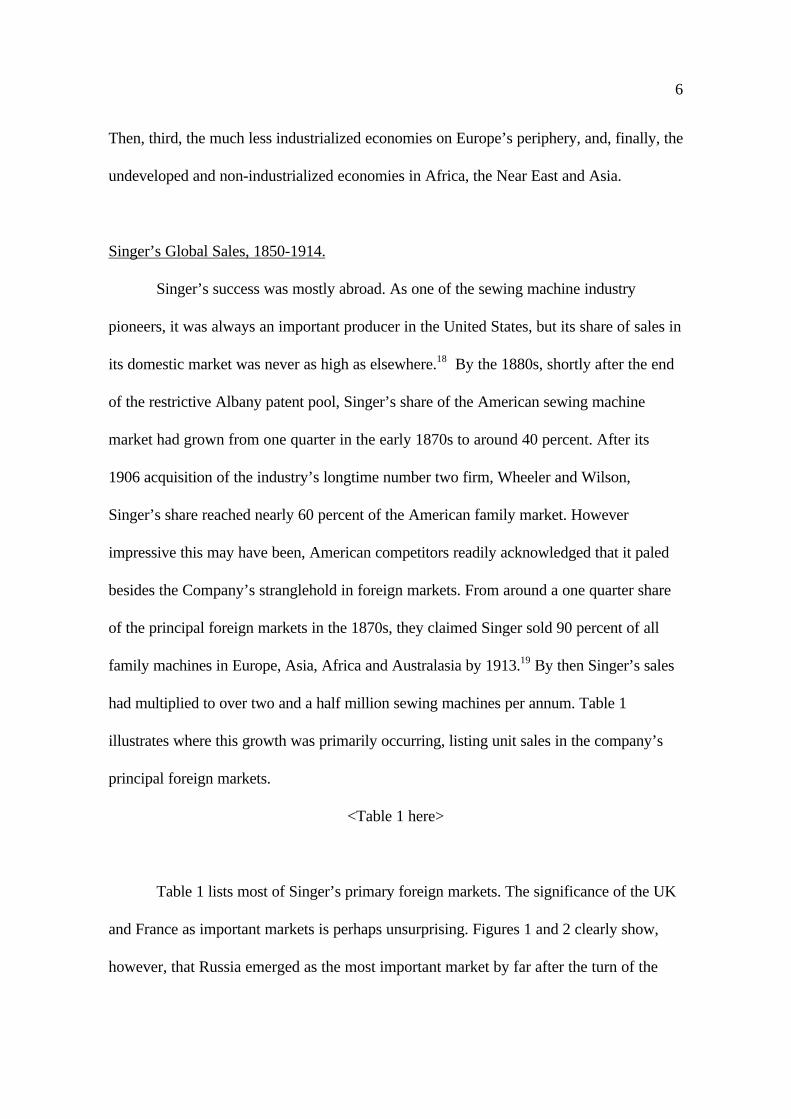
Singer’s Global Sales, 1850-1914.
Singer’s success was mostly abroad. As one of the sewing machine industry
pioneers, it was always an important producer in the United States, but its share of sales in
its domestic market was never as high as elsewhere.18 By the 1880s, shortly after the end
of the restrictive Albany patent pool, Singer’s share of the American sewing machine
market had grown from one quarter in the early 1870s to around 40 percent. After its
1906 acquisition of the industry’s longtime number two firm, Wheeler and Wilson,
Singer’s share reached nearly 60 percent of the American family market. However
impressive this may have been, American competitors readily acknowledged that it paled
besides the Company’s stranglehold in foreign markets. From around a one quarter share
of the principal foreign markets in the 1870s, they claimed Singer sold 90 percent of all
family machines in Europe, Asia, Africa and Australasia by 1913.19 By then Singer’s sales
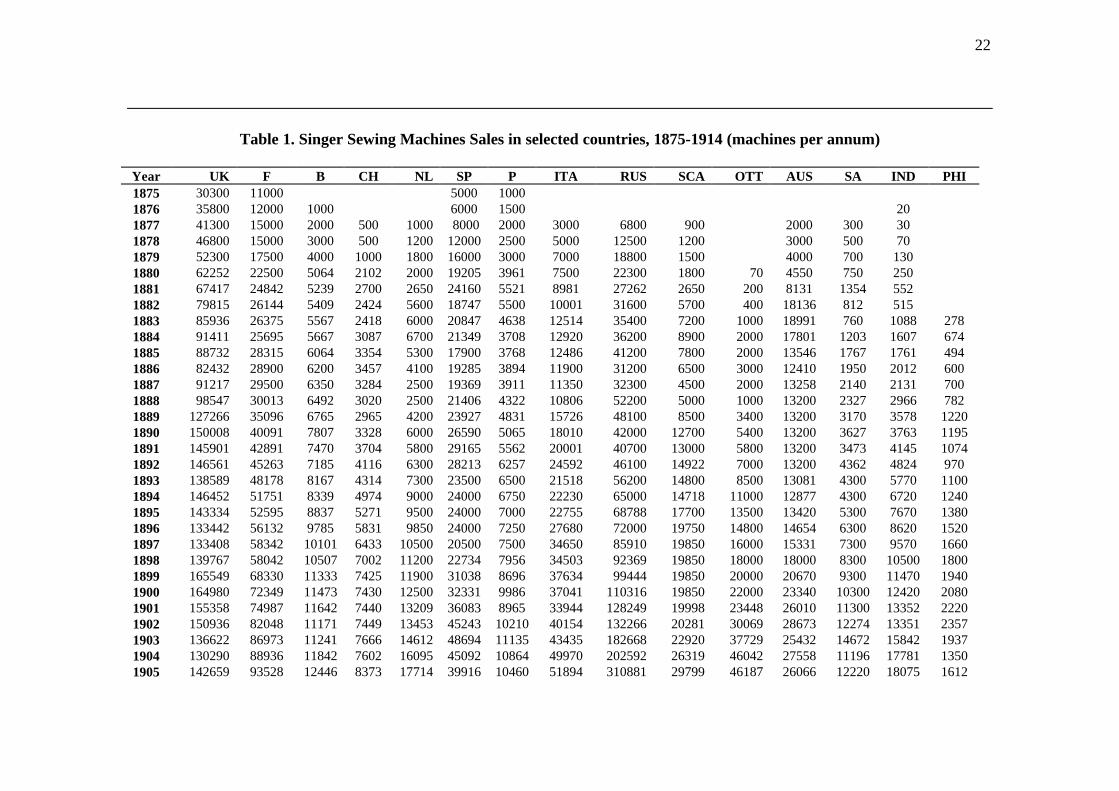
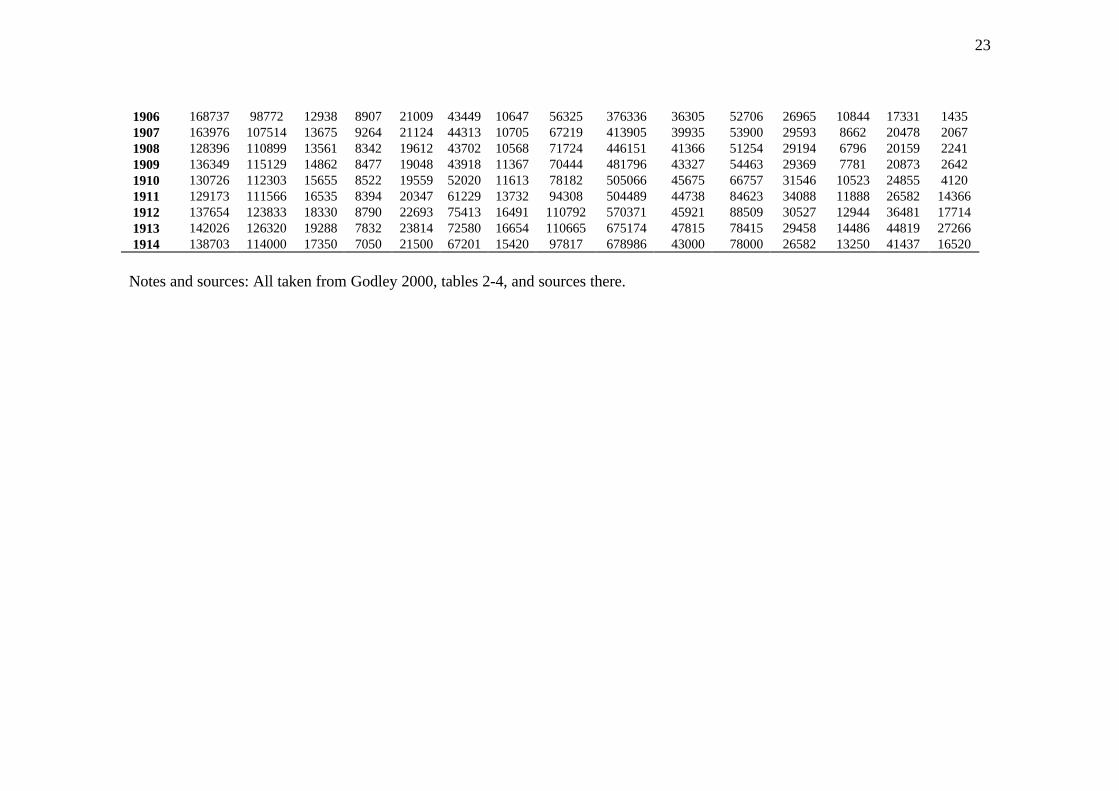
had multiplied to over two and a half million sewing machines per annum. Table 1
illustrates where this growth was primarily occurring, listing unit sales in the company’s
principal foreign markets.
<Table 1 here>
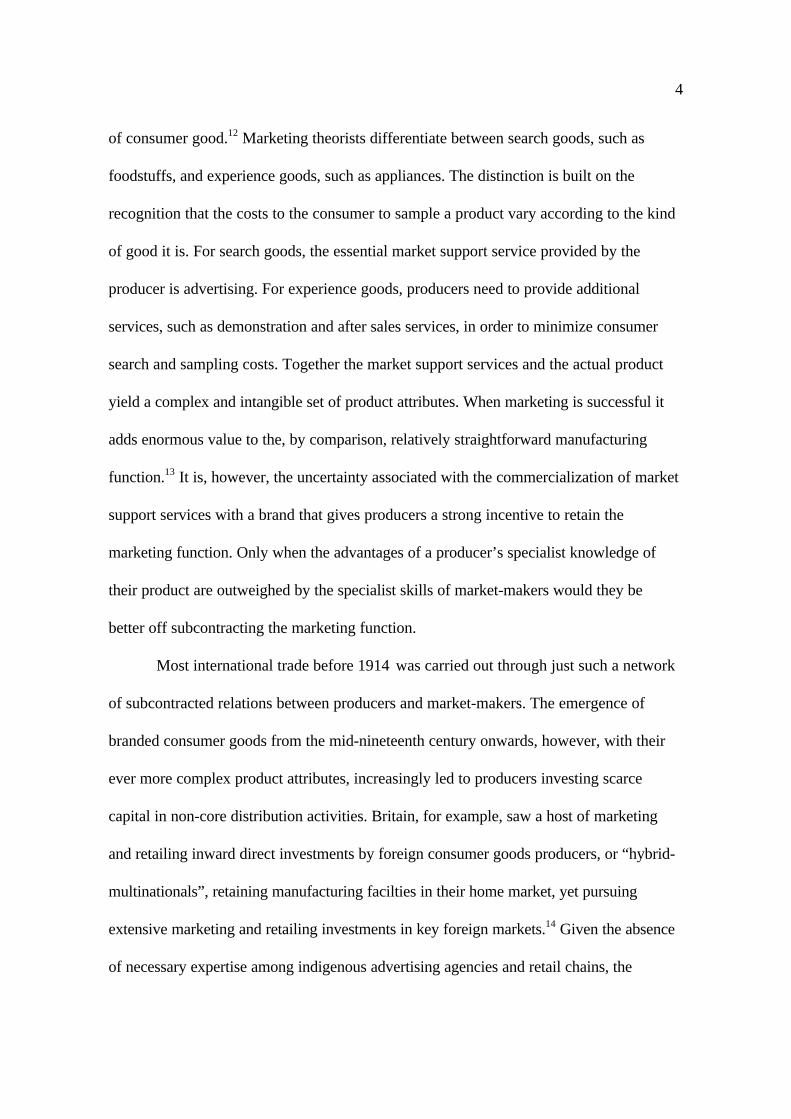
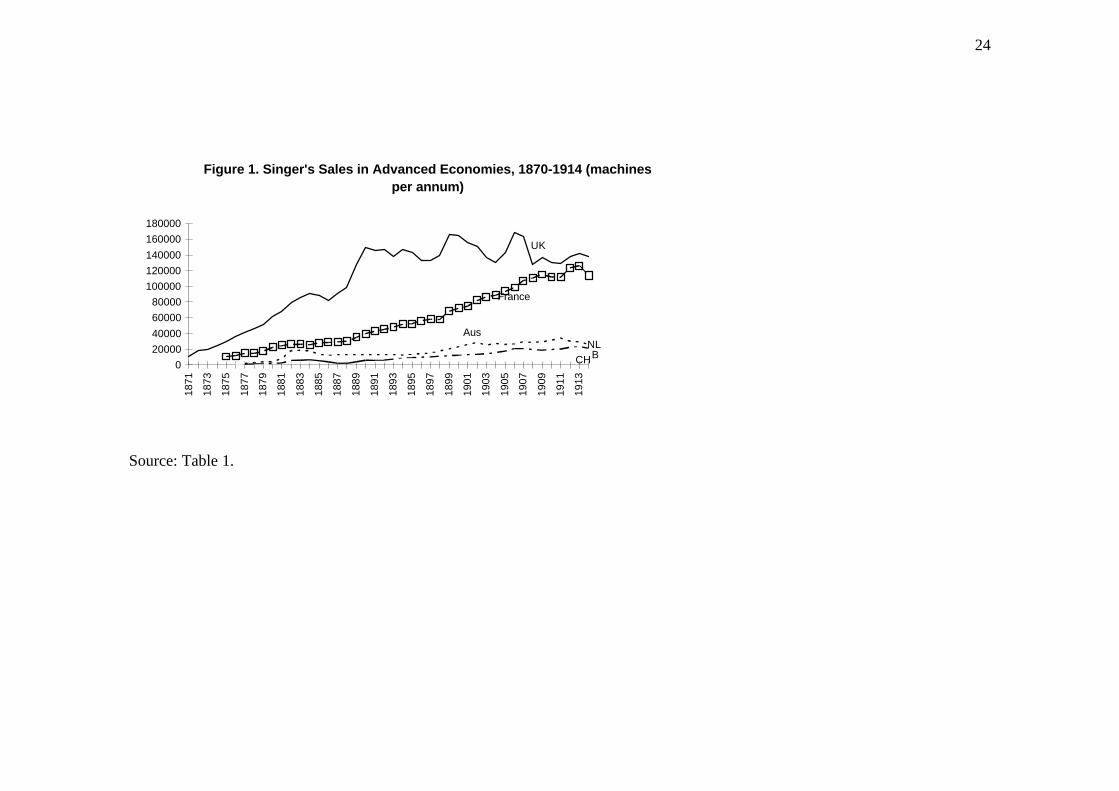
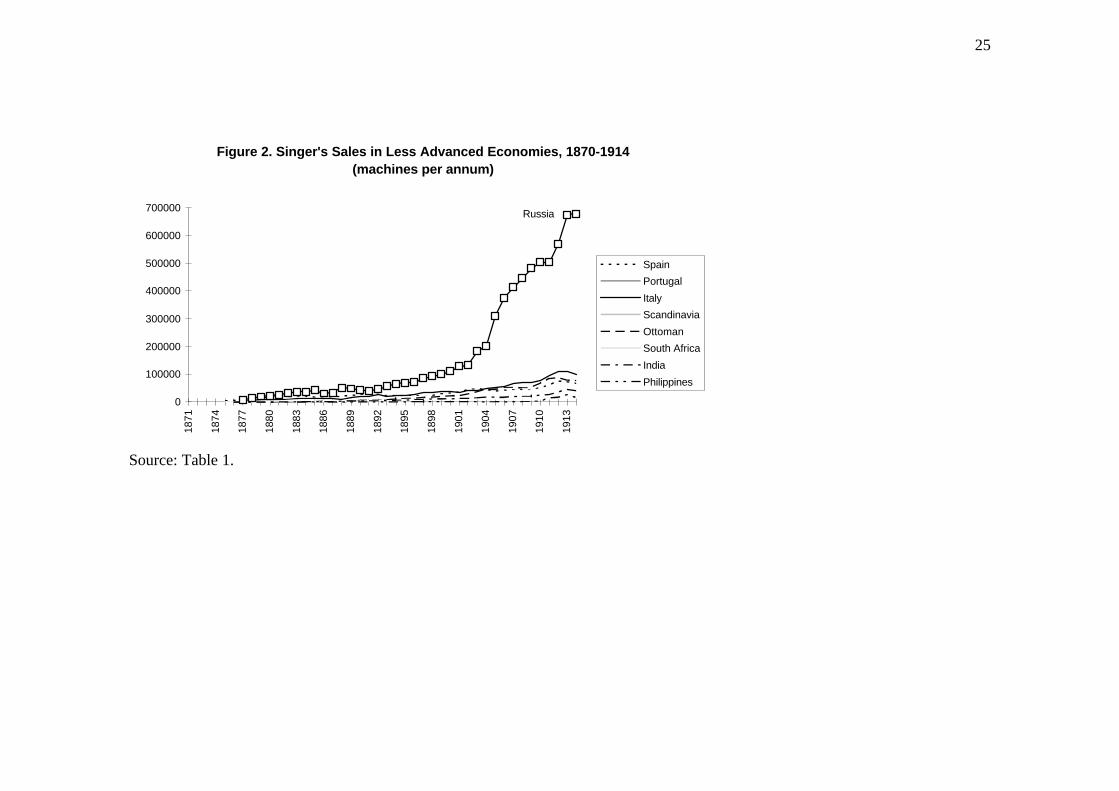
Table 1 lists most of Singer’s primary foreign markets. The significance of the UK
and France as important markets is perhaps unsurprising. Figures 1 and 2 clearly show,
however, that Russia emerged as the most important market by far after the turn of the
7
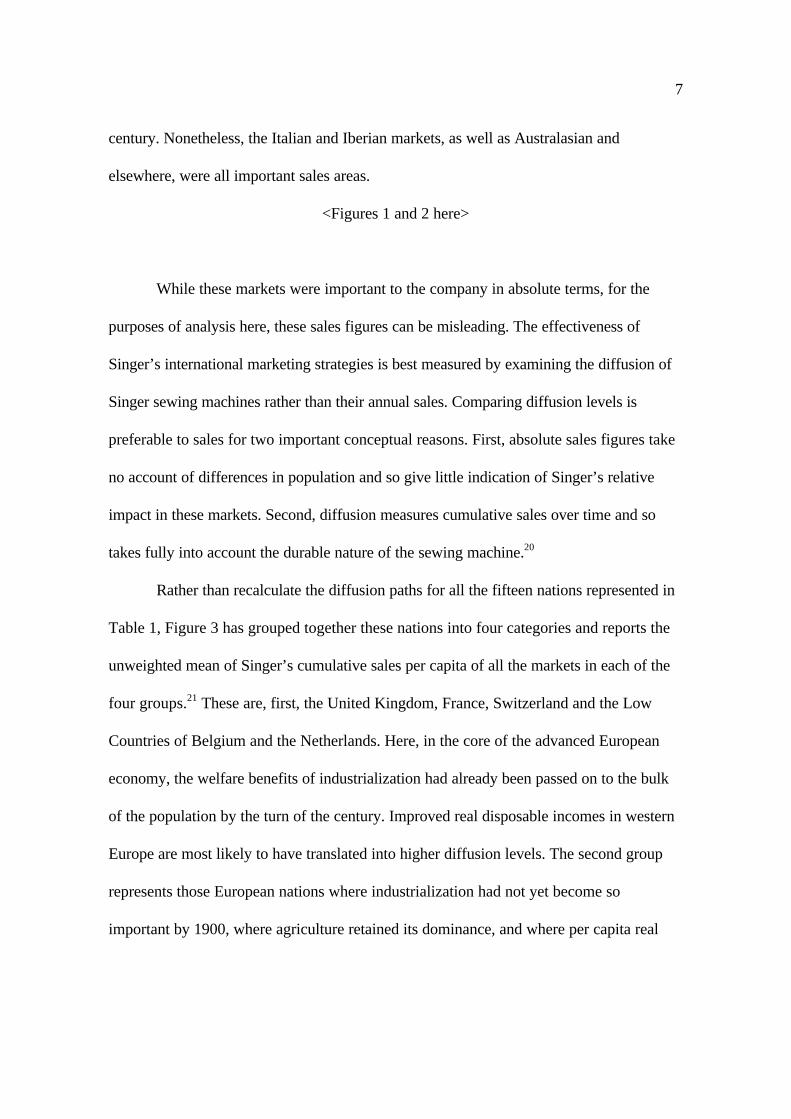
century. Nonetheless, the Italian and Iberian markets, as well as Australasian and
elsewhere, were all important sales areas.
<Figures 1 and 2 here>
While these markets were important to the company in absolute terms, for the
purposes of analysis here, these sales figures can be misleading. The effectiveness of
Singer’s international marketing strategies is best measured by examining the diffusion of
Singer sewing machines rather than their annual sales. Comparing diffusion levels is
preferable to sales for two important conceptual reasons. First, absolute sales figures take
no account of differences in population and so give little indication of Singer’s relative
impact in these markets. Second, diffusion measures cumulative sales over time and so
takes fully into account the durable nature of the sewing machine.20
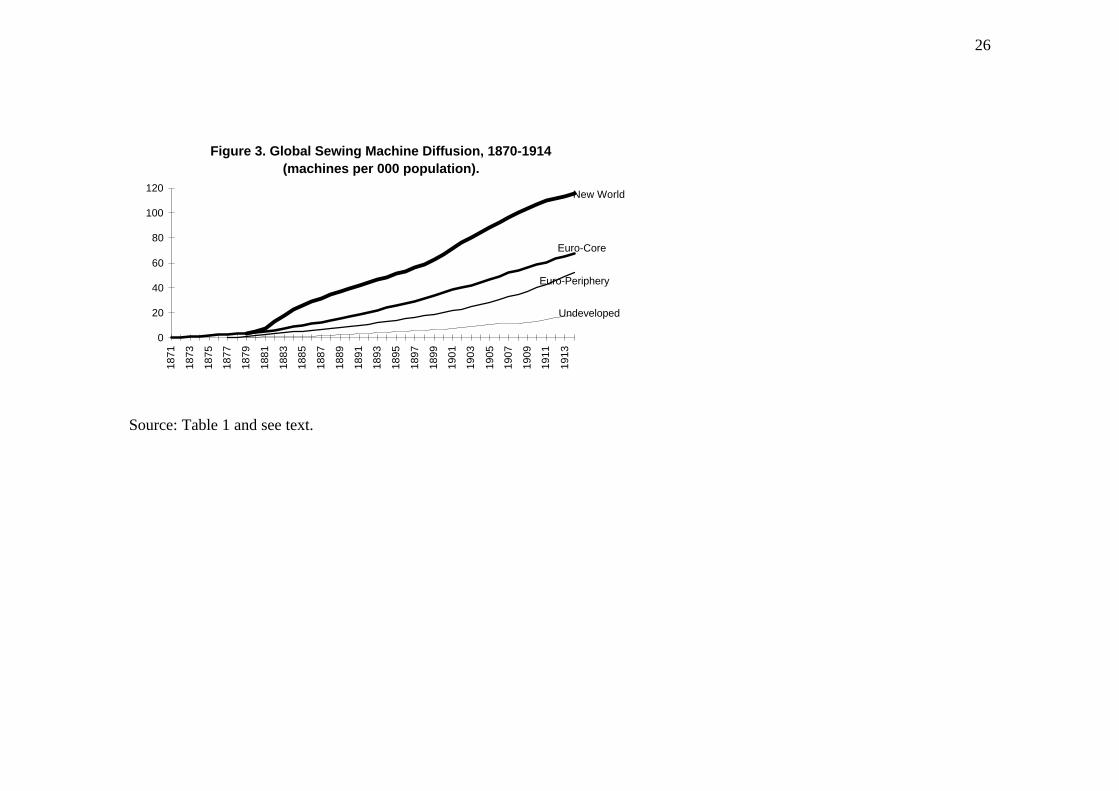
Rather than recalculate the diffusion paths for all the fifteen nations represented in
Table 1, Figure 3 has grouped together these nations into four categories and reports the
unweighted mean of Singer’s cumulative sales per capita of all the markets in each of the
four groups.21 These are, first, the United Kingdom, France, Switzerland and the Low
Countries of Belgium and the Netherlands. Here, in the core of the advanced European
economy, the welfare benefits of industrialization had already been passed on to the bulk
of the population by the turn of the century. Improved real disposable incomes in western
Europe are most likely to have translated into higher diffusion levels. The second group
represents those European nations where industrialization had not yet become so
important by 1900, where agriculture retained its dominance, and where per capita real
8
incomes were substantially below the European core. This group includes Russia, Italy,
Spain and Portugal and the Scandinavian countries.
The third group includes nations where industrialization by 1900 was practically
non-existent, where subsistence economies still dominated and where per capita incomes
were correspondingly low. This includes the Ottoman Empire, India and the Philippines as
well as South Africa. Finally, the New World economies of Australia and New Zealand,
where abundant factors and high per capita incomes were characteristic, are grouped
together. As with any classification system, there are some inconsistencies. To take the
two most obvious examples, living standards on the British mainland were higher than in
the rest of the European core by some margin, and South Africa combined the economic
opportunities of a New World nation with the characteristics of an undeveloped one
among the majority of its population. Exceptional cases notwithstanding, Figure 3
demonstrates that the diffusion paths of these groups differed significantly.
<Figure 3 here>
Figure 3 shows the diffusion of Singer sewing machines throughout these different
areas of the world. Diffusion in Australia and New Zealand was much higher than
anywhere else. By 1884 2 percent, by 1890 4 percent, and by 1914 12 percent of the
Australasian population had a sewing machine, the equivalent of around 60 percent of
households. Diffusion levels were much lower among the European core. In 1892 2
percent, 1902 4 percent and by 1914 almost 7 percent of the population here had
machines, roughly the equivalent of 35 percent of households. In the European periphery,
diffusion began later but was much faster than in the core. In 1890 less than 1 percent of
9
the population here had a machine. In 1900 this had increased to only 2 percent, but by
1914 diffusion in the periphery had reached over 5 percent of the population. There is little
information on mean household size for these countries, but where information is available
it suggests that mean household size was a little higher on the periphery than in the
European core. This therefore translates into a household diffusion which approached 30
percent in the European periphery by 1914.22
The undeveloped nations experienced much lower diffusion levels throughout. In
1890 only 0.3 percent of the population here had sewing machines, in 1900 only 0.7
percent. But diffusion was gathering pace here too. Sales data for the Philippines and India
suggests that by 1918 over 2 percent and 0.2 percent of their respective populations had
sewing machines by that time, corresponding to well over 10 percent and 1 percent of
households. South African and Ottoman diffusion was considerably higher.23
The speedy post-1905 diffusion on the European periphery and the beginnings of
rapid adoption in the undeveloped economies after 1910 is particularly intriguing. While
per capita incomes were rising in some of these nations, they were certainly not increasing
as quickly as sewing machine consumption.24 The pertinent question to ask then is whether
this rapid adoption of Singer sewing machines in these less developed economies was in
response to the company’s marketing strategies. The profits from the company’s
successful sales organizations in western Europe may well have been reinvested in
marketing the machine in southern and eastern Europe and beyond and so driving out
competitors. Alas, the fragmentary nature of the surviving records in the Singer archives
means that it is impossible to rediscover exactly how senior managers chose to develop
Singer’s global marketing strategies. This paper, however, analyzes the company’s internal
10
management accounts to reconstruct the finances of Singer’s international retail
organization. This data has only been released by the company to the archive center in
recent years and remains largely unprocessed.25 Nevertheless, through reconstructing the
series of annual sales revenues, costs and surpluses from each of its principal foreign
markets, the outlines of Singer’s global marketing strategies can be discerned.
Singer’s Global Marketing Strategies.
All the leading American producers began selling sewing machines abroad as
exports took up the slack during the Civil War. Postwar dollar appreciation threatened
sales in these nascent markets and Singer alone developed a low cost manufacturing base
with its Scottish factories.26 This gave Singer a strong advantage relative to its US rivals in
these markets as foreign sales began to increase in the 1870s. The marketing strategies
developed by Singer in these foreign markets combined developments already tried and
tested in its domestic US environment, such as installment purchasing and distributing
through company controlled agencies, along with new innovations developed by the
foreign sales organizations, the most important being the canvasser/collector direct selling
system developed in Britain. 27
While each of these innovations may have been particularly important, it is less
clear exactly how they influenced either sales or profits. Despite culminating in a
remarkably sophisticated global direct sales force, these investments were inordinately
expensive. Singer’s distribution costs were much higher than competitors and its retail
chain was far more expensive than any equivalent chain store operation in other retail
trades, groceries or foodstuffs for example.28 Unsurprisingly, with such high overheads
11
Singer was never a price leader, its strategy remained always to target the upper end of the
price spectrum.29 What is surprising, however, given this price premium for what was after
all a standardized product, is how Singer was able to increase its market share to such
extraordinary levels.
These high prices and market share would be entirely consistent with the early
establishment of comprehensive sales platforms and subsequent monopolization of
distribution channels. Investment in marketing may not simply have been associated with
erecting barriers to entry, however. The following section goes on to examine how Singer
developed its brand, in particular through focusing on the importance of the market
support services distributed through the company’s global retail network. The rest of this
section, however, first considers whether Singer pursued price discrimination strategies or
pre-emptive investments in either advertising or retail networks.
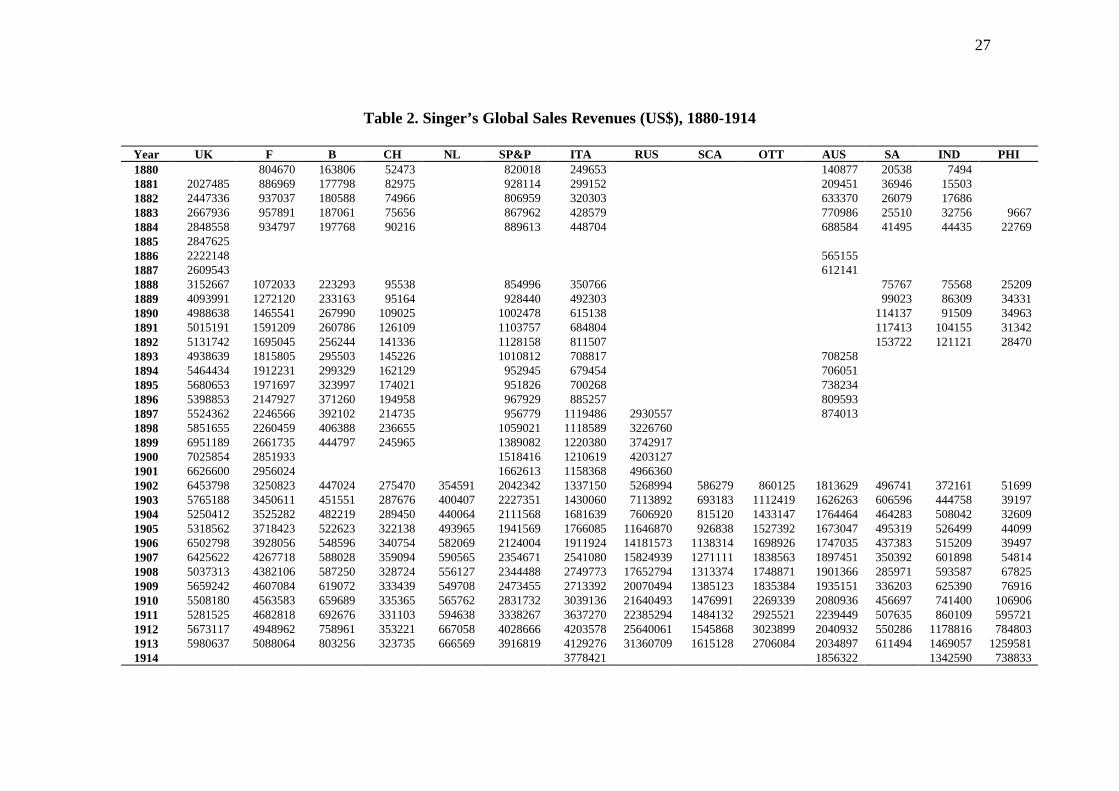
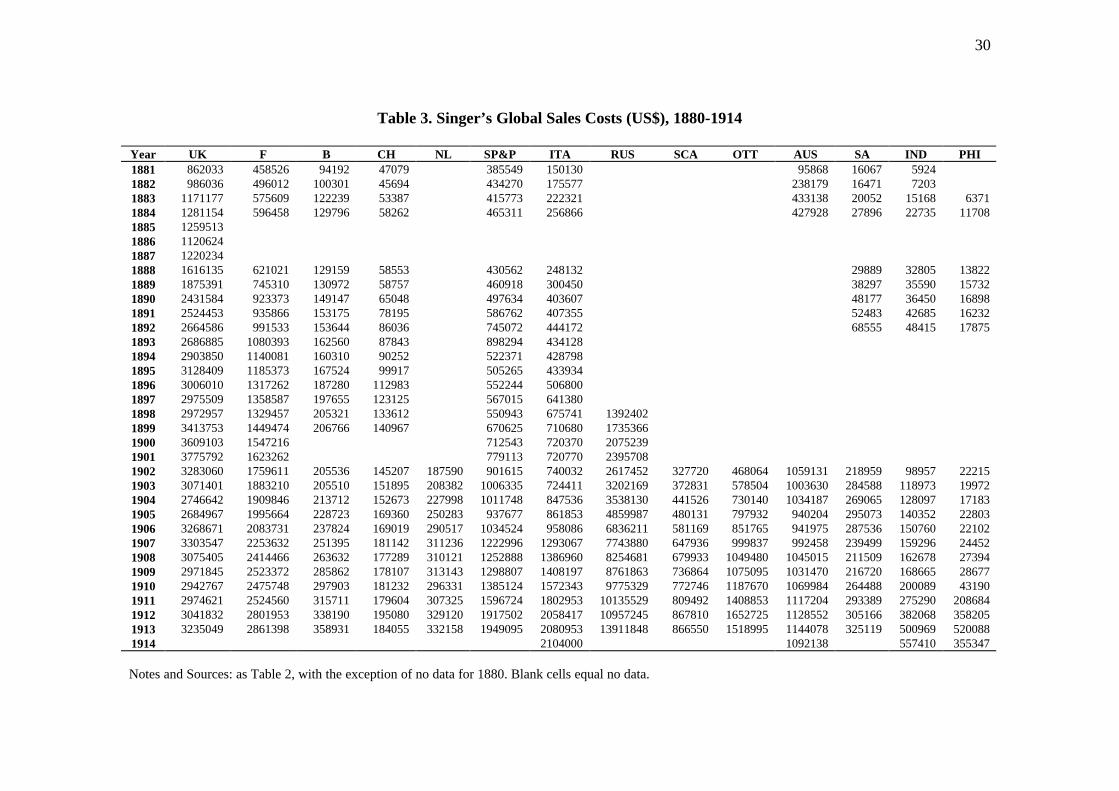
<Tables 2 and 3 here>
The company’s archives do not contain any systematic documentation of its
international pricing strategies. Apart from sporadic references in management letters to
pricing issues, data can only come from the financial recaords summarized in Tables 2 and
3. These list the company’s annual sales revenues and sales costs in each of the 14 markets
included here.
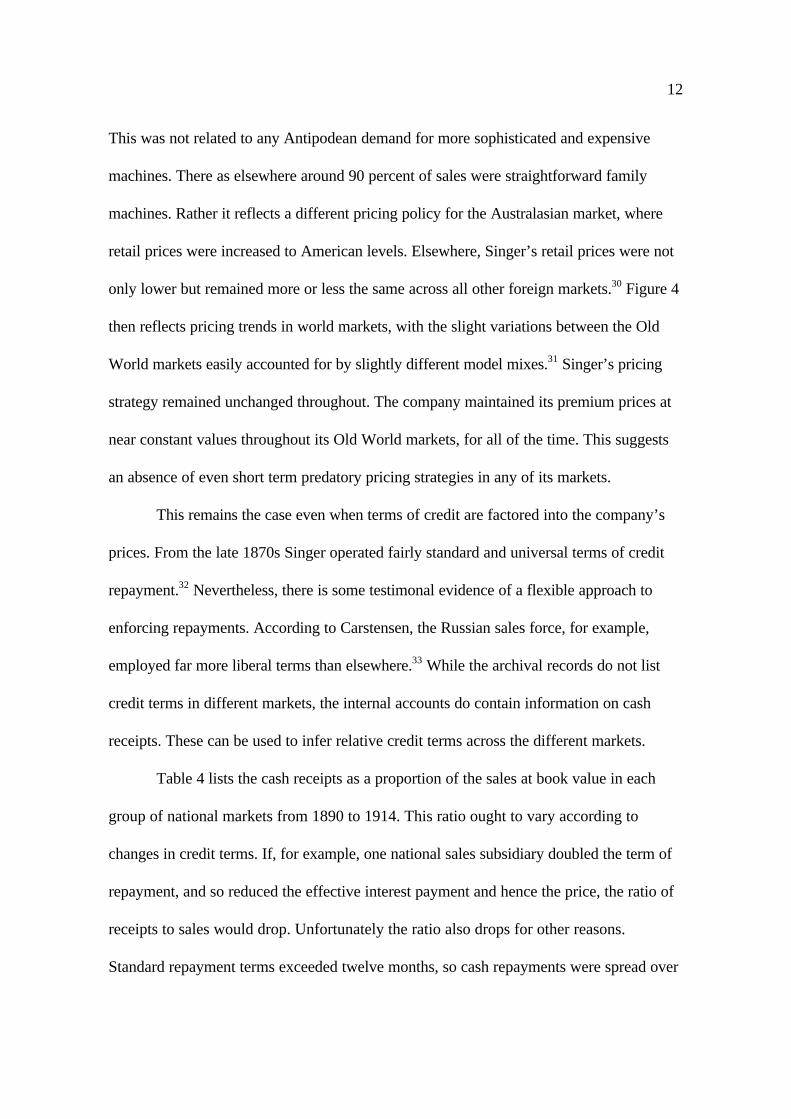
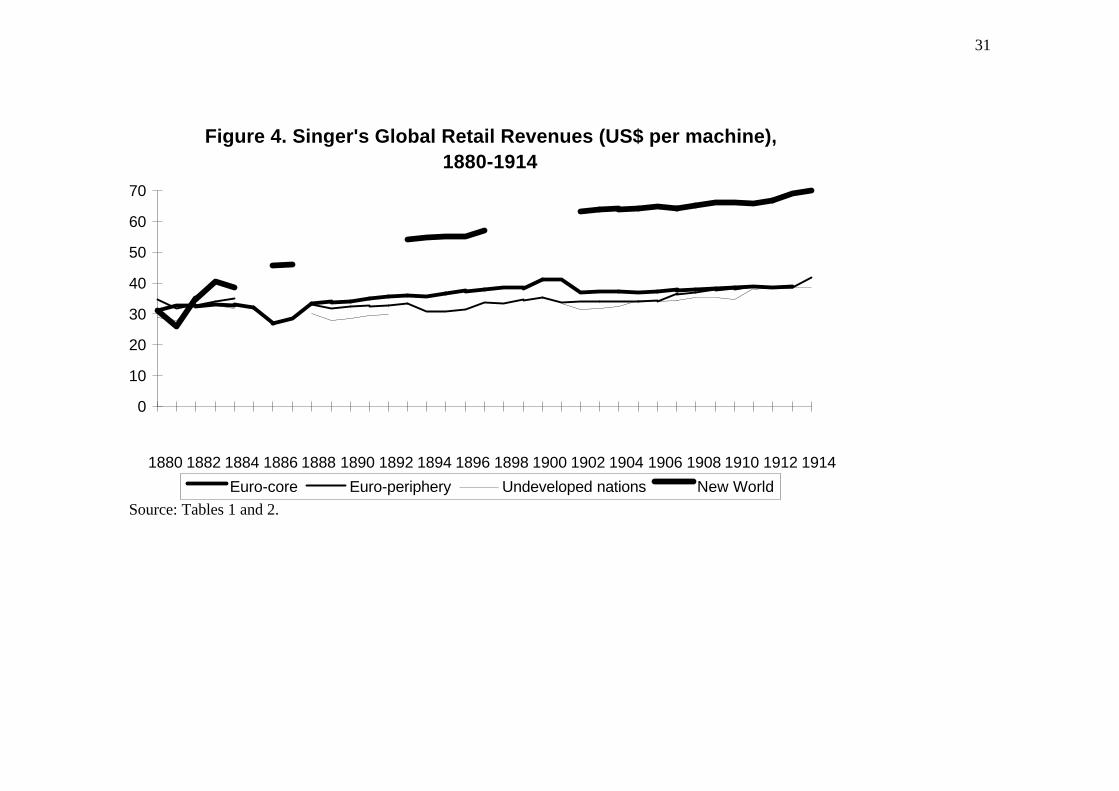
<Figure 4 here>
Figure 4 shows that unit revenues varied quite considerably only between Old and
New World markets. Australasian revenue per machine was much higher than elsewhere.
12
This was not related to any Antipodean demand for more sophisticated and expensive
machines. There as elsewhere around 90 percent of sales were straightforward family
machines. Rather it reflects a different pricing policy for the Australasian market, where
retail prices were increased to American levels. Elsewhere, Singer’s retail prices were not
only lower but remained more or less the same across all other foreign markets.30 Figure 4
then reflects pricing trends in world markets, with the slight variations between the Old
World markets easily accounted for by slightly different model mixes.31 Singer’s pricing
strategy remained unchanged throughout. The company maintained its premium prices at
near constant values throughout its Old World markets, for all of the time. This suggests
an absence of even short term predatory pricing strategies in any of its markets.
This remains the case even when terms of credit are factored into the company’s
prices. From the late 1870s Singer operated fairly standard and universal terms of credit
repayment.32 Nevertheless, there is some testimonal evidence of a flexible approach to
enforcing repayments. According to Carstensen, the Russian sales force, for example,
employed far more liberal terms than elsewhere.33 While the archival records do not list
credit terms in different markets, the internal accounts do contain information on cash
receipts. These can be used to infer relative credit terms across the different markets.
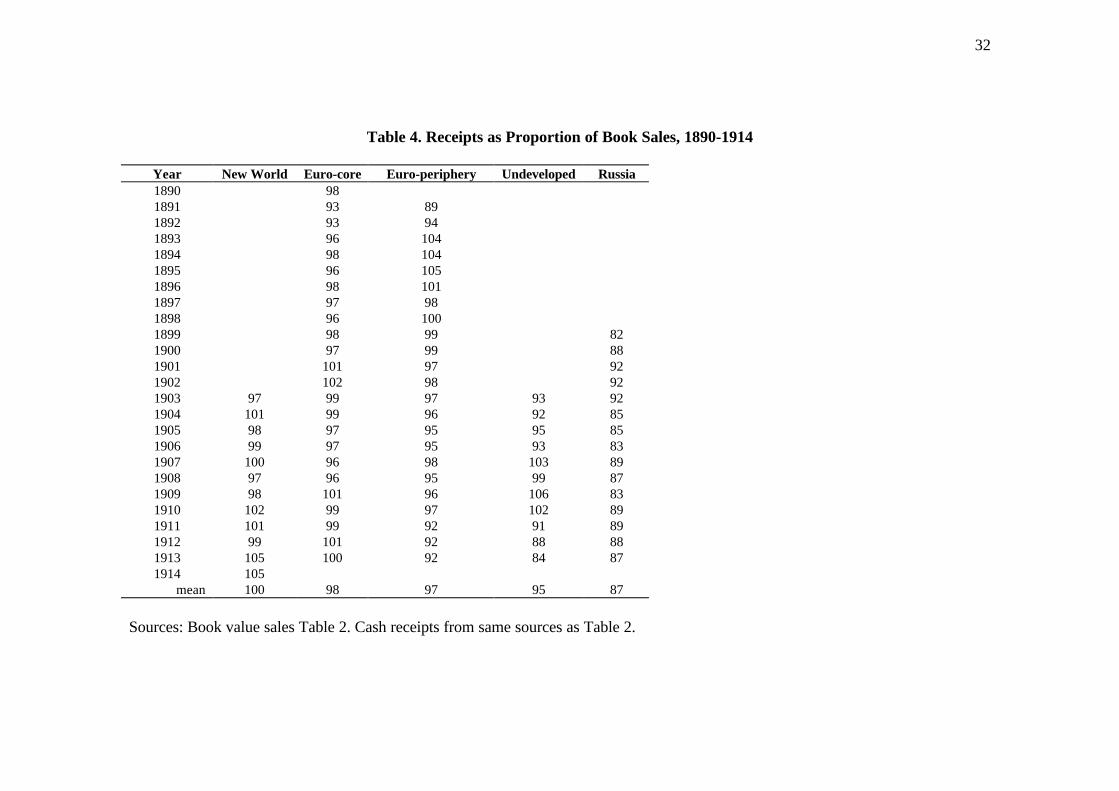
Table 4 lists the cash receipts as a proportion of the sales at book value in each
group of national markets from 1890 to 1914. This ratio ought to vary according to
changes in credit terms. If, for example, one national sales subsidiary doubled the term of
repayment, and so reduced the effective interest payment and hence the price, the ratio of
receipts to sales would drop. Unfortunately the ratio also drops for other reasons.
Standard repayment terms exceeded twelve months, so cash repayments were spread over
13
successive calendar years, whereas machine sales were recorded in the year of delivery.
Comparing cash receipts with machine sales for the same calendar years across markets
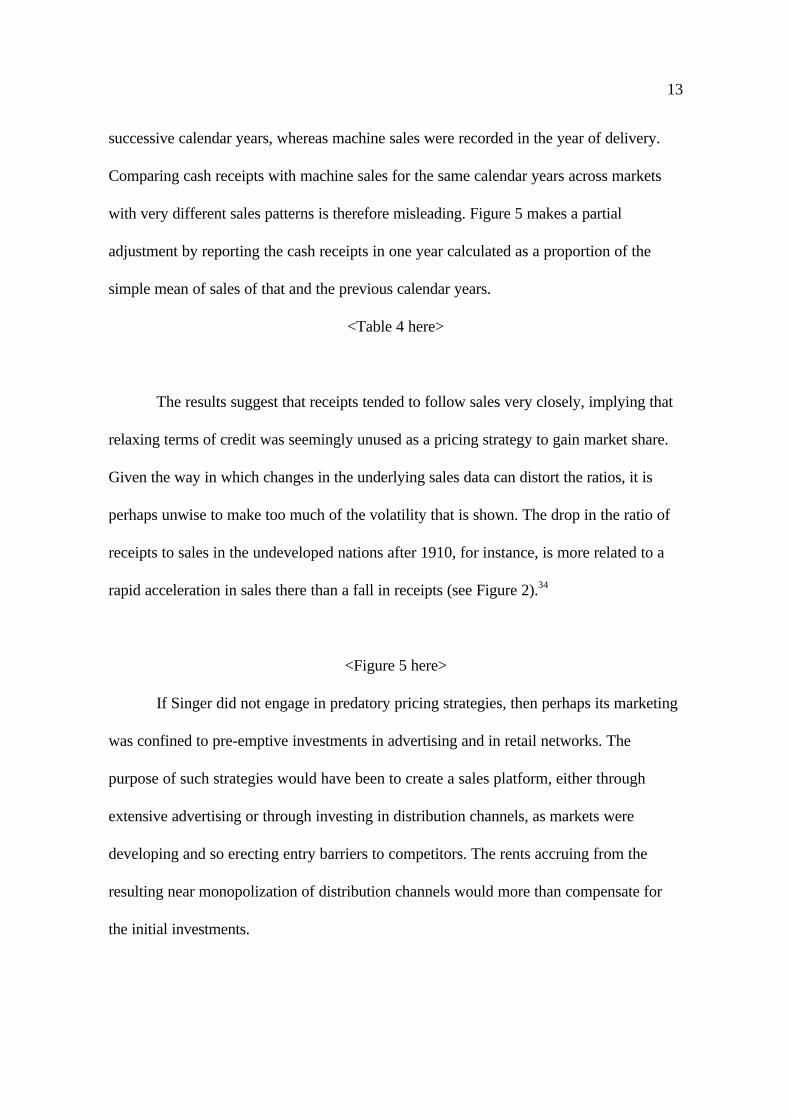
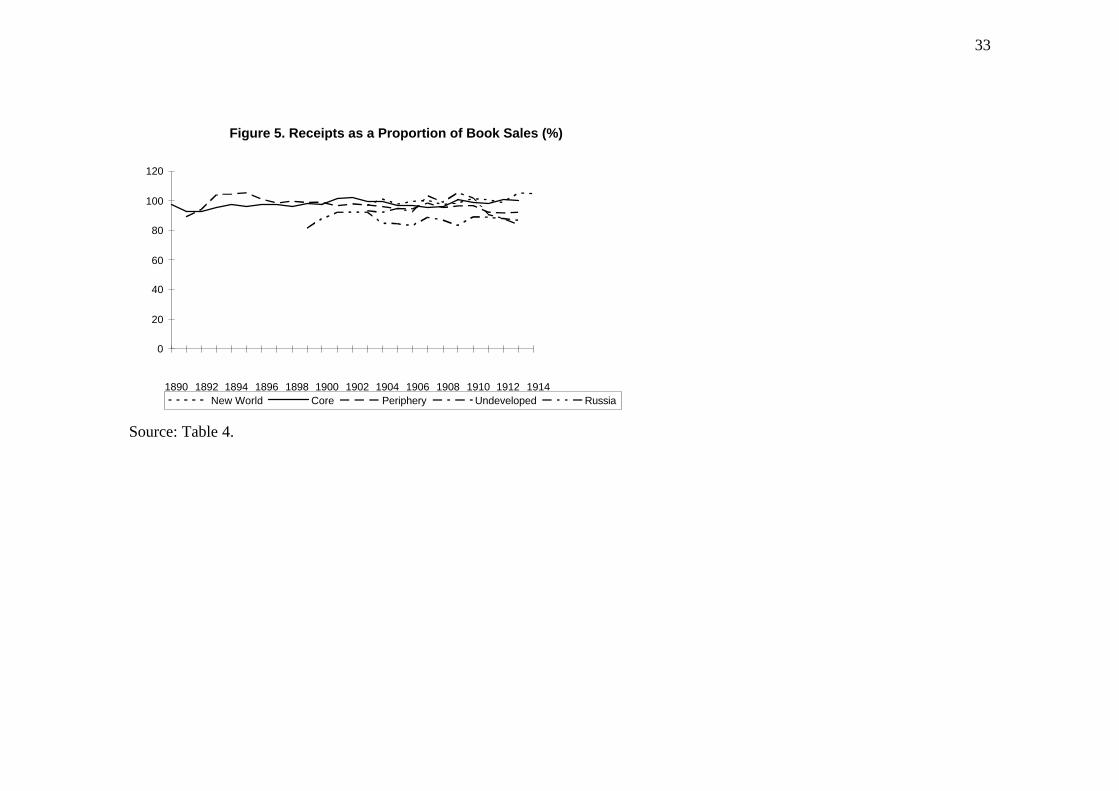
with very different sales patterns is therefore misleading. Figure 5 makes a partial
adjustment by reporting the cash receipts in one year calculated as a proportion of the
simple mean of sales of that and the previous calendar years.
<Table 4 here>
The results suggest that receipts tended to follow sales very closely, implying that
relaxing terms of credit was seemingly unused as a pricing strategy to gain market share.
Given the way in which changes in the underlying sales data can distort the ratios, it is
perhaps unwise to make too much of the volatility that is shown. The drop in the ratio of
receipts to sales in the undeveloped nations after 1910, for instance, is more related to a
rapid acceleration in sales there than a fall in receipts (see Figure 2).34
<Figure 5 here>
If Singer did not engage in predatory pricing strategies, then perhaps its marketing
was confined to pre-emptive investments in advertising and in retail networks. The
purpose of such strategies would have been to create a sales platform, either through
extensive advertising or through investing in distribution channels, as markets were
developing and so erecting entry barriers to competitors. The rents accruing from the
resulting near monopolization of distribution channels would more than compensate for
the initial investments.
14
Whether Singer actually engaged in such pre-emptive investments is once again
unknown. What can be demonstrated from the financial records, however, is that any such
investments must have been trivially small, for they do not show up as relatively high sales
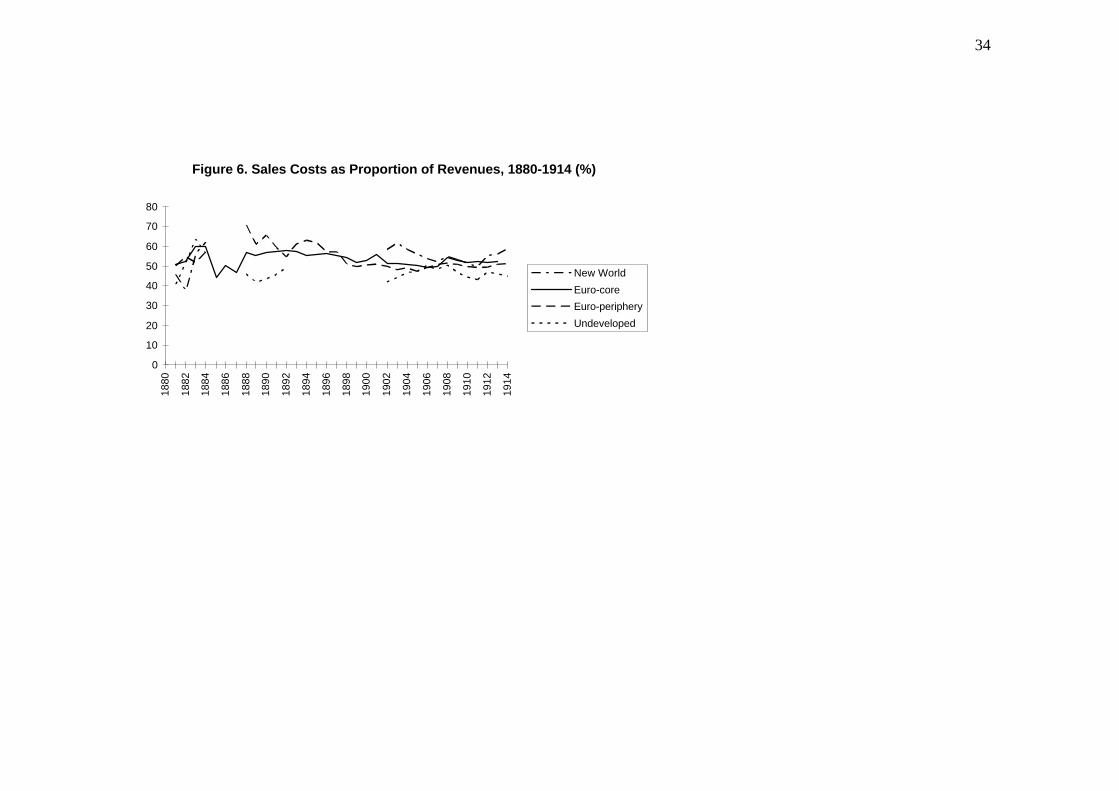
costs in any market at any time. Figure 6 takes the sales costs from Table 3 and divides it
through by the annual sales from Table 2. These are charted for the four groups of foreign
markets.
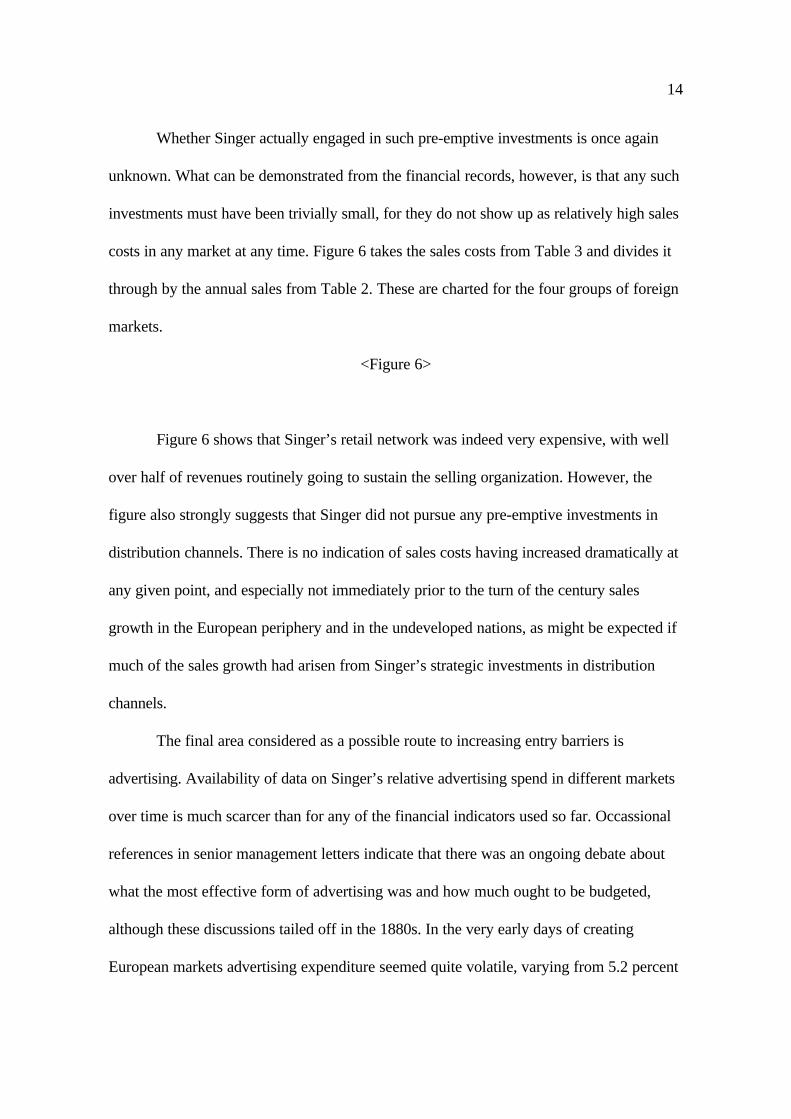
<Figure 6>
Figure 6 shows that Singer’s retail network was indeed very expensive, with well
over half of revenues routinely going to sustain the selling organization. However, the
figure also strongly suggests that Singer did not pursue any pre-emptive investments in
distribution channels. There is no indication of sales costs having increased dramatically at
any given point, and especially not immediately prior to the turn of the century sales
growth in the European periphery and in the undeveloped nations, as might be expected if
much of the sales growth had arisen from Singer’s strategic investments in distribution
channels.
The final area considered as a possible route to increasing entry barriers is
advertising. Availability of data on Singer’s relative advertising spend in different markets
over time is much scarcer than for any of the financial indicators used so far. Occassional
references in senior management letters indicate that there was an ongoing debate about
what the most effective form of advertising was and how much ought to be budgeted,
although these discussions tailed off in the 1880s. In the very early days of creating
European markets advertising expenditure seemed quite volatile, varying from 5.2 percent
15
to 1.5 percent of sales revenues in the UK from 1867 to 1873.35 By the late 1870s,
advertising spend was evidently closer to 5 percent than 1.5 percent, judging from the
disagreement between London agent William Woodruff and New York general manager,
George McKenzie. McKenzie complained that “upwards of £10,000 was spent last year
on newspaper advertising alone”, most of which was wasted. He insisted that an average
advertising spend of 2/- per machine was sufficient in all markets.36 With the retail price of
the standard family machine at £5 5/-, this represented an advertising spend of just under 2
percent of sales. This was clearly a challenge. The French office received a stinging rebuke
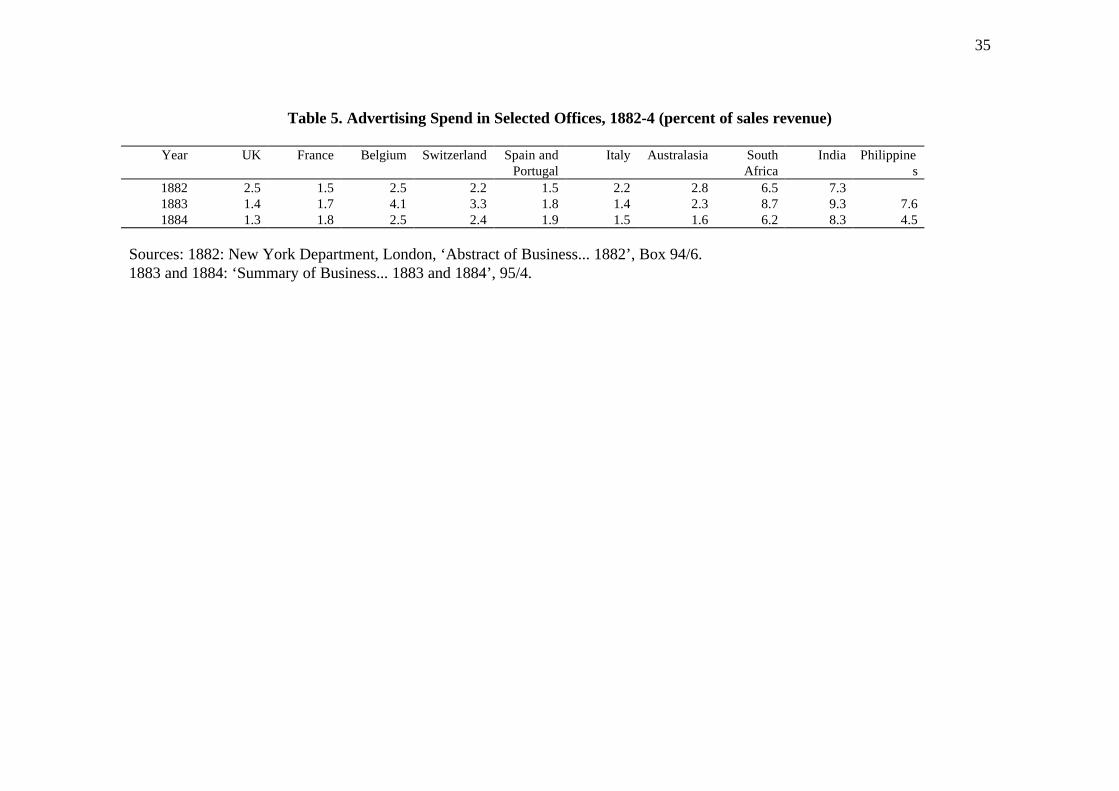
for spending 10/- per machine on newspaper advertising alone in 1879.37 Nonetheless, for
the few national sales subsidiaries for which evidence is available, it would appear that by
1884 most had managed to curtail their spending, as Table 5 illustrates.
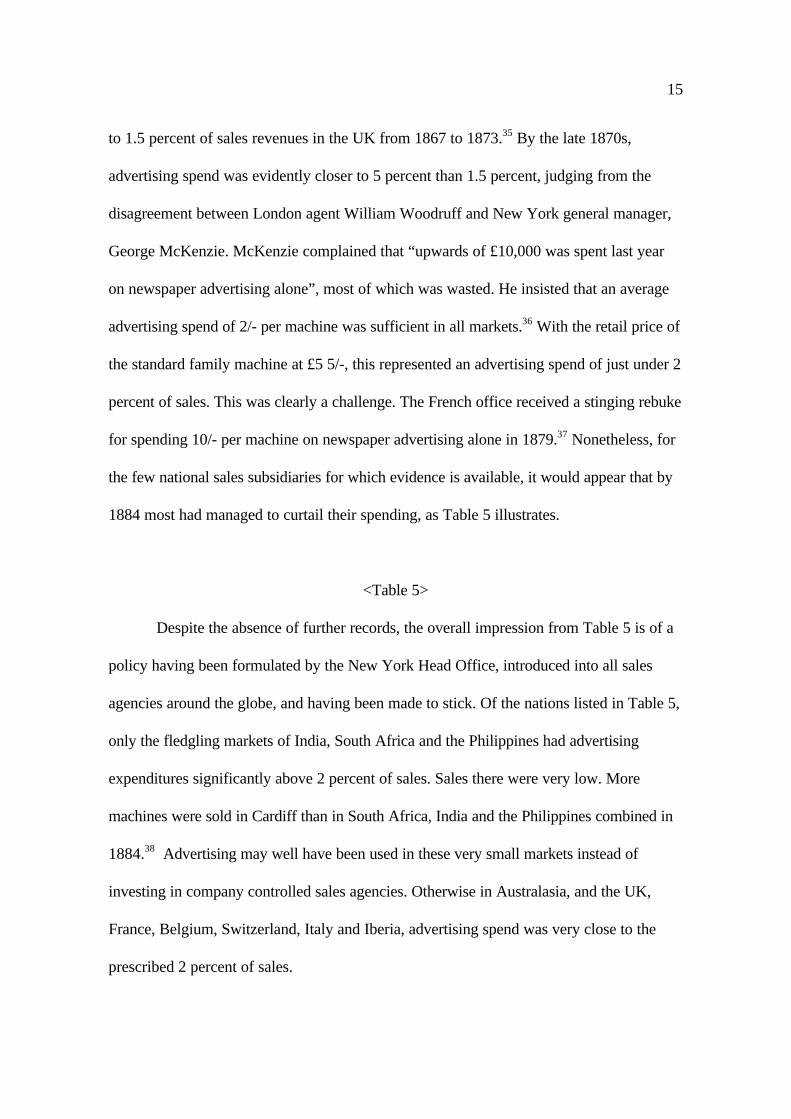
<Table 5>
Despite the absence of further records, the overall impression from Table 5 is of a
policy having been formulated by the New York Head Office, introduced into all sales
agencies around the globe, and having been made to stick. Of the nations listed in Table 5,
only the fledgling markets of India, South Africa and the Philippines had advertising
expenditures significantly above 2 percent of sales. Sales there were very low. More
machines were sold in Cardiff than in South Africa, India and the Philippines combined in
1884.38 Advertising may well have been used in these very small markets instead of
investing in company controlled sales agencies. Otherwise in Australasia, and the UK,
France, Belgium, Switzerland, Italy and Iberia, advertising spend was very close to the
prescribed 2 percent of sales.
16
The evidence is incomplete and does not follow through to the years of really
significant market development in the European periphery and beyond after the turn of the
century. But the absence of any archival record, the lack of any indicator of advertising
spend in the internal accounts after 1884, suggests that McKenzie’s advertising policy may
well have been applied. In those areas showing significant sales growth in the mid-1880s,
the UK, Iberia, Italy and Australasia, there is no evidence of sales growth lagging
advertising spend, in fact, if anything, that advertising spend lagged sales growth.
If all agencies were constrained by a 2 percent ceiling on their advertising budgets,
it is worth highlighting how this compares with other comparable businesses.
Representative data on advertising spend are rare for any period before the 1950s, but the
American Federal Trade Commission discovered that chain stores in the United States in
the 1920s spent on average just over 1.5 percent of sales revenues on advertising.39 While
it is impossible to know whether this share was also representative of chain stores in the
1880s, and in chains outside the United States, it does suggest that McKenzie’s insistence
on a 2 percent ceiling was not out of line of a broader retail practice. The available
evidence precludes any firm conclusion, but Singer’s global advertising spend up to the
mid-1880s does suggest that the company was not using advertising spend as a barrier to
competitive entry.
The earlier claims of business historians that Singer’s route to dominance was
through its aggressive marketing are beginning to sound a little hollow. The conclusion of
this analysis of Singer’s own internal financial records is that Singer did not price
aggressively, either in headline prices or credit terms, nor did it invest aggressively in its
distribution channels, either through advertising expenditure or through pre-emptively
17
securing a retail platform in emerging markets. Indeed, the initial conclusion is that Singer
had little explicit strategy for foreign markets at all. The company was seemingly content
to devise standardized marketing policies and apply them throughout their global
organization. While not textbook profit maximising behaviour, this may well have been
entirely sensible management given the demand for Singer’s machines and the company’s
constant battles against manufacturing plant capacity constraints.40 However, given that
Singer was operating with dozens of competitors, the combination of a relatively high-cost
distribution system with an apparent absence of strategic marketing does rather beg the
question as to how Singer could have attained such remarkable market dominance. To
answer this the next section focuses on how Singer invested in its global retail network
and developed its global brand.
Singer’s Global Retailing Strategy
The emphasis on the competitive edge given to the firm by its retail organization is
common to all the company’s historians, but, once again, a close reading of the archival
material in light of the firm’s financial records poses questions for this interpretation of the
global diffusion of Singer machines.
The biggest problem to simply linking the retail network to competitive success is
that, as already noted, the company controlled retail organization was more expensive than
independents. Whether they were, department stores, sewing machine merchants, or
dedicated retail chains, independents were always cheaper channels of delivery than
Singer’s expensive retail network. This is almost certainly the reason why no other large
manufacturing company at the time tied its scarce capital up in shops.41 Singer’s deliberate
18
investment in retail outlets across the globe must then have held considerable strategic
advantages for the firm.
There was undoubtedly a strong advantage associated with being better able to co-
ordinate demand with production. Singer’s senior management reiterated this point in their
letters, especially in their deliberations over factory plant expansion.42 But the remarkable
and exceptional success of Singer’s retail network is probably better understood in light of
the characteristics of the late nineteenth century demand for sewing machines.
The sewing machine was the first complex consumer durable sold so widely
around the world. It was not complex by the standards of late nineteenth century
engineering (indeed, Singer machines were not the most technologically accomplished on
the market).43 But they were far more complex than the typical consumer of sewing
machines was able to comprehend. This had important implications for the implicit
contract between seller and buyer.
Successful sales were dependent on two areas above and beyond product price and
quality: demonstration and after sales service. To reduce the uncertainty associated with
the first purchase of a family sewing machine, sellers needed to demonstrate to consumers
how the machine worked. Furthermore, and given the durable nature of the machine, the
probability of a consumer requiring subsequent, post-purchase demonstration was high.
Allied to this, post-purchase consumer need was the reasonable probability of a machine
requiring repair at some stage. Consumers of this complex durable good were therefore
engaging in an implicit contract with suppliers, requiring before- and after-sales market
support services over a period of time in addition to the actual product.
19
Given the durable nature of the implicit contract between buyer and seller, Singer’s
pioneering of mass consumer credit takes on a more significant light. Contemporaries
were amazed, often appalled, at why working class families would pay high interest rates
for goods on credit.44 As far as sewing machines were concerned the answer was simple.
A typical repayment period of up to two years locked the vendor into a relationship with
the purchaser as well as the other way round. After-sales service was readily available.45
Singer’s senior management were evidently aware of the importance of the
company’s relationships with consumers. It explains why the international retail
organization developed as it did. The key innovation in Singer’s retail network was not
installment purchasing, although that was of course very important, it was the invention of
the canvasser/ collector system by the London agent, William Woodruff, in the mid-1870s.
The canvasser/ collectors were the key people in the retail organization because they
provided the before- and after-sales demonstration services and did so in consumers’
homes. Not surprisingly, head office management in New York quickly realized the
potential of Woodruff’s innovation. It had led to dramatically increased sales not only in
the United Kingdom, but also much of western and southern Europe and the British
Empire. Edward Clark and George McKenzie, Singer’s President and Vice-President in
the late 1870s, ensured it was soon the standard practice throughout the United States and
the rest of the world.46
This emphasis on the canvasser/ collector is warranted because this alone explains
how Singer was able to build its brand and so to tap into a latent demand for sewing
machines around the world. Within the Singer retail organization, standardization
remained haphazard. Despite periodic rationalizations, throughout this period and after,
20
Singer’s foreign retail networks were characterized by considerable autonomy.
Standardization was limited to certain reporting procedures. The agents in charge of the
national markets were expected to develop the most effective retail structure for their own
individual markets.47 The ratio of shops to population, for example, varied considerably
from high density Britain to low density Russia and Sweden. The common denominator
throughout, however, was the role of the canvasser/ collector.48
Even with the canvasser/ collector system the details often varied. The original
Woodruff template had been to divide the roles and separate the two functions so that the
risk of opportunistic behavior from the sales force was minimized. In many countries with
much lower population densities, however, this division was simply impractical, and the
two functions combined in a single individual traveler. The common denominator was,
therefore, the emphasis on contacting consumers in their homes.
Given Singer’s retail outlet presence on High Streets throughout the world, this
point needs to be elaborated. The fixed retail outlets were of course important, but for the
overwhelming majority of sewing machine consumers, women in charge of family homes,
it was the ability of canvassers and collectors to demonstrate and provide after-sales
service in the homes that proved crucial to Singer’s success.49 It was, in other words, the
creation of a remarkable market support system, grafted onto the direct selling
organization, which enabled Singer to gain the trust of consumers around the world and so
build what was surely the most valuable global brand of 1914.
Conclusion.
21
The diffusion of the sewing machine across the world was remarkably high for the period
before 1914. The fact that Singer was able to capture almost all of this demand has been
explained here not as the result of deliberate marketing strategies attempting to build
barriers to competitive entry in emerging markets. In fact, Singer’s marketing strategies
were crude and undeveloped, even by the standards prevailing in international business by
1914.50
Rather Singer’s extraordinary success in foreign markets was more due to the
peculiarities of the demand conditions surrounding consumer purchase of a complex
consumer durable like a sewing machine. In particular, the combination of installment
purchase contract and the regular presence of canvassers and collectors meant that sewing
machine consumers, women in their homes, were able to overcome the inherent
uncertainties associated with such a purchase. By investing in a retail organization, Singer
minimized the costs to women sampling this complex product before purchasing. It was
this investment in these market support services that constituted the building of their
global brand. The company’s reward was to be the principal recipients of a mass
consumer demand around the world. Singer’s growth and emergence as one of the largest
companies of the early twentieth century was squarely built on scale economies in
marketing, especially in the distribution of a branded complex consumer durable with its
attendant market support services. The company captured enormous market share not
because of any anticompetitive strategy but through recognizing early the importance of
marketing and for its evangelistic zeal for reaching out to its potential customers and
making their purchasing decision easy.
22
Table 1. Singer Sewing Machines Sales in selected countries, 1875-1914 (machines per annum)
Year UK F B CH NL SP P ITA RUS SCA OTT AUS SA IND PHI1875 30300 11000 5000 10001876 35800 12000 1000 6000 1500 201877 41300 15000 2000 500 1000 8000 2000 3000 6800 900 2000 300 301878 46800 15000 3000 500 1200 12000 2500 5000 12500 1200 3000 500 701879 52300 17500 4000 1000 1800 16000 3000 7000 18800 1500 4000 700 1301880 62252 22500 5064 2102 2000 19205 3961 7500 22300 1800 70 4550 750 2501881 67417 24842 5239 2700 2650 24160 5521 8981 27262 2650 200 8131 1354 5521882 79815 26144 5409 2424 5600 18747 5500 10001 31600 5700 400 18136 812 5151883 85936 26375 5567 2418 6000 20847 4638 12514 35400 7200 1000 18991 760 1088 2781884 91411 25695 5667 3087 6700 21349 3708 12920 36200 8900 2000 17801 1203 1607 6741885 88732 28315 6064 3354 5300 17900 3768 12486 41200 7800 2000 13546 1767 1761 4941886 82432 28900 6200 3457 4100 19285 3894 11900 31200 6500 3000 12410 1950 2012 6001887 91217 29500 6350 3284 2500 19369 3911 11350 32300 4500 2000 13258 2140 2131 7001888 98547 30013 6492 3020 2500 21406 4322 10806 52200 5000 1000 13200 2327 2966 7821889 127266 35096 6765 2965 4200 23927 4831 15726 48100 8500 3400 13200 3170 3578 12201890 150008 40091 7807 3328 6000 26590 5065 18010 42000 12700 5400 13200 3627 3763 11951891 145901 42891 7470 3704 5800 29165 5562 20001 40700 13000 5800 13200 3473 4145 10741892 146561 45263 7185 4116 6300 28213 6257 24592 46100 14922 7000 13200 4362 4824 9701893 138589 48178 8167 4314 7300 23500 6500 21518 56200 14800 8500 13081 4300 5770 11001894 146452 51751 8339 4974 9000 24000 6750 22230 65000 14718 11000 12877 4300 6720 12401895 143334 52595 8837 5271 9500 24000 7000 22755 68788 17700 13500 13420 5300 7670 13801896 133442 56132 9785 5831 9850 24000 7250 27680 72000 19750 14800 14654 6300 8620 15201897 133408 58342 10101 6433 10500 20500 7500 34650 85910 19850 16000 15331 7300 9570 16601898 139767 58042 10507 7002 11200 22734 7956 34503 92369 19850 18000 18000 8300 10500 18001899 165549 68330 11333 7425 11900 31038 8696 37634 99444 19850 20000 20670 9300 11470 19401900 164980 72349 11473 7430 12500 32331 9986 37041 110316 19850 22000 23340 10300 12420 20801901 155358 74987 11642 7440 13209 36083 8965 33944 128249 19998 23448 26010 11300 13352 22201902 150936 82048 11171 7449 13453 45243 10210 40154 132266 20281 30069 28673 12274 13351 23571903 136622 86973 11241 7666 14612 48694 11135 43435 182668 22920 37729 25432 14672 15842 19371904 130290 88936 11842 7602 16095 45092 10864 49970 202592 26319 46042 27558 11196 17781 13501905 142659 93528 12446 8373 17714 39916 10460 51894 310881 29799 46187 26066 12220 18075 1612
23
1906 168737 98772 12938 8907 21009 43449 10647 56325 376336 36305 52706 26965 10844 17331 14351907 163976 107514 13675 9264 21124 44313 10705 67219 413905 39935 53900 29593 8662 20478 20671908 128396 110899 13561 8342 19612 43702 10568 71724 446151 41366 51254 29194 6796 20159 22411909 136349 115129 14862 8477 19048 43918 11367 70444 481796 43327 54463 29369 7781 20873 26421910 130726 112303 15655 8522 19559 52020 11613 78182 505066 45675 66757 31546 10523 24855 41201911 129173 111566 16535 8394 20347 61229 13732 94308 504489 44738 84623 34088 11888 26582 143661912 137654 123833 18330 8790 22693 75413 16491 110792 570371 45921 88509 30527 12944 36481 177141913 142026 126320 19288 7832 23814 72580 16654 110665 675174 47815 78415 29458 14486 44819 272661914 138703 114000 17350 7050 21500 67201 15420 97817 678986 43000 78000 26582 13250 41437 16520
Notes and sources: All taken from Godley 2000, tables 2-4, and sources there.
24
Figure 1. Singer's Sales in Advanced Economies, 1870-1914 (machines per annum)
UK
France
BCH
NLAus
0
20000
40000
60000
80000
100000
120000
140000
160000
180000
1871
1873
1875
1877
1879
1881
1883
1885
1887
1889
1891
1893
1895
1897
1899
1901
1903
1905
1907
1909
1911
1913
Source: Table 1.
25
Figure 2. Singer's Sales in Less Advanced Economies, 1870-1914 (machines per annum)
Russia
0
100000
200000
300000
400000
500000
600000
700000
1871
1874
1877
1880
1883
1886
1889
1892
1895
1898
1901
1904
1907
1910
1913
Spain
Portugal
Italy
Scandinavia
Ottoman
South Africa
India
Philippines
Source: Table 1.
26
Figure 3. Global Sewing Machine Diffusion, 1870-1914 (machines per 000 population).
Euro-Core
Euro-Periphery
Undeveloped
New World
0
20
40
60
80
100
120
1871
1873
1875
1877
1879
1881
1883
1885
1887
1889
1891
1893
1895
1897
1899
1901
1903
1905
1907
1909
1911
1913
Source: Table 1 and see text.
27
Table 2. Singer’s Global Sales Revenues (US$), 1880-1914
Year UK F B CH NL SP&P ITA RUS SCA OTT AUS SA IND PHI1880 804670 163806 52473 820018 249653 140877 20538 74941881 2027485 886969 177798 82975 928114 299152 209451 36946 155031882 2447336 937037 180588 74966 806959 320303 633370 26079 176861883 2667936 957891 187061 75656 867962 428579 770986 25510 32756 96671884 2848558 934797 197768 90216 889613 448704 688584 41495 44435 227691885 28476251886 2222148 5651551887 2609543 6121411888 3152667 1072033 223293 95538 854996 350766 75767 75568 252091889 4093991 1272120 233163 95164 928440 492303 99023 86309 343311890 4988638 1465541 267990 109025 1002478 615138 114137 91509 349631891 5015191 1591209 260786 126109 1103757 684804 117413 104155 313421892 5131742 1695045 256244 141336 1128158 811507 153722 121121 284701893 4938639 1815805 295503 145226 1010812 708817 7082581894 5464434 1912231 299329 162129 952945 679454 7060511895 5680653 1971697 323997 174021 951826 700268 7382341896 5398853 2147927 371260 194958 967929 885257 8095931897 5524362 2246566 392102 214735 956779 1119486 2930557 8740131898 5851655 2260459 406388 236655 1059021 1118589 32267601899 6951189 2661735 444797 245965 1389082 1220380 37429171900 7025854 2851933 1518416 1210619 42031271901 6626600 2956024 1662613 1158368 49663601902 6453798 3250823 447024 275470 354591 2042342 1337150 5268994 586279 860125 1813629 496741 372161 516991903 5765188 3450611 451551 287676 400407 2227351 1430060 7113892 693183 1112419 1626263 606596 444758 391971904 5250412 3525282 482219 289450 440064 2111568 1681639 7606920 815120 1433147 1764464 464283 508042 326091905 5318562 3718423 522623 322138 493965 1941569 1766085 11646870 926838 1527392 1673047 495319 526499 440991906 6502798 3928056 548596 340754 582069 2124004 1911924 14181573 1138314 1698926 1747035 437383 515209 394971907 6425622 4267718 588028 359094 590565 2354671 2541080 15824939 1271111 1838563 1897451 350392 601898 548141908 5037313 4382106 587250 328724 556127 2344488 2749773 17652794 1313374 1748871 1901366 285971 593587 678251909 5659242 4607084 619072 333439 549708 2473455 2713392 20070494 1385123 1835384 1935151 336203 625390 769161910 5508180 4563583 659689 335365 565762 2831732 3039136 21640493 1476991 2269339 2080936 456697 741400 1069061911 5281525 4682818 692676 331103 594638 3338267 3637270 22385294 1484132 2925521 2239449 507635 860109 5957211912 5673117 4948962 758961 353221 667058 4028666 4203578 25640061 1545868 3023899 2040932 550286 1178816 7848031913 5980637 5088064 803256 323735 666569 3916819 4129276 31360709 1615128 2706084 2034897 611494 1469057 12595811914 3778421 1856322 1342590 738833
28
Notes and Sources (all original sources from the Singer archives throughout. Blank cells equal no data.):UK sales see A. Godley, “Pioneering Foreign Direct Investment in British Manufacturing,” Business History Review 73 (1999), Table 2, 419-421 and sourcescited there.France (including Algiers, but not Swiss-French customs zone):1880: estimate derived from the aggregate value of machines etc. sold and net book accounts receivable at Paris Central Office during 1880, “Schedule B:London. Dec. 31, 1880,” (P92-8970 Micro 2002, reel 17, 177-9). 1881: annualized estimate from sales to end of August, “Comparative Statement of Businessat Foreign Offices 1881 & 1882,” (Box 103/4). 1882: “New York Department, London. Abstract of Business for... 1882,” (Box 94 folder6). 1883-4: “Summaryof Business at [Foreign] Offices, 1883 & 1884,” (Box 95/4). 1888-9: Annualized estimate from sales to end of August, “Comparative Statement of Business...to 31.8.1888 and 1889,” (Box 107/3). 1890-1: “Comparative Statement of Business at Foreign Offices... to 31st December 1890 and 1891,” (Box 98/1). 1890-99: “Paris - End of Year Results, 1890-99,” (Microreel 703 (1), n.b. this source tallies with above). 1900-04: “Paris - End of Year Results, 1900-04,” (P92-8957Micro 2002, reel 4, section 5, 126). 1902-13: “World Reports, annual,” (Micro AP93-0444, unprocessed accession).Belgium:1880-4: sources as for France. 1888-9: annualized estimate, same source as for France. 1890-91: Same as for France. 1890-99: “Brussels - End of Year Results,1890-99,” (Microreel 703 (1), which tallies with above). 1900: annualized estimate from first 11 months sales, “Etat comparatif... 1899-1900,” (Box 80/3).1901: Annualized estimate from first 5 months of year, “Etat comparatif... 1900-1901,” (Box 80/3). 1902-13: as for France.1880-1: annualized estimates from first 46 weeks of sales, “Summary of Business in Switzerland, 1880 and 1881,” (Box 83/4). 1882-89: as for France. 1890-9:“Geneva - End of Year Results, 1890-99,” (Microreel 703 (1). 1902-13: as for France.Spain and Portugal:1880: annualized estimates for Spain and Portugal from “Results at Madrid C.O. to June 30th [1880 -] 1881,” (Box 106/4). From 1881-1897 Spanish andPortuguese results reported together under Madrid Central Office. 1882-9: as for France. 1890-7: “Madrid - End of Year Results,” (Micro 703 (1)). 1898-9:“Spain - End of Year Results, 1898-1899,” and “Portugal - End of Year Results, 1898-1899,” (Micro 703 (1)). 1900-1: “Madrid - Spain only - End of yearResults, 1900-1904,” and “Lisbon - Portugal only - End of Year Results, 1900-1904,” (P92-8957 Micro 2002, reel 4, section 5, 90 and 102). 1902-14: As forFrance, note Spanish figure for 1914 reported.Italy:1880-9: estimates and actual results as for France. 1890-9: “Italy - End of Year Results, 1890-1899,” (Micro 703 (1)). 1900-1: as for Spain and Portugal but p.114. 1902-14: as for France, note 1914 figure for Italy reported.Australasia:1880: estimate as for France. 1881: Australia (Melbourne office only, Sydney opened in 1882) from Thomas to McKenzie, 15 Jan. 1883 (Box 76/9). NewZealand annualized estimate as for France. 1882-4: as for France. 1886-7: Australia “Comparative Statement at New South Wales and Melbourne, 1886 and1887,” (Box 78/1, note, Australian reporting year actually ran from twelve months to Oct. 31st of reporting year). New Zealand estimated from unweightedmean share of sales relative to Australia for 1881-5. 1893-7: “Comparative Summary of Business, Australasian Branches, Years 1893-1897,” (Box 79/5). 1902-1914: as for France.South Africa:1880-91: estimates and actual results as for France. 1892: annualized estimate from first half, “Comparative Statement of Business at [Foreign] Offices, to endof June 1891 and 1892,” (Box 98/3). 1902-13: as for France.
29
India:1880-91: estimates and actual figures as for France. 1892: as for South Africa. 1902-14: as for France, 1914 figure reported.Philippines:Office opened in 1882. 1882-92: estimates and actual values as for France. 1902-14: as for France.Russia (including Finland):1897-9: “St. Petersburg [Russia] - End of Year Sales, 1897-99,” (Micro 703 (1), note 1897 is estimate from second half sales). 1900-1: “St. Petersburg - End ofYear Sales, 1900-01,” as for France and confirmed by F. Carstensen, “American Multinational Corporations in Imperial Russia: Chapters on foreign enterpriseand Russian economic development,” (unpublished Ph.D. dissertation, Yale University, 1976), Table 4, p.146. 1902-13: as for France. 1914: Carstensen,“American Multinational”, Table 4, p.146.Scandinavia:1901: estimate from “Stockholm and Christiana - End of Year Results [from July 1], 1901,” (P92-8957 Micro 2002, reel 4, section 5, pp.128, 130). 1902-13: asfor France.Netherlands:1901: estimate based on “G. Neidlinger, Hamburg - End of Year Results, 1901,” (P92-8957, Micro 2002, reel 4, section 5, p.50) and deducting Scandinavianand Ottoman estimates (above and below). 1902-13: as for France.Ottoman Empire (included Balkans, ie. Romania, Servia, Bulgaria and Greece):1901: estimate from “Romania and Servia, Bulgaria and Greece, Turkey and Egypt - End of Year Results [from July 1], 1901,” (P92-8957, Micro 2002, reel 4,section 5, pp.51-3). 1902-13: as for France.
30
Table 3. Singer’s Global Sales Costs (US$), 1880-1914
Year UK F B CH NL SP&P ITA RUS SCA OTT AUS SA IND PHI1881 862033 458526 94192 47079 385549 150130 95868 16067 59241882 986036 496012 100301 45694 434270 175577 238179 16471 72031883 1171177 575609 122239 53387 415773 222321 433138 20052 15168 63711884 1281154 596458 129796 58262 465311 256866 427928 27896 22735 117081885 12595131886 11206241887 12202341888 1616135 621021 129159 58553 430562 248132 29889 32805 138221889 1875391 745310 130972 58757 460918 300450 38297 35590 157321890 2431584 923373 149147 65048 497634 403607 48177 36450 168981891 2524453 935866 153175 78195 586762 407355 52483 42685 162321892 2664586 991533 153644 86036 745072 444172 68555 48415 178751893 2686885 1080393 162560 87843 898294 4341281894 2903850 1140081 160310 90252 522371 4287981895 3128409 1185373 167524 99917 505265 4339341896 3006010 1317262 187280 112983 552244 5068001897 2975509 1358587 197655 123125 567015 6413801898 2972957 1329457 205321 133612 550943 675741 13924021899 3413753 1449474 206766 140967 670625 710680 17353661900 3609103 1547216 712543 720370 20752391901 3775792 1623262 779113 720770 23957081902 3283060 1759611 205536 145207 187590 901615 740032 2617452 327720 468064 1059131 218959 98957 222151903 3071401 1883210 205510 151895 208382 1006335 724411 3202169 372831 578504 1003630 284588 118973 199721904 2746642 1909846 213712 152673 227998 1011748 847536 3538130 441526 730140 1034187 269065 128097 171831905 2684967 1995664 228723 169360 250283 937677 861853 4859987 480131 797932 940204 295073 140352 228031906 3268671 2083731 237824 169019 290517 1034524 958086 6836211 581169 851765 941975 287536 150760 221021907 3303547 2253632 251395 181142 311236 1222996 1293067 7743880 647936 999837 992458 239499 159296 244521908 3075405 2414466 263632 177289 310121 1252888 1386960 8254681 679933 1049480 1045015 211509 162678 273941909 2971845 2523372 285862 178107 313143 1298807 1408197 8761863 736864 1075095 1031470 216720 168665 286771910 2942767 2475748 297903 181232 296331 1385124 1572343 9775329 772746 1187670 1069984 264488 200089 431901911 2974621 2524560 315711 179604 307325 1596724 1802953 10135529 809492 1408853 1117204 293389 275290 2086841912 3041832 2801953 338190 195080 329120 1917502 2058417 10957245 867810 1652725 1128552 305166 382068 3582051913 3235049 2861398 358931 184055 332158 1949095 2080953 13911848 866550 1518995 1144078 325119 500969 5200881914 2104000 1092138 557410 355347
Notes and Sources: as Table 2, with the exception of no data for 1880. Blank cells equal no data.
31
Figure 4. Singer's Global Retail Revenues (US$ per machine),1880-1914
0
10
20
30
40
50
60
70
1880 1882 1884 1886 1888 1890 1892 1894 1896 1898 1900 1902 1904 1906 1908 1910 1912 1914
Euro-core Euro-periphery Undeveloped nations New World
Source: Tables 1 and 2.
32
Table 4. Receipts as Proportion of Book Sales, 1890-1914
Year New World Euro-core Euro-periphery Undeveloped Russia1890 981891 93 891892 93 941893 96 1041894 98 1041895 96 1051896 98 1011897 97 981898 96 1001899 98 99 821900 97 99 881901 101 97 921902 102 98 921903 97 99 97 93 921904 101 99 96 92 851905 98 97 95 95 851906 99 97 95 93 831907 100 96 98 103 891908 97 96 95 99 871909 98 101 96 106 831910 102 99 97 102 891911 101 99 92 91 891912 99 101 92 88 881913 105 100 92 84 871914 105
mean 100 98 97 95 87
Sources: Book value sales Table 2. Cash receipts from same sources as Table 2.
33
Figure 5. Receipts as a Proportion of Book Sales (%)
0
20
40
60
80
100
120
1890 1892 1894 1896 1898 1900 1902 1904 1906 1908 1910 1912 1914New World Core Periphery Undeveloped Russia
Source: Table 4.
34
Figure 6. Sales Costs as Proportion of Revenues, 1880-1914 (%)
0
10
20
30
40
50
60
70
80
1880
1882
1884
1886
1888
1890
1892
1894
1896
1898
1900
1902
1904
1906
1908
1910
1912
1914
New World
Euro-core
Euro-periphery
Undeveloped
35
Table 5. Advertising Spend in Selected Offices, 1882-4 (percent of sales revenue)
Year UK France Belgium Switzerland Spain andPortugal
Italy Australasia SouthAfrica
India Philippines
1882 2.5 1.5 2.5 2.2 1.5 2.2 2.8 6.5 7.31883 1.4 1.7 4.1 3.3 1.8 1.4 2.3 8.7 9.3 7.61884 1.3 1.8 2.5 2.4 1.9 1.5 1.6 6.2 8.3 4.5
Sources: 1882: New York Department, London, ‘Abstract of Business... 1882’, Box 94/6.1883 and 1884: ‘Summary of Business... 1883 and 1884’, 95/4.
36
1 Per capita diffusion figures taken from A. Godley, ‘The Global Diffusion of the Sewing Machine, 1850-
1914’, Research in Economic History, 20, (2000 forthcoming).
2 Singer’s history is covered by A. Jack, ‘The Channels of Distribution for the Innovation: the sewing
machine industry in America’, Explorations in Entrepreneurial History 9 (1957), R. Davies, Peacefully
Working to Conquer the World (New York, 1976); F. Carstensen, American Enterprise in Foreign
Markets (Chapel Hill, 1984); D. Hounshell, From the American System to Mass Production, 1800-1932
(Baltimore, Maryland 1984), chapters 2 & 3; and M. Wilkins, The Emergence of Multinational Enterprise
(Cambridge, Mass., 1970), chapter 3.
3 See C. Schmitz, “The World’s Largest Industrial Companies of 1912” Business History 37 (1995), 89;
and L. Hannah, “La evolucion de las grandes empresas en el siglio XX: un analisis comparativo”, Revista
de Historia Industrial 10 (1996), 119. A.D. Chandler, The Visible Hand (Cambridge Mass., 1977).
4 Davies, Peacefully Working, p. 140. on employment in 1905. International Harvester was perhaps the
next most marketing led of the largest firms in the world by 1912. See Carstensen, American Enterprise.
5 See J. Galbraith, The Affluent Society (Harmondsworth, 1962); N. Kaldor, “Advertising and Economic
Structure,” Review of Economic Studies, 18 (1950): 1-27. For a review see T. Corley, “Marketing and
Business History,” in The Rise and Fall of Mass Marketing, ed. R.S. Tedlow and G. Jones (London,
1993).
6 Citation from Chandler, Visible Hand, p.304.
7 For a recent overview see R. John, ‘Elaborations, Revisions, Dissents: Alfred D. Chandler, Jr.’s, The
Visible Hand after Twenty Years’, Business History Review 71 (1997).
8 R. Tedlow, New and Improved (New York, 1990).
9 For this ‘stage’ approach to the development of marketing see, for example, S. Strasser, Satisfaction
Guaranteed (Washington DC., 1995); Strasser et al eds., Getting and Spending (Cambridge, 1999); as
well as Tedlow, New and Improved.
37
10 S. Kim, “The Growth of Modern Business Enterprise in the Twentieth Century,” Research in
Economic History 19 (1999): 75-110; and Kim, “The Rise of Multi-unit Firms in U.S. Manufacturing,”
Explorations in Economic History 36 (1999): 360-89.
11 R. Church, ‘New Perspectives on the history of products, firms, marketing, and consumers in Britain
and the United States since the mid-nineteenth century’, Economic History Review 52 (1999): 405-35;
and idem, “Ossified or Dynamic? Structure, Markets and the Competitive Process in the British Business
System of the Nineteenth Century,” Business History 42 (2000):1-20; building on T. Corley, “Consumer
Marketing in Britain, 1914-1960,” Business History 29 (1987): 65-83; S. Nicholas, “The Overseas
Marketing Performance of British Industry, 1870-1914,” Economic History Review, 37 (1984); and R.
Davenport-Hines, “Introduction,” in Markets and Bagmen: Studies in the History of Marketing and
British Industrial Performance, 1830-1939 (London, 1986) ed., R. Davenport-Hines.
12 K. Lancaster, “A New Approach to Consumer Theory,” Journal of Political Economy 74 (1966): 132-
57.
13 Church, “New Perspectives,” on search and experience goods. The most well known marketing
theorists include Philip Kotler (see his Marketing Management [London, various editions, eg. 1984]) and
Theodore Levitt (see “The Globalization of Markets,” Harvard Business Review [1983]).
14 A. Godley, “Pioneering Foreign Direct Investment in British Manufacturing,” Business History Review
73 (1999): 394-429; S. Fletcher and A. Godley, “Foreign Direct Investment in British Retailing, 1850-
1962,” Business History 42 (2000): 42-61; and Godley and Fletcher, “The Impact of Foreign
Multinationals in British Retailing, 1850-1961,” Economic History Review (2001) forthcoming.
15A. Godley and S. Fletcher, “International Retailing in Britain, 1850-1994,” Service Industries Journal,
21 (2001) forthcoming; Fletcher and Godley, “Foreign Entry into British Retailing, 1850-1994,”
International Marketing Review 28 (2000) forthcoming; R. Church, “Advertising Consumer Goods in
Nineteenth-Century Britain: re-interpretations,” Economic History Review 53 (2000) forthcoming.
38
16 Church, “Ossified or Dynamic?”. Singer exploited significant technical economies of scale in
production in the 1860s and 1870s, but unit costs typically rose slightly thereafter despite output
increasing by a factor of five from 1880-1913. See Godley, “Pioneering FDI,” esp. pp.424-6.
17 The Singer archives are housed at the State Historical Society of Wisconsin, Madison, Wisconsin,
USA.
18 Davies, Peacefully Working, on early competitors, 5-15 and 54-5; also Hounshell, American System,
chapter 2; F.G. Bourne, “American Sewing Machines”, in C.M. Depew (ed.) One Hundred Years of
American Commerce (New York, 1968, orig. 1895), 530; and N. Oddy, “A Beautiful Ornament in the
Parlour or Boudoir: The domestication of the sewing machine,” in The Culture of Sewing: Gender,
consumption and home dressmaking, edited by B. Burman, (Oxford, Berg, 1999).
19 Davies, Peacefully Working, p.161.
20 In fact diffusion is overstated in the conventional measurement because of the typical non-allowance
for depreciation. See S. Bowden and A. Offer, “Household appliances and the use of time: the United
States and Britain since the 1920s,” Economic History Review (1994) 47: 725-748.
21 Population data come from B. Mitchell, British Historical Statistics, (Cambridge: Cambridge
University Press, 1988) for the UK; idem International Historical Statistics: Europe. 4th Edition,
Basingstoke: Macmillan, 1998) for SP, P, ITA, F, CH, B, NL, Russia (R, including Finland), Scandinavia
(SCA, aggregating Denmark, Norway and Sweden), and the Balkans (Greece, Bulgaria, Romania and
Serbia). Mitchell, International Historical Statistics: Africa, Asia and Oceana, 1750-1993, (Basingstoke:
Macmillan,1998), gives South Africa (with an adjustment made here to account for the unenumerated
Transvaal and Orange Free State population for pre-1904), India, Australia (with an adjustment made
here to account for the unenumerated Australian aboriginal population, and including New Zealand), the
Philippines (Christian population only, ie. c.85-90% of total), and Ottoman Turkey. Straightline
interpolations throughout for missing years.
22 Household size data is fragmentary. See Mitchell, International Historical Statistics (both volumes);
and more generally P. Bairoch, Cities and Economic Development (London, 1988).
39
23 See “World Reports, annual,” 1902 through to 1940 (Singer Archives (hereafter SA), Micro AP93-
0444, unprocessed accession) for post-1914 data unreported in tables here.
24 Compare with J. Williamson, “The Evolution of Global Labor Markets since 1830: Background
evidence and hypotheses,” Explorations in Economic History 32 (1995): 141-196 and “Erratum,” p.553,
for example. Also see Godley, “Global”.
25 The Singer archives at Madison, Wisconsin, received several different accessions, and have used
several different cataloguing systems. Much of the financial data used here is from the most recent and
currently unprocessed accession.
26 Godley, “Pioneering FDI”.
27 Jack, “Channels of Distribution”; and Davies, Peacefuly Working pp.19ff, on US developments.
Installment purchasing introduced first in the UK from 1873, and the replacement of independents by
company controlled agents from 1875-6. See Singer’s British agent, William Woodruff writing to Singer
President, Edward Clark, 19 May 1877 (SA, Box 93, Folder 9); Red ‘S’ Revew (Singer’s in-house journal)
1 (1919-20) p.20 (Note, the only extant copies of these I have been able to locate are in the archives of
Clydebank Library, Scotland); Carstensen, American Enterprise, chapter 1; and Davies, Peacefuly
Working pp.39-40.
28 Godley and Fletcher, “Impact of Foreign Multinationals”.
29 “Retail Prices in England and Foreign Offices, 31/12/1884,” (SA, Box 95/4); also Swiss agent, L.
Charriere, to London (New York?), 8 Jan. 1892 (SA, Box 83/5). US prices up to 1876 had been protected
under the terms of the patent pool, see Davies, Peacefully Working, p.58. Also see A. Godley, Enterprise
and Culture: Jewish Immigrant Entrepreneurship in London and New York, 1880-1914 (Basingstoke and
New York, 2000 forthcoming), chapter 5.
30 “Retail Prices in England and Foreign Offices”.
31 On model upgrades in Russia, see Carstensen, American Enterprise, chapters 4 and 5. Variations in
mean unit revenues of up to 10% are easily accounted for by the proportion of standard family machines
40
sold with or without covers, stands, or enameled lettering, with the cash discount, and so on. See Red ‘S’
Review, 1 (1919-20), pp.20-1.
32 Red S Review ibid. Godley, Enterprise and Culture, p.245, n.45, on repayment terms in London.
33 Carstensen, American Enterprise, pp.58-9 on Russia. But agents were very flexible elsewhere. See
Singer Vice President, George McKenzie, “Memo to all agents, 21 Sep. 1885,” (SA Box 95/5); and
“Audit of Manchester Office by G.B. Dobson, May 1892,” (SA, Box 98/3), for example.
34 Russia is the one market where cash receipts as a share of sales were relatively low. Receipts were on
average 87% of that and the previous year’s sales. This compares to 100% for the New World markets,
98% for the European-core, 97% for the periphery, and 95% for the undeveloped markets. However, this
relatively low cash to sales ratio is primarily a consequence of the extraordinarily rapid growth in Russian
sales. Russian sales were growing so much more quickly than elsewhere that the effect on the calculation
is to produce this lower ratio. Credit terms may well have been a little more liberal there than elsewhere,
as Carstensen suggests, but only marginally so. And while Singer’s credit may have had an undue impact
in the Russian economy (see Carstensen, “Numbers and Reality: A Critique of Foreign Investment
Estimates in Tsarist Russia,” in ????, pp.281-2, for an estimate of Singer’s credit out of total credit),
Russian price (credit) elasticity of demand is surely unlikely to have been significantly higher than in
other less developed nations.
35 See McKenzie to Clark, 29 March 1879, and esp. McKenzie to Woodruff, 16 Apr. 1879 (both in SA
Box 93/9).
36 McKenzie to Clark 29 March 1879; and Woodruff’s defense, Woodruff to Clark, 14 Apr. 1879 (both
in SA, Box 93/9).
37 “Retail Prices in England and Foreign Offices”; McKenzie to Clark, 29 Mar. 1879 (SA, Box 93/9).
38 A. Godley, “Singer in Britain: the diffusion of sewing machine technology and its impact on the
clothing industry in the United Kingdom, 1860-1905,” Textile History, 27 (1996): 59-76 on UK regional
sales.
39 Kim, “The Growth of Modern Business Enterprise,” Table 6, p.96.
41
40 Chandler, Visible Hand, pp.405-6; Davies, Peacefully Working.
41 From International Harvester to Hoover, from Exxon to Max Factor, manufacturers have typically
developed much more capital efficient techniques for controlling distribution. See Godley and Fletcher,
“Impact of Foreign Multinationals”.
42 Godley, “Pioneering FDI”.
43 See T. Puttnam, “The Sewing Machine Comes Home,” in The Culture of Sewing, Burman; and R.
Thomson, The Path to Mechanized Shoe Production in the United States, (Chapel Hill, 1989) on
technology.
44 P. Johnson, Saving and Spending (Oxford, 1985); L. Calder, Financing the American Dream
(Princeton, 1999), chapter 4.
45 See articles in Red “S” Review, for example, September 1919, pp.26-7.
46 Carstensen, American Enterprise, chapter 1, on Woodruff’s innovation. See also the internal
correspondence, for example, Woodruff to Clark, 19 May 1877; McKenzie to Clark, 29 Mar. 1879;
McKenzie to Woodruff, 16 Apr. 1879 (all from Box 93/9); and McKenzie to New York, 11 May 1882,
and 27 May 1882, complaining of the relatively poor performance of the US retail organization compared
to UK (SA, Microreel 2013, reel 63. I am indebted to Kristine Bruland for these sources).
47 This contrasts with the emphasis in Chandler, Visible Hand, and Davies, Peacefully Working, on ever
increasing standardization in the international retail organization. See Red “S” Review, various issues,
1919-1921, reports on business conditions in foreign markets for evidence of diversity.
48 Carstensen, American Enterprise, chapters 4 and 5, on Russian developments; Red “S” Review for
Sweden and elsewhere.
49 An interesting footnote to this is the company’s explanation for a disappointing performance in India
in the 1880s, that it was dueto the prevailing social customs that hindered access to women in their
homes. See Davies, Peacefully Working, p.89.
50 Church, “Ossified or Dynamic?” esp. pp.8-9.