semantic rule-based equipment diagnostics rule-based equipment diagnostics g. mehdi1;2 e. kharlamov3...
TRANSCRIPT
Semantic Rule-Based Equipment Diagnostics
G. Mehdi1,2 E. Kharlamov3 O. Savkovic4 G. Xiao4
E. Guzel Kalaycı4 S. Brandt1 I. Horrocks3 M. Roshchin1 T. Runkler1,2
1 Siemens CT, Germany 2 Technical University of Munich, Germany3 University of Oxford, UK 4 Free University of Bozen-Bolzano, Italy
Abstract. Industrial rule-based diagnostic systems are often data-dependantin the sense that they rely on specific characteristics of individual pieces ofequipment. This dependence poses significant challenges in rule authoring, reuse,and maintenance by engineers. In this work we address these problems by relyingon Ontology-Based Data Access: we use ontologies to mediate the equipment andthe rules. We propose a semantic rule language, sigRL, where sensor signals arefirst class citizens. Our language offers a balance of expressive power, usability, andefficiency: it captures most of Siemens data-driven diagnostic rules, significantlysimplifies authoring of diagnostic tasks, and allows to efficiently rewrite semanticrules from ontologies to data and execute over data. We implemented our approachin a semantic diagnostic system, deployed it in Siemens, and conducted experimentsto demonstrate both usability and efficiency.
1 Introduction
Intelligent diagnostic systems play an important role in industry since they help tomaximise equipment’s up-time and minimise its maintenance and operating costs [29].In energy sector companies like Siemens often rely on rule-based diagnostics systemsto analyse power generating equipment by, e.g., testing newly deployed electricitygenerating gas turbines [24], or checking vibration instrumentation [26], performancedegradation [27], and faults in operating turbines. For this purpose diagnostic engineerscreate and use complex diagnostic rule-sets to detect abnormalities during equipment runtime and sophisticated analytical models to combine these abnormalities with models ofphysical aspects of equipment such as thermodynamics and energy efficacy.
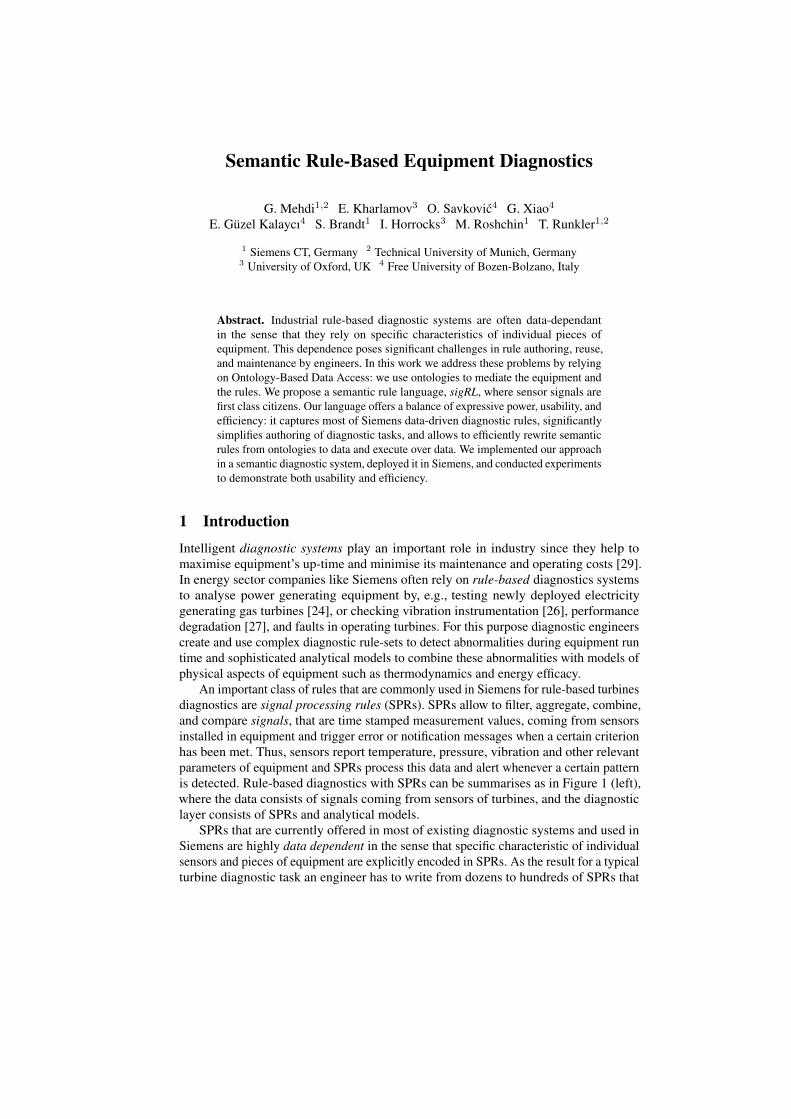
An important class of rules that are commonly used in Siemens for rule-based turbinesdiagnostics are signal processing rules (SPRs). SPRs allow to filter, aggregate, combine,and compare signals, that are time stamped measurement values, coming from sensorsinstalled in equipment and trigger error or notification messages when a certain criterionhas been met. Thus, sensors report temperature, pressure, vibration and other relevantparameters of equipment and SPRs process this data and alert whenever a certain patternis detected. Rule-based diagnostics with SPRs can be summarises as in Figure 1 (left),where the data consists of signals coming from sensors of turbines, and the diagnosticlayer consists of SPRs and analytical models.
SPRs that are currently offered in most of existing diagnostic systems and used inSiemens are highly data dependent in the sense that specific characteristic of individualsensors and pieces of equipment are explicitly encoded in SPRs. As the result for a typicalturbine diagnostic task an engineer has to write from dozens to hundreds of SPRs that

Semantic Condition Monitoring: The Case of Siemens 3
Fig. 1. CMS Architecture [18].
The following section presents details of the current state-of-the-art; section 3describes the requirements and challenges of the existing technologies; section 4 detailsthe proposed solution and high-level architecture; section 5 demonstrates the use-caseand experimental results; and section 6 draws conclusions.
2 Condition Monitoring with Rules2.1 Typical Monitoring Routine
Traditionally, condition monitoring systems relied on manual detection and isolationof the faults based on schematic and meter readings [2]. As equipment became morecomplex, built-in test equipment, simple alarms, and trending analysis were implementedto warn the operators in a timely manner and enable early detection of faults to continueoperational life of a system or subsystem component. Most of the recent implementationsof CM and diagnostic systems follows the architecture as depicted in Figure 2.
First, the failure mode specifications are carried out by domain experts that incor-porates sensor and signal processing techniques. The specification language containsboth the data sources on which the rules operates and the analytic rules that governtheir behaviour. The analytic rules may support a richer set of computation and statisticsfunctions e.g. standard deviations, pearson correlation etc., an advantage that makes thembetter suited to more computationally intensive tasks. The names of the data sourcescorrespond to the sensor tags and their threshold values needed by the rule to work. Andthe sensor tag names are specific to each machine, limiting the analytic rules to exactlyone machine. In order to deploy an analytic rule created for one machine onto the nextone it was necessary to exchange all the sensor tags and configured thresholds mentionedin the specification of the first rule by the corresponding sensor tags and thresholds of the
Equipment
SensorsInstalled in Equipment
Data Signals from
Sensors
Data-Specific Signal
ProcessingRules
AnalyticalModels
Semantic Condition Monitoring: The Case of Siemens 3
Fig. 1. CMS Architecture [18].
The following section presents details of the current state-of-the-art; section 3describes the requirements and challenges of the existing technologies; section 4 detailsthe proposed solution and high-level architecture; section 5 demonstrates the use-caseand experimental results; and section 6 draws conclusions.
2 Condition Monitoring with Rules2.1 Typical Monitoring Routine
Traditionally, condition monitoring systems relied on manual detection and isolationof the faults based on schematic and meter readings [2]. As equipment became morecomplex, built-in test equipment, simple alarms, and trending analysis were implementedto warn the operators in a timely manner and enable early detection of faults to continueoperational life of a system or subsystem component. Most of the recent implementationsof CM and diagnostic systems follows the architecture as depicted in Figure 2.
First, the failure mode specifications are carried out by domain experts that incor-porates sensor and signal processing techniques. The specification language containsboth the data sources on which the rules operates and the analytic rules that governtheir behaviour. The analytic rules may support a richer set of computation and statisticsfunctions e.g. standard deviations, pearson correlation etc., an advantage that makes thembetter suited to more computationally intensive tasks. The names of the data sourcescorrespond to the sensor tags and their threshold values needed by the rule to work. Andthe sensor tag names are specific to each machine, limiting the analytic rules to exactlyone machine. In order to deploy an analytic rule created for one machine onto the nextone it was necessary to exchange all the sensor tags and configured thresholds mentionedin the specification of the first rule by the corresponding sensor tags and thresholds of the
Data Driven Approach
SensorsInstalled in Equipment
Data Signals from Sensors
VirtualAbstract Signals
AnalyticalModels
Semantic Condition Monitoring: The Case of Siemens 3
Fig. 1. CMS Architecture [18].
The following section presents details of the current state-of-the-art; section 3describes the requirements and challenges of the existing technologies; section 4 detailsthe proposed solution and high-level architecture; section 5 demonstrates the use-caseand experimental results; and section 6 draws conclusions.
2 Condition Monitoring with Rules2.1 Typical Monitoring Routine
Traditionally, condition monitoring systems relied on manual detection and isolationof the faults based on schematic and meter readings [2]. As equipment became morecomplex, built-in test equipment, simple alarms, and trending analysis were implementedto warn the operators in a timely manner and enable early detection of faults to continueoperational life of a system or subsystem component. Most of the recent implementationsof CM and diagnostic systems follows the architecture as depicted in Figure 2.
First, the failure mode specifications are carried out by domain experts that incor-porates sensor and signal processing techniques. The specification language containsboth the data sources on which the rules operates and the analytic rules that governtheir behaviour. The analytic rules may support a richer set of computation and statisticsfunctions e.g. standard deviations, pearson correlation etc., an advantage that makes thembetter suited to more computationally intensive tasks. The names of the data sourcescorrespond to the sensor tags and their threshold values needed by the rule to work. Andthe sensor tag names are specific to each machine, limiting the analytic rules to exactlyone machine. In order to deploy an analytic rule created for one machine onto the nextone it was necessary to exchange all the sensor tags and configured thresholds mentionedin the specification of the first rule by the corresponding sensor tags and thresholds of the
Semantic Condition Monitoring: The Case of Siemens 3
Fig. 1. CMS Architecture [18].
The following section presents details of the current state-of-the-art; section 3describes the requirements and challenges of the existing technologies; section 4 detailsthe proposed solution and high-level architecture; section 5 demonstrates the use-caseand experimental results; and section 6 draws conclusions.
2 Condition Monitoring with Rules2.1 Typical Monitoring Routine
Traditionally, condition monitoring systems relied on manual detection and isolationof the faults based on schematic and meter readings [2]. As equipment became morecomplex, built-in test equipment, simple alarms, and trending analysis were implementedto warn the operators in a timely manner and enable early detection of faults to continueoperational life of a system or subsystem component. Most of the recent implementationsof CM and diagnostic systems follows the architecture as depicted in Figure 2.
First, the failure mode specifications are carried out by domain experts that incor-porates sensor and signal processing techniques. The specification language containsboth the data sources on which the rules operates and the analytic rules that governtheir behaviour. The analytic rules may support a richer set of computation and statisticsfunctions e.g. standard deviations, pearson correlation etc., an advantage that makes thembetter suited to more computationally intensive tasks. The names of the data sourcescorrespond to the sensor tags and their threshold values needed by the rule to work. Andthe sensor tag names are specific to each machine, limiting the analytic rules to exactlyone machine. In order to deploy an analytic rule created for one machine onto the nextone it was necessary to exchange all the sensor tags and configured thresholds mentionedin the specification of the first rule by the corresponding sensor tags and thresholds of the
Semantic Condition Monitoring: The Case of Siemens 3
Fig. 1. CMS Architecture [18].
The following section presents details of the current state-of-the-art; section 3describes the requirements and challenges of the existing technologies; section 4 detailsthe proposed solution and high-level architecture; section 5 demonstrates the use-caseand experimental results; and section 6 draws conclusions.
2 Condition Monitoring with Rules2.1 Typical Monitoring Routine
Traditionally, condition monitoring systems relied on manual detection and isolationof the faults based on schematic and meter readings [2]. As equipment became morecomplex, built-in test equipment, simple alarms, and trending analysis were implementedto warn the operators in a timely manner and enable early detection of faults to continueoperational life of a system or subsystem component. Most of the recent implementationsof CM and diagnostic systems follows the architecture as depicted in Figure 2.
First, the failure mode specifications are carried out by domain experts that incor-porates sensor and signal processing techniques. The specification language containsboth the data sources on which the rules operates and the analytic rules that governtheir behaviour. The analytic rules may support a richer set of computation and statisticsfunctions e.g. standard deviations, pearson correlation etc., an advantage that makes thembetter suited to more computationally intensive tasks. The names of the data sourcescorrespond to the sensor tags and their threshold values needed by the rule to work. Andthe sensor tag names are specific to each machine, limiting the analytic rules to exactlyone machine. In order to deploy an analytic rule created for one machine onto the nextone it was necessary to exchange all the sensor tags and configured thresholds mentionedin the specification of the first rule by the corresponding sensor tags and thresholds of the
Ontologies
SemanticSignalProcessingRules
Abs
trac
tion
Laye
r
Semantic Condition Monitoring: The Case of Siemens 3
Fig. 1. CMS Architecture [18].
The following section presents details of the current state-of-the-art; section 3describes the requirements and challenges of the existing technologies; section 4 detailsthe proposed solution and high-level architecture; section 5 demonstrates the use-caseand experimental results; and section 6 draws conclusions.
2 Condition Monitoring with Rules2.1 Typical Monitoring Routine
Traditionally, condition monitoring systems relied on manual detection and isolationof the faults based on schematic and meter readings [2]. As equipment became morecomplex, built-in test equipment, simple alarms, and trending analysis were implementedto warn the operators in a timely manner and enable early detection of faults to continueoperational life of a system or subsystem component. Most of the recent implementationsof CM and diagnostic systems follows the architecture as depicted in Figure 2.
First, the failure mode specifications are carried out by domain experts that incor-porates sensor and signal processing techniques. The specification language containsboth the data sources on which the rules operates and the analytic rules that governtheir behaviour. The analytic rules may support a richer set of computation and statisticsfunctions e.g. standard deviations, pearson correlation etc., an advantage that makes thembetter suited to more computationally intensive tasks. The names of the data sourcescorrespond to the sensor tags and their threshold values needed by the rule to work. Andthe sensor tag names are specific to each machine, limiting the analytic rules to exactlyone machine. In order to deploy an analytic rule created for one machine onto the nextone it was necessary to exchange all the sensor tags and configured thresholds mentionedin the specification of the first rule by the corresponding sensor tags and thresholds of the
SigR
L R
ule
Lang
uage
Equipment
Semantic Approach
Dat
a La
yer
Dia
gnos
tic L
ayer
Fig. 1. General scheme of diagnostics with signal-processing rules. Left: data driven approach.Right: semantic approach.
involve hundreds of sensor tags, component codes, sensor and threshold values as well asequipment configuration and design data. For example, a typical Siemens gas turbine hasabout 2,000 sensors and a diagnostic task to detect whether the purging1 in over can becaptured with 300 SPRs. We now illustrate diagnostic tasks and corresponding SPRs on arunning example.
Example 1 (Purging Running Example). Consider the purging diagnostic task:
Verify that the purging is over in the main flame component of the turbine T1.
Intuitively this task requires to check in the turbine T1 that: (i) the main flame wason for at least 10s and then stopped, (ii) 15s after this, the purging of rotors in thestarting-component of T1 started, (iii) 20s after this, the purging stopped. The fact thatthe purging of a rotor started or ended can be detected by analysing its speed, that it, bycomparing the average speed of its speed sensors with purging thresholds that are specificfor individual rotors. Let us assume that the first rotor in the starting-component of T1has three speed sensors ‘S21R1T1’,‘S22R1T1’, and ‘S23R1T1’ and that the 1.300 and800 rotations respectively indicate that the purging starts and ends. Then, the followingdata dependent SPRs written in a syntax similar to the one of Siemens SPRs can be usedto detect that purging has started and ended:
$PurgStartRotor1 : truth(avg(‘S21R1T1’, ‘S22R1T1’, ‘S23R1T1’), > 1.300). (1)
$PurgStopRotor1 : truth(avg(‘S21R1T1’, ‘S22R1T1’, ‘S23R1T1’), < 800). (2)
Here $PurgStartRotor1 and $PurgStopRotor1 are variables that store those averagetime stamped values of measurements (from the three speed sensors in the first rotor ofT1) that passed the threshold. Complete encoding of the purging task for an average
1 Purging is the process of flushing out liquid fuel nozzles or other parts which may containundesirable residues.

Siemens turbine requires to write around 300 SPRs some of which are as in the runningexample. Many of these SPRs differ only on specific sensor identifiers and the number ofspeed signals to aggregate. Adapting these SPRs to another turbine will also require tochange a lot of identifiers. For example, in another turbine T2 the rotor may have thepurging threshold values 1.000 and 700 and contain four sensors ‘S01R2T2’,‘S02R2T2’,‘S03R2T2’, and ‘S04R2T2’ and thus the corresponding start and stop purging rules willbe as above but with these new sensors ids and threshold values. ut
Data dependence of SPRs poses three significant challenges for diagnostic engineersin (i) authoring, (ii) reuse, and (iii) maintenance of SPRs. Indeed, authoring such rules istime consuming and error prone, e.g., while aggregating the speed signals from a givenrotor one has ensure that all the relevant speed signals are included in the aggregationand that other signals, e.g., temperature signals, are not included. As the result, in theoverall time that a Siemens engineer spends on diagnostics up to 80% is devoted to ruleauthoring where the major part of this time is devoted to data access and integration [19].Reuse of such rules is limited since they are too specific to concrete equipment and inmany cases it is easier to write a new rule set than to understand and adapt an existingone. As the result, over the years Siemens has acquired a huge library of SPRs with morethan 200,000 rules and it constantly grows. Maintenance of such SPRs is also challengingand require significant manual work since there is limited semantics behind them.
Adding Semantics to SPRs. Semantic technologies can help in addressing these threechallenges. An ontology can be used to abstractly represent sensors and backgroundknowledge about turbines including locations of sensors, structure and characteristics ofturbines. Then, in the spirit of Ontology Based Data Access (OBDA) [25], the ontologycan be ‘connected’ to the data about the actual turbines, their sensors and signals withthe help of declarative mapping specifications. OBDA has recently attracted a lot ofattention by the research community: a solid theory has been developed, e.g. [7, 28], anda number of mature systems have been implemented, e.g. [5, 6]. Moreover, OBDA hasbeen successfully applied in several industrial applications, e.g. [8, 15, 14, 17].
Adopting OBDA for rule-based diagnostics in Siemens, however, requires a rulebased language for SPRs that enjoys the following features:
(i) Signals orientation: The language should treat signals as first class citizens andallow for their manipulation: to filter, aggregate, combine, and compare signals;
(ii) Expressiveness: The language should capture most of the features of the Siemensrule language used for diagnostics;
(iii) Usability: The language should be simple and concise enough so that the engineerscan significantly save time in specifying diagnostic tasks;
(iv) Efficiency: The language should allow for efficient execution of diagnostic tasks.To the best of our knowledge no rule language exists that fulfills all these requirements(see related work in Section 5 for more details).
Contributions. In this work we propose to extend the traditional data driven approachto diagnostics with an OBDA layer and a new rule language to what we call SemanticRule-based Diagnostics. Our approach is schematically depicted in Figure 1 (right).To this end we propose a language sigRL for SPRs that enjoys the four requirementsabove. Our language allows to write SPRs and complex diagnostic tasks in an abstract
fashion and to exploit both ontological vocabulary and queries over ontologies to identifyrelevant sensors and data values. We designed the language in such a way that, on theone hand, it captures the main signal processing features required by Siemens turbinediagnostic engineers and, on the other hand, it has good computational properties. Inparticular, sigRL allows for rewriting [7] of diagnostic rule-sets written over OWL 2 QLontologies2 into multiple data-dependent rule-sets with the help of ontologies and OBDAmappings. This rewriting allows to exploit standard infrastructure, including the one usedin Siemens, for processing data-dependent SPRs.
We implemented sigRL and a prototypical Semantic Rule-based Diagnostic system.We deployed our implementation in Siemens over 50 Siemens gas turbines and evaluatedthe deployment with encouraging results. We evaluated usability of our solution withSiemens engineers by checking how fast they are in formulating diagnostic tasks insigRL. We also evaluated the efficiency of our solution in processing diagnostic tasks overturbine signals in a controlled environment. Currently, our deployment is not included inthe production processes, it is a prototype that we plan to evaluate and improve furtherbefore it can be used in production.
2 Signal Processing Language sigRLIn this section we introduce our signal processing language sigRL. It has three components:(i) Basic signals that come from sensors; (ii) Knowledge Bases (KBs) that capturebackground knowledge of equipment and signals as well as concrete characteristics ofthe equipment that undergoing diagnostics, and (iii) Signal processing expressions thatmanipulate basic signals using mathematical functions and queries over KBs.
Signals. In our setting, a signal is a first-class citizen. A signal s is a pair (os, fs) whereos is sensor id and signal function fs defined on R to R ∪ {⊥}, where ⊥ denotes theabsence of a value. A basic signal is a signal which reading is obtained from a singlesensor (e.g., in a turbine) for different time points. In practice, it may happen that a signalhave periods without identified values. Also, such periods are obtained when combiningand manipulating basic signals. We say that a signal s is defined on a real interval I if ithas a value for each point of the interval, ⊥ 6∈ fs(I). For technical reasons we introduceundefined signal function f⊥ that maps all reals into ⊥. In practice signals are typicallystep functions over time intervals since they correspond to sensor values delivered withsome frequency. In our model, we assume that we are given a finite set of basic signalsS = {s1, . . . , sn}.
Knowledge Bases and Queries. A Knowledge Base K is a pair of an ontology O and adata set A. An ontology describes background knowledge of an application domain in aformal language. We refer the reader to [7] for detailed definitions of ontologies. In oursetting we consider ontologies that describe general characteristics of power generatingequipment which includes partonomy of its components, characteristics and locations ofits sensors, etc. As an example consider the following ontological expression that saysthat RotorSensor is a kind of SpeedSensor:
SubClassOf(RotorSensor SpeedSensor). (3)
2 OWL 2 QL is the W3C standardised ontology language that is intended for OBDA.
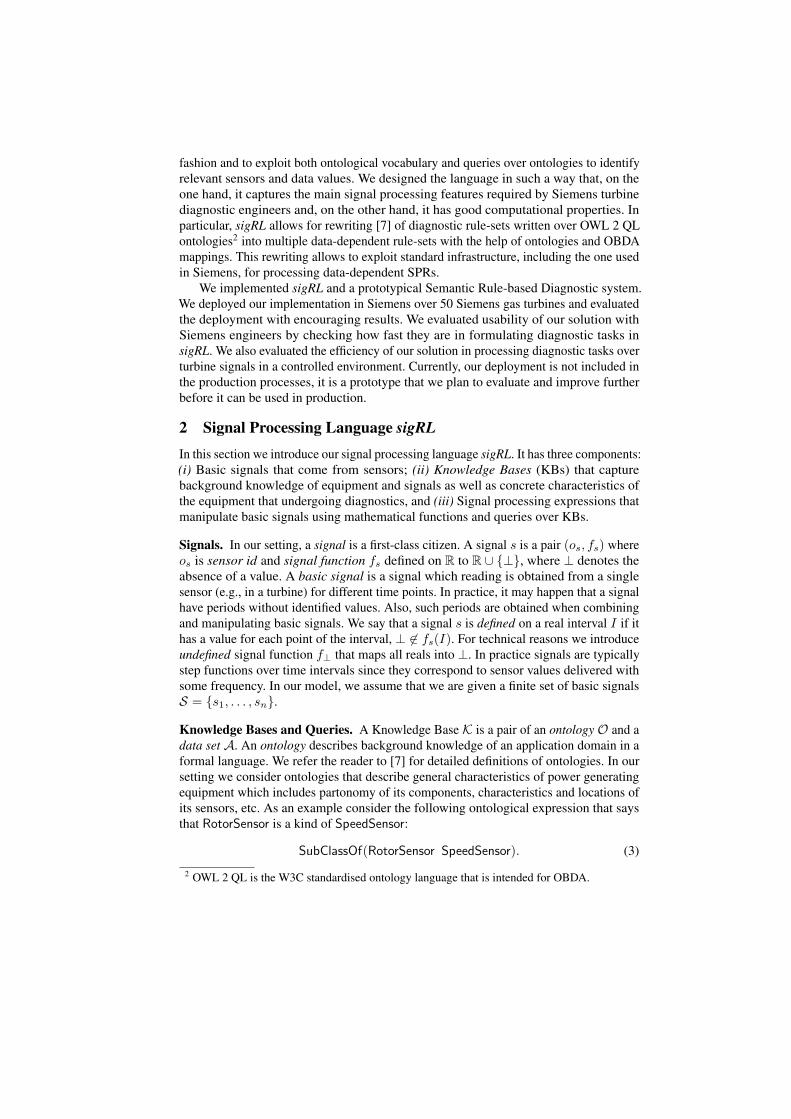
C = Concept C contains
Q all signal ids return by Q evaluated over the KB.α ◦ C1 one signal s′ for each signal s in C1 with fs′ = α ◦ fs.C1 : value(�, α) one signal s′ for each signal s in C1 with fs′(t) = α� fs(t)
if fs(t)� α at time point t; otherwise fs′(t) = ⊥.C1 : duration(�, t′) one signal s′ for each signal s in C1 with fs′(t) = fs(t)
if exists an interval I such that: fs is defined I , t ∈ I andsize(I)� t′; otherwise fs′(t) = ⊥.
{s1, . . . , sm} all enumerated signal {s1, . . . , sm}.C = agg C1 one signal s′ with fs′(t) = aggs∈C1
fs(t), that is, s′ is obtained fromall signals in C1 by applying the aggregate agg at each time point t.
C1 : align C2 a signal s1 from C1 if: there exists a signal s2 from C2 that is alignedwith s1, i.e., for each time interval I1 where fs1 is defined there isan interval I2 where fs2 is defined s.t. I1 aligns with I2.
Table 1. Meaning of signal processing expressions. For the interval I , size(I) is its size. Forintervals I1, I2 the alignment is: “I1 within I2” if I1 ⊆ I2; “I1 after[t] I2” if all points of I2 areafter I1 and the start of I2 is within the end of I1 plus period t; “I1 before[t] I2” if “I2 start[t] I1”.
Data sets of KBs consist of data assertions enumerating concrete sensors, turbines, andtheir components. The following assertions says that sensors ‘S21R1T1’, ‘S22R1T1’ and‘S23R1T1’ are all rotor sensors:
ClassAssertion(RotorSensor ‘S21R1T1’),ClassAssertion(RotorSensor ‘S22R1T1’),
ClassAssertion(RotorSensor ‘S23R1T1’). (4)
In order to enjoy favorable semantic and computational characteristics of OBDA,we consider well-studied ontology language OWL 2 QL that allows to express subclass(resp. sub-property) axioms between classes and projections of properties (resp. corollarybetween properties). We refer the reader to [7] for details on OWL 2 QL.
To query KBs we rely on conjunctive queries (CQs) and certain answer semanticsthat have been extensively studied for OWL 2 QL KBs and proved to be tractable [7]. Forexample, the following CQ returns all rotor sensors from start component:
rotorStart(x)← rotorSensor(x) ∧ locatedIn(x, y) ∧ startComponent(y). (5)
Signals Processing Expressions. Now we introduce signal expressions that filter andmanipulate basic signals and create new complex signals. Intuitively, in our language wegroup signals into ontological concepts and signal expression are defined on the level ofconcepts. Then, a signal processing expression is recursively defined as follows:
C = Q | C1 : value(�, α) | {s1, . . . , sm} | agg C1 |α ◦ C | C1 : duration(�, t) | C1 : align C2
where C is a concept, Q is a CQ, ◦ is in {+,−,×, /}, agg is in {min,max, avg, sum},α ∈ R, � ∈ {<,>,≤,≥} and align ∈ {within, after[t], before[t]} where t is a period.
The formal meaning of signal processing expressions is defined in Table 1. In order tomake the mathematics right, we assume that c◦⊥ = ⊥◦c = ⊥ and c�⊥ = ⊥�c = falsefor c ∈ R, and analogously we assume for aggregate functions. If the value of a signalfunction at a time point is not defined with these rules, then we define it as ⊥.
Example 2. The start and end of a purging process data-driven rules as in Equations (1)and (2) from the running example can be expressed in sigRL as follows:
PurgingStart = avg rotorStart : value(>, purgingSpeed), (6)PurgingStop = avg rotorStart : value(<, nonPurgingSpeed). (7)
Here, rotorStart is the CQ defined in Equation (5). For brevity we do not introducea new concept for each expression but we just join them with symbol “:”. ConstantspurgingSpeed and nonPurgingSpeed are parameters of an analysed turbine, and they areinstantiated from the turbine configuration when the expressions are evaluated. ut
Diagnostic Programs and Messages. We now show how to use signal expressions tocompose diagnostic programs and to alert messages. In the following we will considerwell formed sets of signal expressions, that is, sets where each concept is defined at mostonce and where definitions of new concepts are assumed to be acyclic: if C1 is used todefine C2 (directly or indirectly) then C1 cannot be defined (directly or indirectly) usingC1.
A diagnostic program (or simply program) Π is a tuple (S,K,M) where S is a setof basic signals, K is a KB,M is a set of well formed signal processing expressions suchthat each concept that is defined inM does not appear in K.
Example 3. The running example program Π = (S,K,M) has the following compo-nents: sensors S = {‘S21R1T1’, ‘S22R1T1’, ‘S23R1T1’}, KB K that consists of axiomsfrom Equations (3)–(4), andM that consists of expressions from Equations (6)–(7). ut
A message rule is a rule of the form, where C is a concept and m is a (text) message:
message(m) = C.
Example 4. Using expressions (6) and (7) we define the following message:
message(“Purging over”) = FlameSensor : duration(>, 10s) :
after[15s] PurgingStart : after[20s] PurgingStop (8)
The message intuitively indicates that the purging is over. ut
Now we are ready to define the semantics of the rules, expression and programs.
Semantics of sigRL. We now define how to determine whether a program Π fires a ruler. To this end, we extend first-order interpretations that are used to define semantics ofOWL 2 KBs. In OWL 2 a first class citizen is an object o and interpretation is definingwhether C(o) is true or not for particular concept C. In our scenario, domain of objectsis a domain of sensor ids (basic or ones defined by expressions). Thus each object o isalso having assigned function fo that represents the signal value of that object. Obviously,an identifier o can also be an id of a turbine component that does not have signal function.At the moment, (since it is not crucial for this study and it simplifies the formalism) wealso assign undefined signal f⊥ to such (non-signal) objects.
Formally, our interpretation I is a pair (IFOL, IS) where IFOL interprets objects andtheir relationships (like in OWL 2) and IS interprets signals. First, we define how I

interprets basic signals. Given a set of signals for an interpretation I: SI = {sI1 , . . . , sIn}s.t. IFOL ‘returns’ the signal id, sIFOL = os and IS ‘returns’ the signal itself, sIS = s.
Now we can define how I interprets KBs. Interpretation of a KB KI extendsthe notion of first-order logics interpretation as follows: KIFOL is a first-order logicsinterpretation K and KIS is defined for objects, concepts, roles and attributes followingSI . That is, for each object o we define oIS as s if o is the id of s from S; otherwise(o, f⊥). Then, for a concept A we define AIS = {sIS | oIFOL
s ∈ AIFOL}. Similarly, wedefine ·IS for roles and attributes.
Finally, we are ready to define I for signal expressions and we do it recursivelyfollowing the definitions in Table 1. We now illustrate some of them. For example, ifC = {s1, . . . , sm}, then CI = {sI1 , . . . , sIm}; if C = Q then CIFOL = QIFOL whereQIFOL is the evaluation of Q over IFOL and CIS = {s | oIFOL
s ∈ QIFOL}, provided thatIFOL is a model of K. Otherwise we define CI = ∅. Similarly, we define interpretationof the other expressions.
Firing a Message. Let Π be a program and ‘r : message(m) = C’ a message rule.We say that Π fires message r if for each interpretation I = (IFOL, IS) of Π it holdsCIFOL 6= ∅, that is, the concept that fires r is not empty. Our programs and rules enjoy thecanonical model property, that is, each program has a unique (Hilbert) interpretation [3]which is minimal and can be constructed starting from basic signals and ontology byfollowing signal expressions. Thus, one can verify CIFOL 6= ∅ only on the canonicalmodel. This implies that one can evaluate sigRL programs and expressions in a bottom-upfashion. We now illustrate this approach on our running example.
Example 5. Consider our running program Π from Example 3 and its canonical interpre-tation IΠ . First, for each query Q inM we evaluate Q over KB K by computing QIΠ .In our case, the only query is rotorStart that collects all sensor ids for a particular turbine.Then, we evaluate the expressions inM following the dependency graph of definitions.We start by evaluation the expression from Equation (6), again in a bottom-up fashion.Concept rotorStartIΠ contains sensor ids: ‘S21R1T1’, ‘S22R1T1’ and ‘S23R1T1’. At thesame time, those sensors have signal functions assigned from SIΠ . Let us call them f1, f2and f3. Expression avg rotorStart computes a new signal, say s4, by taking average off1, f2 and f3 at each time point. After this, value(>, purgingSpeed) eliminates all valuesof s4 that are not > purgingSpeed. Similarly, we compute signal transformations forthe expression from Equation (6). Finally, we use those two expressions to evaluate themessage rule from Equation (8). If there exists at least one FlameSensor that aligns withone signal in evaluated expressions corresponding to Equations (6) and (7), then themessage is fired. ut
3 System Implementation and Deployment in Siemens
System Implementation. The main functionality of our Semantic Rule-based Diag-nostics system is to author sigRL diagnostic programs, to deploy them in turbines, toexecute the programs, and to visualise the results of execution. We now give details ofour system by following its architecture in Figure 2. There are four essential layers inthe architecture: application, OBDA, rule execution, and data. Our system is mostlyimplemented in Java. We now discuss the system layer by layer.

semantic error messages
Calls for ontologies and mappings
Rule processing workflow
OBDALayer
Rewriting of Rules and Queries
Unfolding: Rules, Queries; Transformation: Msg, Ans
enriched semantic rule-sets
service data
semantic rule-sets
data levelerror mesaages
ApplicationLayer
Data Layer
data level rule-setsand queries
Ontology
file
System modules
Ontology, mappingsin a triple store
Rule
Pro
cess
ing
Mappings:Data-to-Ontologies
Rule Formulation Component
Semantic Wiki: visualisation, tracking
sensor data
design data
event data
Legend
databases
Rule Execution InfrustructureExecutionLayer
Fig. 2. Architecture of our Semantic Rule-based Diagnostics system.
On the application layer, the system offers two user-oriented modules. The firstmodule allows engineers to author, store, and load diagnostic programs by formulatingsets of SPRs in sigRL and sensor retrieving queries. Such formulation is guided by thedomain ontology stored in the system. In Figure 3 (top) one can observe a screenshot ofthe SPR editor which is embedded in the Siemens analytical toolkit. Another module isthe semantic Wiki that allows among other features to visualize signals and messages(triggered by programs), and to track deployment of SPRs in equipment. In Figure 3(center) one can see visualization of signals from two components of one turbine.Diagnostic programs formulated in the application layer are converted into XML-based specifications and sent to the OBDA layer, which returns back the messages andmaterialized semantic signals, that is, signals over the ontological terms. In Figure 3(bottom) one can see an excerpt from an XML-based specification. We rely on RESTAPI to communicate between the application layer and the OBDA layer of our systemand OWL API to deal with ontologies.
Note that during the course of the project we have developed an extension to theexisting Siemens rule editor and a dedicated wiki-based visualisation monitor for semanticsignals. Note that we use the latter for visualising query answers and messages formattedaccording to the Siemens OWL 2 ontology and stored as RDF.
The OBDA layer takes care of transforming SPRs written in sigRL into either SPRswritten in the Siemens data-driven rule language (in order to support the existing SiemensIT infrastructure) or SQL. This transformation has two steps: rewriting of programs andqueries with the help of ontologies (at this step both programs and queries are enrichedwith the implicit information from the ontology), and then unfolding them with thehelp of mappings. For this purpose we extended the query transformation module ofthe Optique platform [19, 15, 13, 11, 12] which we were developing earlier within theOptique project [10]. The OBDA layer also transforms signals, query answers, andmessages from the data to semantic representation. 3
3 In this work we assume that RDF is the semantic data representation.

Fig. 3. Screenshots: SPR editor (top), Wiki-based visualisation monitor for semantic signals(centre), and a fragment of an XML-based specification of an SPR (bottom).
The rule execution layer takes care of planning and executing data-driven rules andqueries received from the OBDA layer. If the received rules are in the Siemens SPRlanguage then the rule executor instantiates them with concrete sensors extracted withqueries and passes them to the Drools Fusion (drools.jboss.org/drools-fusion.html) the engine used by Siemens. If the received rules are in SQL then it plans theexecution order and executes them together with the other queries. To evaluate theefficiency of our system in Section 4 we assume that the received rules are in SQL.Finally, on the data layer we store all the relevant data: turbine design specifications,historical information about services that were performed over the turbines, previouslydetected events, and the raw sensor signals.
Deployment at Siemens. We deployed our Semantic Rule-Based Diagnostics system onthe data gathered for 2 years from 50 gas power generating turbines. We rely on Teradatafor signals and MS SQL for other information. For rule processing, we connected oursystem to the Siemens deployment of Drools Fusion.
An important aspect of the deployment was the development of a diagnostic ontologyand mappings. Our ontology was inspired by the (i) Siemens Technical System Ontology(TSO) and Semantic Sensor Network Ontology (SSN) and (ii) the international standardsIEC 81346 and ISO/TS 16952-10. The development of the ontology was a joint effortof domain experts from Siemens businesses units together with the specialist from theSiemens Corporate Technology. Our ontology consists of four modules and it is expressedin OWL 2 QL. In order to connect the ontology to the data, we introduced 376 R2RMLmappings. Note that the development of the ontology and mappings is done offline andit does not affect the time the engineers spend to author rules when they do turbinediagnostics. We now go through the ontology modules in more detail.

tso:DeploymentSite
tso:Equipment
tso:FunctionalGroup
tso:Configuration
tso:PhysicalComponent
ssn:SensingDevice
tso:DiagnosticRule
tso:DeploymentSiteOf
tso:hasConfiguration
tso:operatesOn
tso:hasSensingDevice dul:isPaticipantIn
ssn:Property
ssn:MeasurementCap
ssn:SensorOutput
sss:observes ssn:hasMeasurementCap
ssn:isProducedBy
ssn:ObservedProperty
ssn:hasObservedProperty
ssn:ObservationValue
ssn:hasValuessn:observationResult ssn:Measur
ementRnge
tso:hasRangetso:SignalProcessinRule
ISA
tso:Identifier
tso:creationDate
tso:RuleDescription
tso:RuleCategory
tso:Operation
tso:hasFunctionalGroup
tso:hasSensorInput
Fig. 4. A fragment of the Siemens ontology that we developed to support turbine diagnostic SPRs.
The main module of our ontology in partially depicted in Figure 4 where in greywe present SSN and with white TSO terms. This module has 48 classes and 32 objectand data properties. The other three modules are respectively about equipment, sensingdevices, and diagnostic rules. They provide detailed information about the machines, theirdeployment profiles, sensor configurations, component hierarchies, functional profilesand logical bindings to the analytical rule definitions. More precisely:
– The Equipment module describes the internal structure of an industrial system. Themain classes of the module are DeploymentSite and Equipment and they describethe whole facility of system and machines that have been physically deployed andmonitored. It also defines the system boundaries, substantial descriptions of thesystem environment, set of components it operates on, part-of relations, systemconfigurations and functional grouping of components. For example, it encodes thatevery Equipment should have an ID, Configuration and at least one Component tooperate on, and an optional property hasProductLine.
– The Sensing Device module is inspired by the SSN ontology. In particular, wereuse and extend the class SensingDevice. The module describes sensors, theirproperties, outputs, and observations. One of our extensions comparing to SSN isthat the measurement capabilities can now include measurement property range i.e.maximum and minimum values (which we encode with annotations in order to keepthe ontology in OWL 2 QL). For example, VibrationSensor is a sensing device thatobserves Vibration property and measures e.g. BearingVibrations.
– The Diagnostic Rules module introduces rules and relate them to e.g., Description,Category, and Operation classes. For example, using this module one can say thatSignalProcessingRule is of a type DiagnosticRule, that it has certain Operation andit may have different sensor data input associated with its operation.
4 Siemens Experiments
In this section, we present two experiments. The first experiment is to verify whetherwriting diagnostic programs in sigRL offers a considerable time saving comparing towriting the programs in the Siemens data dependent rule language. The second experiment

# Age Occupation Education Tech. skills Similar tools Sem. WebP1 43 Design Engineer PhD 3 3 yesP2 46 Senior Diagnostic Engineer PhD 4 1 yesP3 37 Diagnostic Engineer MSc 5 4 yesP4 45 R&D Engineer MSc 4 4 yesP5 34 Software Engineer BSc 3 3 yesP6 33 Data Scientist PhD 3 1 yes
Table 2. Profile information of participants.Complexity # sensor tags # event msg # code lines Monitoring task
T1 Low 4 2 102 Variable guided vanes analysesT2 Low 6 5 133 Multiple start attemptsT3 Low 6 3 149 Lube oil system analyses
T4 Medium 6 2 231 Monitoring turbine statesT5 Medium 18 0 282 Interduct thermocouple analysesT6 Medium 16 2 287 Igniter failure detection
T7 High 17 3 311 Bearing carbonisationT8 High 19 2 335 Combustion chamber dynamicsT9 High 15 4 376 Gearbox Unit ShutdownT10 High 12 8 401 Surge detection
Table 3. Diagnostic tasks for Siemens gas turbines that were used in the user study, wherecomplexity is defined using the number of sensor tags, event messages, and lines of code.
is to evaluate the efficiency of the SQL code generated by our OBDA component (seeSection 3 for details on our OBDA component).
Preliminary User Study. We conducted a preliminary user study in Siemens with 6participants, all of them are either engineers or data scientists. In Table 2 we summariserelevant information about the participants. All of them are mid age, most have at least anMSc degree, and all are familiar with the basic concepts of the Semantic Web. Theirtechnical skills in the domain of diagnostics are from 3 to 5. We use a 5-scale rangewhere 1 means ‘no’ and ‘5’ means ‘definitely yes’. Two out of six participants never sawan editor for diagnostic rules, while the other four are quite familiar with rule editors.
During brainstorming sessions with Siemens power generation analysts and R&Dpersonnel from Siemens Corporate Technology we selected 10 diagnostic tasks which canbe found in Table 3. The selection criteria were: diversification on topics and complexity,as well as relevance for Siemens. The tasks have three complexity levels (Low, Medium,and High) and they are defined as a weighted sum of the number of sensor tags, eventmessages, and lines of code in a task.
Before the study we gave the participants a short introduction with examples aboutdiagnostic programs and message rules in both Siemens and sigRL languages. We alsoexplained them the constructs of sigRL, presented them our diagnostic ontology, andexplained them the data. The data was from 50 Siemens gas turbines and includedsensor measurement, that is, temperature, pressure, rotor speed, and positioning, andassociated configuration data, that is, types of turbines and threshold values. Duringthe study participants were authoring diagnostic programs for the tasks T1 to T10 fromTable 3 using both existing Siemens rule language (as the baseline) and sigRL; while

0
100
200
300
400
T1 T2 T3 T4 T5 T6 T7 T8 T9 T10
5turbines Baseline Seman6c
020040060080010001200
T1 T2 T3 T4 T5 T6 T7 T8 T9T10
50turbines Baseline Seman6c
050
100150200250
T1 T2 T3 T4 T5 T6 T7 T8 T9 T10
1turbine Baseline Seman6c
0
200
400
600
800
T1 T2 T3 T4 T5 T6 T7 T8 T9 T10
10turbines Baseline Seman6c
0.00
300.00
600.00
900.00
1200.00
1500.00
1800.00
2100.00
S B S B S B S B
1 5 10 50
Low(T1-T3) Medium(T4-T6) High(T7-T10)
Fig. 5. Results of the user study. Left four figures: the average time in seconds that the users tookto express the tasks T1-T10 for 1, 5, 10, and 50 turbines using existing Siemens rule language(Baseline or B) and our semantic rule language sigRL (Semantic or S). Right figure: the total timein seconds the user took to express the tasks grouped according to their complexity.
we were recording the authoring time. Note that all participants managed to write thediagnostic tasks correctly and the study was conducted on a standard laptop.
Figure 5 summarises the results of the user study. The four left figures present theaverage time that the six participants took to formulate the 10 tasks over respectively 1, 5,10, and 50 turbines. We now first discuss how the authoring time changes within each ofthe four figures, that is, when moving from simple to complex tasks, and then across thefour figures, that is, when moving from 1 to 50 turbines.
Observe that in each figure one can see that in the baseline case the authoring time ishigher than in the semantic case, i.e., when sigRL is used. Moreover, in the semantic casethe time only slightly increases when moving from simple (T1-T3) to complex (T7-T10)tasks, while in the baseline case it increases significantly: from 2 to 4 times. The reasonis that in the baseline case the number of sensor tags makes a significant impact on theauthoring time: each of this tags has to be found in the database and included in therule, while in the semantic case the number of tags does not make any impact sinceall relevant tags can be specified using queries. The number of event messages and thestructure of rules affects both the baseline and the semantic case, and this is the reasonwhy the authoring time grows in the semantic case when going from rules with low tohigh complexity.
Now consider how the authoring time changes for a given tasks when moving from 1to 50 turbines. In the baseline case, moving to a higher number of turbines requires toduplicate and modify the rules by first slightly modifying the rule structure (to adapt therules to turbine variations) and then replacing concrete sensors tags, threshold values, etc.In the semantic case, moving to a higher number of turbines requires only to modify therule structure. As the result, one can see that in the semantic case all four semantic plotsare very similar: the one for 50 turbines is only about twice higher than for 1 turbine.Indeed, to adapt the semantic diagnostic task T4 from 1 to 50 turbines the participants inaverage spent 50 seconds, while formulating the original task for 1 turbine took themabout 30 seconds.
Finally, let us consider how the total time for all 10 tasks changes when moving from1 to 50 turbines. This information is in Figure 5 (right). One can see that in the baselinecase the time goes from 400 to 2.100 seconds, while in the semantic case it goes from 90

Diagnostics Task D1: “Is there a ramp change after 6 min in the turbine T100?”:
SlowRotor = minRotorSensor : value(<, slowSpeed) : duration(>, 30s).
FastRotor = maxRotorSensor : value(>, fastSpeed) : duration(>, 30s).
RampChange = FastRotor : after[6m] SlowRotor.
message(“Ramp change”) = RampChange.
Diagnostic Task D3: “Does the turbine T100 reach purging and ignition speed for 30 sec?”:
Ignition = avg RotorSensor : value(<, ignitionSpeed).
PurgeAndIgnition = PurgingStart : duration(>, 30s) :
after[2m] Ignition : duration(>, 30s).
message(“Purging and Ignition”) = PurgeAndIgnition.
Diagnostics Task D4: “Does the turbine T100 go from ignition to stand still within 1min and thenstand still for 30 sec?”:
StandStill = avg RotorSensor : value(<, standStillSpeed).
IgnitionToStand = Ignition : duration(>, 1m) :
after[1.5m] StandStill : duration(>, 30s).
message(“Ignition to Stand”) = IgnitionToStand.
Diagnostics Task D5: “Is the turbine T100 ready to start?”:
message(“Ready to Start”) = RampChange : after[5m] PurgingOver :
after[11m] PurgingAndIgnition :
after[15s] IgnitionToStand.
Fig. 6. Signal processing rules that we used for performance evaluation.
to 240. Thus, for 10 tasks the semantic approach allows to save about 1.900 seconds andit is more than 4 times faster than the baseline approach.
Performance Evaluation. In this experiment, we evaluate how well our SQL translationapproach scales. For this we prepared 5 diagnostic task, corresponding data, and verifiedfiring of messages using a standard relational database engine PostgreSQL. We conductedexperiments on an HP Proliant server with 2 Intel Xeon X5690 Processors (each with 12logical cores at 3.47GHz), 106GB of RAM. We now first describe the diagnostic tasksand the data, and then report the evaluation results.
In Figure 6 we present four of our 5 diagnostic tasks, and the task D2 is our runningexample. Note thatD1–D4 are independant from each other, whileD5 combines complexsignals defined in the other four tasks. This is a good example of modularity of sigRL. Onthe data side, we took measurements from 2 sensors over 6 days as well as the relevantinformation about the turbines where the sensors were installed. Then, we scaled theoriginal data to 2000 sensors; our scaling respect the structure of the original data. Thelargest raw data for 2000 sensors took 5.1GB on disk in a PostgreSQL database engine.
During the experiments our system did two steps: translation of semantic diagnosticprograms into SQL code and then execution of this SQL. During the first step our systemgenerated SQL code that ranging from 109 to 568 lines depending on the diagnostic

Fig. 7. Performance evaluation results for the Siemens use case.
task and the code is of a relatively complex structure, e.g., for each diagnostic task thecorresponding SQL contains at least 10 joins. The results of the second step are presentedin Figure 7. We observe that query evaluation scales well. Specifically, the running timegrows sublinearly with respect to the number of sensors. The most challenging query D5
can be answered in 2 minutes over 2000 sensors.
5 Related WorkThe authors in [19] introduce temporal streaming language STARQL that extends SPARQLwith aim to facilitate data analysis directly in queries. This and other similar semanticstreaming languages, e.g., SPARQLstream [9], are different from our work, since wepropose (i) a rule diagnostic language and (ii) focus on temporal properties of signalswhich are not naturally representable in those languages.
A preliminary idea on how to use semantic technologies in abstracting details ofmachines was presented in [22, 21] where the authors use KBs to abstract away details ofparticular turbines in Siemens. Data about turbines is retrieved using OBDA and send tofurther analytical analysis (e.g., using KNIME system (www.knime.com)). This line ofwork does aims at using off-the-shelf analytical software instead of diagnostic rules.
Recent efforts have been made to extend ontologies with analytical and temporalconcepts. Authors in [2, 1] allow for temporal operators in queries and ontologies. Still,such approach use temporal logics (e.g., LTL) which in not adequate for our case sincesensor data are organized based on intervals, e.g. [0s, 10s].
Work in [16, 19] introduces analytical operations directly into ontological rules insuch a way that OBDA scenario is preserved. This line of work, we use an inspiration onhow to define analytical functions on concepts, e.g. avg C, in OBDA setting. However,the authors do not consider temporal dimension of the rules.
Finally, our work is related to a well-studied Metric Temporal Logic [20]. Onecan show that sigRL is a non-trivial extension of the non-recursive Datalog languageDatalognrMTL that has been introduced in [4]. Our rewriting techniques from sigRL rulesinto SQL follow similar principles as the ones for DatalognrMTL.
6 Lessons Learned and Future Work
In this paper we showcase an application of semantic technologies for diagnostics ofpower generating turbines. We focused on the advantages and feasibility of the ontology-based solution for diagnostic rule formulation and execution. To this end we studiedand described a Siemens diagnostic use-case. Based on the insights gained, we reportedlimitations of existing Siemens and ontology based solutions to turbine diagnostics. In

order to address the limitations we proposed a signal processing rule language sigRL,studied its formal properties, implemented, and integrated it in an ontology-based systemwhich we deployed at Siemens.
The main lesson learned is the effectiveness of our semantic rule language indealing with the complexity of the rules and the number of turbines and sensors for ruledeployment. The evaluation shows up to 66% of engineers time saving when employingontologies. Thus, our semantic solution allows diagnostic engineers to focus more onanalyses the diagnostic output rather than on data understanding and gathering thatthey have to do nowadays for authoring data-driven diagnostic rules. Following theseexperiments, we are in the process of setting up a deployment of our system into theSiemens remote diagnostic system to further evaluate the usability and impact. Secondimportant learned lesson is that execution of semantic rules is efficient and scales well tothousands of sensors which corresponds to real-world complex diagnostic tasks.
Finally, note that our system is not included in the production processes. There areseveral important steps that we have to do before it can be included. First, it has tobecome much more mature and improve from the university-driven prototype to a stablesystem. Second, we have to develop an infrastructure for rule management, in particular,for rule maintenance and reuse—some of this work has already be done and one can ourpreliminary ideas in [18, 23]. Third, we need more optimisations and evaluations thatwill include a performance comparison of our solution with the Siemens solutions thatare based on the Siemens data-driven rule language. Moreover, we need techniques forabstracting (at lease some of) the existing 200k SPRs from the data driven rules into amuch smaller number of sigRL. All of these is our future work.
Acknowledgements This research is supported: EPSRC projects MaSI3, DBOnto, ED3;and the Free University of Bozen-Bolzano project QUEST.
References
1. A. Artale, R. Kontchakov, V. Ryzhikov, and M. Zakharyaschev. The complexity of clausalfragments of LTL. In LPAR, pages 35–52, 2013.
2. A. Artale, R. Kontchakov, F. Wolter, and M. Zakharyaschev. Temporal description logic forontology-based data access. In IJCAI 2013, pages 711–717, 2013.
3. F. Baader, D. Calvanese, D. L. McGuinness, D. Nardi, and P. F. Patel-Schneider, editors.The Description Logic Handbook: Theory, Implementation, and Applications. CambridgeUniversity Press, New York, NY, USA, 2003.
4. S. Brandt, E. G. Kalaycı, R. Kontchakov, V. Ryzhikov, G. Xiao, and M. Zakharyaschev.Ontology-based data access with a horn fragment of metric temporal logic. In AAAI, 2017.
5. D. Calvanese, B. Cogrel, S. Komla-Ebri, R. Kontchakov, D. Lanti, M. Rezk, M. Rodriguez-Muro, and G. Xiao. Ontop: Answering SPARQL queries over relational databases. SemanticWeb, 8(3):471–487, 2017.
6. D. Calvanese, G. De Giacomo, D. Lembo, M. Lenzerini, A. Poggi, M. Rodriguez-Muro,R. Rosati, M. Ruzzi, and D. F. Savo. The MASTRO system for ontology-based data access.Semantic Web, 2(1):43–53, 2011.
7. D. Calvanese, G. De Giacomo, D. Lembo, M. Lenzerini, and R. Rosati. Tractable reasoningand efficient query answering in description logics: The DL-Lite family. JAR, 39(3), 2007.
8. B. Charron, Y. Hirate, D. Purcell, and M. Rezk. Extracting semantic information for e-commerce. In ISWC, pages 273–290, 2016.

9. O. Corcho, J.-P. Calbimonte, H. Jeung, and K. Aberer. Enabling query technologies for thesemantic sensor web. Int. J. Semant. Web Inf. Syst., 8(1):43–63, Jan. 2012.
10. I. Horrocks, M. Giese, E. Kharlamov, and A. Waaler. Using Semantic Technology to Tame theData Variety Challenge. IEEE Internet Computing, 20(6):62–66, 2016.
11. E. Jimenez-Ruiz, E. Kharlamov, D. Zheleznyakov, I. Horrocks, C. Pinkel, M. G. Skjæveland,E. Thorstensen, and J. Mora. BootOX: Practical Mapping of RDBs to OWL 2. In ISWC, 2015.
12. E. Kharlamov, S. Brandt, M. Giese, E. Jimenez-Ruiz, Y. Kotidis, S. Lamparter, T. Mailis,C. Neuenstadt, O. L. Ozcep, C. Pinkel, A. Soylu, C. Svingos, D. Zheleznyakov, I. Horrocks,Y. E. Ioannidis, R. Moller, and A. Waaler. Enabling Semantic Access to Static and StreamingDistributed Data with Optique: Demo. In DEBS, 2016.
13. E. Kharlamov, S. Brandt, E. Jimenez-Ruiz, Y. Kotidis, S. Lamparter, T. Mailis, C. Neuenstadt,O. L. Ozcep, C. Pinkel, C. Svingos, D. Zheleznyakov, I. Horrocks, Y. E. Ioannidis, andR. Moller. Ontology-Based Integration of Streaming and Static Relational Data with Optique.In SIGMOD, 2016.
14. E. Kharlamov, B. C. Grau, E. Jimenez-Ruiz, S. Lamparter, G. Mehdi, M. Ringsquandl,Y. Nenov, S. Grimm, M. Roshchin, and I. Horrocks. Capturing Industrial Information Modelswith Ontologies and Constraints. In ISWC, pages 325–343, 2016.
15. E. Kharlamov, D. Hovland, E. Jimenez-Ruiz, D. Lanti, H. Lie, C. Pinkel, M. Rezk, M. G.Skjæveland, E. Thorstensen, G. Xiao, D. Zheleznyakov, and I. Horrocks. Ontology BasedAccess to Exploration Data at Statoil. In ISWC, pages 93–112, 2015.
16. E. Kharlamov, E. Jimenez-Ruiz, D. Zheleznyakov, D. Bilidas, M. Giese, P. Haase, I. Horrocks,H. Kllapi, M. Koubarakis, O. L. Ozcep, M. Rodriguez-Muro, R. Rosati, M. Schmidt, R. Schlatte,A. Soylu, and A. Waaler. Optique: Towards OBDA Systems for Industry. In ESWC SatelliteEvents, 2013.
17. E. Kharlamov, Y. Kotidis, T. Mailis, C. Neuenstadt, C. Nikolaou, O. L. Ozcep, C. Svingos,D. Zheleznyakov, S. Brandt, I. Horrocks, Y. E. Ioannidis, S. Lamparter, and R. Moller. TowardsAnalytics Aware Ontology Based Access to Static and Streaming Data. In ISWC, pages344–362, 2016.
18. E. Kharlamov, O. Savkovic, G. Xiao, G. Mehdi, R. Penaloza, M. Roshchin, and I. Horrocks.Semantic Rules for Machine Diagnostics: Execution and Management. In CIKM, 2017.
19. E. Kharlamov, N. Solomakhina, O. L. Ozcep, D. Zheleznyakov, T. Hubauer, S. Lamparter,M. Roshchin, A. Soylu, and S. Watson. How Semantic Technologies Can Enhance DataAccess at Siemens Energy. In ISWC, pages 601–619, 2014.
20. R. Koymans. Specifying real-time properties with metric temporal logic. Real-Time Syst.,2(4), Oct. 1990.
21. G. Mehdi, S. Brandt, M. Roshchin, and T. A. Runkler. Semantic framework for industrialanalytics and diagnostics. In IJCAI, pages 4016–4017, 2016.
22. G. Mehdi, S. Brandt, M. Roshchin, and T. A. Runkler. Towards semantic reasoning inknowledge management systems. In AI for Knowledge Management workshop at IJCAI, 2016.
23. G. Mehdi, E. Kharlamov, O. Savkovic, G. Xiao, E. G. Kalaycı, S. Brandt, I. Horrocks,M. Roshchin, and T. Runkler. SemDia: Semantic Rule-Based Equipment Diagnostics Tool. InCIKM (demo), 2017.
24. J. S. Mitchell. An introduction to machinery analysis and monitoring. Pennwell Books, 1993.25. A. Poggi, D. Lembo, D. Calvanese, G. De Giacomo, M. Lenzerini, and R. Rosati. Linking
data to ontologies. J. Data Semantics, 10:133–173, 2008.26. R. B. Randall. Vibration-based condition monitoring: industrial, aerospace and automotive
applications. Wiley, 2011.27. B. K. N. Rao. Handbook of condition monitoring. Elsevier, 1996.28. O. Savkovic and D. Calvanese. Introducing datatypes in DL-Lite. In ECAI, 2012.29. G. Vachtsevanos, F. L. Lewis, M. Roemer, A. Hess, and B. Wu. Intelligent Fault Diagnosis
and Prognosis for Engineering Systems. Wiley, 2006.