semi microelectronics manufacturing supply chain market: q1 2016 review
TRANSCRIPT

SEMI Microelectronic Manufacturing Supply ChainQuarterly Market Data - CYQ1 2016
www.semi.org/marketinfo
March 2016

2
Economic Trends
• Weakening Currency, especially Yen & Euro, dampened 2015 industry figures when reported in US$.
• With no currency impact, the semiconductor equipment market would be up +5% to +6% in 2015 vs. 2014 instead of the -1% decline
> US$400M
Source: SEMI, January 12,2016 Article: http://www.semi.org/en/2015-Semiconductor-Industry-Results?id=sgurow011216

Annual Silicon* Area Shipment Trends
2007 2008 2009 2010 2011 2012 2013 2014 2015
Area Shipments (MSI)
8,661 8,137
6,707
9,370
9,043 9,031 9,067
10,098 10,434
Revenues ($B) 12.1 11.4 6.7 9.7 9.9 8.7 7.5 7.6 7.2
*Shipments are for semiconductor applications only and do not include solar applications
Source: SEMI Silicon Manufacturers Group, February 9, 2016 Press Release: http://www.semi.org/en/another-record-year-silicon-wafer-shipment-volumes-2015

Quarterly Silicon* Area Shipment Trends
Q1 '09
Q2 '09
Q3 '09
Q4 '09
Q1 '10
Q2 '10
Q3 '10
Q4 '10
Q1 '11
Q2 '11
Q3 '11
Q4 '11
Q1 '12
Q2 '12
Q3 '12
Q4 '12
Q1 '13
Q2 '13
Q3 '13
Q4 '13
Q1 '14
Q2 '14
Q3 '14
Q4 '14
Q1 '15
Q2 '15
Q3 '15
Q4 '15
0
500
1,000
1,500
2,000
2,500
3,000
Are
a S
hipm
ents
(Mill
ions
of S
quar
e In
ches
)
Source: SEMI Silicon Manufacturers Group, http://www.semi.org/en/MarketInfo/SiliconShipmentStatistics
*Shipments are for semiconductor applications only and do not include solar applications

Worldwide Semiconductor Equipment Figures2015 Billings: $36.5 Billion
2015 2014 % Change
Taiwan 9.64 9.41 2%
South Korea 7.47 6.84 9%
Japan 5.49 4.18 31%
North America 5.12 8.16 -37%
China 4.90 4.37 12%
Rest of World 1.97 2.15 -9%
Europe 1.94 2.38 -19%
Total 36.53 37.50 -3%
Source: SEMI/SEAJ, March 14, 2016; Note: Figures may not add due to rounding. Press Release: http://www.semi.org/en/semi-reports-2015-global-semiconductor-equipment-sales-365-billion

Fabs/Foundries/IDM Update
•Fab Equipment Spending– Equipment spending (new and used) for 2015 was essentially flat (-0.4%) as
compared to the November 2015 World Fab Forecast report forecast of 0.5%. Fab equipment spending is expected to increase by 3.7% (US$36.2B) in 2016 and 13% (US$42.1B) in 2017
– Equipment spending is expected to have a slow start in 2016 and will accelerate in the second half of 2016. Spending growth will continue into 2017 driven by foundries, memory (3D NAND and DRAM), MPU, and Power
– Overall DRAM spending will slow in 2016 by over 22%, while NAND spending will increase by 27%. DRAM spending will improve in 2017 but will still be below 2015 levels. NAND (mainly 3D) spending will rise to record levels in 2017 (over US$10B)
– Spending for MPU is expected to increase in 2016 and 2017 by 13% and 15%, respectively, as 10nm technology begins to ramp. Spending for Power is expected to increase over 40% in 2016 and over 50% in 2017
Source: SEMI World Fab Forecast database, February 2016http://www.semi.org/en/node/72901

Fabs/Foundries/IDM Update (Continued)
•Installed Capacity– Worldwide installed capacity growth increased 2% in 2015 and is forecasted to
expand 1% and 3% in 2016 and 2017, respectively. Although companies are adding capacity, the loss of capacity when transitioning to leading nodes impacts the overall growth rate
– Most capacity added in 2016 and 2017 will be for 3D NAND with double digit growth rates. Foundry capacity will increase steadily at about 5% per year
– 300mm capacity will grow about 3% in 2016 and 5% in 2017. 200mm capacity will also increase with annual growth of 2% in 2016 and 2017
Source: SEMI World Fab Forecast database, February 2016http://www.semi.org/en/node/72901

Fabs/Foundries/IDM Update (Continued)
•New Facilities / Construction Spending– There are 27 facilities (with various probabilities) that will begin construction in the
first quarter of 16 or later. This number is expected to increase as more information comes in
– In 2016, there are 36 construction on-going projects with investments totaling about US$7B (-2% YoY)
– In 2017, there will be 30 construction projects underway with investments totaling US$8.6B (23% YoY)
– Most construction spending in 2016 will be for Memory (US$ 3.9B) with a large increase for 3D NAND (60% YoY). Spending for foundries follows in 2nd place (US$2.5B)
Source: SEMI World Fab Forecast database, February 2016http://www.semi.org/en/node/72901

Source: SEMI World Fab Forecast database, February 2016Article: http://www.semi.org/en/double-digit-growth-2017

Semiconductor Packaging Materials – Bonding Wire
Source: SEMI and TechSearch International, Global Semiconductor Packaging Materials Outlook 2015/2016 Edition Article: http://www.semi.org/en/Packaging-Material-Supplier-Landscape-Shifting

Industry Trends Captured by SEMI for 25 Years
Source: SEMI Article: http://www.semi.org/en/industry-trends-are-captured-semi-data-collection-programs
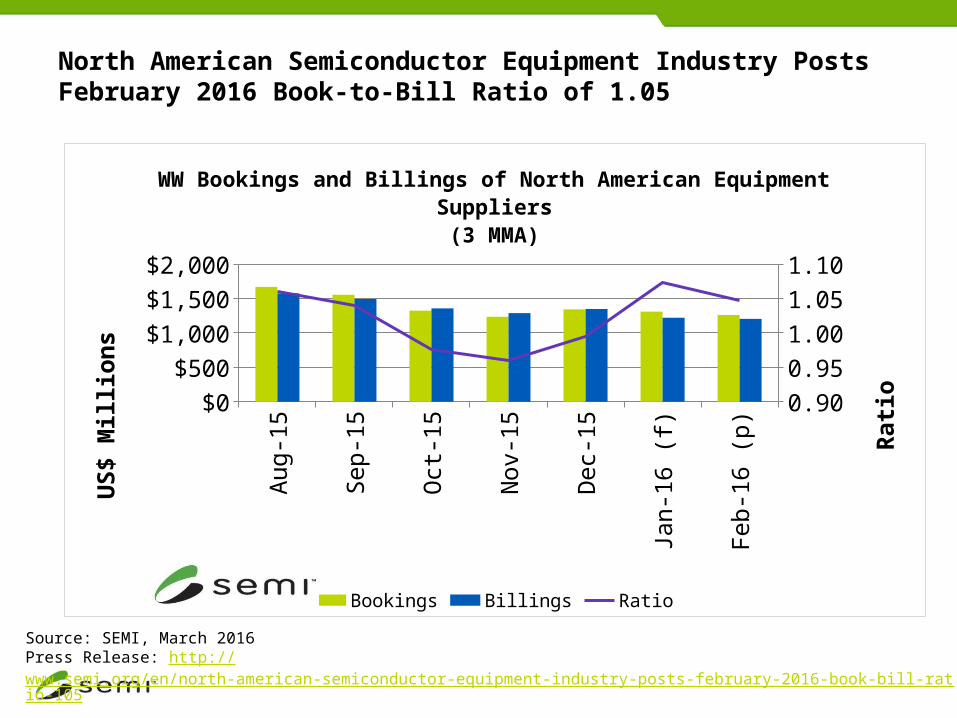
North American Semiconductor Equipment Industry PostsFebruary 2016 Book-to-Bill Ratio of 1.05
Source: SEMI, March 2016Press Release: http://www.semi.org/en/north-american-semiconductor-equipment-industry-posts-february-2016-book-bill-ratio-105
Aug
-15
Sep
-15
Oct
-15
Nov
-15
Dec
-15
Jan-
16 (f
)
Feb-
16 (p
)$0
$500
$1,000
$1,500
$2,000
0.90
0.95
1.00
1.05
1.10
WW Bookings and Billings of North American Equipment Suppliers(3 MMA)
Bookings Billings Ratio
US$
Mill
ions
Rat
io

Need Customized Reports?
Examples•Fab Transition Report
– Fabs to be sold, sold, for sale, may-be-closed, etc.
•Historical Fab Report– Number of fabs operational/year (1988-2014)– Total spending on fabs per year (1988-2014)– Wafer capacity by geometry (1994 – 2014)– Fab Construction spending (1996 – 2014)– Fab Equipping spending (1996 – 2014)
•Regional Fab Capacity Report (2000 - 2014)

14
SEMI Market Data Reports and Databases
Fab Forecast Semiconductor, Power
Devices, MEMS, HBLED
• World Fab Forecast
• FabFutures
• World Fab Watch
• New Fab Monitor
• Fab Equipment Monitor
• Regional spotlights
• Global 200mm Fab Outlook to 2018
• Customized Fab Transition Report
• Global Semiconductor Packaging Materials Outlook
• China Semiconductor Packaging Market Outlook
• Opto/LED Fab Watch or Forecast
• Customized Benchmark Data Collection
Packaging Market and Other Market
Material MarketSemiconductor
Materials
• Material Market Data Subscription
• Photomask Characterization Report New
• Silicon Reclaim Wafer Characterization New
• Customized Benchmark Data Collection
• Global Semiconductor Packaging materials Outlook
Equipment & Component Market
• Equipment Market Data Subscription
- Book-to-Bill Report
- Historical Book-to-Bill
- Semiconductor Equipment Market Statistics (WWSEMS)
- Historical WWSEMS
• SEMI Secondary Fab Equipment Report
• Mass Flow Controller Market Statistics

15
About Us
• The SEMI Industry Research and Statistics group provides market data and market research reports to serve customers in device manufacturing, semiconductor processing equipment, components, materials, semiconductor packaging materials, and etc.
• Our Mission is to delivering authoritative, accurate, relevant, and unbiased market data to our members, covering the semiconductor and related manufacturing supply chains
• For our major reports, we collect actual data from suppliers around the world following strict professional standards of confidentiality. Our reports provide trends, forecast, and outlook to help the industry make important investment, strategic, and business planning decisions.
• For additional information regarding our products and SEMI data collection program, please visit us at www.semi.org/marketinfo or contact us at [email protected].