seminario: modeling and detection of volcanos...
TRANSCRIPT

Seminario: Modeling and Detection ofVolcanos Eruption Plumes
Maestrıa en Aplicaciones Espaciales deRespuesta y Alerta Temprana a Emergencias
MARIA FERNANDA GARCIA [email protected]
Instituto de Altos Estudios Espaciales Mario Gulich
Abstract
Erupting volcanoes are an important source of atmospheric tracegases and particles that can impact on aviation, human health, crops,climate, among others. Therefore, rapid detection of volcanic emissionsand prediction of their transport pathways is of high interest.
This work mentions some tracking techniques of eruption cloudsthat involve ground-based observations, the use of satellite imageryand transport models to predict ash movement. Their combination isa significant tool for civil protection agencies to alert population andhelp mitigate the impacts.
1 Introduction
Objectives of the Seminar:
• To identify and learn about vulcanism main aspects involved in vol-canic eruptions.
• To learn about different ground-based measurement techniques andremote sensing resources for detection of volcanic plumes, and ashtransport and dispersion forecast models to mitigate the impact of theemergency.
• To identify global and local institutions involved in detection of vol-canic plumes and alert.
1

2 Volcanic Eruptions
Earthquakes and volcanic eruptions are the most evident proof of geologicalactivity on Earth. While most of these events are small, sometimes they canlead to a larger event.
The lithosphere plate boundaries (where the tectonic plates interact)are the areas where both phenomenon occur (Figure 1). There are threetypes of boundaries defined by the relative motion of the plates (Figure 1):a) convergent, where crust is destroyed as one plate dives under another(e.g. the Andes Mountains), magma can rise and acumulate in the magmachambers to be available as lava source producing explosive eruptions; b)divergent, where the plates pull away from each other generating new crust(Mid-Atlantic Ridge), most of the eruptions occur underwater and theirimpact is minimum (The COMET Program/USGS), and c) transform, wherethe plates slide horizontally past each other (San Andreas fault). Volcanismis abundant along divergent and convergent plate boundaries.
The “Ring of Fire” (Figure 1) is a zone encircling the Pacific Basin, whereearthquakes and the most explosive volcanism occurs in the world.
2.1 Classification of Volcanic Eruptions
There exist volcanoes of multiple forms and sizes; however, they share basicfeatures regarding the eruption event, as shown in Figure 2. In general,when a volcano erupts magma rises from its bottom through strata (rocklayers) to the surface, following one or more conduits. While most magmarises to the top of the volcano and erupts through the cone, at the top ofthe central vent, the rest of the magma may follow diverging conduits anderupt through the flanks of the volcano. Along with the magma, the volcanoemits a cloud of tephra, made up of ash and large particles (US GeologicalSurvey).
Magmatic eruptionsThe production of ash during a volcanic eruption is controlled by the
characteristics of the erupting magma. The amount of volatile content, inparticular, contributes to the eruption style of volcanoes, resulting in thefollowing classification:
Four eruption types according to their explosiveness and height weredeveloped by volcanologists (Figure 3):
1. Hawaiian Eruption: It may occur along fissures or fractures that serveas linear vents. In central-vent eruptions, a fountain of fiery lava spurtsto a height of several hundred feet building a cone of spatter aroundthe vent. Such eruptions rarely produce volcanic ash.
2

(a)
(b)
(c)
Figure 1: a) Tectonic plates boundaries in the world (USGS), b) the Ring ofFire and c) types of boundaries (USGS).
3

Figure 2: Volcano structure (USGS).
4

Figure 3: Relationship between the the eruptive column height and expli-sivity (The COMET Program/USGS)
2. Strombolian Eruption: Huge lava fragments explode from the craterflying through the air. Particularly violent Strombolian explosions canproduce ash clouds but they are normally short-lived and do not risehigh into the atmosphere.
3. Vulcanian Eruption: Extreme pressure conditions are present due tothe difficulty of dissolved gases to escape from high viscosity magma.This leads to the characteristic behavior where a dense cloud of ash-laden gas explodes from the crater and rises high above the peak.Steaming ash forms a whitish cloud near the upper level of the cone.These moderate-sized explosive eruptions commonly eject a largeportion of volcanic ash as well as bombs and blocks.
4. Plinian Eruption: These are the most powerful eruptions and involvethe explosive ejection of relatively large amounts of viscous lava. Largeplinian eruptions may send ash and volcanic gas high into the strato-sphere from 10 to 30-40 km or more. The resulting ash fallout canaffect large areas hundreds of miles downwind. Fast-moving deadlypyroclastic flows are also commonly associated with plinian eruptions.Some plinian eruptions inject large quantities of sulfur dioxide into thestratosphere which is converted into aerosols and transported around
5

the globe by high altitude winds. The aerosols block sunlight causinga slight decrease in global surface temperatures. Global cooling wasdetected with the eruptions of Mount Pinatubo, Philippines (1991), ElChichon, Mexico (1982) and Krakatau (1883) and Agung (1963), In-donesia. It is important to be aware of the location of plinian eruptionsbecause of their explosive nature and the amount of ash and gases thatare injected high into the atmosphere. Those eruptions occurring inthe tropics are more likely to have worldwide impacts as their aerosolswill be distributed across both the northern and southern hemispheres.
While some volcanoes may exhibit only one characteristic type of erup-tion during an interval of activity; others may display the entire range.
Phreatomagmatic eruptions
These are eruptions that arise from interactions between water and magma.They are driven from thermal contraction (as opposed to magmatic erup-tions, which are driven by thermal expansion) of magma when it comes incontact with water. This temperature difference between the two causesviolent water-lava interactions that make up the eruption. The productsof phreatomagmatic eruptions are believed to be more regular in shapeand finer grained than the products of magmatic eruptions because of thedifferences in euptive mechanisms.
2.2 Eruption Plume
Volcanoes are an important source of atmospheric trace gases and particles.Eruptive events emit, in addition to large amounts of ash, a gaseous plumehigh into the troposphere or even the stratosphere. Mostly contained withina thin layer (typically 1 km thick or less), the plume is mainly composed ofwater vapour, carbon dioxide, sulphur dioxide and halogen species. It istransported away from its emission source following the main wind fieldsin the troposphere or the upper troposphere/lower stratosphere. Duringtransport, chemistry modifies the composition of the plume, in particularsulphur dioxide, which is progressively transformed into sulphuric acidparticles (Clerbaux et al., 2010).
2.3 Eruption Impacts
Explosive volcanic eruption has the potential to greatly disrupt human livesand cause much damage to aviation and climate through the expulsion ofvolcanic ash and gases.
6

The impact on aviation may include the disruption to airport operations,physical damage to aircrafts including engine failure, and economic lossesto airlines and other industries dependent on air transportation.
Society may be affected by deteriorated air quality that generates healthproblems; possible crop, livestock, and water contamination; ground trans-portation disruption; power and communication outages, and damage tobuilding structures.
The impact on climate may include disruption of the Earth’s radiationbalance, ozone depletion, stratospheric warming, global surface coolingand reduced monsoonal precipitation. These effects may last for years,making weather forecasting, and, in particular, seasonal forecasting verychallenging. The nature of the impact and its duration depend on thelocation and strength of the erupting volcano.
3 Detection and modelling of volcanic plumes
The greatest danger to aviation occurs immediately after the onset of avolcanic eruption when no or incomplete warnings are typically availableand when model predictions (if available) are least reliable. Immediatelyafter the onset of an eruption, typically nearly no quantitative atmosphericobservation data are available and modellers will have to make roughassumptions on the source term, based on volcanological information andlocal (observer reports, web-cams, photographs, thermal infrared cameras,radar, LIDAR) real-time observations. Later, atmospheric observationscan be used to better constrain the source term and, thus, improve themodel predictions. For early provision of reliable model forecasts, it is ofgreat importance to have such observations available as soon as possibleafter the start of a volcanic eruption. Ideally, such information comes fromgeostationary satellites which can observe an ash plume at high temporalresolution (e.g., every 15 minutes), if cloud cover permits. In the absenceof such observations or in addition, data from polar orbiting satellites mayalso become available soon after an eruption. However, since there arefew overpasses per day and/or spatial coverage is incomplete, the firstobservations from polar orbiting satellites may occur many hours or evenmore than a day (and, considering the possibility of unfavourable viewingconditions during an overpass occasionally even several days) after aneruption. Other observations (e.g., from LIDAR and/or weather radarnetworks, camera mounted monitoring stations, MISR, etc.) are likely tobecome available even later (e.g., as an ash plume passes over Europe).Therefore, use of data from geostationary platforms should have the highestpriority for operational model predictions (ESA-EUMETSAT, 2010).
7

3.1 Ground-based detection of Volcanic Plumes
Surface observations generally do not include observations of the tops ofclouds or ash plumes.
Wind and temperature observations provided by rawinsondes and air-craft aid in the analysis of the height and direction of transport of thevolcanic ash plume. Upstream data indicates what direction the plume willtravel and when or if it will reach your location. Also, the direction of thewinds at different heights above the ground can be used to predict how theplume will move initially at specific levels. Data near the location of theplume can be used to determine the height of the plume. Note that incomingpilot reports depend on the location and perspective of the pilot, and assuch they may or may not represent the reality of the situation.
An improvement in support for local volcano observatories would im-prove the timing, scope, and accuracy of information on volcanic activity.In particular it would be highly advisable to install remote sensing in-strumentation that can provide rapid real-time information on the height,mass emission rate and particle size distribution of the eruption at source.Ground-based radars, lidars, thermal imaging cameras and webcams wouldbe highly suitable for this task. At a minimum a scanning lidar and thermalimaging camera would be capable of providing height, particle size informa-tion and ash mass flux. In the case of Iceland, such a suite of instrumentationwould complement the existing radars and would be economically feasible(ESA-EUMETSAT, 2010).
3.1.1 LIDAR measurements
LIDAR (Light Detection And Ranging) is a remote sensing technology thatmeasures distance by illuminating a target with a laser and analyzing thereflected light.
A LIDAR collects the retrodiffuse radiation from some atmosphericconstituents (atmospheric particles: dust and cloud droplets) when a laserpulse is sended to the atmosphere. This allows to quantitative estimate theoptic properties from the atmospheric medium, and also the concentrationof some components (e.g. water content) resolved spacially (CETEMPS).
Satellite LIDARs can measure at night as well as during daytime and areless hampered by clouds than passive sensors, but observe only along a fixedline of sight. Ash can be identified using polarization and two-wavelengthbackscatter profiles, although there are currently no automated algorithms.Mass concentration profiles can be estimated from LIDAR profiles, given anestimate of particle size and density (ESA-EUMETSAT, 2010).
As an example of using LIDAR for a volcanic eruption, the CETEMPS
8

(a) (b)
Figure 4: Aerosol backscatter from the CETEMPS Raman LIDAR for theEyjafjallajokull eruption (Rizi and Iarlori, 2010)
institution reported the possible presence of volcanic ash during the Eyjafjal-lajokull eruption in 2010 (Rizi and Iarlori, 2010), using LIDAR measurementsfor the aerosol backscatter in LAquila, Italy. Figure 4 shows in a) the aerosolbackscatter (m−1 sr−1) in a time vs. altitude plot, and b) the aerosol backscat-ter for the 21:32 to 22:00 UTC time period chosen.
3.1.2 COSPEC (Correlation Spectrometer) measurements
This instrument measures the concentration of SO2 in either a vertical col-umn or horizontal plume by scanning across the plume perpendicular tothe transport direction, from a distance of a kilometer. By comparing thespectrum of natural light shining through clear air and that shining throughthe plume, it can determine the amount of gas in the plume. Then, knowinghow far the instrument is from the plume and how fast the wind is, thevolume of gas coming out of the volcano can be calculated (Williams-Joneset al., 2008).
Errors occur when physical barriers restrict perpendicular plume obser-vations or when the relative locations of the instrument and plume are notprecisely known. Another source of error is the dificulty in determining therising rates for vertical plumes or transport velocity for horizontal plumes.
9
(a) (b)
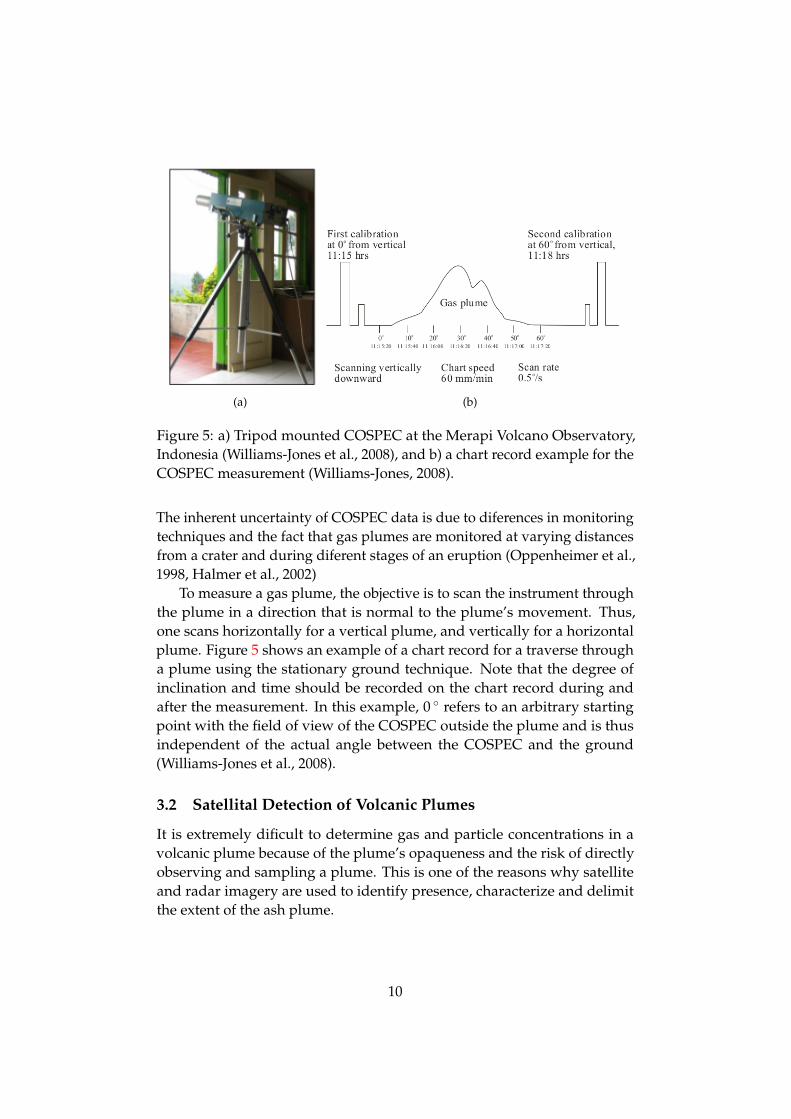
Figure 5: a) Tripod mounted COSPEC at the Merapi Volcano Observatory,Indonesia (Williams-Jones et al., 2008), and b) a chart record example for theCOSPEC measurement (Williams-Jones, 2008).
The inherent uncertainty of COSPEC data is due to diferences in monitoringtechniques and the fact that gas plumes are monitored at varying distancesfrom a crater and during diferent stages of an eruption (Oppenheimer et al.,1998, Halmer et al., 2002)
To measure a gas plume, the objective is to scan the instrument throughthe plume in a direction that is normal to the plume’s movement. Thus,one scans horizontally for a vertical plume, and vertically for a horizontalplume. Figure 5 shows an example of a chart record for a traverse througha plume using the stationary ground technique. Note that the degree ofinclination and time should be recorded on the chart record during andafter the measurement. In this example, 0 ◦ refers to an arbitrary startingpoint with the field of view of the COSPEC outside the plume and is thusindependent of the actual angle between the COSPEC and the ground(Williams-Jones et al., 2008).
3.2 Satellital Detection of Volcanic Plumes
It is extremely dificult to determine gas and particle concentrations in avolcanic plume because of the plume’s opaqueness and the risk of directlyobserving and sampling a plume. This is one of the reasons why satelliteand radar imagery are used to identify presence, characterize and delimitthe extent of the ash plume.
10
(a) (b)
(c) (d)
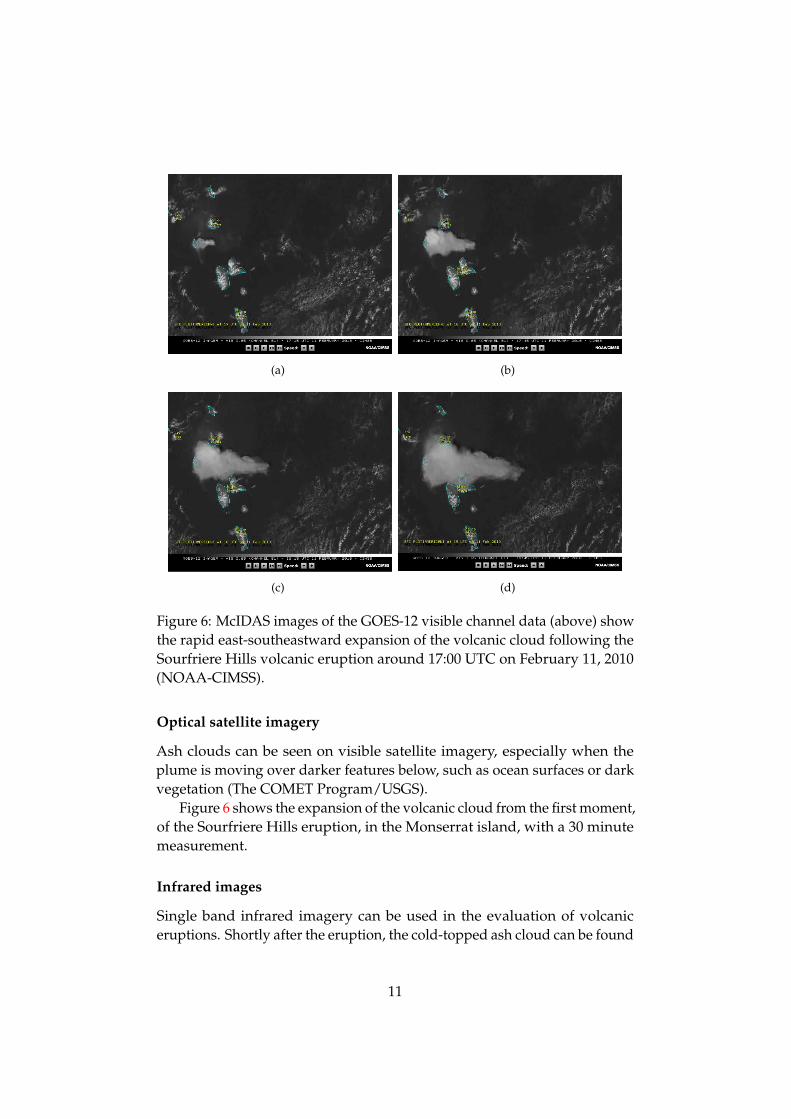
Figure 6: McIDAS images of the GOES-12 visible channel data (above) showthe rapid east-southeastward expansion of the volcanic cloud following theSourfriere Hills volcanic eruption around 17:00 UTC on February 11, 2010(NOAA-CIMSS).
Optical satellite imagery
Ash clouds can be seen on visible satellite imagery, especially when theplume is moving over darker features below, such as ocean surfaces or darkvegetation (The COMET Program/USGS).
Figure 6 shows the expansion of the volcanic cloud from the first moment,of the Sourfriere Hills eruption, in the Monserrat island, with a 30 minutemeasurement.
Infrared images
Single band infrared imagery can be used in the evaluation of volcaniceruptions. Shortly after the eruption, the cold-topped ash cloud can be found
11
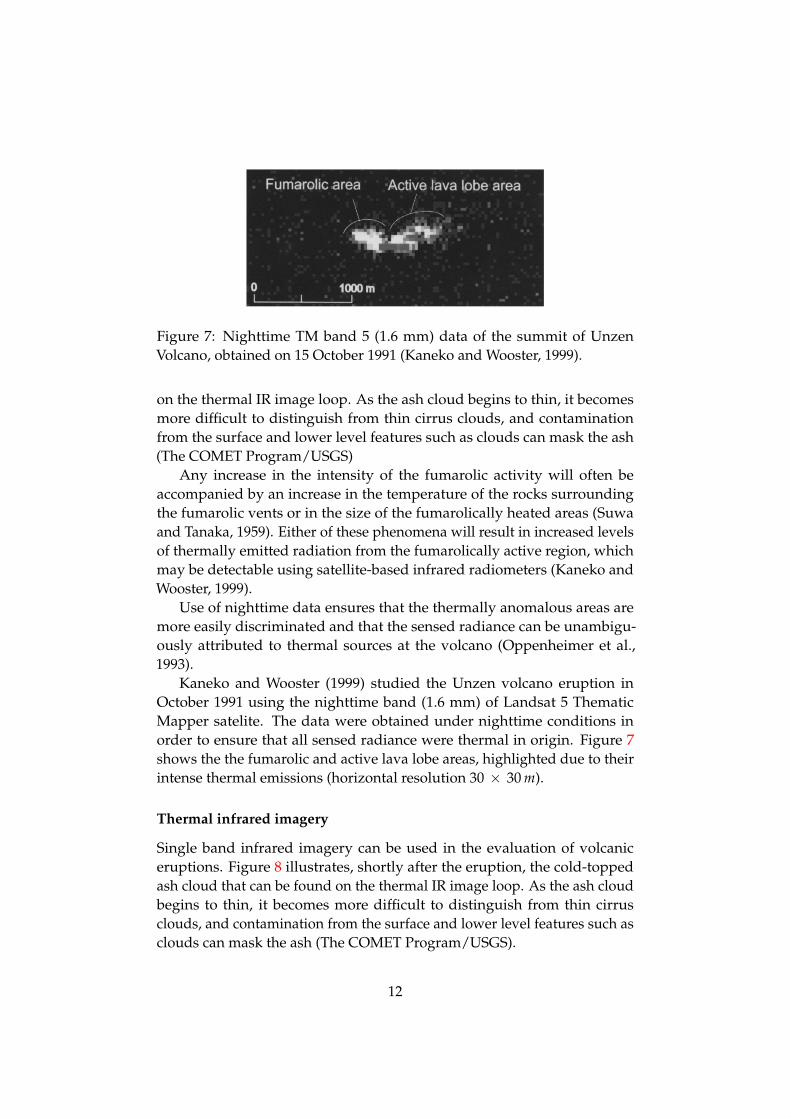
Figure 7: Nighttime TM band 5 (1.6 mm) data of the summit of UnzenVolcano, obtained on 15 October 1991 (Kaneko and Wooster, 1999).
on the thermal IR image loop. As the ash cloud begins to thin, it becomesmore difficult to distinguish from thin cirrus clouds, and contaminationfrom the surface and lower level features such as clouds can mask the ash(The COMET Program/USGS)
Any increase in the intensity of the fumarolic activity will often beaccompanied by an increase in the temperature of the rocks surroundingthe fumarolic vents or in the size of the fumarolically heated areas (Suwaand Tanaka, 1959). Either of these phenomena will result in increased levelsof thermally emitted radiation from the fumarolically active region, whichmay be detectable using satellite-based infrared radiometers (Kaneko andWooster, 1999).
Use of nighttime data ensures that the thermally anomalous areas aremore easily discriminated and that the sensed radiance can be unambigu-ously attributed to thermal sources at the volcano (Oppenheimer et al.,1993).
Kaneko and Wooster (1999) studied the Unzen volcano eruption inOctober 1991 using the nighttime band (1.6 mm) of Landsat 5 ThematicMapper satelite. The data were obtained under nighttime conditions inorder to ensure that all sensed radiance were thermal in origin. Figure 7shows the the fumarolic and active lava lobe areas, highlighted due to theirintense thermal emissions (horizontal resolution 30 × 30 m).
Thermal infrared imagery
Single band infrared imagery can be used in the evaluation of volcaniceruptions. Figure 8 illustrates, shortly after the eruption, the cold-toppedash cloud that can be found on the thermal IR image loop. As the ash cloudbegins to thin, it becomes more difficult to distinguish from thin cirrusclouds, and contamination from the surface and lower level features such asclouds can mask the ash (The COMET Program/USGS).
12

(a) (b)
(c) (d)
Figure 8: The Sourfriere Hills eruption monitored with the 10.7 µm channelfrom GOES-12, at different times (NOAA-CIMSS).
Again, the Sourfriere Hills eruption can be seen using the GOES-12 10.7µm longwave IR images. These reveals an initial pulse of very cold cloudtop IR brightness temperatures within a couple of hours following SoufriereHills eruption; as cold as −75◦C at 19:15 UTC.
Main missions for volcanic ash detection
Fundamental to the understanding of eruptive systems are the identificationand characterization of active volcanoes—namely a comprehensive globalinventory. This would comprise not only geodetic observations, but spec-troscopic observations of debris flows and land surface, as with Hyperion(Crowley et al., 2003; Wright and Flynn, 2003), and ash and emissions, aswith the NOAA Geostationary Operational Environmental Satellite (GOES)(Ellrod et al., 2003) and the Advanced Spaceborne Thermal Emission andReflection Radiometer (ASTER) (Watanabe and Matsuo, 2003; Pieri and
13

Abrams, 2004). Such measurements and new observational tools are en-abling a rapid growth in the understanding of volcanic hazards worldwide.
Remote sensing indeed is defining a new paradigm for volcanological ob-servations (Pieri and Abrams, 2004). Imaging spectroscopy (or hyperspectralimaging) in both the solar-reflected (0.4–2.5 µ m) and thermal portions (3–5µ m and 8–12 µ m) of the spectrum, permits the identification, separation,and measurement of subtle variations reflecting the overlapping molecularabsorption and constituent scattering signatures of materials present on theEarth’s surface. Measurements of surface deposits and composition, surfacetemperature, topography and surface deformation, SO2 and ash detectionand tracking, and modeling are needed to better characterize, understandand predict the volcanic hazards environment.
Moderate Resolution Imaging Spectroradiometer (MODIS) onboard theNASA Terra and Aura spacecraft are providing imagery of subaerial vol-canoes on Earth every 2 days (Watson et al., 2004). There is now an onlinearchive of eruptions going back nearly 5 years, using MODIS data for globalmonitoring through detection of thermal signatures (Wright et al., 2002,2004). Retrieval algorithms are able to quantify volcanic ash, ice, sulfatesand SO2 using thermal infrared (8–12 µ m). Identification of outgassedspecies near vents and craters provides information on subsurface activityand processes and may ultimately assist in forecasting eruptions (Tralli,2005).
Table 1 sumarizes the main sensors used for the detection and monitoringof volcanic eruptions (ESA-EUMETSAT, 2010).
14

15

16

3.3 Modeling of Volcanic Plumes
Volcanic Ash Transport and Dispersion Models (VATDM) can be based on:
1. different formulations (Eulerian, Lagrangian or Hybird) each approachbeing useful for different applications;
2. use different parameterizations of different physical processes (e.g.,source term, diffusion, sedimentation), and
3. might be designed for specific applications (e.g., local to global cover-age).
3.3.1 HYSPLIT - Hybrid Single Particle Lagrangian Integrated Trajec-tory
The HYSPLIT model (http://ready.arl.noaa.gov/HYSPLIT.php) is a com-plete system for computing simple air parcel trajectories to complex disper-sion and deposition simulations. The intial development was a result of ajoint effort between NOAA and Australia’s Bureau of Meteorology.
The dispersion of a pollutant is calculated by assuming either puff orparticle dispersion. In the puff model, puffs expand until they exceed thesize of the meteorological grid cell (either horizontally or vertically) and thensplit into several new puffs, each with it’s share of the pollutant mass. In theparticle model, a fixed number of particles are advected about the modeldomain by the mean wind field and spread by a turbulent component. Themodel’s default configuration assumes a 3-dimensional particle distribution(horizontal and vertical) (NOAA).
Hysplit predicts the evolution of the location, transport and concentra-tion of the ash cloud over time.
Necessary input data:
1. Time and duration of the eruption
2. Locations of the volcano
3. Vertical temperature and wind fields from a sounding or model
4. Weather data as obervations or modeled.
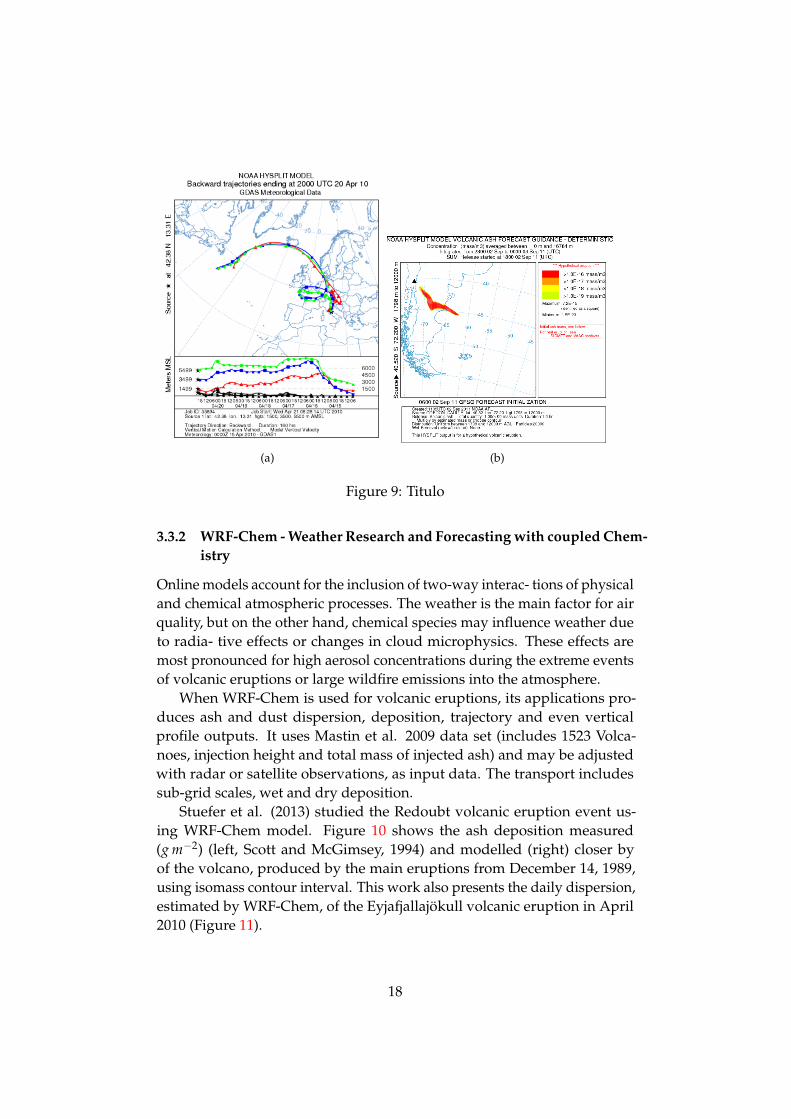
Hysplit then can be used both as a trajectory or a dispersion model.Rizi and Iarlori(2010) used Hysplit to backtrack the volcanic ash found inLAquila, reaching the original position of the volcano within 100 hours andfor different altitudes (Figure 9 a)), while the Puyehue volcanic eruption wasmodeled using the dispersion module of Hysplit (Figure 9 b)) published byDiario Villa La Angostura y Region de los Lagoshttp://www.laangosturadigital.com.ar/.
17
(a) (b)
Figure 9: Titulo
3.3.2 WRF-Chem - Weather Research and Forecasting with coupled Chem-istry
Online models account for the inclusion of two-way interac- tions of physicaland chemical atmospheric processes. The weather is the main factor for airquality, but on the other hand, chemical species may influence weather dueto radia- tive effects or changes in cloud microphysics. These effects aremost pronounced for high aerosol concentrations during the extreme eventsof volcanic eruptions or large wildfire emissions into the atmosphere.
When WRF-Chem is used for volcanic eruptions, its applications pro-duces ash and dust dispersion, deposition, trajectory and even verticalprofile outputs. It uses Mastin et al. 2009 data set (includes 1523 Volca-noes, injection height and total mass of injected ash) and may be adjustedwith radar or satellite observations, as input data. The transport includessub-grid scales, wet and dry deposition.
Stuefer et al. (2013) studied the Redoubt volcanic eruption event us-ing WRF-Chem model. Figure 10 shows the ash deposition measured(g m−2) (left, Scott and McGimsey, 1994) and modelled (right) closer byof the volcano, produced by the main eruptions from December 14, 1989,using isomass contour interval. This work also presents the daily dispersion,estimated by WRF-Chem, of the Eyjafjallajokull volcanic eruption in April2010 (Figure 11).
18

Figure 10: Ash Deposition. Left: measured tephra fall deposits (g m−2) (Scottand McGimsey, 1994). Right: WRF-Chem modeled ash-fall, from the 1989eruption of Redoubt Volcano, south-central Alaska (Stuefer et al. 2013)
Figure 11: Daily WRF-Chem dispersion of the Eyjafjallajokull ash massloading from 15 to 18 April 2010 (Stuefer et al. 2013)
19

Figure 12: The nine Volcanic Ash Advisory Center areas around the world.
3.4 Volcano Related Institutions
Collaboration with global and local agencies related to volcanoes and emer-gency managers is crucial during an event. Some of the institutions involvedare:
3.4.1 Volcanic Ash Advisory Center (VAAC)
The International Civil Aviation Organization (ICAO) recognizes the need tokeep aviators informed of volcanic hazards. To that end, nine Volcanic AshAdvisory Centers are currently working (Figure 12). Each VAAC is responsi-ble for providing Volcanic Ash Advisories (VAA) whenever a volcanic eventoccurs in their area of responsibility.
VAAC Buenos Aires: The Buenos Aires region VAAC is housed in theNational Wheater Service (Servicio Meteorologico Nacional) and it deliversdifferent products:
• Volcanic ash dispersion forecasts.
• A link to OVDAS (Observatorio Volcanologico de Los Andes del Sur) alerts.
• Ash MODIS products from the argentinian Space Agency CONAE(Comision Nacional de Actividades Espaciales).
• Volcanic ash SIGMET (Significant Meteorological Information).
• Volcanis ash dispersion and concentration modeling FALL 3D.
• Volcanic ash registers on Argentina.
20

Figure 13: SO2 and ash detected by IASI the 16th of June 2011. Puyehue-Cordon Caulle volcano, which starts on 4 June 2011 and Nabro eruptionstarted on 12 June 2011.
• LIDAR measurements.
http://www.smn.gov.ar/vaac/buenosaires/quesvaac.php?lang=es
3.4.2 Global Volcanism Program (GVP)
The Smithsonian Institution’s Global Volcanism Program (GVP) is housed inthe Department of Mineral Sciences, National Museum of Natural History,in Washington D.C. The mission of GVP is to document, understand, anddisseminate information about global volcanic activity. The data systemsthat lie at their core have been in development since 1968 when GVP begandocumenting the eruptive histories of volcanoes.
http://volcano.si.edu/
3.4.3 Support to Aviation Control Service (SACS)
This institution is of particular interest since it delivers notifications ofSO2 high concentration presence around volcanic events. The SACS fo-cuses on data derived from different satellite instruments, measuring in the
21

UV/Visible (GOME-2, SCIAMACHY and OMI) and the InfraRed (IASI andAIRS) on board of polar-orbiting satellites.
http://sacs.aeronomie.be/
References
CETEMPS. http://cetemps.aquila.infn.it/
C. Clerbaux, S. Turquety, and P. Coheur, “Infrared remote sensing ofatmospheric composition and air quality: Towards operational applications,”Comptes Rendus Geosci., vol. 342, no. 4–5, pp. 349–356, Apr. 2010.
Crowley, J.K., Hubbard, B.E., Mars, J.C., 2003. Analysis of potentialdebris flow source areas on Mount Shasta, California, by using airborne andsatellite remote sensing data. Remote Sens. Environ. 87 (2–3), 345–358.
Ellrod, G.P., Connell, B.H., Hillger, D.W., 2003. Improved detection ofairborne volcanic ash using multispectral infrared satellite data. J. Geophys.Res., [Atmos.] 108 (D12) (Art. No. 4356).
ESA-EUMETSAT. 2010. Monitoring volcanic ash from space. Workshopon the eruption at the Eyjafjoll volcano, South Iceland
Halmer, M. M., Schmincke, H., and Graf, H .2002. The annual volcanicgas input into the atmosphere, in particular into the stratosphere: a lgobaldata set for the past 100 years. Journal of Volcanology and GeothermalResearch, 115: 511-528.
Kaneko, T. and Wooster, M. J. 1999. Landsat infrared analysis of fumaroleactivity at Unzen Volcano: time-series comparison with gas and magmafluxes. Jornal of Volcanology and Geothermal Research 89: 57-64.
Mastin, L. G., Guffanti, M., Servranckx, R.,Webley, P., Barsotti, S., Dean,K., Durant, A., Ewert, J.W., Neri, A., Rose,W. I., Schnei- der, D., et al.: Amultidisciplinary effort to assign realistic source parameters to models ofvolcanic ash-cloud transport and disper- sion during eruptions, J. Volcanol.Geotherm. Res., 186, 10–21, doi:10.1016/j.jvolgeores.2009.01.008, 2009.
Oppenheimer, C., Francis, P. W., Rothery, D. A., Carlton, R. W. T. 1993.Infrared image analysis of volcanic thermal features: Lascar Volcano, Chile.1984-1992. Journal of Geophysical Research, 98: 4269-4286.
22

Oppenheimer, C., Francis, P., Stix, J., and Darroux, B. 1997. Depletionrates of SO2 in tropospheric volcanic plumes. Geophysical Research Letters.25: 12249-12254.
Pieri, D., Abrams, M., 2004. ASTER watches the world’s volcanoes:a new paradigm for volcanological observations from orbit. J. Volcanol.Geotherm. Res. 135 (1–2), 13–28
Rizi V. and Iarlori Marco. Report on the LIDAR observation in the periodfollowing the Eyjafjallajokull eruption. Update April 24, 2010 20:00LT
Scott, W. E. and McGimsey, R. G.: Character, mass, distribution, andorigin of tephra-fall deposits of the 1989–1990 eruption of Redoubt Volcano,south-central Alaska, in: The 1989–1990 Eruptions of Redoubt Volcano,Alaska, edited by: Miller, T. P. and Chouet, B. A., J. Volcanol. Geoth. Res., 62,251–272, doi:10.1016/0377-0273(94)90036-1, 1994.
Stuefer, M., Freitas, S. R., Grell, G., Webley, P., Peckham, S., McKeen, S.a., and Egan, S. D. (2013). Inclusion of ash and SO2 emissions from volcaniceruptions in WRF-Chem: development and some applications. GeoscientificModel Development, 6(2), 457–468. doi:10.5194/gmd-6-457-2013
The COMET Program/USGS. Volcanic Ash Modules. University Corpo-ration for Atmospheric Research (UCAR) http://meted.ucar.edu/.
Thomas, H.E. and Watson, I.M. 2009. Observations of volcanic emissionsfrom space: current and future perspectives. Natural Hazards, 10.1007/s11069-009-9471-3
Tralli, D. M., Blom, R. G., Zlotnicki, V., Donnellan, A., and Evans, D. L.2005. Satellite remote sensing of earthquake, volcano, flood, landslide andcoastal inundation hazards. ISPRS Journal of Photogrammetry and RemoteSensing, 59, 185–198. doi:10.1016/j.isprsjprs.2005.02.002
Watanabe, H., Matsuo, K., 2003. Rock type classification by multi- bandTIR of ASTER. Geosci. J. 7 (4), 347–358.
Watson, I.M., Realmuto, V.J., Rose, W.I., Prata, A.J., Bluth, G.J.S., Gu,Y., Bader, C.E., Yu, T., 2004. Thermal infrared remote sensing of volcanicemissions using the moderate resolution imaging spectroradiometer. J.Volcanol. Geotherm. Res. 135 (1– 2), 75–89
23

Williams-Jones, G., Stix, J. and Hickson, C. 2008. The COSPEC Cook-book: Making SO2 Measurements at Active Volcanoes. IAVCEI. Methods inVolcanology, 1.
Wright, R., Flynn, L.P., 2003. On the retrieval of lava-flow surface tem-peratures from infrared satellite data. Geology 31 (10), 396–893.
Wright, R., Flynn, L.P., 2004. Space-based estimate of the volcanic heatflux into the atmosphere duing 2001 and 2002. Geology 32 (3), 189–192.
24