semo annual report 2013.pdf
TRANSCRIPT
Regulatory Authority Annual Report
Market Operator Performance
Period: 1st October 2012 to 30th September 2013

SEMO Annual Report - 2013 Page 2
Table of Contents
1 INTRODUCTION ............................................................................................................. 3
2 MANAGE CHANGE ........................................................................................................ 4
2.1 IT CAPITAL EXPENDITURE 2010-2013 .......................................................................... 4 2.2 SYSTEM RELEASES ........................................................................................................ 6 2.3 MODIFICATION MANAGEMENT ...................................................................................... 8 2.4 MODIFICATIONS PROCESS DEVELOPMENT ................................................................... 11
3 SERVICE DELIVERY ................................................................................................... 16
3.1 CORE MARKET OPERATIONS FUNCTION PERFORMANCE ............................................. 16 3.2 PLANNED RE-SETTLEMENT M+4 ................................................................................. 18 3.3 AD-HOC PRICING AND AD-HOC RE-SETTLEMENT RUNS .............................................. 18
3.4 ADMINISTRATION OF CREDIT COVER .......................................................................... 19 3.5 BREACHES OF THE TRADING AND SETTLEMENT CODE ................................................ 20
4 MANAGE STAKEHOLDERS....................................................................................... 22
4.1 STRUCTURED APPROACH TO REGULATORY INTERFACE ............................................... 22
5 PROVIDE INFORMATION .......................................................................................... 23
5.1 CUSTOMER QUERIES IN A TIMELY MANNER ................................................................ 23 5.2 FACILITATE AND EDUCATE PARTICIPANTS TO ACCEDE TO THE CODE .......................... 26
5.3 FACILITATE INTERACTION WITH CUSTOMERS ............................................................ 302
6 SEM REVIEW................................................................................................................. 30
6.1 FORMAL QUERIES ........................................................................................................ 30
6.2 MARKET REVIEW ........................................................................................................ 35
6.3 OTHER STUDIES AND WORK ........................................................................................ 38

Introduction
SEMO Annual Report - Draft Page 3
1 Introduction
SONI Ltd. and EirGrid plc, operating as the Single Electricity Market Operator (SEMO) are required
under Condition 17 and 10 of their respective Market Operator Licences to provide an annual report to
the Regulatory Authorities on Market Operator Performance.
The period covered by this annual report is for financial year 2013 (from 1st October 2012 through to
30th September 2013).
In line with all other reports from SEMO, Quarters will be defined according to the financial year as
follows:
Q1 = 1st October to 31
st December
Q2 = 1st January to 31
st March
Q3 = 1st April to 30
th June
Q4 = 1st July to 30
th September
The four main categories of performance metric covered are:
Manage Change
Service Delivery
Manage Stakeholders
Provide Information
An additional section providing a review of key areas of the SEM, is also included.

Manage Change
SEMO Annual Report - Draft Page 4
2 Manage Change
2.1 IT Capital Expenditure 2010-2013
Capital Expenditure (Capex) is required to enable SEMO to invest in new and improved systems in order to fulfil its operational and market
management requirements. A total of 17 capital business cases were submitted to the Regulatory Authorities as part of the 2010-13 price control
submission. These business cases focused on IT infrastructure requirements, the need for additional operational support systems, reporting
requirements, data storage and system monitoring tools. The progress of each business case can be viewed in Table 1 below:
No Project Name Note/Benefit Delivery Date
1 Hardware Upgrade Three year Delivery timeline. Phase 1 October 2011 - COMPLETE
2 System Monitoring
Reporting
This proactive system will help significantly
reduce the time it takes to find and clear system
faults.
Design Phase - December 2011 - COMPLETE
Ordering and Commissioning - January 2012 - COMPLETE
Go live date Q1 2013 - COMPLETE
3 Systems
Management
This system will help facilitate Patch
Management, Code Releases, centralised software
server updates and will help the more efficient
utilisation of IT infrastructure resources.
Design - December 2011 - COMPLETE
Ordering and Commissioning - January 2012 - COMPLETE
Go live date Q1 2013 –CMS vendor code, Oracle Database &
Linux – COMPLETE - Final Phase: Application integration &
rollout -Q4 2013
4 Virtualisation
This project virtualises all of the SEMO non
production environments. Phase 2 will tackle the
virtualisation of SEMO’s Corporate systems but
excluding the Central Market Systems.
Phase 1 Virtualisation of non production environments -
December 2011 – COMPLETE
Phase 2 Virtualisation of Corporate systems – started.
5 Oracle Logging Auditor recommendation for security logging. Design Phase - Quarter 1 2012 – COMPLETE
Delivery date - July 2012 - COMPLETE
6 SharePoint and
Document
Facilitates the storage, organisation and sharing of
documents within SEMO
Phase 1 Storage of Processes, Work Procedures and Checklist
templates, Compliance Register - COMPLETE

SEMO Annual Report - 2013 Page 5
No Project Name Note/Benefit Delivery Date
Management Phase 2 Migration of all SEMO users from files stores to
Sharepoint – COMPLETE
7 Data Storage Relieves data storage problems and reduces costs.
Phase 1 Database Partitioning - November 2011 - COMPLETE
Phase 2 Database Archiving - December 2011 - COMPLETE
Phase 3 File Storage Management – COMPLETED
8 Data Warehouse This will provide SEMO with enhanced capacity
for carrying out detailed market analysis.
Phase 1 Infrastructure is due be delivered in July 2012 –
COMPLETE
Phase 2 Design and Procurement phase is due to start Quarter 3
2012 – COMPLETE
Phase 3 Implementation of CMS Historical database –
COMPLETE - Phase 4 Data warehouse and BI tools – Delayed
until completion of Eirgrid Group data warehouse strategy
9 Reporting Database
Upgrade
This is now a business critical system which
requires additional system support. Delivery date - July 2012 - COMPLETE
10 Oracle Database
Server Version 2
The database is struggling to maintain acceptable
performance and requires significant maintenance.
Phase 1 Delivery date – New File system due July 2011 –
COMPLETE
Phase 2 Upgrading to 11G and migrating to Linux July 2012 –
COMPLETE
11
New
Communications
Links
Key infrastructure components providing fully
redundant, consistently available high
performance links
Upgrade design started –Link order will be placed in Q4 2013
12 CMS Pre Production
Environment (IPT)
Environments for investigating, testing and
diagnosing issues in a timely and efficient manner.
Delivery Jan 2012 The CMS Pre Production Environments will be
commissioned and in place for January 2012 - COMPLETE

SEMO Annual Report - 2013 Page 6
No Project Name Note/Benefit Delivery Date
13 Axapta Upgrade
This system is used for reconciling bank accounts,
processing cash receipts, maintaining market
ledgers, managing collateral and bad debt and
managing market currency exposure.
Delivered in May 2011. Further upgrades may be required –
COMPLETE
14 On-Line Help
System
This system will allow external stakeholders to
submit and track any new or existing queries
directly through a SEMO portal.
Phase 1 Business requirements SEMO are gathering the business
requirements. The business requirement gathering stage is due to
be completed by December 2011. – COMPLETE Phase 2
Upgrade of Helpdesk and implementation of Limited
Communications failure solution – COMPLETE Phase 3 Delivery
COMPLETE
15 Electronic FAX
Solution
Audit recommendation. The current manual
processes for fax communications has the
potential for error or omission, may not be timely
enough, is difficult to co-ordinate across dual site
operations, is open to security breaches, and does
not provide auditable permanent records of
incoming or outgoing communications.
Phase 1 Business Specification and Design The business
specification for this project has been compiled and the design
agreed - COMPLETE
Phase 2 Procurement and Delivery
SEMO are now in the procurement phase of this project. Delivery
date Quarter 4 2012. – COMPLETE
16 On-Line Registration
System
The online registration system should decrease the
workload for new participants entering the SEM
and make the registration process less daunting
and more transparent.
Phase 1 Requirements and Design – In Progress – Due to be
completed in Q4 2012
Phase 2 Implementation – Started
17
Training
Environment
(Internal)
It is essential that additional Market Application
environments are made available to allow SEMO
to optimally train staff and thus reduce the
potential of operational issues in the live systems.
Phase 1 Delivery due July 2012 - COMPLETE
Table 1: Details of Capital Business Cases 2010-2013

Manage Change
SEMO Annual Report - Draft Page 7
2.2 System Releases - Central Market Systems Releases (01-Oct-2012 – 30-Sep-2013)
The following table summarises the releases deployed to the CMS in the period 01-Oct-2012 to 30-
Sep-2013:
CMS Release Deployment
Date Release Type
No. of
Change
Requests
No of
Defects
Interface
Impact?
SEM R2.0.2 23-Oct-2012 Wash-up (IDT) 0 7 No
SEM R2.1.0 16-Nov-2012 Scheduled 13 10 Yes
SEM R2.2.0 10-May-2013 Scheduled 7 23 Yes
SEM R2.2.1 25-Jun-2013 Wash-Up 0 6 No
Table 2: Release Activity Oct 2012 – Sep 2013
- SEM Release 2.3.0 – Proposed Deployment: November 15th
2013
The following table outlines the approved scope for the SEM R2.3.0 release to the CMS:
SEM R2.3.0 Approved Scope
CR Ref. Mod. Ref Sub-System Description
SEM_PC_CR174 N/A MI MPI Dropdown values for a Trading Site
SEM_PC_CR186 N/A MA Export Functionality in MA
SEM_PC_CR265 N/A STL Task Functionality
SEM_PC_CR310 N/A MA Run Cancellation Initialisation
SEM_PC_CR312 N/A MI Run Cancellation Functionality
SEM_PC_CR168 N/A STL Unnecessary File Import Type selection
SEM_PC_CR311 N/A MI VTOD Status Changes for Approval
SEM_PC_CR294 N/A STL DDF Linked to System Type within POMAX file import
SEM_PC_CR203 N/A MA Displaying UUC Penalty Costs in MA
Table 3: Approved Scope for SEM R2.3.0
The scope was published to the industry on April 22
nd 2013.
The design phase completed on schedule in July 2013.
Factory Test of the ABB software executed to schedule from August 21st to August 30
th 2013
inclusive.
Brady software was delivered on August 15th; ABB software was delivered on September 9th
.
System Integration Testing commenced on delivery of the software and is on-schedule for
completion on November 1st 2013.
The approved scope will not have a functional impact on the interfaces between Participant
systems and the Central Market Systems; however a short phase of Market Test will be conducted
from October 9th to October 25th to facilitate a regression test phase across the SEM.
The release is scheduled for deployment on November 15th
2013, subject to successful completion
of all testing.
- SEM Release R2.4.0 (Proposed Deployment: April 2014)
The release cut-off date for the April 2014 release to the Central Market Systems was September 27th
,
2013.

SEMO Annual Report - 2013 Page 8
A number of Change Requests have been sent to our vendors for impact assessment. A meeting of the
Change Control Forum (CCF) will be held on October 23rd
at which the scope for this release will be
discussed.
Subsequent to the CCF meeting a release scope proposal will be issued to the Regulatory Authorities
for approval. On receipt of Regulatory approval the scope will be published to the industry.
2.3 Modification Management The tables that follow give an overview of the activity that has taken place between 1
st Oct 2012 and
30th
Sept 2013. Table 4 and Table 5 show the dates and number of Modifications Committee Meetings
that took place over this period.
Meeting Date Location
45 24th October 2012 Belfast
46 5th December 2012 Dublin
47 12th February 2013 Belfast
48 11th April 2013 Dublin
49 13th June 2013 Belfast
50 15th August 2013 Dublin
Table 4: Modifications Committee Meetings
Modification Committee
Meetings
Q1
2012
Q2
2012
Q3
2012
Q4
2012 Total
Scheduled meetings 2 1 2 1 6
Other meetings 0 0 0 0 0
Working Groups 1 0 0 0 1
Table 5: Modification Committee Meetings & Working Groups
At the Modifications Committee Meetings, decisions are made to progress Modification Proposals.
Table 6 and Figure 1 give an outline of the amount of activity that has taken place in each quarter.
Modification Proposal Activity Q1
2013
Q2
2013
Q3
2013
Q4
2013 Total
Raised 7 4 4 2 17
Alternative Versions raised 2 1 1 1 5
Withdrawn 0 0 0 0 0
Deferred 4 4 3 4 15
Extension Granted 0 1 1 1 3
Recommended for Approval 9 3 4 0 16
Recommended for Rejection 0 0 0 0 0
Further Work Required 0 0 0 1 1
Approved 3 7 2 2 14
Rejected 0 0 0 0 0
Table 6: Modification Proposal Activity

SEMO Annual Report - 2013 Page 9
Figure 1 - Modifications Committee Activity
Finally, Table 7 and Figure 2 show the progress made on all the Modification Proposals submitted
since the beginning of the SEM in November 2007 and their status at the end of each quarter.
Modification Proposal Status
End
Q1
2013
End
Q2
2013
End
Q3
2013
End
Q4
2013
Raised 315 319 323 325
Withdrawn 46 46 46 46
Deferred 4 5 3 6
Recommended for Rejection 0 0 0 0
Recommended for Approval 7 3 4 1
Approved 6 13 2 4
Implemented 239 239 255 255
Rejected 13 13 13 13
Table 7: Modification Proposal Status at end of each Quarter
0
1
2
3
4
5
6
7
8
9
10
Modifications Committee Activity 1st Oct 2012 - 30th Sept 2013
Q1 2013
Q2 2013
Q3 2013
Q4 2013

SEMO Annual Report - 2013 Page 10
Figure 2 - Status of Modification Proposals from 1st November 2007 to 30
th Sept 2013
2.3.1 Publication of the Trading & Settlement Code
Trading & Settlement Code and Agreed Procedures Version 13.0, were published on the SEMO
website on 10th
May 2013 in line with the CMS release. Sixteen effective Modifications were included
in the version.
2.3.2 2013 Modifications Committee Elections
Modifications Committee Annual Elections started in June with a call for nominations for four
expiring positions on the Modifications Committee. The election process ran throughout July and was
completed in advance of Modifications Committee Meeting 50 on 15th
August 2013. The results are
set out in Table 8 below.
Expired Member New Member Position
Caitríona Diviney, IWEA Mary Doorly, IWEA Generator
Kevin Hannafin, Viridian Kevin Hannafin, Viridian Generator
Jill Murray, Bord Gáis Jill Murray, Bord Gáis Supplier
William Steele, Power NI William Steele, Power NI Supplier
Table 8 - Modifications Committee Elections
The election for Chair and Vice-Chair took place in August with both Iain Wright (Airtricity) and Jill
Murray (Bord Gáis) re-elected to the positions of Chair and Vice-Chair respectively.
2.4 Modifications Process Development
Modification Proposals were considered at bimonthly Modifications Committee Meetings alternating
between Belfast and Dublin.

SEMO Annual Report - 2013 Page 11
Full details of all modifications progressed during the year are available in the Modifications section
of the SEMO website. Summaries of some of the more significant Modification Proposals progressed
are presented below.
- Mod_11_12: Proposal to extend the definition of Special Units to include Compressed Air
Energy Storage (CAES)
This proposal, raised by Gaelectric at Meeting 42 sought extension of the definition of Special Units to
include CAES. The second meeting of the Working Group took place on 23rd
October 2012. Gaelectric
Energy Storage (GES) presented slides expanding on the options put forward at the first Working
Group (held on 6th
September).
Three options were developed by GES:
Option 1 – Full Price Making Storage
Existing Pumped Storage rules modified to include submission of Commercial Offer Data
and consideration of Constraint Payments
PQ Pairs submitted for Pumping and Generation, No Load and Start-Up Costs
Option 2 – Availability Feasible Storage Unit
Similar to an Interconnector Unit with offers submitted as a Predictable Price Maker
PQ Pairs submitted for negative storage (pumping) and adjusted during Trading Periods to
reflect available storage for Generation
Capacity Payments subject to energy limit
Option 3 – Linked Energy Limited Generator
Split Unit where pumping treated as Predictable Price Taker separate to Generation Unit,
which acts as a Energy Limited Predictable Price Maker
The group agreed that options 1 and 2 should be further developed. GES agreed to forward additional
details about the second option to the Secretariat for circulation to Working Group participants. An
action was placed on SEMO to initiate impact assessments for options 1 and 2 upon receipt of
additional information from GES.
SEMO received additional information from GES which was issued to ABB for impact assessment.
This modification was deferred at Meeting 46 held on Dec 6th
. The third meeting of the Working
Group took place on 23rd
January 2013.
SEMO presented the IA results for both options. The first option Full Price Making Storage was
assessed based on two sub-options; 1(a) Pumped Storage Unit with Commercial Offer Data and 1(b)
Pumped Storage Unit with Commercial Offer Data and a Pumped Storage Cycle Efficiency which is a
function of output rather than constant. The second option, New Unit with similar logic to
Interconnector Units, was discussed at length with the vendor. However, the vendor felt that it would
not fit well into the existing system architecture. While there was a consensus among WG members
that 1(b) was the preferred option if this proposal were to be implemented in the current market, it was
noted that the impacts on RCUC and relevant operational issues have not yet been assessed; it was felt
that this assessment would need to take place to complete the impact assessment.
At Meeting 47 on 12th
February 2013, an update regarding the progress of the objectives and
deliverables of the Terms of Reference of the Working Group was delivered to the Modifications
Committee. The Modification Proposal was deferred pending the outcome of a RCUC Impact
Assessment.. There was widespread recognition that the market will evolve in 2016 and that the work
completed on the proposal should go towards facilitating such a unit for future market arrangements.

SEMO Annual Report - 2013 Page 12
At Meeting 48, an update was given to the Modifications Committee advising that the TSO met with
GES regarding the procurement of the impact assessment on RCUC.
Committee consensus was for a proposal status of Deferred Dormant, only discussing the proposal at a
Meeting when there is a relevant update. The RCUC impact assessment is currently in progress with
an extension granted by the RAs until 18th
October 2013, pending completion of the impact
assessment.
- Mod_20_12 Timelines in relation to the scheduling of Ad Hoc Resettlement following an
upheld Query
This modification was raised by SEMO to improve the management of ad hoc resettlement, where a
large proportion of resettlement occurs together.
An alternative version of the proposal was developed by SEMO to address the issue of open-
endedness of timings with regard to ad hoc resettlement and was submitted for Meeting 46 where it
was approved. The AP Notification was published on the SEMO website with an effective date of 24th
December 2012.
- Mod_21_12: Amendment to Available Transfer Capacity (ATC) definition
This proposal was raised by the TSOs to allow them to curtail the flow on the Interconnector should an
unforeseen Interconnector or transmission system event occur. The alternative version of the proposal
was discussed by the Committee at Extraordinary Meeting 45. The proposal had been altered from the
original version, now permitting the TSO to change transfer capacity only prior to EA1, before any
trade has been established in the SEM. The proposal was recommended for approval at the meeting
and the FRR was issued to the RAs for final decision on 21st November 2012.
On 12th
August 2013, a decision was received from the RAs requesting that further work be carried out
on the FRR. The decision was discussed at Meeting 50 where the RAs requested that further clarity
within the FRR be provided, in relation to:
The underlying rationale for the proposal
The risks of not implementing the proposal and the alternatives that were considered
The commercial effects of any curtailment of IC flows
Discrimination introduced in the proposal against IC Users and IC Owners
The TSO provided an updated FRR addressing the above issues, for circulation to the Modifications
Committee. The FRR will be re-issued to the RAs for final decision.
- Mod_22_12: Administered Scheduling for General System Failure
This modification was raised by SEMO to allow the MO to set MIUNs to zero in the case of a General
Systems Failure. This is necessary to account for the situation where the Central Market System is
unavailable, yet the Market Operator has an obligation to produce MIUNs for Interconnector trading
day ahead and within day. SEMO developed alternative wording for this proposal at the request of the
Committee. It was recommended for approval at Modifications Meeting 46. The effective date of the
proposal was 6th
February 2013.
- Mod_23_12 Minimum Stable Generation Correction
Mod_23_12 was required to resolve a number of conflicts in the definition of Min Stable Generation,
some of which were noted during the certification process.
This modification further amends the Glossary definition of Minimum Stable Generation that was
amended in Mod_42_10v2 to ensure that the definition is not too narrow to exclude Ex-Ante

SEMO Annual Report - 2013 Page 13
references to Minimum Stable Generation. An alternative version of the proposal was submitted for
Meeting 47 on 12 February 2013 where it was recommended for approval by the Modifications
Committee. The effective date was 20th
March 2013.
- Mod_24_12: Amendments to the MIUN Calculator to Address Instances of Excessive
Area
Extraordinary Meeting 45 was called by the Chairman of the Modifications Committee following
advice by SEMO that there was an existing issue with the MIUN calculator. The issue, known as
“Extreme Ramping” was identified during testing following the implementation of Intra-Day Trading.
Prior to this modification, under the T&SC, previously determined MIUNs might not be fixed if there
was a change in ATC or if the net Interconnector flow was within Deadband limits. In this additional
scenario, which is characterised by the Interconnector profile being constrained by the Interconnector
Ramp Rate, ramping over multiple Trading Periods and a change in the dominant direction of ramping
between gates, previous MIUNs may also not be held fixed.
Although this scenario has never occurred in live operations to date, the MO deemed it prudent to raise
a Modification Proposal to provide a solution should an Extreme Ramping situation ever occur. The
solution will ensure that in all cases previously determined MIUNs will be fixed, a feasible
Interconnector profile will be produced and MIUNs will be less than or equal to IUNs. The proposal,
an Agreed Procedure Modification Proposal, received unanimous approval by the Committee at
Extraordinary Meeting 45. The AP Notification was published advising that the Modification Proposal
would become effective on the date the vendor confirms with the Market Operator to be the earliest
date in which the change can be implemented in the Market Systems. The proposal was made effective
on 3rd
May 2013.
- Mod_25_12: Suspension of Interconnector Unit on instruction of Interconnector Owner
due to breach of Access Rules
This proposal raised by the Interconnector Owners, proposed to allow the interconnector owner to
request that the Market Operator can suspend an interconnector unit if it no longer meets the eligibility
requirements or is in breach of the interconnector access rules. It was deferred at Modifications
Meeting 46, with an action placed on Participants to issue comments or issues related to the proposal
by 11th
January 2013. At Meeting 48 an action was placed on the proposers to monitor the issue and
revert to the Committee with an update in 6 months. An extension was granted by the RAs until 31st
January 2014.
- Mod_26_12: Notification Time for updating Interconnector Technical Data
This modification, raised by the Interconnector Administrator, changes the current 29 day timeline for
notification of changes to interconnector technical data back to its original value of 5 days. It was
recommended for approval at Modifications Meeting 46 subject to legal drafting changes. The AP
Notification was published on the SEMO website with an effective date of 21st December 2012.
- Mod_27_12: Representation of Price Takers in the MSP Software
This modification, raised by SEMO, arose from certification of the MSP Software and concerns the
individual representation of price takers in the MSP Software. The Code stated that these units were
not individually represented in the MSP Software when in fact they were. The proposal did not change
any calculations. It was recommended for approval at Modifications Meeting 46. The effective date of
the proposal was 11th
February 2013.
- Mod_28_12: Clarifications to Appendix N
This modification, raised by SEMO, corrects a number of inaccuracies in Appendix N in relation to
the definitions of Lower and Higher Operating Limits and the user of the term Availability. It was

SEMO Annual Report - 2013 Page 14
recommended for approval at Modifications Meeting 46. The proposal was made effective on 6th
February 2013.
- Mod_29_12: Dwell Time Up & Dwell Time Down Glossary Definitions
This modification, raised by SEMO, introduces glossary definitions for Dwell Up and Dwell Down
times. It was recommended for approval at Modifications Meeting 46. The proposal was made
effective on 6th
February 2013.
- Mod_30_12: Improved Efficiencies in Unit Registration Process
This modification proposed to streamline the current unit registration process for units entering the
SEM as set out in AP1. The procedural steps define a single process which covers all aspects of a unit
registration including, inter alia, the Market Operator receiving an application, validation of the
application by the various parties involved and the unit becoming effective in the market. An
alternative version of the proposal was submitted for consideration at Meeting 48 where it was
approved. The proposal was made effective on Wednesday 24th
April.
- Mod_01_13: Enduring Provisions for Interconnector point of Connection
This modification proposed enduring changes to define the submission point of Interconnector related
quantities as being at the opposite end of the link to SEM. The interim provisions in Section 7 had
expired as of November 1st 2012. Mod_11_11, raised in 2011 proposed similar enduring changes, but
the RA decision at the time was to once again extend the Section 7 provisions pending the outcome of
FUI discussions.
The proposal was Recommended for Approval at Meeting 47 and was subsequently approved by the
RAs, with an effective date of 5th March 2013.
- Mod_02_13: Registration of Charges
This modification originally proposed the removal of the obligation to register a charge over the
Collateral Reserve Accounts as a result of Participants not being compliant with the obligation to
register charges over the SEM Collateral Reserve Accounts. The proposal also sought to reduce the
substantial administrative work involved on the part of the MO in seeking to register charges over
Collateral Reserve Accounts of Participants in Ireland and in the UK or Northern Ireland.
Furthermore, where the Participant is incorporated in a country other than Ireland or the UK further
legal difficulties arise. This issue has been further exacerbated with the introduction of EWIC where a
number of Participants are incorporated in jurisdictions other than Ireland or the UK. Registering a
charge in another European jurisdiction has proven challenging for the MO.
The Modifications Committee sought independent legal support on the impacts of the proposal, with
part of the advices subcontracted to a NI firm. Following procurement of the legal advice, SEMO is on
an interim basis, proceeding to review and revise the current draft Deed of Charge and requesting the
relevant Participants to deliver duly executed deeds. EirGrid Legal and McCann Fitzgerald have been
in discussion in relation to the revision of the current Deed of Charge, so as to ensure the security of
the 29 collateral accounts which were transferred from Northern Bank to Danske Bank London.
The legal advisers are currently re-drafting the Modification Proposal and carrying out a legal review.
- Mod_04_13: Process for changing the VAT Jurisdiction of an Interconnector Unit
Mod_03_12 Alignment of TSC with revised VAT arrangements became effective on May 10th 2013.
As a result of this change, the jurisdiction of the Interconnector Units of three existing Interconnector
Users also changed on May 10th, which was in the middle of a billing period for Capacity. (The
Central Market System is unable to process settlement for a portion of the month allocated to one VAT
jurisdiction and the remaining portion allocated to another VAT jurisdiction. In order to account for

SEMO Annual Report - 2013 Page 15
this change, it was necessary to issue the affected Interconnector Units with new Account IDs and
corresponding digital certificates. All relevant credit cover information was transferred to the new
Account IDs. This modification clarified the process that will apply. The proposal was submitted for
consideration at Meeting 48 where it was voted on. The proposal was made effective on Wednesday
24th April.
- Mod_07_13: Clarification regarding the rules for Instruction Profiling in Appendix O
This modification clarifies issues raised by the auditors in relation to Instruction Profiling in Appendix
O. As part of a previous modification, Mod_37_09v2, the text of O.11, which deals with the case
where multiple Dispatch Instructions with the same Instruction Effective Time but different
Instruction Issue Time are issued for a Generator Unit, was modified to state that the instructions
should be ranked in the stated order and the highest ranked dispatch instruction should be used. This
was identified by the auditors as being inaccurate.
The change proposes to revert to the original text which describes the instructions as being ordered in
such a case and reflects what happens in practice in the Instruction Profiler. In addition, the
modification added detail regarding the merging of wind instructions to Table O.2. The proposal was
discussed and Recommended for Approval at Meeting 49. The proposal became effective on 17 July
2013.
- Mod_08_13 : Amendment to number of days granted to the MO for the issuing of Party
Accession Deeds
This proposal was raised following the Market Audit where it was found that SEMO was in breach of
its obligation to sign and date an Accession Deed and send a copy to the Applicant within two
Working Days of receipt. The proposal proposes to extend the timeline to 15 Working Days, which is
in practice a more realistic timeline, given the number of signatories which must be co-ordinated.
The Committee agreed on a timeline of 10 Working Days as a more suitable timeline to be adopted.
The proposal was discussed and Recommended for Approval at Meeting 49. It was made effective on
Friday 28th June.
- Mod_09_13: Amendment of AP7 to include the use of e-mail notification and the SEMO
public website in the event of a GSF
This modification proposes to amend AP7 to include the use of the SEMO public website and market
message e-mail alerts to supplement the current emergency communication methods and reflect
current practice.
- Mod_10_13: Removal of Requirement for SOs to send certain Dispatch Instruction Codes
and Instruction Combination Codes for Pumped Storage Units to the MO
This modification proposes to no longer send the different Dispatch Instruction Codes and Instruction
Combination Codes which are used to differentiate between the different modes of operation of
Pumped Storage units. These instructions are not required by the Instruction Profiler to profile the
instructions into Dispatch Quantities in SEM, Therefore, the SOs propose that they are no longer sent
to the Market Operator.

SEMO Annual Report - 2013 Page 16
3 Service Delivery These metrics indicate how timely SEMO were in producing reports to Market Participants.
3.1 Core Market Operations Function Performance
SEMO is obligated on every day to close the market gate, issue ex-ante indicative schedules and run
indicative and initial pricing runs. Every working day SEMO is obliged to issue initial and indicative
settlement runs.
The following series of graphs shows the percentage of all reports issued in the last year by quarter
that were on time, late by less than an hour or late by over an hour. In summary most reports were
issued on time or within an hour of the required time. Where initial reports go out over an hour late
(infrequent) these still are delivered on the day (less than 3 hours late). Some indicative settlement
reports have not been published on the day scheduled. These were published late due to technical
issues, operational errors or delay in information from the data providers. The full details of the
reasons for the delays are provided in the Monthly Market Operator Reports.
Figure 3 - Overall Daily report publication
Gate closure is a significant market event as all bids and offers are required to be captured at that
point.

SEMO Annual Report - 2013 Page 17
Figure 4 - Gate Closure performance
The initial Pricing and Settlement reports go out on a calendar and working day respectively. These
reports are used in the final settlement of the market.
Figure 5 - Initial Report Performance

SEMO Annual Report - 2013 Page 18
Delays in publishing the indicative reports were due to delays in receiving input files from data
providers, system performance issues, or operational errors.
Figure 6 - Performance of Indicative Reports
3.2 Planned Re-Settlement M+4 & M+13
Resettlement occurred on time for the year as scheduled in the Settlement Calendar.
3.3 Ad-hoc Re-Pricing and Ad-hoc Resettlement Runs
12 Ad-hoc re-pricing runs were issued during Financial Year 2012/2013.
Trade date 18/04/2013 was as a result of incorrect Metered Demand.
Trade dates 15/11/2012, 16/11/2012 and 17/11/2012 were a result of incorrect Actual
Availability.
There were 8 re-prices due to a Pump Storage defect for M+13 Trade Dates 10/08/2012,
20/08/2012 and M+4 Trade Dates 11/05/2013, 13/05/2013, 15/05/2013, 24/05/2013,
29/05/2013 and 30/05/2013.
More detailed narratives of each of these events can be found in the Quarterly reports.
Ad-hoc Resettlements were carried out for 27 events. These were the result of incorrect Meter Data
submissions, incorrect Dispatch Instructions or Actual Availabilities being sent by the respective TSO,
operational errors by SEMO, as well as system defects.
More detailed narratives of each of these events can be found in the Quarterly reports.

SEMO Annual Report - 2013 Page 19
3.4 Administration of Credit Cover
The SEM has been collateralised according to the T&SC provisions for the whole period from 1st
October 2012 to 30th September 2013. At times, the collateralisation may be slightly less than the
calculated requirement due to the time allowed by the T&SC for Participants to comply with a Credit
Cover Increase Notice (CCIN). All but two CCINs were fully honoured by Participants within the two
days allowed for in the T&SC, these, however, were received after the 17:00 deadline the same day.
Figure 7 - Market Collateralisation
Figure 8 - Credit Cover Increase Notice Amounts per Day

SEMO Annual Report - 2013 Page 20
Figure 9 - Total Value of Credit Cover Increases by Participants
3.5 Breaches of the Trading and Settlement Code
SEMO is aware of 217 breaches of the T&SC in the period from 1st October 2012 to 30th September
2013. This is a reduction of 61 breaches from last year’s annual figure of 278 breaches. A breach of
the T&SC can range from minor issues like a late receipt of a data feed to major ones like payment
defaults leading to suspension from the Market. The breaches in financial year 2012/2013, were at the
lesser end of non compliance with no significant breach identified in the period.
In total, SEMO were responsible for 81 of the total breaches. This is a reduction of over 30% on last
year’s figure of 120 SEMO breaches. The key to this reduction has been an emphasis on
improvements in both system performance and mitigation of operational errors through training and
procedural changes. There were also 108 identified breaches by participants.
€0
€10,000,000
€20,000,000
€30,000,000
€40,000,000
€50,000,000
€60,000,000
€70,000,000
€80,000,000
€90,000,000
€100,000,000
€110,000,000
€120,000,000
€130,000,000
€140,000,000
€150,000,000
€160,000,000
Va
lue
of C
CIN
s
Participant
Q1 2012 Q2 2013 Q3 2013 Q4 2013

SEMO Annual Report - 2013 Page 21
Figure 10- Number of Trading and Settlement Code Breaches
Figure 11 - Source of SEMO Trading and Settlement Code Breaches

SEMO Annual Report - 2013 Page 22
4 Manage Stakeholders
4.1 Structured Approach to Regulatory interface
SEMO and the Regulatory Authorities have developed a good working relationship around a
number of formal interactions. The highlights of 2012-2013 are summarised below.
Bimonthly meetings continued and covered issues in relation to the Trading & Settlement Code
and the Market Operator obligations. The key issues addressed during this period include:
SEMO Revenue Control decision for October 2013-September 2016.
Reporting obligations – Quarterly and End of Year reporting on SEMO operations and
financials were issued throughout the year.
Annual publications and reports were delivered and published on time e.g. the Market
Operator Agreement.
Compliance - Market Operator and Trading & Settlement Code obligations on
compliance were reported on.
Market System Development Plan 5 was delivered in July 2013.

SEMO Annual Report - 2013 Page 23
5 Provide Information The Trading and Settlement Code (T&SC) obligates SEMO to answer formal data and settlement
queries within a given timeframes. In financial year 2012/2013, SEMO has received 202 Formal
Queries; all were answered within the timelines prescribed under the T&SC. SEMO has requested
additional time, as allowed for under the TS&C, for only 2 of these. This is in line with requests made
in the previous financial year.
General queries have no prescribed timelines for response however SEMO aims to answer these
within 15 working days.
5.1 Customer Queries in a timely Manner
5.1.1 Query and Dispute Management:
Figure 12 - Number of Data Queries Submitted and Resolved up to 30th September 2013
Figure 13 - Number of Settlement Queries Submitted and Resolved up to 30th September 2013

SEMO Annual Report - 2013 Page 24
Figure 14 - Number of General Queries Submitted and Resolved up to 30th September 2013
The general query volumes have decreased from 3643 submitted in the previous financial year, to
2749 submitted from October 2012 to September 2013 (difference of 894). A decrease of 795 can be
attributed to:
432 general queries submitted in the previous financial year were in relation to Intraday
Trading testing and release
363 requests to pay invoices using cash collateral accounts were received in the previous
financial year, during this period they were logged as general queries and assigned a Service
Level Agreement. Since October 2012 these requests are logged without a Service Level
Agreement, and are not included in the general query statistics
The remaining difference (99) can be attributed to a number of factors, such as:
Updates to the Frequently Asked Questions on the SEMO website
SEMO are proactively engaging with Participants through a number of forums to help reduce
the number of general queries submitted
A maturing market with less change implemented in the last financial year

SEMO Annual Report - 2013 Page 25
Figure 15- Average Working Days to Answer Queries up to 30th September 2013
Further commentary on the Formal Queries is provided in section 6.1.
SEMO received 24 Formal Disputes between 1/10/12 and 30/09/13, 17 of which are still pending as of
November 6th
, 2013.

SEMO Annual Report - 2013 Page 26
5.2 Facilitate and Educate participants to accede to the Code
Since 1st October 2012, the following participants have registered in the market.
Party ID Party Name / Participant Name Jurisdiction Effective Date
PY_000108 Carbon Sole Ltd ROI 02/10/2012
PY_000111 Empower Generation Limited NI 01/03/2013
PY_000112 Templederry Renewable Energy Supply Ltd ROI 01/03/2013
PY_000114 Electricity Exchange Limited ROI 19/04/2013
PY_000115 Aughrim Power Supply Limited ROI 14/06/2013
PY_000116 Panda Power Limited ROI 22/08/2013
PY_000119 Bruckana Wind Farm Limited ROI 12/09/2013
PY_000118 Bruckana Wind Farm Supply Limited ROI 12/09/2013
PY_000117 Mount Lucas Wind Farm Limited ROI 12/09/2013
PY_000120 Mount Lucas Supply Company Limited ROI 12/09/2013
PY_000121 Taurbeg Limited ROI 26/10/2013
PY_000122 Dalkia Alternative Energy Limited ROI 05/11/2013
PY_000124 Dunmore Wind Farm Limited NI 25/10/2013
PY_000123 LGLP Energy Supply Limited ROI 03/10/2013
PY_000113 Energy Trading Ireland NI 19/04/2013
Table 9 - Party Registrations
Since 1st October 2012, additional generation or supply units have been added to the following
participants.
Party ID Party Name/
Participant Name Jurisdiction Unit
Effective
Date
PY_000098 ElectroRoute Energy
Trading ROI
PT_400096_I_RIEWIC_ElectroRoute
Energy Trading 01/10/2012
PY_000100 RWE Supply &
Trading GmbH ROI
PT_400098_I_RIEWIC_RWE Supply &
Trading GmbH 01/10/2012
PY_000030 ESB PGEN EWIC ROI PT_400030_I_RIEWIC_ESB PGEN EWIC 01/10/2012
PY_000027 Bord Gáis ROI PT_400099_I_RIEWIC_Bord Gáis 01/10/2012
PY_000021 Airtricity Limited ROI PT_400021_I_RIEWIC_Airtricity Limited 01/10/2012
PY_000042 VESL EWIC ROI PT_400100_I_RIEWIC_VESL EWIC 01/10/2012
PY_000043
Ballycadden Wind
Farm Netting
Generator Unit
ROI GU_411290_Ballycadden Wind Farm
Netting Generator Unit 17/10/2012
PY_000043 Ballycadden Wind
Farm ROI GU_401290_Ballycadden Wind Farm 17/10/2012
PY_000076 DAE Virtual Power
Plant ROI GU_411300_DAE Virtual Power Plant 23/10/2012
PY_000076 DAE Virtual Power
Plant ROI DSU_401300_DAE Virtual Power Plant 23/10/2012
PY_000076 DAE Virtual Power
Plant ROI SU_400154_DAE Virtual Power Plant 23/10/2012
PY_000056 AES Ballylumford
Limited GT1 NI
GU_500283_AES Ballylumford Limited
GT1 01/11/2012

SEMO Annual Report - 2013 Page 27
PY_000056 AES Ballylumford
Limited GT2 NI
GU_500284_AES Ballylumford Limited
GT2 01/11/2012
PY_000070 AES Kilroot Power
Ltd GT1 NI GU_500824_AES Kilroot Power Ltd GT1 01/11/2012
PY_000070 AES Kilroot Power
Ltd GT2 NI GU_500825_AES Kilroot Power Ltd GT2 01/11/2012
PY_000028 Coolkeeragh ESB Ltd
GT8 NI GU_500041_Coolkeeragh ESB Ltd GT8 01/02/2013
PY_000043
Viridian Energy
Limited Domestic
Supplier
ROI SU_400155_Viridian Energy Limited
Domestic Supplier 21/05/2013
PY_000085 Carrickatane Netting
Generator Unit NI
GU_511190_Carrickatane Netting
Generator Unit 12/12/2012
PY_000085 Carrickatane Wind
Farm NI GU_501190_Carrickatane Wind Farm 12/12/2012
PY_000068
Garracummer Wind
Farm Netting
Generator Unit
ROI GU_411310_Garracummer Wind Farm
Netting Generator Unit 22/11/2012
PY_000068 Garracummer Wind
Farm Ltd ROI GU_401310_Garracummer Wind Farm Ltd 22/11/2012
PY_000027 Lisheen Netting
Generator Unit ROI
GU_411320_Lisheen Netting Generator
Unit 06/03/2013
PY_000027 Lisheen WindFarm II
Ltd ROI GU_401320_Lisheen WindFarm II Ltd 06/03/2013
PY_000067 Galeforce Energy
Supply ROI SU_400157_Galeforce Energy Supply 04/04/2013
PY_000031
Carn hill Wind farm
Netting Generator
Unit
NI GU_511210_Carn hill Wind farm Netting
Generator Unit 18/04/2013
PY_000031 Carn Hill Windfarm NI GU_501210_Carn Hill Windfarm 18/04/2013
PY_000103 Danske Commodities
A/S ROI
PT_400108_I_RIEWIC_Danske
Commodities A/S 12/05/2013
PY_000043
Gibbet Hill Windfarm
Netting Generator
Unit
ROI GU_411340_Gibbet Hill Windfarm Netting
Generator Unit 13/02/2013
PY_000043 Gibbet Hill Windfarm ROI GU_401340_Gibbet Hill Windfarm 13/02/2013
PY_000110 Burren Energy Supply
Limited ROI SU_400159_Burren Energy Supply Limited 08/08/2013
PY_000110
Knocknagoum
Windfarm Netting
Generator Unit
ROI GU_411350_Knocknagoum Windfarm
Netting Generator Unit 08/08/2013
PY_000110 Knocknagoum
Windfarm Limited ROI
GU_401350_Knocknagoum Windfarm
Limited 08/08/2013
PY_000043
Ballycadden Wind
Farm Phase 2 Netting
Generator Unit
ROI GU_411360_Ballycadden Wind Farm Phase
2 Netting Generator Unit 27/03/2013
PY_000043 Ballycadden Wind
Farm Phase 2 ROI
GU_401360_Ballycadden Wind Farm Phase
2 27/03/2013
PY_000027
Smithstown Windfarm
Limited Netting
Generator Unit
ROI GU_411370_Smithstown Windfarm
Limited Netting Generator Unit 26/06/2013
PY_000027 Ballymartin Windfarm
Phase 2 ROI
GU_401370_Ballymartin Windfarm Phase
2 26/06/2013

SEMO Annual Report - 2013 Page 28
PY_000021
Athea Wind Farm
Netting Generator
Unit
ROI GU_411380_Athea Wind Farm Netting
Generator Unit 15/08/2013
PY_000021 Athea Wind Farm ROI GU_401380_Athea Wind Farm 15/08/2013
PY_000100 RWE Supply &
Trading GmbH ROI
PT_400113_I_RIEWIC_RWE Supply &
Trading GmbH 12/05/2013
PY_000098 ElectroRoute Energy
Trading Ltd NI
PT_500069_I_NIMOYLE_ElectroRoute
Energy Trading Ltd 12/05/2013
PY_000103 Danske Commodities
A/S NI
PT_500070_I_NIMOYLE_Danske
Commodities A/S 12/05/2013
PY_000071
SSE Generation
Ireland Limited -
Interconnector Unit
NI PT_500072_I_NIMOYLE_SSE Generation
Ireland Limited - Interconnector Unit 23/10/2013
PY_000043
Viridian Eeergy
Supply Limited -
EWIC
ROI PT_400115_I_RIEWIC_Viridian Eeergy
Supply Limited - EWIC 12/05/2013
PY_000027 Ballymartin Wind
Farm Phase 1 ROI
GU_401410_Ballymartin Wind Farm Phase
1 03/10/2013
PY_000092 Fuinneamh Gaoithe
Teoranta - Supply Unit ROI
SU_400162_Fuinneamh Gaoithe Teoranta -
Supply Unit 09/10/2013
PY_000115 Aughrim Power
Supply Limited ROI
SU_400163_Aughrim Power Supply
Limited 30/10/2013
PY_000102 Endesa Generación
MOYLE NI
PT_500071_I_NIMOYLE_Endesa
Generación MOYLE 23/10/2013
PY_000027
Booltiagh 2 Wind
Farm Netting
Generator Unit
ROI GU_411420_Booltiagh 2 Wind Farm
Netting Generator Unit 01/08/2013
PY_000027 Booltiagh 2 Wind
Farm ROI GU_401420_Booltiagh 2 Wind Farm 18/09/2013
PY_000027
Booltiagh WF 1
Netting Generator
Unit
ROI GU_411430_Booltiagh WF 1 Netting
Generator Unit 18/09/2013
PY_000027 Booltiagh Wind Farm
1 ROI GU_401430_Booltiagh Wind Farm 1 18/09/2013
PY_000032
Gort Windfarm Ltd
(Derrybrien) Netting
Generator Unit
ROI GU_411440_Gort Windfarm Ltd
(Derrybrien) Netting Generator Unit 01/08/2013
PY_000032 Derrybrien Wind Farm ROI GU_401440_Derrybrien Wind Farm 01/07/2013
Table 10 - Unit Registrations
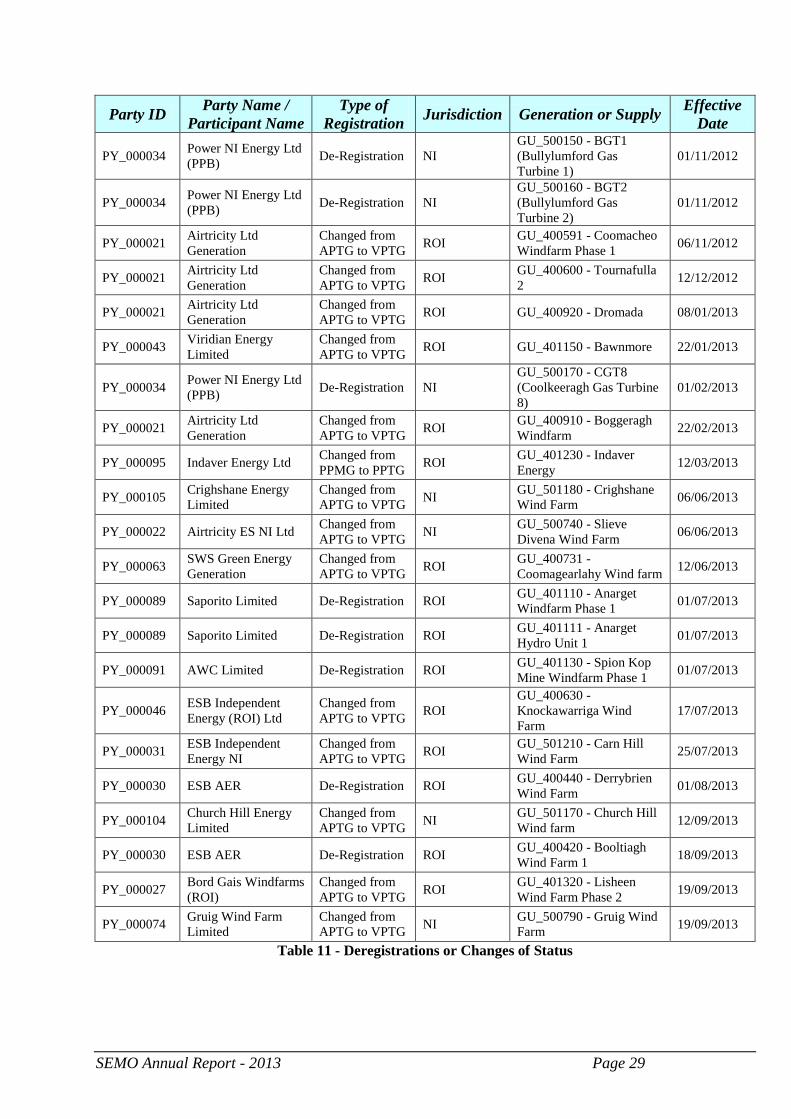
Since 1st October 2012, the following participants have de-registered or had a unit change its status in
the market.
Party ID Party Name /
Participant Name
Type of
Registration Jurisdiction Generation or Supply
Effective
Date
PY_000022 Airtricity ES NI Ltd Changed from
APTG to VPTG NI
GU_500010 - Tappaghan
Wind Farm 11/10/2012
PY_000085 Hunters Hill
Windfarm Limited
Changed from
APTG to VPTG NI
GU_501150 - Curryfree
Wind Farm 18/10/2012
PY_000034 Power NI Energy Ltd
(PPB) De-Registration NI
GU_500080 - KGT1
(Kilroot Gas Turbine 1) 01/11/2012
PY_000034 Power NI Energy Ltd
(PPB) De-Registration NI
GU_500090 - KGT2
(Kilroot Gas Turbine 2) 01/11/2012
SEMO Annual Report - 2013 Page 29
Party ID Party Name /
Participant Name
Type of
Registration Jurisdiction Generation or Supply
Effective
Date
PY_000034 Power NI Energy Ltd
(PPB) De-Registration NI
GU_500150 - BGT1
(Bullylumford Gas
Turbine 1)
01/11/2012
PY_000034 Power NI Energy Ltd
(PPB) De-Registration NI
GU_500160 - BGT2
(Bullylumford Gas
Turbine 2)
01/11/2012
PY_000021 Airtricity Ltd
Generation
Changed from
APTG to VPTG ROI
GU_400591 - Coomacheo
Windfarm Phase 1 06/11/2012
PY_000021 Airtricity Ltd
Generation
Changed from
APTG to VPTG ROI
GU_400600 - Tournafulla
2 12/12/2012
PY_000021 Airtricity Ltd
Generation
Changed from
APTG to VPTG ROI GU_400920 - Dromada 08/01/2013
PY_000043 Viridian Energy
Limited
Changed from
APTG to VPTG ROI GU_401150 - Bawnmore 22/01/2013
PY_000034 Power NI Energy Ltd
(PPB) De-Registration NI
GU_500170 - CGT8
(Coolkeeragh Gas Turbine
8)
01/02/2013
PY_000021 Airtricity Ltd
Generation
Changed from
APTG to VPTG ROI
GU_400910 - Boggeragh
Windfarm 22/02/2013
PY_000095 Indaver Energy Ltd Changed from
PPMG to PPTG ROI
GU_401230 - Indaver
Energy 12/03/2013
PY_000105 Crighshane Energy
Limited
Changed from
APTG to VPTG NI
GU_501180 - Crighshane
Wind Farm 06/06/2013
PY_000022 Airtricity ES NI Ltd Changed from
APTG to VPTG NI
GU_500740 - Slieve
Divena Wind Farm 06/06/2013
PY_000063 SWS Green Energy
Generation
Changed from
APTG to VPTG ROI
GU_400731 -
Coomagearlahy Wind farm 12/06/2013
PY_000089 Saporito Limited De-Registration ROI GU_401110 - Anarget
Windfarm Phase 1 01/07/2013
PY_000089 Saporito Limited De-Registration ROI GU_401111 - Anarget
Hydro Unit 1 01/07/2013
PY_000091 AWC Limited De-Registration ROI GU_401130 - Spion Kop
Mine Windfarm Phase 1 01/07/2013
PY_000046 ESB Independent
Energy (ROI) Ltd
Changed from
APTG to VPTG ROI
GU_400630 -
Knockawarriga Wind
Farm
17/07/2013
PY_000031 ESB Independent
Energy NI
Changed from
APTG to VPTG ROI
GU_501210 - Carn Hill
Wind Farm 25/07/2013
PY_000030 ESB AER De-Registration ROI GU_400440 - Derrybrien
Wind Farm 01/08/2013
PY_000104 Church Hill Energy
Limited
Changed from
APTG to VPTG NI
GU_501170 - Church Hill
Wind farm 12/09/2013
PY_000030 ESB AER De-Registration ROI GU_400420 - Booltiagh
Wind Farm 1 18/09/2013
PY_000027 Bord Gais Windfarms
(ROI)
Changed from
APTG to VPTG ROI
GU_401320 - Lisheen
Wind Farm Phase 2 19/09/2013
PY_000074 Gruig Wind Farm
Limited
Changed from
APTG to VPTG NI
GU_500790 - Gruig Wind
Farm 19/09/2013
Table 11 - Deregistrations or Changes of Status

SEMO Annual Report - 2013 Page 30
5.3 Facilitate Interaction with Customers
5.3.1 Stakeholder Events
SEMO is proactive in interaction with its stakeholders. In the past 12 months SEMO have:
Organised, facilitated and presented in:
o 6 Market Operator User Groups (MOUGs)
Facilitated Participant Readiness calls for new Market Participants
Carried out 3 Welcome to the Market Training Sessions for new Participants
Organised 1 special topic workshop to discuss proposed registration changes
Bilateral meetings/training sessions with Participants and stakeholders on specific topics
including Electroroute, ESB, Vayu, NIE T&D, MRSO, Coilte, Regulators
A series of conference calls and workshops as part of the SEM R2.2.0 Release Testing
Hosted delegation from UCD Energy Conference
Presented to a delegation from the Oman Market Operator & Regulator
Presented to a delegation from Vietnam Market Operator & Regulator (August 21st 2013)
Hosted a delegation from the Vietnam Market Operator and Regulator for two weeks in
September
SEMO also took part in visits by the Electricity Regulatory Authority of Vietnam and
Gridco of Ghana

SEMO Annual Report - 2013 Page 31
6 SEM Review
6.1 Formal Queries
Since Market go live in Nov 2007, SEM has observed a continuing reduction in the volume of queries
submitted by Participants. This was until financial year 2011/2012 where the number of Formal
Queries started to increase again as shown in Figure 16 below.
Figure 16 – Number of Formal Data and Settlement Queries Received per Year
This is due to a series of major releases that have happened in that period including Global
Aggregation NI, MIUN calculator and Intra-Day Trading (IDT). Issues derived from those releases
have contributed to the increase of formal queries received in the previous and current year. Compared
to the previous year there has been no increase in the number of Data Queries submitted and 25
additional Settlement Queries. This results in an overall increase of 14% from the previous year.
Details are included in Table 15 below.
YEAR DATA SETTLEMENT TOTAL % CHANGE
2007/2008 209 418 627 -
2008/2009 122 322 444 -29%
2009/2010 62 190 252 -43%
2010/2011 25 95 120 -52%
2011/2012 47 130 177 48%
2012/2013 47 155 202 14%
Table 12 - Formal Data and Settlement Queries Received
The breakdown of the reasons behind Data Queries received is shown in Figure 17 below.
0
100
200
300
400
500
600
700
2007/2008 2008/2009 2009/2010 2010/2011 2011/2012 2012/2013
N.o
f Q
ue
rie
s
Financial Year
DATA SETTLEMENT

SEMO Annual Report - 2013 Page 32
Figure 17 - Data Queries by subject matter
Over half of the queries referred to issues with Availability, with all other eleven topics only featuring
in one or two instances; the seven queries on Technical Offer Data (TOD), all refer to the same
participant and to an issue with the TOD approval process that affected a number of consecutive dates,
which were all queried individually. The majority of the queries on Availability, as shown in Figure 18
below, have not been upheld, the values being confirmed by the relevant TSO; however, some of them
have been turned into disputes which are still outstanding.
Figure 18 - Responses on Most Queried Item in Data Queries– Availability
With regards to Settlement queries Figure 19 below show the breakdown for financial year 2012/2013:
0
5
10
15
20
25
30
2012/2013
N.o
f Q
ue
rie
s
Availability
Commercial Offer Data
Dispatch Instructions
Instruction Profil ing
Interconnector
Metered Demand
Metered Generation
MGEU
MSQ
Payment Calculation
Report
Technical Offer Data
0
2
4
6
8
10
12
14
16
2012/2013
N.o
f Q
ue
rie
s
Input Confirmed Input Error

SEMO Annual Report - 2013 Page 33
Figure 19 - Settlement Queries by subject matter
The two most common Settlement Queries received were on Availability and Metered Generation.
This is in contrast to previous years where Instruction Profiling or Dispatch Instructions where the
most common. Figure 20 shows that in the case of the most recurrent queried item, Availability, the
vast majority (83%) were upheld. The issues were mostly due to incorrect data being sent to the SEM.
There were four queries related to issues resulting from a single operational error affecting four dates.
Figure 20 - Responses on Most Queried Item in Settlement Queries– Availability
0
5
10
15
20
25
30
35
2012/2013
N.o
f Q
ue
rie
sAvailabilityCapacity SettlementCommercial Offer DataCurrency CostDispatch InstructionsDOG-PUGEligible AvailabiltyInstruction ProfilingInterconnectorLoss Adjustment FactorsMetered DemandMetered GenerationMGEUMOCPayment CalculationRejectedReportResettlementSO-SO TradeTechnical Offer DataUnder Test
0
5
10
15
20
25
2012/2013
N.o
f Q
ue
rie
s
Input Confirmed Input Error Operational Error

SEMO Annual Report - 2013 Page 34
The overall trend for all Formal queries since Market go live, confirms that the number of spurious
queries has diminished and that queries not upheld now represent a minority of received queries.
Figure 21 – Upheld/Not Upheld Formal Queries
Figure 22 below show that of all not upheld queries, 23% of them are withdrawn, rejected or raised
with an incorrect understanding of the Market rules.
Figure 22 –Formal Queries Not Upheld by response type
The following two graphs in Figure 23 and Figure 24 show the response times for Data and Settlement
Queries over the previous two years. Queries continue to be responded to within the required timelines
0
50
100
150
200
250
300
350
DA
TA
SETT
LEM
ENT
DA
TA
SETT
LEM
ENT
DA
TA
SETT
LEM
ENT
DA
TA
SETT
LEM
ENT
DA
TA
SETT
LEM
ENT
DA
TA
SETT
LEM
ENT
2007/2008 2008/2009 2009/2010 2010/2011 2011/2012 2012/2013
N.o
f Q
ue
rie
s
Query Types by Financial Year
Upheld
Not Upheld
0
5
10
15
20
25
DATA SETTLEMENT
2012/2013
N.o
f Que
ries
Withdrawn
Understanding
Rejected
Output Confirmed
Input Confirmed

SEMO Annual Report - 2013 Page 35
set out in the Trading & Settlement Code1. In Figure 23 it can be observed that only a small number of
extensions (two) have been requested for Data Queries in the current financial year. Requests for 10
Day extensions to the timeline were heavily used in the first years of market operations. Response time
continue to be below the T&SC maximum allowed, with the majority of queries answered within the
first three working days of being received.
Figure 23 – Response Times for Data Queries
The same is shown in Figure 24 below for Settlement Queries. There was no query extended in the
observed period and queries have been responded, in the majority of cases, within the first five
working days of being received.
Figure 24 - Response Times for Settlement Queries
1 Please note that graph shows number of actual days instead of working days; this explains how some queries seems to
exceed the T&SC timelines. This is particularly evident in the Data Query graph as a number of queries were responded
after the Christmas break.
0
2
4
6
8
10
12
0 1 2 3 4 6 7 8 9 10 11 12 15 16 17 0 1 2 3 4 5 7 11 12 13 14 16 20 25
2011/2012 2012/2013
N.o
f Que
ries
Response time in days for Data Queries
Not Extended Extended
0
2
4
6
8
10
12
14
16
18
20
0 2 4 6 8 11 13 15 17 19 21 23 25 29 31 37 0 2 4 6 8 10 12 14 16 18 20 22 24 28 30
2011/2012 2012/2013
N.o
f Que
ries
Response time in days for Settlement Queries
Not Extended Extended

SEMO Annual Report - 2013 Page 36
6.2 Market Review
Figure 25 below shows the summed Daily Generator Availability and the Load Weighted Average
System Marginal Price across the whole financial year.
The Availability overall has increased; however, sharp decreases can be seen as large units outages
coincided with periods of Interconnector outage between February and March 2013. This, coupled
with a period of unseasonal low temperatures and substantial increase in fuel costs on the International
Market, has resulted in higher System Marginal Price (SMP) for the period. SMP has since returned to
more stable values. A report published by SEMO in May 2013, provides more details on SMP increase
over the period February/March 20132.
Initial indications are that the introduction of further interconnection has put downward pressure on
SMP. This will be further detailed in section 6.3.1.
Due to the impact of the higher prices around March 2013, overall average SMP was slightly higher
than the previous year, and more volatile: the daily average volume weighted SMP was €64.9 in
financial year 2012 compared to €69.6 in 2013.
Figure 25 – Daily Total Availability and Volume Weighted Average SMP
When the Load Weighted SMP is compared against Metered Demand as in Figure 26 below, we can
see that the Demand is still at full winter level until the end of March due to the exceptionally cold
weather. The Demand curve is otherwise similar to the previous year with more volatility throughout
the year.
2 ‘Frequency of Market Operator Solver Policy Use (January to March 2013)’ available on the SEM-O website at:
http://www.sem-o.com/Publications/General/Frequency%20of%20Market%20Operator%20Solver%20Policy%20Use%20-
%20Jan%20to%20March%202013.pdf
0
50,000
100,000
150,000
200,000
250,000
300,000
350,000
400,000
450,000
500,000
€0
€20
€40
€60
€80
€100
€120
€140
01
/10
/20
12
13
/10
/20
12
25
/10
/20
12
06
/11
/20
12
18
/11
/20
12
30
/11
/20
12
12
/12
/20
12
24
/12
/20
12
05
/01
/20
13
17
/01
/20
13
29
/01
/20
13
10
/02
/20
13
22
/02
/20
13
06
/03
/20
13
18
/03
/20
13
30
/03
/20
13
11
/04
/20
13
23
/04
/20
13
05
/05
/20
13
17
/05
/20
13
29
/05
/20
13
10
/06
/20
13
22
/06
/20
13
04
/07
/20
13
16
/07
/20
13
28
/07
/20
13
09
/08
/20
13
21
/08
/20
13
02
/09
/20
13
14
/09
/20
13
26
/09
/20
13
Dai
ly A
ctu
al A
vaila
bili
ty (
MW
)
Syst
em
Mar
gin
al P
rice
(€
/MW
h)
Total Daily Actual Availability Volume Weighted Daily SMP

SEMO Annual Report - 2013 Page 37
Figure 26 –Total Daily Metered Demand and Volume Weighted Daily SMP
Figure 27 compares the total monthly metered Demand values for each year since 2008. Demand level
for financial year 2012 and 2013 were on a par with the previous year or increasing slightly throughout
the year, with small reductions only in the month of May and June.
Figure 27 – Total Monthly Metered Demand, Jan 2008 to Sept 2013 Comparison
Throughout the year variations in Demand and Availability of plants, lead to significant changes in
Margin. When Margin is compared to Load Weighted Average SMP, it is clearly visible how the SMP
is inversely affected by the Margin. Similarly to previous years, a pattern is discernible in Figure 28.
0
40,000
80,000
120,000
160,000
200,000
240,000
€0
€20
€40
€60
€80
€100
€120
€140
01/1
0/20
12
14/1
0/20
12
27/1
0/20
12
09/1
1/20
12
22/1
1/20
12
05/1
2/20
12
18/1
2/20
12
31/1
2/20
12
13/0
1/20
13
26/0
1/20
13
08/0
2/20
13
21/0
2/20
13
06/0
3/20
13
19/0
3/20
13
01/0
4/20
13
14/0
4/20
13
27/0
4/20
13
10/0
5/20
13
23/0
5/20
13
05/0
6/20
13
18/0
6/20
13
01/0
7/20
13
14/0
7/20
13
27/0
7/20
13
09/0
8/20
13
22/0
8/20
13
04/0
9/20
13
17/0
9/20
13
30/0
9/20
13
Tota
l Dem
and
(MW
)
Syst
em M
argi
nal
Pric
e (€
/MW
h)
Total Daily Demand Volume Weighted Daily SMP
0
500,000
1,000,000
1,500,000
2,000,000
2,500,000
3,000,000
3,500,000
4,000,000
20
08
20
10
20
12
20
08
20
10
20
12
20
08
20
10
20
12
20
08
20
10
20
12
20
08
20
10
20
12
20
08
20
10
20
12
20
08
20
10
20
12
20
08
20
10
20
12
20
08
20
10
20
12
20
08
20
10
20
12
20
09
20
11
20
08
20
10
20
12
Jan Feb Mar Apr May Jun Jul Aug Sep Oct Nov Dec
Met
ered
Dem
and
(MW
h)

SEMO Annual Report - 2013 Page 38
Figure 28 - Average Margin and Volume Weighted SMP
Figure 29 below shows the average daily SMP values by Trading Periods for the whole financial year
from October 1st 2012 to September 30
th 2013 for the three main run types. Similar to previous years
the runs on average converge closely for most of the day with small variances concentrated over the
morning and the evening peaks.
Figure 29 - Average Daily SMP from 1st Oct 2012 to 30
th Sep 2013
0
1,000
2,000
3,000
4,000
5,000
6,000
7,000
8,000
€0.00
€20.00
€40.00
€60.00
€80.00
€100.00
€120.00
€140.00
01
/10
/20
12
15
/10
/20
12
29
/10
/20
12
12
/11
/20
12
26
/11
/20
12
10
/12
/20
12
24
/12
/20
12
07
/01
/20
13
21
/01
/20
13
04
/02
/20
13
18
/02
/20
13
04
/03
/20
13
18
/03
/20
13
01
/04
/20
13
15
/04
/20
13
29
/04
/20
13
13
/05
/20
13
27
/05
/20
13
10
/06
/20
13
24
/06
/20
13
08
/07
/20
13
22
/07
/20
13
05
/08
/20
13
19
/08
/20
13
02
/09
/20
13
16
/09
/20
13
30
/09
/20
13
Ave
rage
Dai
ly M
argi
n (
MW
)
Syst
em
Mar
gin
al P
rice
(€
/MW
h)
Daily Volume Weighted SMP Average Daily Margin
€0
€20
€40
€60
€80
€100
€120
€140
1 2 1 2 1 2 1 2 1 2 1 2 1 2 1 2 1 2 1 2 1 2 1 2 1 2 1 2 1 2 1 2 1 2 1 2 1 2 1 2 1 2 1 2 1 2 1 2
1 2 3 4 5 6 7 8 9 10 11 12 13 14 15 16 17 18 19 20 21 22 23 24
Ave
rage
SM
P p
er
Trad
ing
Pe
rio
d (€
/MW
h)
EA EP1 EP2

SEMO Annual Report - 2013 Page 39
Figure 30 below illustrates how the EA2 and WD1 compare with the EA and, again, only very small
variations are observed over the morning and evening peak
Figure 30 - Average SMP by TP from 22nd
July 2012 to 30th
Sep 2012(IDT runs)
6.3 Other Studies and Work
6.3.1 Analysis of the Impact of EWIC Full Operation on SMP
SEMO has carried out an analysis of how the SMP has been impacted by the new East West
Interconnector (EWIC) coming into full operation.
This initial study was limited to the first two months of EWIC being operational at full capacity (May
to June 2013); however, SEMO plans to continue the analysis for a larger period of time to confirm the
results obtained.
The study has shown that when EWIC was made unavailable, SMP increased overall by 7% which
represent an average of 5€/MWh per Trade Day, compared to having EWIC available up to its
maximum capacity of 500MW. Production Costs also increased for all Trading days in the study,
when EWIC was made unavailable.
6.3.2 Guarantees of Origin and Fuel Mix Disclosure
SEMO is the issuing body of Guarantees of Origin (GO) in Ireland. SEMO began registering
interested parties for the scheme in December 2011 and registration has been open to eligible
Generators since; to date 81 Generators and 7 Suppliers have registered. For the production year 2013
to date, 1,104,387 GO Certificates have been issued. GO certificates are issued on a quarterly basis.
Trading of European certificates has also taken place with 850,955 imported for the production year
2012; this marks a significant increase on the 101,000 certificates imported for the production year
2011.
The Fuel Mix Disclosure Enduring Solution is a separate annual project linked to Guarantees of
Origin. SEMO is the calculating body for the Fuel Mix Disclosure of both Ireland and Northern
Ireland. The disclosure calculation for 2011 was the first year that the enduring solution was in place;
this meant that Suppliers could declare GOs in their Fuel Mix submissions. This method is being used
going forward. Suppliers have received their fuel mix breakdowns and a final publication of the data
by the Regulatory Authorities has been completed for the 2012 calculation.
€0
€20
€40
€60
€80
€100
€120
€140
1 2 1 2 1 2 1 2 1 2 1 2 1 2 1 2 1 2 1 2 1 2 1 2 1 2 1 2 1 2 1 2 1 2 1 2 1 2 1 2 1 2 1 2 1 2 1 2
1 2 3 4 5 6 7 8 9 10 11 12 13 14 15 16 17 18 19 20 21 22 23 24
Ave
rage
SM
P pe
r Tra
ding
Per
iod
(€/M
Wh)
EA EA2 WD1