seneca county, ohio · village of bloomfield there is no previously effective fis for the village...
TRANSCRIPT

SENECA COUNTY, OHIO AND INCORPORATED AREAS
COMMUNITY COMMUNITY NAME NUMBER
ATTICA, VILLAGE OF* 390991 BETTSVILLE, VILLAGE OF 390500 BLOOMFIELD, VILLAGE OF* 390989 NEW RIEGEL, VILLAGE OF* 390990
REPUBLIC, VILLAGE OF 390992 SENECA COUNTY UNINCORPORATED AREAS 390779
TIFFIN, CITY OF 390502
*NO SPECIAL FLOOD HAZARD AREAS IDENTIFIED Seneca County
Effective Date May 3, 2011
Federal Emergency Management Agency
FLOOD INSURANCE STUDY NUMBER 39147CV000A

NOTICE TO FLOOD INSURANCE STUDY USERS
Communities participating in the National Flood Insurance Program have established repositories of flood hazard data for floodplain management and flood insurance purposes. This Flood Insurance Study (FIS) report may not contain all data available within the Community Map Repository. Please contact the Community Map Repository for any additional data. The Federal Emergency Management Agency (FEMA) may revise and republish part or all of this FIS report at any time. In addition, FEMA may revise part of this FIS report by the Letter of Map Revision process, which does not involve republication or redistribution of the FIS report. Therefore, users should consult with community officials and check the Community Map Repository to obtain the most current FIS report components. Selected Flood Insurance Rate Map panels for this community contain information that was previously shown separately on the corresponding Flood Boundary and Floodway Map panels (e.g., floodways, cross sections). In addition, former flood hazard zone designations have been changed as follows:
Old Zone(s) New Zone
A1 through A30 AE B X (shaded) C X
Initial countywide FIS effective date: May 3, 2011

TABLE OF CONTENTS
PAGE 1.0 INTRODUCTION ..................................................................................................... 1 1.1. Purpose of Study ......................................................................................... 1 1.2. Authority and Acknowledgments ................................................................. 1 1.3. Coordination ................................................................................................ 3 2.0 AREA STUDIED ...................................................................................................... 3
2.1 Scope of Study ............................................................................................ 3 2.2 Community Description ............................................................................... 4 2.3 Principal Flood Problems ............................................................................ 5 2.4 Flood Protection Measures ......................................................................... 5
3.0 ENGINEERING METHODS .................................................................................... 6
3.1 Hydrologic Analyses .................................................................................... 6 3.2 Hydraulic Analyses ...................................................................................... 7 3.3 Vertical Datum ............................................................................................. 9
4.0 FLOODPLAIN MANAGEMENT APPLICATIONS.................................................... 10
4.1 Floodplain Boundaries ................................................................................. 11 4.2 Floodways ................................................................................................... 11
5.0 INSURANCE APPLICATIONS ................................................................................ 15 6.0 FLOOD INSURANCE RATE MAP .......................................................................... 16 7.0 OTHER STUDIES ................................................................................................... 17 8.0 LOCATION OF DATA ............................................................................................. 17 9.0 BIBLIOGRAPHY AND REFERENCES ................................................................... 19
i

ii
TABLE OF CONTENTS – (Continued)
PAGE FIGURES
Figure 1 Vertical Datum Conversion ................................................................................ 9 Figure 2 Floodway Schematic ......................................................................................... 12
TABLES
Table 1 CCO Meeting Dates for Pre-countywide FIS ..................................................... 3 Table 2 Limits of Detailed Study ................................................................................... 4 Table 3 Summary of LOMCs Incorporated .................................................................... 4 Table 4 Summary of Discharges .................................................................................... 7 Table 5 Channel and Overbank Roughness (Manning’s “n”) Factors ............................ 8 Table 6 Vertical Datum Adjustment ................................................................................ 10 Table 7 Floodway Data .................................................................................................. 13-14 Table 8 Community Map History .................................................................................... 18
EXHIBITS EXHIBIT 1 – Flood Profiles
Sandusky River Panels 01P-06P PUBLISHED SEPARATELY: Flood Insurance Rate Map Index
Flood Insurance Rate Map

FLOOD INSURANCE STUDY
SENECA COUNTY, OHIO AND INCORPORATED AREAS
1.0 INTRODUCTION
1.1 Purpose of Study
This Flood Insurance Study (FIS) revises and supersedes the FIS reports, Flood Insurance Rate Maps (FIRMs), Flood Boundary and Floodway Maps in the geographic area of Seneca County, Ohio, including: the Village of Attica, Village of Bettsville, Village of Bloomfield, Village of New Riegel, Village of Republic, City of Tiffin and Seneca County Unincorporated Areas and aids in the administration of the National Flood Insurance Act of 1968 and the Flood Disaster Protection Act of 1973. This study has developed flood risk data for various areas of the community that will be used to establish actuarial flood insurance rates. This information will also be used by Seneca County to update existing floodplain regulations as part of the Regular Phase of the National Flood Insurance Program (NFIP), and by local and regional planners to further promote sound land use and floodplain development. Minimum floodplain management requirements for participation in the NFIP are set forth in the Code of Federal Regulations at 44 CFR, 60.3.
The Village of Green Springs and the City of Fostoria are dual-county communities located in Seneca and Sandusky Counties and Seneca and Hancock Counties. Information for the Village of Green Springs is included in the FIS report for Sandusky County. Information for the City of Fostoria is included in the FIS report for Hancock County.
The Village of Attica, Village of Bloomfield and the Village of New Riegel are communities with no Special Flood Hazard Areas identified.
In some states or communities, floodplain management criteria or regulations may exist that are more restrictive or comprehensive than the minimum Federal requirements. In such cases, the more restrictive criteria take precedence and the State (or other jurisdictional agency) will be able to explain them.
The Digital Flood Insurance Rate Maps (DFIRMs) and FIS Report for this countywide study have been produced in digital format. Flood hazard information was converted to meet the Federal Emergency Management Agency (FEMA) DFIRM database specifications and Geographic Information System (GIS) format requirements. The flood hazard information was created and is provided in a digital format so that it can be incorporated into a local GIS and be accessed more easily by the community.
1.2 Authority and Acknowledgments
The sources of authority for this Flood Insurance Study are the National Flood Insurance Act of 1968 and the Flood Disaster Protection Act of 1973.
1

Redelineation of previously effective flood hazard information for this FIS report and accompanying FIRMs, correction to the North American Vertical Datum of 1988, as well as conversion of the incorporated areas of Seneca County into Countywide Format was performed by Stantec Consulting Services, Inc., for the Federal Emergency Management Agency under Contract No. HSFE05-05-D-0026, Task Order No. 37. This work was completed in August, 2009.
Information pertaining to the authority and acknowledgements for each of the previously effective FIS reports and new floodplain studies for communities within Seneca County was compiled for this FIS report and is shown below. Village of Attica There is no previously effective FIS for the Village of
Attica. Village of Bettsville There is no previously effective FIS for the Village of
Bettsville. Village of Bloomfield There is no previously effective FIS for the Village of
Bloomfield. City of Fostoria There is no previously effective FIS for the City of
Fostoria. Village of Green Springs The Village of Green Springs is a dual county
community in Seneca and Sandusky Counties. Information for the Village of Green Springs can be found in the Sandusky County FIS.
Village of New Riegel There is no previously effective FIS for the Village of
New Riegel. Village of Republic There is no previously effective FIS for the Village of
Republic. Seneca County The previously effective FIS for Seneca County (Unincorporated Areas) Unincorporated Areas is dated May 17, 1990. The
hydrologic and hydraulic analyses for this study were performed by the U.S. Army Corps of Engineers (USACE), Buffalo District for the Federal Emergency Management Agency (FEMA), under Inter-Agency Agreement No. EMW-86-E-2226, Project Order No. 16. This study was completed in September 1987. (Reference 1)
City of Tiffin The previously effective FIS for the City of Tiffin is
dated July 3, 1986. The hydrologic and hydraulic analyses for this study were obtained from “Special Flood Hazard Evaluation Report, Sandusky River, City of Tiffin, Seneca County, Ohio” (References 2 and 3).
2

The digital topographic data was provided by the Ohio Statewide Imagery Program (OSIP) with a 2-foot contour interval dated 2005 (Reference 4). The coordinate system used for the production of this DFIRM is State Plane Ohio North 3402 Feet, North American Datum 1983, Lambert Conformal Conic Projection. Differences in the datum and projection system used in the production of DFIRMs for adjacent counties may result in slight positional differences in map features at the county boundaries. These differences do not affect the accuracy of information shown on this DFIRM.
1.3 Coordination
The purpose of an initial Consultation Coordination Officer’s (CCO’s) meeting is to discuss the scope of the FIS. A final CCO meeting is held to review the results of the study. The dates of the initial and final CCO meetings held for the previous FIS reports covering the geographic area of Seneca County, Ohio are shown in Table 1. The initial and final CCO meetings were attended by representatives of FEMA, the Ohio Department of Natural Resources (ODNR), Seneca County, and the Study Contractor.
TABLE 1. CCO MEETING DATES FOR PRE-COUNTYWIDE FIS
COMMUNITY NAME INITIAL CCO DATE FINAL CCO DATE SENECA COUNTY UNINCORPORATED AREAS October 31, 1985 June 6, 1989
CITY OF TIFFIN * August 22, 1985 VILLAGE OF ATTICA ** ** VILLAGE OF BETTSVILLE ** ** VILLAGE OF BLOOMFIELD ** ** VILLAGE OF NEW RIEGEL ** ** VILLAGE OF REPUBLIC ** ** * Data not available ** Not Applicable Source: References 1 and 2
The initial CCO meeting for this countywide FIS was held on May 14, 2007 and was attended by representatives of FEMA, Seneca County, ODNR and the study contractor. The results of the study were reviewed at the final CCO meeting held on November 18, 2009, and attended by representatives of FEMA, Seneca County, ODNR and the study contractor. All problems raised at that meeting have been addressed.
2.0 AREA STUDIED
2.1 Scope of Study
This FIS covers the geographic area of Seneca County, Ohio. All previously effective FIRM panels for Seneca County have been revised, updated and republished in a countywide format as a part of this FIS. Analyses described herein refer collectively to previous study efforts detailed in References 1-2. The FIRM panel index, Exhibit 2, illustrates the revised FIRM panel layout.
3

Approximate methods of analysis were used to study those areas having low development potential and/or minimal flood hazards as identified at the initial CCO meetings detailed in Table 1. The scope and methods of approximate study were agreed upon by FEMA and Seneca County, and consequently, 263 miles of stream reaches were studied by approximate methods. The reaches studied by approximate methods can be found in previous hydrologic and hydraulic analysis reports (References 12 and 18).
The areas studied by detailed methods were selected as a priority that was given to known flood hazard areas, areas of projected development and proposed construction. The Sandusky River flooding source was studied by detailed methods. The detailed reach is summarized in Table 2.
TABLE 2. LIMITS OF DETAILED STUDY
STREAM REACH
STUDY LENGTH (MILES)
LIMIT OF DETAILED STUDY
Sandusky River 12.3
From approximately 11,500 feet above confluence with Spicer Creek to approximately 50,000 feet above confluence with Spicer Creek and from approximately 71,200 feet above confluence with Spicer Creek to approximately 97,500 feet above confluence of Spicer Creek.
Source: References 1 and 2
This countywide FIS also incorporated the determination of letters issued by FEMA resulting in map changes (Letters of Map Change, or LOMCs). All LOMCs in Seneca County for which information could be found are summarized in the Summary of Map Action (SOMA) submitted to the local community officials associated with this FIS update. All incorporated Letters of Map Revision are summarized in Table 3. Copies of the SOMA may be obtained from the Community Map Repository.
TABLE 3. SUMMARY OF LOMCs INCORPORATED
Case Number Flooding Source Community Date Issued Type----- ----- ----- ----- -----
2.2 Community Description
Seneca County, Ohio encompasses approximately 548 square miles and is located in north-central Ohio. It is bounded on the north by Sandusky County, west by Wood and Hancock Counties, south by Wyandot and Crawford Counties, and east by Huron County. The population of the county based on U.S. Census Bureau’s July 1, 2007 estimate is approximately 56,705 persons. The county seat is the City of Tiffin.
4

Seneca County is served by U.S. Routes 23 and 224, State Routes 4, 18, 19, 53, 57, 100, 101, 162, 199, 228, 231, 587, 590, and 635, Conrail, the Norfolk Southern Railway, and the CSX railroad. Seneca County, which is primarily rural, had a reported 1980 population of 61,901 (Reference 5). The population of the county based on the U.S. Census Bureau’s 2007 estimate is approximately 56,705 persons (Reference 6). The county seat is the City of Tiffin (Reference 1).
Seneca County has a continental climate, which is characterized by moderate extremes of temperature and precipitation. The maximum temperature of 100°F was recorded in September 1953 at the Bucyrus, Ohio, climatological data station; the minimum of -19°F was recorded in December 1973, and the maximum 24-hour snowfall was 16.0 inches, recorded on March 3, 1963 Reference 7).
The City of Tiffin is located in the center of Seneca County and is completely surrounded by the unincorporated areas of Seneca County. In 1980, the population of Tiffin was reported to be 19,549 (Reference 8). The population of the county based on the U.S. Census Bureau’s 2007 estimate is approximately 17,363. The city is served by State Routes 18, 53, 100, and 231, and the Chessie System and Conrail railroads (Reference 2).
2.3 Principal Flood Problems
In the geographic area of Seneca County, floods have been observed in the Sandusky River watershed for over 100 years. Basin-wide floods have occurred in February 1833, January 1847, February 1883, and January, February, and March 1904. The greatest flood of record both in stage and discharge was the March 1913 flood which had an estimated recurrence interval of 200 years. More than 20 lives were lost and damages estimated at the time amounted to well over $2 million. A majority of the bridges between upper Sandusky and the mouth of the river were destroyed. Homes in low-lying areas were flooded to the second floor. Some of the other more significant floods were in June 1937 and January – February 1959, both having a 20-year recurrence interval; and January 1980, March 1963, March 1978, and June 1981, each having a recurrence interval of 10 years. No recurrence intervals were estimated for floods prior to 1913 (Reference 9). Ice jams have been known to aggravate the flood stages. Damage producing floods occur on the average of about once every 2 years somewhere along the river. Because most of Seneca County is rural, widespread flooding and flooding of long duration on small streams is not a major problem (References 1 and 2).
2.4 Flood Protection Measures
In Seneca County Unincorporated Areas no flood protection measures are known to exist (Reference 1).
In the City of Tiffin, Bacon’s and Water Plant Dams, which are located along the Sandusky River, provide some flood protection within the community (Reference 2).
5

Floodwalls exist in the City of Tiffin that provide the community with some degree of protection against flooding. However, it has been ascertained that these floodwalls may not protect the community from rare events such as the 1-percent-annual-chance flood. The criteria used to evaluate protection against the 1-percent-annual-chance flood are 1) adequate design, including freeboard, 2) structural stability, and 3) proper operation and maintenance. Floodwalls that do not protect against the 1-percent-annual chance flood are not considered in the hydraulic analysis of the 1-percent-annual-chance floodplain (Reference 2).
3.0 ENGINEERING METHODS
For the flooding sources studied by detailed methods in Seneca County, standard hydrologic and hydraulic study methods were used to determine the flood hazard data required for these studies. Flood events of a magnitude that are expected to be equaled or exceeded once on the average during any 10-, 50-, 100-, or 500-year period (recurrence interval) have been selected as having special significance for floodplain management and for flood insurance rates. These events, commonly termed the 10-, 50-, 100-, and 500-year floods, have a 10-, 2-, 1-, and 0.2-percent chance, respectively, of being equaled or exceeded during any year. Although the recurrence interval represents the long-term, average period between floods of a specific magnitude, rare floods could occur at short intervals or even within the same year. The risk of experiencing a rare flood increases when periods greater than 1 year are considered. For example, the risk of having a flood that equals or exceeds the 1-percent-annual-chance flood in any 50-year period is approximately 40 percent (4 in 10); for any 90 year period, the risk increases to approximately 60 percent (6 in 10). The analyses reported herein reflect flooding potentials based on conditions existing in the community at the time of completion of the original study. Maps and flood elevations will be amended periodically to reflect future changes.
3.1 Hydrologic Analyses
Hydrologic analyses were carried out to establish peak discharge-frequency relationships for each flooding source studied by detailed methods affecting the community.
In Seneca County Unincorporated Areas, data obtained from the USGS gaging station on the Sandusky River located just downstream of the County Route 90 bridge were used to simulate the 1-percent-annual chance peak discharges for each of the study segments according to the criteria outlined in Bulletin 17B (Reference 10). The 1-percent-annual-chance peak discharge for the upstream segment of Sandusky River was determined using the discharge-frequency curve at the gage station. The 1-percent-annual-chance peak discharge for the other reaches located immediately upstream and downstream of the City of Tiffin was calculated using a technique developed for the Irondequoit Creek Watershed (Reference 11).
In the City of Tiffin, stream gage records at Bucyrus, Upper Sandusky, Mexico, and Fremont along the Sandusky River were used. A plot of drainage area versus discharge for each return period was then determined. From this plot, discharges for the corresponding drainage area at the City of Tiffin were derived (Reference 2).
6

Peak discharges for the 10-, 2-, 1-, and 0.2-percent-annual-chance floods of each flooding source studied in detail in Seneca County are shown in Table 4.
TABLE 4 – SUMMARY OF DISCHARGES
PEAK DISCHARGE (CFS)
FLOODING SOURCE AND LOCATION
DRAINAGE AREA (SQ.
MILES)
10-PERCENT ANNUAL CHANCE
2-
PERCENT ANNUAL CHANCE
1-
PERCENT ANNUAL CHANCE
0.2-
PERCENT ANNUAL CHANCE
Sandusky River Just upstream of Spicer Creek
1,033 ----- ----- 33,700 -----
Just downstream of the confluence of Morrison Creek
1,028 20,500 ----- 33,000 42,500
Just upstream of Rock Creek
966 19,500 ----- 31,700 40,500
Just downstream of County Route 90
774 ----- ----- 26,000 -----
For the approximate study of flooding sources in Seneca County, hydrologic calculations were performed using regression equations presented in A Streamflow Statistics (StreamStats) Web Application for Ohio by Koltun, G.F., Kula, S.P. and Puskas, B.M., 2006, USGS, Scientific Investigations Report (SIR) 2006-5312. The regression equations use drainage area, slope of the main channel, percentage of basin classified as wetlands and water, along with regional regression constants (Reference 12). Additionally, several closed basin systems (depressions with floodplains mapped on the effective maps) were analyzed in Sandusky County as part of the approximate study of flooding sources. For these areas SCS TR-55 methodology was used to determine the volume of runoff for each closed basin system. A stage versus storage curve was developed for each closed basin system using the 2-foot contour data and assuming no outflow. The Zone A floodplain elevation was then determined based on the stage associated with the volume of runoff computed.
3.2 Hydraulic Analyses
Analyses of the hydraulic characteristics of flooding from the sources studied were carried out to provide estimates of the elevations of floods of the selected recurrence intervals. Users should be aware that flood elevations shown on the FIRM represent rounded whole-foot elevations and may not exactly reflect the elevations shown on the Flood Profiles or in the Floodway Data tables in the FIS report. Flood elevations shown on the FIRM are primarily intended for flood insurance rating purposes. For construction and/or floodplain management purposes, users are cautioned to use the flood elevation data presented in this FIS report in conjunction with the data shown on the FIRM.
For the detailed analysis of the Sandusky River in Seneca County Unincorporated Areas, cross-section data for the channel and overbank areas were obtained by field survey and topographic maps (References 13 and 14).
7

Bridges were field surveyed and bridge plans were used to obtain elevation data and structural geometry (Reference 1).
For the detailed analysis of the Sandusky River in the City of Tiffin, cross sections were field surveyed (Reference 2).
Roughness coefficients (Manning’s “n”) used in the detailed hydraulic computations for the Sandusky River were chosen by engineering judgment and based on field observation of the stream and floodplain areas. In Seneca County Unincorporated Areas the contraction-loss coefficient ranged between 0.1 and 0.3 and the expansion-loss coefficient ranged between 0.3 and 0.5 (Reference 1).
TABLE 5. CHANNEL AND OVERBANK ROUGHNESS (MANNING’S “N”) FACTORS
STREAM NAME ROUGHNESS COEFFICIENT
Channel Overbank
Sandusky River 0.030-0.040 0.03-0.25 Source: References 1 and 2.
The starting water-surface elevation for the downstream segment of the Sandusky River in Seneca County Unincorporated Areas was determined by normal-depth calculations. For the middle segment immediately upstream of the City of Tiffin, the starting water-surface elevation was taken from the Flood Insurance Study for the City of Tiffin (Reference 2). For the upstream segment, the starting water-surface elevation was taken from rating curves developed from gage data obtained at the County Route 90 Bridge (Reference 1).
Starting water surface elevations for the Sandusky River in the City of Tiffin were computed using critical depth analysis (Reference 2).
Water surface elevations for the 1-percent-annual-chance flood in Seneca County Unincorporated Areas were computed using the HEC-2 step-backwater computer program (References 1 and 15).
For the City of Tiffin the hydraulic analysis for the Sandusky River was made using a later version of the U.S. Army Corps of Engineers HEC-2 step-backwater computer model (Reference 16).
For the approximate study of flooding sources in Seneca County, the hydraulic analyses were performed using United States Army Corps of Engineers (USACE) HEC-RAS (version 4.0) models (Reference 17). Structural measurements and field survey were not performed. No structures were modeled in the new approximate study. Cross section geometry was derived from topographic maps with a 2-ft contour interval provided by OSIP with an average spacing of between 1,000 and 3,000 feet. Average roughness factors (Manning’s n) were estimated based on aerial mapping. The starting water surface elevation was specified as a known water surface if a downstream water surface elevation could be determined from an effective detailed study or a discharge-elevation curve. If a downstream water surface elevation was not available, the starting water surface elevation was assumed to be normal depth.
8

When coincident peak criteria were met (the ratio of the drainage areas of the streams at a confluence was between 0.6 and 1.4) a junction was created in the HEC-RAS model at the confluence of the study streams. The model then used the calculated water surface elevation from the receiving stream as the boundary condition for the contributing stream (Reference 18).
3.3 Vertical Datum
All FIS reports and FIRMs are referenced to a specific vertical datum. The vertical datum provides a starting point against which flood, ground, and structure elevations can be referenced and compared. Until recently, the standard vertical datum in use for newly created or revised FIS reports and FIRMs was the National Geodetic Vertical Datum of 1929 (NGVD29). With the finalization of the North American Vertical Datum of 1988 (NAVD88), many FIS reports and FIRMs are now being prepared using NAVD88 as the referenced vertical datum. It is important to note that the adjacent counties may be referenced to NGVD29. This may result in differences of Base Flood Elevations (BFEs) across the county boundary.
Flood elevations shown in this FIS report and on the FIRM are referenced to NAVD88. Structure and ground elevations in the community must be referenced to NAVD88. Effective information for this FIS was converted from NGVD 29 to NAVD88 based on data presented in Figure 1 and Table 6. An average conversion of -0.523 feet (NGVD29 – 0.523 = NAVD 88) was applied uniformly across the county to covert all effective BFEs and other profile elevations.
!!
! !
! ! ! !
!!!!
-0.571-0.584-0.607-0.584
-0.495-0.479
Figure 1. Vertical Datum Conversion
AtticaAlvada
Watson FiresideBascomFostoria Flat Rock
CentertonBloomvilleNew Riegel
Tiffin North
Tiffin South
-0.436 -0.459 -0.463 -0.456
-0.577 -0.561
9

TABLE 6: VERTICAL DATUM ADJUSTMENT
QUADRANGLE NAME CORNER
NAD 27 LATTITUDE (DEC.
DEG)
NAD 27 LONGITUDE (DEC. DEG)
CHANGE (FEET)
Fostoria SE 41.125 -83.125 -0.584
Bascom SE 41.125 -83.250 -0.607 Tiffin North SE 41.125 -83.125 -0.584
Watson SE 41.125 -83.000 -0.571 Fireside SE 41.125 -82.875 -0.577
Flat Rock SE 41.125 -82.750 -0.561 Alvada SE 41.000 -83.375 -0.436
New Riegel SE 41.000 -83.250 -0.459 Tiffin South SE 41.000 -83.125 -0.463 Bloomville SE 41.000 -83.000 -0.456
Attica SE 41.000 -82.875 -0.479 Centerton SE 41.000 -82.750 -0.495
Min -0.436 Max -0.607 Average -0.523 Maximum Offset -0.087
For more information on NAVD88, see the FEMA publication entitled Converting the National Flood Insurance Program to the North American Vertical Datum of 1988 (FEMA, June 1992), or contact the Spatial Reference Division of the National Geodetic Survey, National Oceanic and Atmospheric Administration, Silver Springs Metro Center 3, 1315 East-West Highway, Silver Springs, Maryland 20910-3282 (301) 713-3242 (Website: www.ngs.noaa.gov).
Temporary vertical monuments are often established during the preparation of a flood hazard analysis for the purpose of establishing local vertical control. Although these monuments are not shown on the FIRM, interested individuals may contact FEMA to access these data.
4.0 FLOODPLAIN MANAGEMENT APPLICATIONS
The NFIP encourages state and local governments to adopt sound floodplain management programs. Therefore, each FIS provides 1-percent-annual-chance flood elevations and delineations of the 1- and 0.2-percent-annual-chance floodplain boundaries and 1-percent-annual-chance floodway to assist communities in developing floodplain management measures. This information is presented on the FIRM and in many components of the FIS report, including Flood Profiles and Floodway Data Tables. Users should reference the data presented in the FIS report as well as additional information that may be available at the local map repository before making flood elevation and/or floodplain boundary determinations.
10

4.1 Floodplain Boundaries
To provide a national standard without regional discrimination, the 1-percent-annual-chance flood has been adopted by FEMA as the base flood for floodplain management purposes. The 0.2-percent-annual-chance flood is employed to indicate additional areas of flood risk in the community. For each stream studied by detailed methods, the 1- and 0.2-percent-annual-chance floodplain boundaries have been delineated using the flood elevations determined at each cross section. Between cross sections, the boundaries were interpolated using topographic maps. Topographic mapping used for floodplain delineation was provided by OSIP and has a 2-foot contour interval for the entire county.
The 1- and 0.2-percent-annual-chance floodplain boundaries are shown on the FIRM (Exhibit 2). On this map, the 1-percent-annual-chance floodplain boundary corresponds to the boundary of the areas of special flood hazards (Zones A, AE); and the 0.2-percent-annual-chance floodplain boundary corresponds to the boundary of areas of moderate flood hazards (shaded Zone X). In cases where the 1- and 0.2-percent-annual-chance floodplain boundaries are close together, only the 1-percent-annual-chance floodplain boundary has been shown. Small areas within the floodplain boundaries may lie above the flood elevations but cannot be shown due to limitations of the map scale and/or lack of detailed topographic data.
For the streams studied by approximate methods, only the 1-percent-annual-chance floodplain boundary is shown on the FIRM (Exhibit 2).
4.2 Floodways
Encroachment on floodplains, such as structures and fill, reduces flood-carrying capacity, increases flood heights and velocities, and increases flood hazards in areas beyond the encroachment itself. One aspect of floodplain management involves balancing the economic gain from floodplain development against the resulting increase in flood hazard. For purposes of the NFIP, a floodway is used as a tool to assist local communities in this aspect of floodplain management. Under this concept, the area of the 1-percent-annual-chance floodplain is divided into a floodway and a floodway fringe. The floodway is the channel of a stream, plus any adjacent floodplain areas, that must be kept free of encroachment so that the 1-percent-annual-chance flood can be carried without substantial increases in flood heights. Minimum Federal standards limit such increases to 1.0 foot, provided that hazardous velocities are not produced. The floodways in this study are presented to local agencies as minimum standards that can be adopted directly or that can be used as a basis for additional floodway studies.
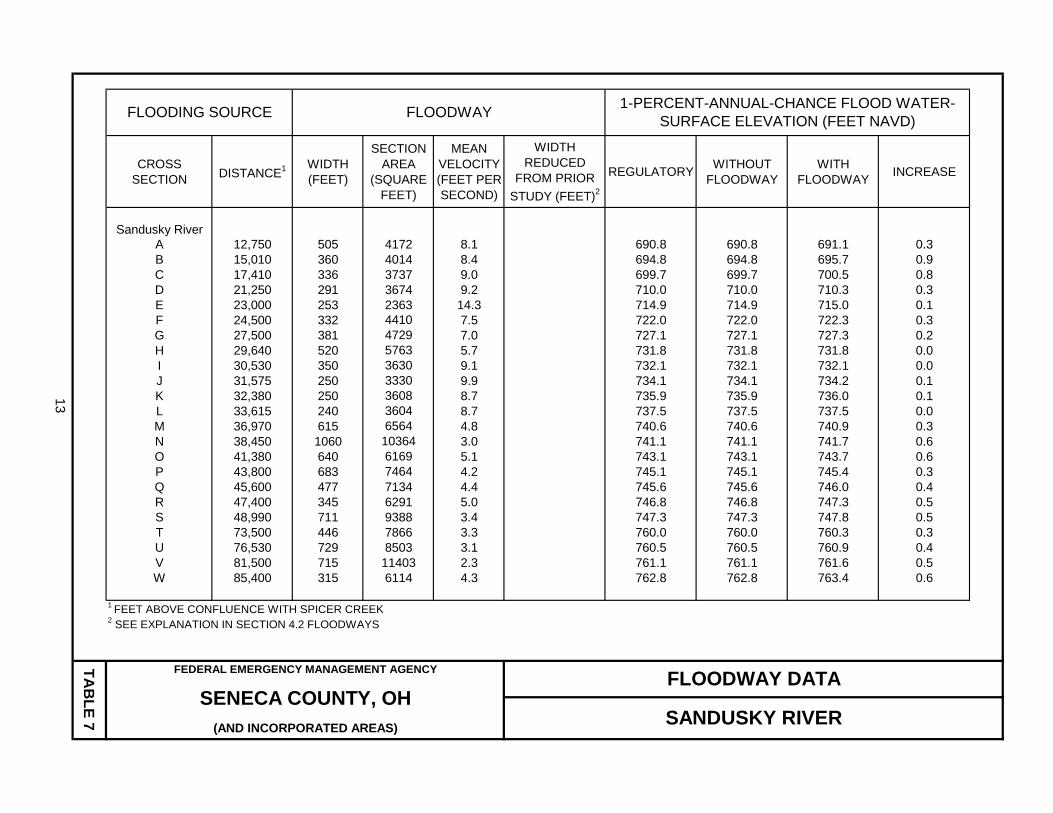
The floodway presented in this FIS report and on the FIRM was computed for certain stream segments on the basis of equal conveyance reduction from each side of the floodplain. Floodway widths were computed at cross sections. Between cross sections, the floodway boundaries were interpolated. The results of the floodway computations have been tabulated for selected cross sections (Table 7). In cases where the floodway and 1-percent-annual-chance floodplain boundaries are either close together or collinear, only the floodway boundary has been shown.
11

The area between the floodway and 1-percent-annual-chance floodplain boundaries is termed the floodway fringe. The floodway fringe encompasses the portion of the floodplain that could be completely obstructed without increasing the water-surface elevation of the 1-percent-annual-chance flood more than 1.0 foot at any point. Typical relationships between the floodway and the floodway fringe and their significance to floodplain development are shown in Figure 2.
Figure 2. Floodway Schematic
In the redelineation efforts, the floodway was not recalculated. As a result, there may have been areas where the previous floodway did not fit within the boundaries of the 1-percent-annual-chance floodplain. In areas where this occurred, the floodway was reduced. Table 7, Floodway Data Table lists the water surface elevations, with and without a floodway, the mean velocity in the floodway, and the location and area at each surveyed cross section as determined by hydraulic methods. The width of the floodway depicted by the FIRM panels and the amount of reduction to fit the floodway inside the 1-percent annual chance floodplain, if necessary, is also listed.
12
CROSS SECTION DISTANCE1 WIDTH
(FEET)
SECTION AREA
(SQUARE FEET)
MEAN VELOCITY (FEET PER SECOND)
WIDTH REDUCED
FROM PRIOR
STUDY (FEET)2
REGULATORYWITHOUT
FLOODWAYWITH
FLOODWAYINCREASE
Sandusky RiverA 12,750 505 4172 8.1 690.8 690.8 691.1 0.3B 15,010 360 4014 8.4 694.8 694.8 695.7 0.9C 17,410 336 3737 9.0 699.7 699.7 700.5 0.8D 21,250 291 3674 9.2 710.0 710.0 710.3 0.3E 23,000 253 2363 14.3 714.9 714.9 715.0 0.1F 24,500 332 4410 7.5 722.0 722.0 722.3 0.3G 27,500 381 4729 7.0 727.1 727.1 727.3 0.2H 29,640 520 5763 5.7 731.8 731.8 731.8 0.0I 30,530 350 3630 9.1 732.1 732.1 732.1 0.0J 31,575 250 3330 9.9 734.1 734.1 734.2 0.1K 32,380 250 3608 8.7 735.9 735.9 736.0 0.1L 33,615 240 3604 8.7 737.5 737.5 737.5 0.0M 36,970 615 6564 4.8 740.6 740.6 740.9 0.3N 38,450 1060 10364 3.0 741.1 741.1 741.7 0.6O 41,380 640 6169 5.1 743.1 743.1 743.7 0.6P 43,800 683 7464 4.2 745.1 745.1 745.4 0.3Q 45,600 477 7134 4.4 745.6 745.6 746.0 0.4R 47,400 345 6291 5.0 746.8 746.8 747.3 0.5S 48,990 711 9388 3.4 747.3 747.3 747.8 0.5T 73,500 446 7866 3.3 760.0 760.0 760.3 0.3U 76,530 729 8503 3.1 760.5 760.5 760.9 0.4V 81,500 715 11403 2.3 761.1 761.1 761.6 0.5W 85,400 315 6114 4.3 762.8 762.8 763.4 0.6
1 FEET ABOVE CONFLUENCE WITH SPICER CREEK2 SEE EXPLANATION IN SECTION 4.2 FLOODWAYS
FLOODWAY
13
FLOODWAY DATA
SANDUSKY RIVER
1-PERCENT-ANNUAL-CHANCE FLOOD WATER-SURFACE ELEVATION (FEET NAVD)
TA
BL
E 7
FLOODING SOURCE
FEDERAL EMERGENCY MANAGEMENT AGENCY
SENECA COUNTY, OH(AND INCORPORATED AREAS)

CROSS SECTION DISTANCE1 WIDTH
(FEET)
SECTION AREA
(SQUARE FEET)
MEAN VELOCITY (FEET PER SECOND)
WIDTH REDUCED
FROM PRIOR
STUDY (FEET)2
REGULATORYWITHOUT
FLOODWAYWITH
FLOODWAYINCREASE
Sandusky RiverX 88,160 453 9191 2.8 763.4 763.4 764.1 0.7Y 92,980 942 12297 2.1 764.0 764.0 764.7 0.7Z 97,000 268 5732 4.5 764.4 764.4 765.2 0.8
1 FEET ABOVE CONFLUENCE WITH SPICER CREEK2 SEE EXPLANATION IN SECTION 4.2 FLOODWAYS
FLOODWAY
14
FLOODWAY DATA
SANDUSKY RIVER
1-PERCENT-ANNUAL-CHANCE FLOOD WATER-SURFACE ELEVATION (FEET NAVD)
TA
BL
E 7
FLOODING SOURCE
FEDERAL EMERGENCY MANAGEMENT AGENCY
SENECA COUNTY, OH(AND INCORPORATED AREAS)

5.0 INSURANCE APPLICATIONS
For flood insurance rating purposes, flood insurance zone designations are assigned to a community based on the results of the engineering analyses. These zones are as follows:
Zone A
Zone A is the flood insurance risk zone that corresponds to the 1-percent-annual-chance floodplains that are determined in the FIS by approximate methods. Because detailed hydraulic analyses are not performed for such areas, no BFEs or base flood depths are shown within this zone.
Zone AE
Zone AE is the flood insurance risk zone that corresponds to the 1-percent-annual-chance floodplains that are determined in the FIS by detailed methods. In most instances, whole-foot BFEs derived from the detailed hydraulic analyses are shown at selected intervals within this zone.
Zone AH
Zone AH is the flood insurance risk zone that corresponds to the areas of 1-percent-annual-chance shallow flooding (usually areas of ponding) where average depths are between 1 and 3 feet. Whole-foot BFEs derived from the detailed hydraulic analyses are shown at selected intervals within this zone.
Zone AO
Zone AO is the flood insurance risk zone that corresponds to the areas of 1-percent-annual chance shallow flooding (usually sheet flow on sloping terrain) where average depths are between 1 and 3 feet. Average whole-foot base flood depths derived from the detailed hydraulic analyses are shown within this zone.
Zone AR
Zone AR is the flood insurance risk zone that corresponds to an area of special flood hazard formerly protected from the 1-percent-annual-chance flood event by a flood-control system that was subsequently decertified. Zone AR indicates that the former flood-control system is being restored to provide protection from the 1-percent-annual-chance or greater flood event.
Zone A99
Zone A99 is the flood insurance risk zone that corresponds to areas of the 1-percent-annual-chance floodplain that will be protected by a Federal flood protection system where construction has reached specified statutory milestones. No BFEs or depths are shown within this zone.
15

Zone V
Zone V is the flood insurance risk zone that corresponds to the 1-percent-annual-chance coast floodplains that have additional hazards associated with storm waves. Because approximate hydraulics analyses are performed for such areas, no BFEs are shown within this zone.
Zone VE
Zone VE is the flood insurance risk zone that corresponds to the 1-percent-annual-chance coast floodplains that have additional hazards associated with storm waves. Whole-foot BFEs derived from the detailed hydraulic analyses are shown at selected intervals within this zone.
Zone X
Zone X is the flood insurance risk zone that corresponds to areas determined to be outside of the 0.2% annual chance floodplain.
Zone X (Shaded)
Zone X (shaded) is the flood insurance risk zone that corresponds to areas outside the 0.2-percent-annual-chance floodplain, areas within the 0.2-percent-annual-chance floodplain, areas of 1-percent-annual-chance flooding where average depths are less than 1 foot, areas of 1-percent annual-chance flooding where the contributing drainage area is less that 1 square mile, and areas protected from the 1-percent-annual-chance flood by levees. No BFEs or base flood depths are shown within this zone.
Zone X (Future Base Flood)
Zone X (Future Base Flood) is the flood insurance risk zone that corresponds to the 1-percent-annual-chance floodplains that are determined based on future-condition hydrology. No BFEs or base flood depths are shown within this zone.
6.0 FLOOD INSURANCE RATE MAP The FIRM is designed for flood insurance and floodplain management applications.
For flood insurance applications, the map designates flood insurance risk zones as described in Section 5.0 and, in the 1-percent-annual-chance floodplains that were studied by detailed methods, shows selected whole-foot BFEs or average depths. Insurance agents use the zones and BFEs in conjunction with information on structures and their contents to assign premium rates for flood insurance policies.
For floodplain management applications, the map shows by tints, screens, and symbols, the 1- and 0.2-percent-annual-chance floodplains, floodways, and the locations of selected cross sections used in the hydraulic analyses and floodway computations.
16

The current FIRM presents flooding information for the entire geographic area of Seneca County. Previously, separate FIRMs were prepared for each identified flood prone incorporated community and for the unincorporated areas of the county. Historical data relating to the maps prepared for each community are presented in Table 8.
7.0 OTHER STUDIES
This FIS report either supersedes or is compatible with all previous studies on streams studied in this report and should be considered authoritative for purposes of the NFIP.
8.0 LOCATION OF DATA
Information concerning the pertinent data used in the preparation of this study can be obtained by contacting the Flood Insurance and Mitigation Division, Federal Emergency Management Agency Region V, 536 South Clark Street, 6th Floor, Chicago, IL 60605-1509.
17

FLOOD HAZARDCOMMUNITY INITIAL BOUNDARY MAP FIRM FIRM
NAME IDENTIFICATION REVISIONS DATE EFFECTIVE DATE REVISIONS DATE
(1)ATTICA, VILLAGE OF N/A NONE N/A NONE
BETTSVILLE, VILLAGE OF April 12, 1974 April 23, 1976 September 30, 1988 NONE
(1)BLOOMFIELD, VILLAGE OF N/A NONE N/A NONE
(1)NEW RIEGEL, VILLAGE OF N/A NONE N/A NONE
REPUBLIC, VILLAGE OF May 3, 2011 NONE May 3, 2011 NONE
SENECA COUNTY June 9, 1978 NONE May 17, 1990 NONEUNINCORPORATED AREAS
TIFFIN, CITY OFMarch 1, 1974
June 25, 1976 July 20, 1979
July 3, 1986 NONE
(1)No Special Flood Hazard Areas Identified
18
TA
BL
E 8
COMMUNITY MAP HISTORY
FEDERAL EMERGENCY MANAGEMENT AGENCY
SENECA COUNTY, OH
AND INCORPORATED AREAS

9.0 BIBLIOGRAPHY AND REFERENCES
1) Federal Emergency Management Agency, Flood Insurance Study, Seneca County, Ohio, May 17, 1990.
2) Federal Emergency Management Agency, Flood Insurance Study, City of Tiffin, Ohio, July 3, 1986.
3) U.S. Army Corps of Engineers, Buffalo District, Special Flood Hazard Evaluation Report, Sandusky River, City of Tiffin, Seneca County, Ohio, October 1984.
4) Ohio Statewide Imagery Program (OSIP), 2-foot contour data for Seneca County, Ohio, 2006.
5) U.S. Department of Commerce, Bureau of the Census, 1980 Census of Population, Number of Inhabitants, Ohio, Washington, D.C., February 1982.
6) U.S. Census Bureau, 2007 Population Estimate.
7) ----------, National Oceanic and Atmospheric Administration, Climate of the States, 1974.
8) U.S. Department of Commerce, Bureau of the Census, 1980 Census of Population, Number of Inhabitants, Ohio, Washington, D.C., February 1982.
9) U.S. Army Corps of Engineers, Special Flood Hazard Evaluation Report, Sandusky River, City of Tiffin, Seneca County, Ohio, October 1974.
10) U.S. Department of the Interior, Geological Survey, Interagency Advisory Committee on Water Data, Office Water Coordination, Hydrology Subcommittee, Bulletin No. 17B, Guidelines for Determining Flood Flow Frequency, September 1981, revised March 1982.
11) U.S. Army Corps of Engineers, Irondequoit Creek Watershed, Final Feasibility Report, Appendix C, March 1982.
12) Stantec Consulting Services, Inc., Hydrologic Report: Countywide DFIRM Production and Development for Seneca County, January 15, 2009.
13) Kucera & Associates, Topographic Map of City of Tiffin, Ohio, Scale 1:2400, Contour Interval 2 Feet, April 1961.
14) U.S. Department of the Interior, Geological Survey, 7.5 Minute Series Topographic Maps, Scale 1:24000, Contour Interval 5 Feet: Tiffin South, 1960, photorevised 1972.
15) U.S. Army Corps of Engineers, Hydrologic Engineering Center, HEC-2 Water Surface Profiles, Computer Program 723-X6-L202A, Davis, California, 1974.
19

16) U.S. Army Corps of Engineers, Hydrologic Engineering Center, Computer Program 723-X6-L202A, HEC-2, Water-Surface Profiles, Davis, California, August 1979, with updates.
17) U.S. Army Corps of Engineers, Hydrologic Engineering Center, Computer Program HEC-RAS 4.0, Reference BB – HEC-RAS Version 4.0, Davis, California, March 2008.
18) Stantec Consulting Services, Inc., Hydraulic Report: Countywide DFIRM Production and Development for Seneca County, February 27, 2009.
20


