sensex - reliance securities · range in the previous 9-months. thus, for the october series, the...
TRANSCRIPT

Ver. 1.0 / July 2012
Research Desk Customer ServiceCommodities Research Desk My Gold Plan Mutual Fund Desk RGurukool Corner
u u u
u u u
Product of the Month Currency Research Desk
Range-bound October; will November festivities bring cheer?
RM
/019/2
9.1
0.2
012
Dear Investor,
After a sharp rally (~8%) in September 2012 on the back of the sudden outburst of various reforms initiatives announced by the UPA-II
government, October was relatively a sedate month, more in the nature of consolidation for the Indian stockmarket, as investors digest the gains
from the sharp rally and analyze the announcements for their potential impact. The consolidation can also be gauged from the fact that October
was the least volatile month in 2012 so far with the Sensex witnessing a range of about only 600 points compared to a 1,300+ points average
range in the previous 9-months. Thus, for the October series, the Sensex and the Nifty managed a gain of about 1%. However, the month saw
heightened activity in the Mid-cap and the Small-cap segments of the market with the respective indices gaining about 2% and 3%.
On the global front, investors’ focus shifted from the developed world to the emerging world as visible from the behaviour of the global indices.
Thus, while the US markets lost about 2% (S&P 500) to 5% (Nasdaq), the European indices ended flat (FTSE up ~0.5%) to negative (Germany
down over 1%). However, the Asian pack outperformed with gains across most markets i.e. Singapore (~1%), Shanghai (~2%), Malaysia (~3%)
and Hong Kong (~5%). The lackluster European markets behaviour was on the back of concerns over an economic recovery in the near-term as
the countries in debt are hesitant as yet to make any material progress on fiscal control measures. Further, economic newsflow in the region was
also not encouraging. The US markets too traded with a negative bias, despite recovery in various economic data points, primarily hit by weak
corporate results/guidance by leading global companies, which overshadowed hopes of a sustainable US recovery.
As for India, enthusiasm on the back of the recent reform measures (and more in October like passage of Insurance Bill, Pension Bill and
Companies Bill 2011) had already pushed the indices to 52-week highs. However, in the current political scenario, market may opt to wait for
some time, as the cabinet approved bills have to face the acid test of getting clearance from the Parliament before they can become law.
Further, with the ongoing results season, market participants may like to have greater clarity before taking a directional view on the market
overall. Nonetheless, an important trigger that the market is waiting for is resumption of interest rates cut by the RBI (effected 50bps token cut
in April 2012). While a large section of the market is hoping for this, a strong August IIP has once again raised apprehensions that the RBI
may skip reducing interest rates citing continued high inflation. Nonetheless, we believe that while the timing of an interest rate cut is difficult,
the fact that the interest rate cycle is at its peak and can only head lower over the next 12-18 months is good enough a trigger point for new
highs to be made by the indices in the coming months on the back of resurrection in consumption/investment cycles.
Yours Sincerely
Santhosh UnikkatBusiness Head
ISO 9001:2008: Reliance Securities Limited holds a certificate issued by BSI Management System India Pvt. Ltd to the effect that it operates a Quality Management System that complies with the requirements of ISO 9001:2008 for providing equity & equity derivative trading services through online trading system. Registered Office: Reliance Securities Limited, 11th Floor, R-Tech IT Park, Western Express Highway, Goregaon (East), Mumbai - 400063. Tel: +91 22 3320 1212. (NSE SEBI Registration Number: INB / INF / INE 231234833; BSE SEBI Registration Number: INB / INF / INE 011234839)
From the desk of Business Head
Sensex

S&P CNX NIFTY (5,664)
During October 2012, the NIFTY rose to fresh 52-
week highs by moving past the 5,800 mark.
However, profit-booking in front-line counters led the
index to retrace back to 5,600 levels, which was
along our expected lines. Consequently, emerging
of buying at around these levels saw the NIFTY then
consolidating in a narrow range between 5,630 to
5,730 levels. Thus, for the October series (on F&O
expiry basis), the S&P CNX NIFTY closed with a
gain of about 1%.
Technically, we continue to remain positive with 20-
Month EMA (Exponential Moving Average) placed at
5,304 level. Immediate resistance for the index is
placed around the April 2011 high of 5,944 mark.
Additionally, RSI above 50 and MACD (9,24) now
above the neutral line will help the NIFTY to move
higher in the next couple of months. Long positions
can be kept open with trailing stop loss of 5,530.
CAIRN (` 335):
Cairn India slipped sharply from a level of ̀ 367 to its recent low of
` 323. Off-late, the stock has been consolidating above ` 325,
however, has faced stiff resistance around ̀ 345. RSI (14,9) above
50 mark indicates strength in the stock while MACD (9,24) is
about to move past the zero mark, which may bring about further
positive action in the stock in the next few weeks. Long positions
can be built around the recent support range of ` 328-320 for a
target of ̀ 355-360 with a closing based stop loss of ̀ 315.
IDFC (` 158)
IDFC has reversed thrice from about ̀ 170 levels since April 2011
with lower lows. However, currently, it is trading above the key
support baseline of about Rs148. Momentum indicators RSI
(14,10) & MACD (12,26,9) are heading above their respective
neutral lines. As per the current set-up, we believe the stock can
make a fresh 52-week high in the short-term. Thus, while we are
optimistic about the stock, fresh long positions are recommended
only in the `152-148 range with closing based stop loss of `143
and a target of ̀ 165-170.
Nifty (5,664) – Technical View for the month
Technical picks for the month
Sensex
*Source refer to Market Lens August
*Source refer to Market Lens August
From
Research Desk
Note: Since all above recommendations are on BUY side, traders can either keep strict stop loss on stock or dilute the position in case of S&P CNX NIFTY closing below 5,500 mark. Buying in parts advisable at current levels.

Research Desk
Strike Rates - October 2012
Source: Refer Daily Market Lens
Some Fundamental Call updates:
Note: As on October 25, 2012; * CERA was earlier recommended in April 2012 @ Rs257 with a Target Price of Rs332, up 29%
Sensex
From
Research DeskFrom
Fundamental / Technical Calls performance
Note: As on October 25, 2012; Source: Refer Daily Market Lens / LIVE Market Calls

Sensex
From
Research Desk
Disclaimer at the last page
Step 1: https://trade.rsec.co.in/
Step 2: Select Rofferings > Model Portfolio
How to Invest online
To know more visit: http://www.rsec.co.in/products-and-services/financial-Services/equity/rmodelportfolio
Reliance Securities Model Portfolio performanceSince inception on October 3, 2011, The Reliance Securities Model Portfolio has outperformed its benchmark (Sensex) by about 2%!

Sensex
Product of the Month
u
u
u
u
RSL allows its clients (resident Only) to take exposure against
the shares lying in demat account.
The scrip’s against which exposure is allowed will be defined by
RSL, and will change from time to time, not on daily basis, but
periodic basis.
This facilitates client to take positions in market even if ledger
has zero cash but has specified stocks in demat account.
Exposure will be allowed against the value which comes after
applying a pre-defined hair-cut (ranging from 20% to 60%) on
the scrip.
u
u
u
To avail Shares as collateral facility, No action is required from
client side. System automatically calculates the collateral value
for all the eligible scrip’s lying in client’s depository account
(after applying haircut) & allows the client to take exposure
against such collateral.
Stocks will continue to remain in clients’ beneficiary account
and hence clients will get the benefits of all corporate actions
like bonus dividend etc.
If client takes positions against collateral, and if margin is not
paid in cash by end of day, then delayed payment Charges
(DPC) will be charged.
Shares as Collateral
1. Historical Charts with technical indicators.
2. By Default 1 Yr Nifty Chart is displayed.
3. You can view charts of all stocks & major indices.
4. You can also compare the stocks / indices on various technical parameters.
5. View corporate actions taken place with details on your selected stocks.
Advanced Charting:
Check here for details on :
http://www.rsec.co.in/products-and-services/financial-Services/equity/exposure-against-stocks
Shares as Collateral

The number of client request serviced in the month of Aug 21465
% of client request serviced within defined TAT 99%
Customer service Performance
Max Multiplier is another variant of current Margin intraday square-off (MIS) product.
This is also known as Cover order (CO). This cover order allows you to take leverage as per your risk appetite along with the power to limit your downside.
One can take an intra-day position with such orders which blocks lesser margin than MIS product.
The product functioning is mentioned below:
u It is a two leg order where you place buy/sell order along with corresponding stop loss order.
u First leg (buy/sell) is placed at market.
u Second leg is stop loss market order. It remains pending till trigger price is not reached. Once LTP reaches the trigger price, the order becomes active & sent to exchange as market order. You need to input the trigger price for the second leg in the same order.
u If second leg is neither executed (i.e. trigger price not reached) nor exited till 3:10 PM, such position will be squared off.
u Cover order can be placed before 3:10 PM.
Max Multiplier
You can check the previous day’s Order and Trade history in the new insta Plus by following the below mentioned steps–
A. Login to New Insta plus
B. Click on, “Reports”
C. Click on, “Transaction Report”
D. Click on, “Trade History” or Order History
Mentioned the range of the transaction and click on submit. The Report can also be extracted in Excel format
Help yourself Tips
For more detailsvisit our website www.rsec.co.in or contact our customer support on022-39886000, 22866000, 33506000 ore-mail us at [email protected]
From
Sensex
From
Customer Service Team
Today I Called Your Customer Service
Number To Reactivate My Account
Which Had Turned Dormant. Rohan
Srivastava Was Your Executive Who
Helped Me Through My Problem. He
Was Quick To Understand My Problem
And Very Courteous In Guiding Me To
The Solution. He Also Provided
Suggestions On How To Use My
Account Well. He Is An Asset To Your
Organization And I Feel He Would Rise
Far. Chayya Ganesh,
New Delhi on Oct 17, 2012
Awareness Tips
Please do not share your Account Details with any one
She gave enough time
to help me sort out
the problem even
though I was slow.
Avinash Chawla,
Gurgoan on Oct 04, 2012
Ms Sonu had attended me
and she was very kind ,
gentle and helpful in
resolving my queries. I
highly appreciate her
customer handling abilities
... I am impressed.
Dinesh Sharma,
New Delhi on Oct 17, 2012

Sensex
From
Currency Research Desk
For more information:
Visit Our Branch
SMS <RSEC CD> to 53636022-3988 6000www.rsec.co.in
Disclaimer at the last page
USDINR
Last week, despite signals from the Government of India to cut rates to
propel growth, the RBI remained focused on inflation control. It kept
the repo rate unchanged though reduced the cash reserve ratio by 25
basis points. This weakened the rupee further. Also, the RBI revised
downwards the GDP growth projection for 2012-13 from 6.5 per cent
to 5.7 per cent, raised the March-end inflation estimate from 7 per cent
to 7.5 per cent, and flagged off concerns about worsening current
account deficit. Recently, the demand for dollars from importers and
the government for defense related purchases, ebb in global risk
appetite and mild correction in equity market resulted in a V-shape
downward movement in rupee. In the global currency market, fears
about the impact of Hurricane Sandy in the US saw a move towards
the safety of the dollar. This resulted in the Dollar index making gains
and closing above the 80-level mark during the week. In the absence
of any major developments in the domestic markets, the focus will shift
to global developments over the next two weeks. The US presidential
election is around the corner and that will also play a role in
determining the international market mood.
Technical Outlook
USDINR NSE has witnessed an upside
rally of 1.47% compared to the fall of -
4.54% in the month of September.
Despite last months positive move,
trend in USDINR stil l remains
uncertain, as it tried to retest the falling
trend line resistance during last month,
but failed to recoup above channel
support, now is the key resistance for
the month of November for a projected
downside target of 51.35 and 50.60.
Currently prices are trading in falling
trend line(seen in blue line) as well as it
is seen trading below 9 and 18DMA
infers selling pressure in the counter
towards 53 and even 49.43 which are
50 and 100DMA respectively. Contrary
to this, any breakout of rising channel(Orange lines i.e., above 54.10), would trigger another round of depreciation in rupee that would lead it
to 55.30 -56.00 levels. would be an opportunity of short selling for the possible target Rs 51.95 which is 61.8% retracement levels
of the rise from 48.50 to 57.32. Furthermore, any close below the same may knock it down towards Rs 50.80 in medium term.

from the lows but failed to recoup the fall , we expect the trend
change to mildly bearish till 31550 for the first half of the month and
expect to recover in the 2nd half.
In COMEX Gold is expected to see a fall till $1785 and even $1761
if 1700 per Troy ounce is breached on downside, if not broken then
can see a relief rally till $1735 per Troy ounce which marks the
38.2% retracement levels of the fall from $1795.9 to 1698.2 per
Troy ounce
If $ 1700 breached down one can expect Gold prices to slide
towards $1685 and 1661 per Troy ounce. Further rallies on upside
can be expected hence only on a close above $1735 per Troy
ounce towards $1758 and $1790 per Troy ounce or any correction
towards $1700 troy ounce can attract buying activity. In MCX we
expect trend to remain sideways to mildly bearish till 30550 per
10gms. And breakout level at 31200 further rallies can be expected
hence only on a close above Rs 31200 per and heading towards Rs
31720 & 31950 per 10gms or any correction on profit booking can
see buying activity from Rs30550.
MCX Gold prices seen more under the pressure of strengthening
rupee against US dollar. Rupee dominated MCX gold’s sideways
movement throughout the month can expect the same this month
also. We recommend to enter in market with Buy position around
Rs 30700 and 30550 per 10 gms for a potential upside Target of Rs
31450 and 31720 in Dec Contract.
Silver COMEX breakout above $30.3 per Troy ounce seen
continuing even for the month of September till $35.19 and
currently trading at $34.43 per Troy ounce. Despite strength in
Indian rupee against US Dollar, Silver MCX has strengthened by
Rs 4379 per Kg (Comparatively Aug month +Rs 4430 per Kg).
Similarly no major correction was witnessed but a price drop of
5.9% was witnessed from highs of Rs 65723 till 61830 per Kg. A
genuine correction of the rally from Rs 53520 to 65723 per Kg is till
Rs 61061 per Kg which is 38.2% cannot be ruled out for this month.
One can witness major upside rally only when prices settle well
above Rs 63325 per Kg. There is no change in the long term bullish
outlook in Silver despite short term corrections. While some more
Silver
*Source Technical Snapshot Commodities
Precious Metals:
Gold
Commodities overall delivered their worst monthly returns since
May, losing 4.1% in October
on the S&P index of 24 natural
resources and unwinding the
last of 2012's gain to date.
Stock markets internationally
struggled in October. The Dow
finished the month with a 2.5%
loss, with the S&P 500 off 2%
and the NASDAQ down 4.5%.
The drop in equities prompted
traders to buy the U.S. dollar, which is seen as a safe-haven
investment. And that, in turn, put pressure on dollar-denominated
commodities, including gold, because it makes them more
expensive for holders of other currencies. The precious metal is
likely to remain stuck in a tight band in the coming weeks, ahead of
key event risks viz., release of U.S. nonfarm payrolls, the U.S.
election, a change of power in China, plus the routine policy
meetings of various central banks though historically gold has
performed strongly in November. Economists expect U.S. job
growth to have picked up slightly in October, but not enough to
prevent the unemployment rate from rising off a four-year low.
Investors are waiting for the result of next week's presidential
election to get a fuller picture of what the next government will do to
help economic growth. The looming fiscal cliff - automatic tax hikes
and government spending cuts starting the beginning of next year if
the U.S. Congress fails to act - will be supportive of Bullion. The
devastation of Hurricane Sandy will prove to be a further blow to the
already fragile U.S. economy. The destruction of property and vital
infrastructure - two of the vital components in the wealth of a nation
is negative for the economy. The last thing the over indebted
families and close to default U.S. government needs are more very
expensive reconstruction works. Reconstruction and 'stimulus' has
to be paid for either by the tax payer in the form of taxes or a further
increase in the money supply and inflation.
As expected in the last month report Gold MCX drifted down till Rs
30950 and 30827 per 10gms and has witnessed a healthy bounce
Research Desk
*Source Technical Snapshot Commodities

medium term consolidation cannot be ruled out between $35.2 and
$33.4 per Troy ounce in Comex, or we expect prices to remain
range bound between 35.2 and 33.4 further buying can be seen
only above $35.2 or near to $33.4 per Troy ounce for the next
potential targets of $40.4 and 43.9 per Troy ounce levels in the long
term.
Chinese and European growth worries were the key concern for
base and industrial metals as markets remain unsure where the
supply/demand balances will be in the next couple of months. In
addition to Chinese and European woes, there are some worries
that relatively steady growth in the U.S. will keep the Federal
Reserve from being more aggressive with boost growth in the near-
term. Under the massive global central bank stimulus, commodity
markets have "overreacted" and they are now at or near support
levels and are ready to move up once they get a good reason. If
there is an additional bit of bad news, any resulting correction
should be relatively short-lived and modest owing to the technical
environment. Overall, we can expect intermittent upward pullback
in base and industrial metals during October 2012
Aluminium MCX is seen moving in a Expanding triangle and seen a
correction of 7.35 %( October) vs. 5.31% (September), in the
process aluminum prices retested expanding triangle support as
well as 200Day moving average and bounced infers short term
support /Lows are formed. Much confirmation of bullishness is
seen only on a close above Rs105.35 per Kg which is last week’s
high, for a potential targets of Rs109.1 and 111.1 per Kg which
marks the 50 and 61.8% Fibonacci retracement levels of the fall
from Rs117.55 to 100.7 per Kg. Besides it’s also noticed Aluminum
MCX prices never fell below 100 and also never closed below
200DMA since Sep 2010, but in the process made highs of 124.15.
We recommend accumulating near 101 or on a close above 105.35
for a potential target of 111placing a stop below 100 on closing
basis.
The technical Indicators Relative strength index (RSI) seen rising
Industrial Metals
AluminumPick of the Month:
from the lows of 40, with Moving average Convergence and
Divergence (MACD) is seen in Neutral
According to the Ministry of Agriculture, 99.81 Lakh hectare area
has been planted under Kharif pulses as on 21th September, 2012
compared to 108.28 lakh hectare (ha) same period last year.
Production of Kharif pulses, harvesting of which would commence
from next month, has been estimated lower by 14.6% at 5.26
million tonnes compared with 6.16 mn tn last year. Currently Chana
is trading sideways to down that is expected to take cue from
sowing progress of Kharif crop. Edible oil complex may recover
during initially on account of recovery in international markets.
However, arrival pressure before Diwali festival may pressurize
prices at higher levels and thus prices may settle lower towards the
end. Kapas is expected to trade sideways in the absence of any
clear-cut driving force. Despite festive season, overall sentiments
in domestic agro commodities remain softer for the coming month.
Agro Commodities
For details, please visit to our website
www.reliancecommodities.co.in
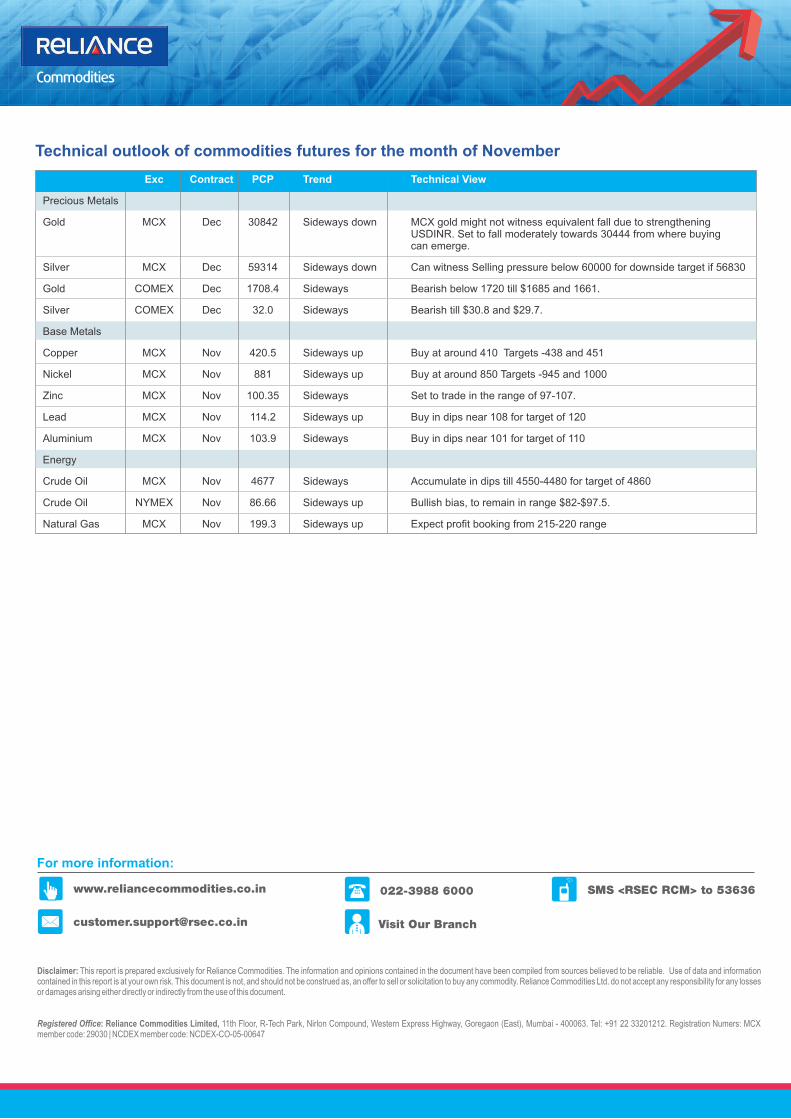
Technical outlook of commodities futures for the month of November
For more information:
Visit Our Branch
SMS <RSEC RCM> to 53636022-3988 6000
Disclaimer: This report is prepared exclusively for Reliance Commodities. The information and opinions contained in the document have been compiled from sources believed to be reliable. Use of data and information contained in this report is at your own risk. This document is not, and should not be construed as, an offer to sell or solicitation to buy any commodity. Reliance Commodities Ltd. do not accept any responsibility for any losses or damages arising either directly or indirectly from the use of this document.
www.reliancecommodities.co.in
Registered Office: Reliance Commodities Limited, 11th Floor, R-Tech Park, Nirlon Compound, Western Express Highway, Goregaon (East), Mumbai - 400063. Tel: +91 22 33201212. Registration Numers: MCX member code: 29030 | NCDEX member code: NCDEX-CO-05-00647
Exc Contract PCP Trend Technical View
Precious Metals
Gold MCX Dec 30842 Sideways down MCX gold might not witness equivalent fall due to strengthening USDINR. Set to fall moderately towards 30444 from where buying can emerge.
Silver MCX Dec 59314 Sideways down Can witness Selling pressure below 60000 for downside target if 56830
Gold COMEX Dec 1708.4 Sideways Bearish below 1720 till $1685 and 1661.
Silver COMEX Dec 32.0 Sideways Bearish till $30.8 and $29.7.
Base Metals
Copper MCX Nov 420.5 Sideways up Buy at around 410 Targets -438 and 451
Nickel MCX Nov 881 Sideways up Buy at around 850 Targets -945 and 1000
Zinc MCX Nov 100.35 Sideways Set to trade in the range of 97-107.
Lead MCX Nov 114.2 Sideways up Buy in dips near 108 for target of 120
Aluminium MCX Nov 103.9 Sideways Buy in dips near 101 for target of 110
Energy
Crude Oil MCX Nov 4677 Sideways Accumulate in dips till 4550-4480 for target of 4860
Crude Oil NYMEX Nov 86.66 Sideways up Bullish bias, to remain in range $82-$97.5.
Natural Gas MCX Nov 199.3 Sideways up Expect profit booking from 215-220 range

Sensex
From
My Gold Plan
Gold Price Movement in India:
Does the thought of purchasing gold seem like wishful thinking to you, given today’s gold prices?
Do you wish there was a way to mitigate rising inflation as well as accumulate assets?
Do you want your dream of owning physical gold, change to reality?
Do you wish there was an easier way to accumulate physical gold than waiting for prices to come down (they will not) or having
enough money in the bank?
If your answer to these questions is yes, then is what you are looking for. is
brought to you by Reliance Gold in association with World Gold Council.
Gold Price Movement in India: The
price of gold has undergone a minor
correction in domestic markets
through the 30-day period ended
October 25, 2012. The base price
decreased by Rs. 84.80 or 2.79% to
end at Rs. 2,955.20 on October 25,
following international market trends.
The fall in prices can be attributed to
the recent measures announced by
the US Federal Reserve to help boost
the US dollar’s safe haven appeal for
risk averse investors. Pressure on
gold from weakness in stocks helped
push prices to four week lows resulting in October being the first to see month on month price falls in a span of five months.
The prices moved within a range without any clear breakout, although with some downward pressure within the range. This
recent price decrease has helped drive increased
demand in India, ahead of the festive season which is an
auspicious time to buy gold.
The INR-USD exchange rate plays a key role in
determining the price of gold in domestic markets and if
recent trends in the foreign exchange markets are any
indication (the rupee depreciated from 52.4 to 53.75 or
2.57% against the greenback), then analysts expect
gold prices to firm up once again in the short term as the
rupee could depreciate further due to inflationary
pressure and poor fiscal deficit situation.
With all these factors impacting the price of gold and no predictable trends on the horizon, it makes for a strong case of
investing in gold in a systematic and disciplined manner. adopts this approach via the Daily Average
Pricing Methodology, thereby enabling the customer to accumulate 24 Karat gold at each price point.
Reliance My Gold Plan
Reliance My Gold Plan Reliance My Gold Plan

Sensex
From
My Gold Plan
For more information:
Visit Our Branch
SMS <RSEC GOLD> to 53636022-3988 6000www.reliancemgp.com
Disclaimer: “MY GOLD PLAN of Reliance Gold is offered by Reliance Money Precious Metals Pvt. Ltd. Reliance Securities is offering such products as distributor only and it shall not be held responsible for any financial loss / liability.

Sensex
After a strong first quarter growth in FY 2012-13, the mutual fund income fund category witnessed strong inflows during the quarter
industry witnessed a slow down for the quarter ending September. to the tune of ̀ 28,962 crores while its asset base grew by 11.2%. At
The total asset under management as on September grew by 4.5% the same time, the gilt fund category too saw net inflows of ` 29
as compared to a 17% growth in the previous quarter. With crores with net asset growth of 2.8%. On the other hand, it was only generally the debt schemes steering the asset trend alone at the the liquid and money market category which witnessed huge quarter end, this time around it was both weakness in the equity outflows mainly on account of redemptions witnessed towards the segment and redemptions in debt that pulled down the overall end of the quarter with banks and financial institutions redeeming growth of the industry assets. Pulling out funds towards the end of their funds to meet tax obligations. The category reported outflows the quarter by banks and financial institutions to meet advance tax of ̀ 15,962 crores with a decline of almost 9% in its asset base. obligations dented the overall quarterly flows. As a result of which,
The equity segment was hit by redemptions for the second compared to huge inflows of ` 95,519 crores in the previous
consecutive quarter as profit booking creeped in with quarter, this quarter inflows were subdued at ` 6,355 crores.
strengthening equity markets. For the quarter the BSE Sensex However the assets did manage to cross the ̀ 700,000 crores mark
reported a growth of around 7% as global scenario turned positive during the quarter and currently stood at Rs 720,113 crores.
along with government reform measures announced back home
Considering the ongoing economic scenario, turnaround in the that boosted sentiments. This helped the overall equity asset base
interest rate cycle may just be around the corner. This uncertainty growth despite the outflows.
has clearly benefitted the Income and Gilt fund categories. The
Disclaimer at the last page
From
Mutual Fund Desk
Mutual Fund update
Recommended Mutual Fund Schemes
Div
ers
ifie
dL
arg
e c
ap
Mid
Ca
pS
ecto
ral
Data as on September 30, 2012
EQUITY Absolute (%) CAGR Returns (%) Volatility( 3 years)^
AUM (in Crores) 6M 1 Yr 3 Yrs 5 Yrs Since Inception SD Beta Sharpe
Birla SL Frontline Equity Fund 2853 10.97 17.42 7.29 7.01 24.81 36.46 1.12 0.48
DSPBR Top 100 Equity Fund 3534 5.13 14.64 6.44 6.88 27.82 29.12 0.9 0.51
Franklin India Bluechip Fund 5013 4.85 12.32 8.76 6.26 17.93 33.08 1.02 0.56
ICICI Pru Focused Blue Chip Equity Fund 4025 7.98 16.45 10.66 N.A 13.87 34.00 1.05 0.63
BSE-100 7.27 14.17 3.25 1.85
Franklin India Flexi Cap Fund 1696 6.67 12.42 7.45 4.58 17.03 37.45 1.15 0.51
HDFC Equity Fund 10316 5.69 12.73 9.31 8.62 20.56 45.31 1.38 0.56
ICICI Pru Dynamic Plan 4056 4.99 16.38 9.96 7.54 27.52 33.27 1.01 0.59
Reliance Equity Opportunities Fund 3830 13.79 24.2 16.89 10.44 20.87 45.17 1.35 0.69
BSE-500 6.61 12.89 3.22 1.25
HDFC Mid-Cap Opportunities Fund 2466 8.5 17.57 17.02 10.4 11.54 40.51 1.2 0.73
ICICI Pru Discovery Fund 1985 10.38 24.24 12.9 12.26 22.84 56.05 1.7 0.61
IDFC Sterling Equity Fund 1192 11.68 15.05 14.01 N.A 16.78 36.12 1.35 0.43
SBI Magnum Emerging Businesses Fund 733 18.43 22.41 22.08 6.88 23.18 46.06 1.35 0.78
BSE MIDCAP 4.11 7.82 1.47 -2.3
Reliance Banking Fund 1729 12.77 20.94 13.39 13.89 28.79 43.82 1.29 0.63
ICICI Pru Infrastructure Fund 1878 5.00 5.02 -1.91 0.51 14.72 31.1 0.96 0.2
BSE-500 6.61 12.89 3.22 1.25
*Source Morning Star
Div
ers
ifie
d
EQUITY Absolute (%) CAGR Returns (%) Volatility( 3 years)^
AUM (in Crores) 6M 1 Yr 3 Yrs 5 Yrs Since Inception SD Beta Sharpe
HDFC Prudence Fund 6224 6.15 12.90 12.37 10.90 18.25 35.33 -5.09 0.66
HDFC Balanced Fund 918 6.23 13.65 14.44 12.13 16.35 27.63 -4.46 0.78
Reliance Reg Savings Fund-Balanced Plan 557 11.96 20.54 10.54 11.76 13.06 33.60 -3.07 0.55
Crisil Balanced Fund Index 6.84 13.70 5.32 5.15

Liq
uid
F
un
dD
ebt F
unds
ICICI Pru Income Fund 3,219 371 1.54 3.07 5.83 10.46 6.60 0.13 1.77 0.20
Reliance Dynamic Bond Fund 3,398 1,113 1.41 3.21 6.20 12.22 8.62 0.16 2.04 0.22
Crisil Composite Bond Fund Index 1.07 2.63 4.90 9.52 7.32
Birla SL Dynamic Bond Fund NA 12,125 1.13 2.97 5.61 10.68 8.84 0.05 0.61 0.62
Templeton India ST Income Fund 821 5,978 1.08 2.81 5.54 9.97 8.90 0.03 0.23 0.78
Crisil Short Term Bond Fund Index 0.90 2.51 4.87 9.20 7.46
HDFC Cash Mgmt-Savings Fund 51 3,953 0.74 2.29 4.87 9.80 8.21 0.01 0.04 1.34
Reliance Liquidity Fund 53 7,675 0.58 1.81 3.80 7.65 6.30 NA NA 0.06
Crisil Liquid Fund Index 0.64 1.95 4.16 8.67 7.29
Return Ratios
Average Absolute (%) CAGR (%) Volatility (1 Year)
^Scheme Name Maturity (in Days) AUM(Cr.) 1M 3M 6M 1 Yr 3Yr SD Beta Sharpe
DEBT
^ Standard DeviationData as on September 30, 2012
Sensex
Model Portfolios:
Aggressive Model Portfolio: This is recommended for individuals who are willing to take high financial risk and can tolerate higher degrees of
fluctuation (sharp, short term volatility) in the value of investments for the possibility of achieving greater long term capital appreciation.
Moderate model Portfolio: This is an intermediate risk and return portfolio that provides a blend of equities and income - oriented schemes. It
aims to provide capital appreciation commensurate to the risk taken over medium to long term.
Conservative Model Portfolio: This portfolio is geared towards preserving capital. A minimal risk investment strategy is used. Seeks to hold –
but not necessarily guarantee – the principal value of an investment.
Mutual Fund Schemes Scheme Theme Aggressive % Moderate% Conservative%
EQUITY 75% 50% 25%
DEBT 25% 50% 75%
Total 100% 100% 100%
Reliance Equity Opportunities Fund Diversified 15% 10% 5%
HDFC Equity Fund Diversified 10% 10% 5%
Franklin India Bluechip Fund Large cap 10% 10% 10%
DSPBR Top 100 Large cap 10% 5% 5%
IDFC Sterling Equity Fund Mid cap 10% 5% Nil
HDFC Mid Cap Opportunity Fund Mid cap 10% 5% Nil
Reliance Banking Fund Sectoral 10% 5% Nil
Templeton India ST Income Fund Short term income Nil 10% 15%
ICICI Pru Income Pan Long term income 5% 5% 15%
Birla Sun Life Dynamic Bond Fund Medium Term Income 10% 10% 15%
1 Year FMP Short term FMP Nil 10% 15%
HDFC Cash Mgmt Fund-Savings Liquid 5% 10% 10%
Gold Fund Gold Fund 5% 5% 5%
Recommended Model Portfolios by Mutual Fund Team
From
Mutual Fund Desk
*Source Morning Star

Sensex
From
Mutual Fund Desk
For more information:
Visit Our BranchSMS <RSEC MF> to 53636022-3988 6000
Step 1: https://trade.rsec.co.in/
Step 2: Select Investment Offering > Mutual Fund > Choose a Fund of your choice
How to Invest online
Disclaimer at the last page
NEW FMPs & NFOs for November 2012
Disclaimer:
For further information please contact:
Registered Office: Reliance Securities Limited, 11th Floor, R-Tech IT Park, Western Express Highway, Goregaon (East), Mumbai - 400063. Tel: +91 22 3320 1212.
This document is meant for the customers of Reliance Securities Limited only. In case you are a non resident, please note that you need to comply with the relevant local laws of the country of your residence, before investing. Mutual Funds and securities investments are subject to market risks, and there is no assurance or guarantee that the objectives of the Scheme will be achieved. As with any investment in securities, the Net Asset Value (NAV) of the Units issued by Mutual Fund Schemes can go up or down depending on the factors and forces affecting the securities market. There are no assurances or guarantees that the objectives of any of the mutual fund schemes will be achieved. The investments may not be suited to all categories of investors. Please read the Scheme Information Document and Statement of Additional Information of the respective mutual fund carefully before investing.
The views herein constitute only the opinions and do not constitute any guidelines or recommendation on any course of action to be followed by the readers. This information is meant for general reading purpose only and is not meant to serve as a professional investment guide for the readers. This document has been prepared on the basis of publicly available information, internally developed data and other sources believed to be reliable. Reliance Securities Limited (RSL) or its directors, employees, affiliates or representatives do not assume any responsibility for, or warrant the accuracy, completeness, adequacy and reliability of such information.
Due care has been taken to ensure that the disclosures and opinions given fair and reasonable. No action has been solicited based upon the information provided herein, and the information is not intended to be an offer or solicitation for the purchase or sale of any financial product or instrument. Recipients of this information should rely on information/data arising out of their own investigations. Readers are advised to seek independent professional advice and arrive at an informed investment decision before making any investments.
None of the directors, employees, affiliates or representatives of RSL shall be liable for any direct, indirect, special, incidental, consequential, punitive or exemplary damages, including lost profits arising in any way whatsoever from the information contained in this material. RSL, the directors, employees, affiliates or representatives of RSL, associate companies, affiliates, and representatives including persons involved in the preparation or issuance of this material may from time to time, have long or short positions in, and buy or sell the securities thereof, of company(ies) / specific economic sectors / mutual funds, if mentioned herein.
Reliance Securities Limited,
Fund Scheme Tenor Start Date End date
Forthcoming FMP's
UTI Mutual Fund UTI Fixed Income Interval Fund - Series II - Quarterly Interval Plan V 3 months 6-Nov-12 7-Nov-12
Kotak Mutual Fund Kotak QIP Series 6 3 months 6-Nov-12 7-Nov-12
UTI Mutual Fund UTI Fixed Income Interval Fund - Monthly Interval Plan II 1 month 7-Nov-12 8-Nov-12
Kotak Mutual Fund Kotak QIP Series 3 3 months 15-Nov-12 16-Nov-12
UTI Mutual Fund UTI Fixed Income Interval Fund - Quarterly Interval Plan III 3 months 19-Nov-12 20-Nov-12
UTI Mutual Fund UTI Fixed Term Income Fund - Series XIII - I (366 days) 366 days 19-Nov-12 26-Nov-12
Kotak Mutual Fund Kotak QIP Series 7 3 months 20-Nov-12 21-Nov-12
UTI Mutual Fund UTI Fixed Income Interval Fund - Monthly Interval Plan I 1 month 21-Nov-12 22-Nov-12
UTI Mutual Fund UTI Fixed Income Interval Fund - Half Yearly Interval Plan I 6 Months 26-Nov-12 27-Nov-12
BirlaSunlife Mutual Fund BSL Capital Protection Oriented Fund - Series 13 CPO 22-Oct-12 5-Nov-12

Sensex
SMS <RSEC RGURU> to 53636022-3988 6000 Visit Our Branches
Visit us at –
http://www.rgurukool.com/Home.aspx
Register for our trainings at:
http://www.rgurukool.com/Registration.aspx
CORNER
The Simple Moving Average is arguably the most popular
technical analysis tool used by traders. The Simple Moving
Average (SMA) is used mainly to identify trend direction, but is
commonly used to generate buy and sell signals. The SMA is an
average, or in statistical speak - the mean. An example of a Simple
Moving Average is presented below:
• The prices for the last 5 days were 25, 28, 26, 24, 25. The
average would be (25+28+26+26+27)/5 = 26.4. Therefore, the
SMA line below the last days price of 27 would be 26.4. In this
case, since prices are generally moving higher, the SMA line of
26.4 would be acting as support
The chart below of the Dow Jones Industrial Average exchange
traded fund (DIA) shows a 20-day Simple Moving Average acting
as support for prices.
For more information:
Hope this article has been useful… for further knowledge on the subject visit us at www.rgurukool.com or click the link below
http://www.rgurukool.com/pivottrading/wrapper.htm
Simple Moving Average
Moving Average Acting as Support - Buy Signal
moving average is serving as a support line
When price is in an uptrend and subsequently, the moving average is
in an uptrend, and the moving average has been tested by price and
price has bounced off the moving average a few times (i.e. the
), then buy on the next
pullbacks back to the Simple Moving Average.
A Simple Moving Average can serve as a line of resistance as the
chart of the DIA shows:
Moving Average Acting as Resistance Sell Signal
moving average is serving as a
resistance line
At times when price is in a downtrend and the moving average is in
a downtrend as well, and price tests the SMA above and is rejected
a few consecutive times (i.e. the
), then buy on the next rally up to the Simple Moving
Average.
Where do we see it?
You can find them in our charts section in Instaplus or Nest trader.
Get in touch with your branch for details

Sensex
General Disclaimers:
Risks:
Disclaimers in respect of jurisdiction:
Disclosure of Interest:
This document is meant for the customers of Reliance Securities Limited only. In case you are a non resident, please note that you need to comply with the relevant local laws of the country of your residence, before investing. Mutual Funds and securities investments are subject to market risks, and there is no assurance or guarantee that the objectives of the Scheme will be achieved. As with any investment in securities, the Net Asset Value (NAV) of the Units issued by Mutual Fund Schemes can go up or down depending on the factors and forces affecting the securities market. There are no assurances or guarantees that the objectives of any of the mutual fund schemes will be achieved. The investments may not be suited to all categories of investors. Please read the Scheme Information Document and Statement of Additional Information of the respective mutual fund carefully before investing.The views herein constitute only the opinions and do not constitute any guidelines or recommendation on any course of action to be followed by the readers. This information is meant for general reading purpose only and is not meant to serve as a professional investment guide for the readers. This document has been prepared on the basis of publicly available information, internally developed data and other sources believed to be reliable. Reliance Securities Limited (RSL) or its directors, employees, affiliates or representatives do not assume any responsibility for, or warrant the accuracy, completeness, adequacy and reliability of such information. Due care has been taken to ensure that the disclosures and opinions given fair and reasonable. No action has been solicited based upon the information provided herein, and the information is not intended to be an offer or solicitation for the purchase or sale of any financial product or instrument. Recipients of this information should rely on information/data arising out of their own investigations. Readers are advised to seek independent professional advice and arrive at an informed investment decision before making any investments. None of the directors, employees, affiliates or representatives of RSL shall be liable for any direct, indirect, special, incidental, consequential, punitive or exemplary damages, including lost profits arising in any way whatsoever from the information contained in this material. RSL, the directors, employees, affiliates or representatives of RSL, associate companies, affiliates, and representatives including persons involved in the preparation or issuance of this material may from time to time, have long or short positions in, and buy or sell the securities thereof, of company(ies) / specific economic sectors / mutual funds, if mentioned herein.
Trading and investment in securities are subject market risks. There are no assurances or guarantees that the objectives of any of trading / investment in securities will be achieved. The trades/ investments referred to herein may not be suitable to all categories of traders/investors. The names of securities mentioned herein do not in any manner indicate their prospects or returns. The value securities referred to herein may be adversely affected by the performance or otherwise of the respective issuer companies, changes in the market conditions, micro and macro factors and forces affecting capital markets like interest rate risk, credit risk, liquidity risk and reinvestment risk. Derivative products may also be affected by various risks including but not limited to counter party risk, market risk, valuation risk, liquidity risk and other risks. Besides the price of the underlying asset, volatility, tenor and interest rates may affect the pricing of derivatives.
The possession, circulation and/or distribution of this Report may be restricted or regulated in certain jurisdictions by appropriate laws. No action has been or will be taken by RSL in any jurisdiction (other than India), where any action for such purpose(s) is required. Accordingly, this Report shall not be possessed, circulated and/or distributed in any such country or jurisdiction unless such action is in compliance with all applicable laws and regulations of such country or jurisdiction. RSL requires such recipient to inform himself about and to observe any restrictions at his own expense, without any liability to RSL. Any dispute arising out of this Report shall be subject to the exclusive jurisdiction of the Courts in India.
The research analysts who have prepared this Report hereby certify that the views /opinions expressed in this Report are their personal independent views/opinions in respect of the securities and their respective issuers. Neither RSL nor the research analysts did have any known direct /indirect conflict of interest including any long/short position(s) in any specific security on which views/opinions have been made, during the preparation of this Report.
General Disclaimers