sensing and predicting human behaviour - ordem dos engenheiros · suzy moat data science lab...
TRANSCRIPT
Suzy Moat Data Science Lab Warwick Business School
Sensing and predicting human behaviour using online data
@suzymoat

The advantage of looking forward 1
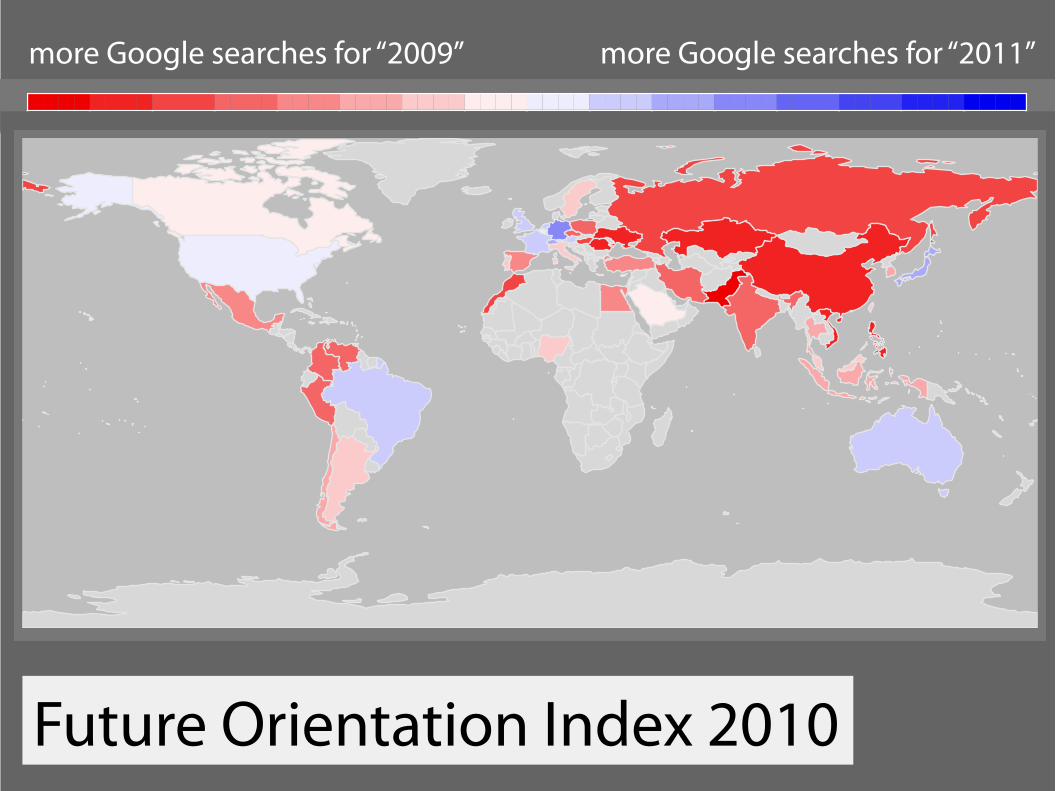
Future Orientation Index 2010
0.2 0.4 0.6 0.8 1.0 1.2 1.4 1.6 1.8
Future Orientation Index 2010 Suzy Moat & Tobias PreisBased on Preis, Moat, Stanley and Bishop (2012)
Ratio of Google searches for “2011” to searches for “2009” during 2010 for 45 countries
more Google searches for “2009” more Google searches for “2011”
0.2 0.4 0.6 0.8 1.0 1.2 1.4 1.6 1.8
Future Orientation Index 2012 Suzy Moat & Tobias PreisBased on Preis, Moat, Stanley and Bishop (2012)
Ratio of Google searches for “2013” to searches for “2011” during 2012 for 45 countries
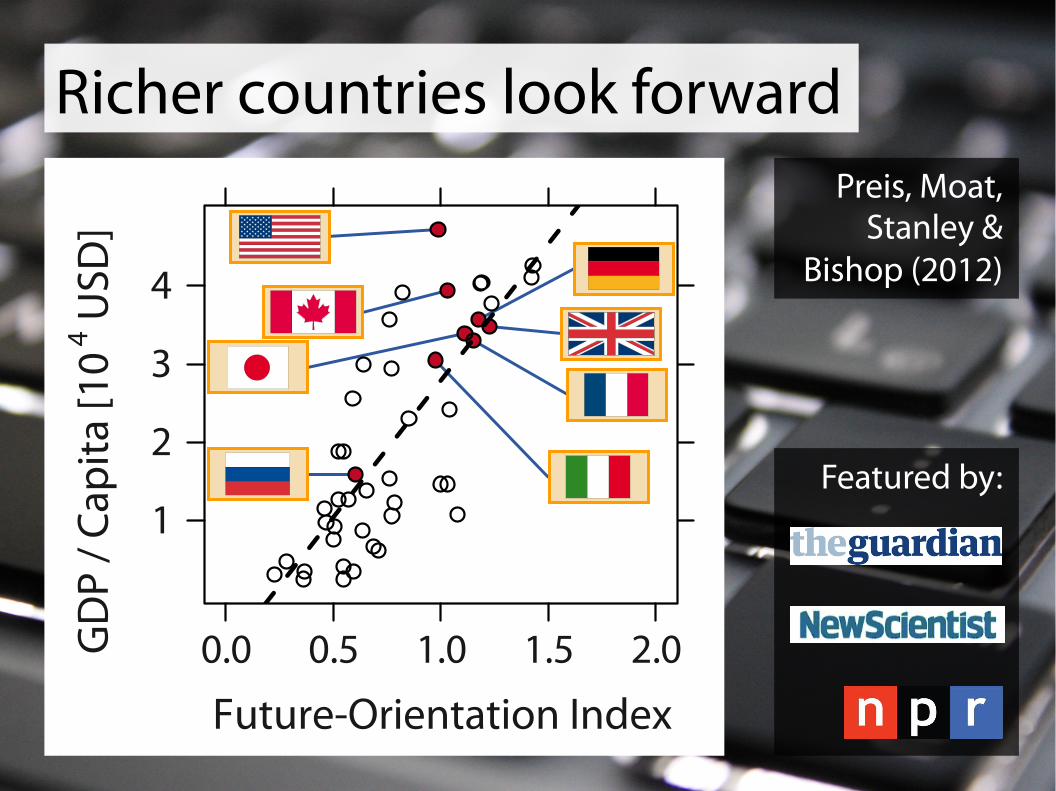
Richer countries look forward
Time with Weekly Granularity
Sear
ch V
olum
e
0
5
10
2008 2009 2010
0
5A B
“2008”“2007”
“2009” “2010” “2011”
“2009”
Future-Orientation Index
GD
P / C
apita
[10
4 USD
]
1
2
3
4
0.0 0.5 1.0 1.5 2.0
Preis, Moat, Stanley &
Bishop (2012)
Featured by:
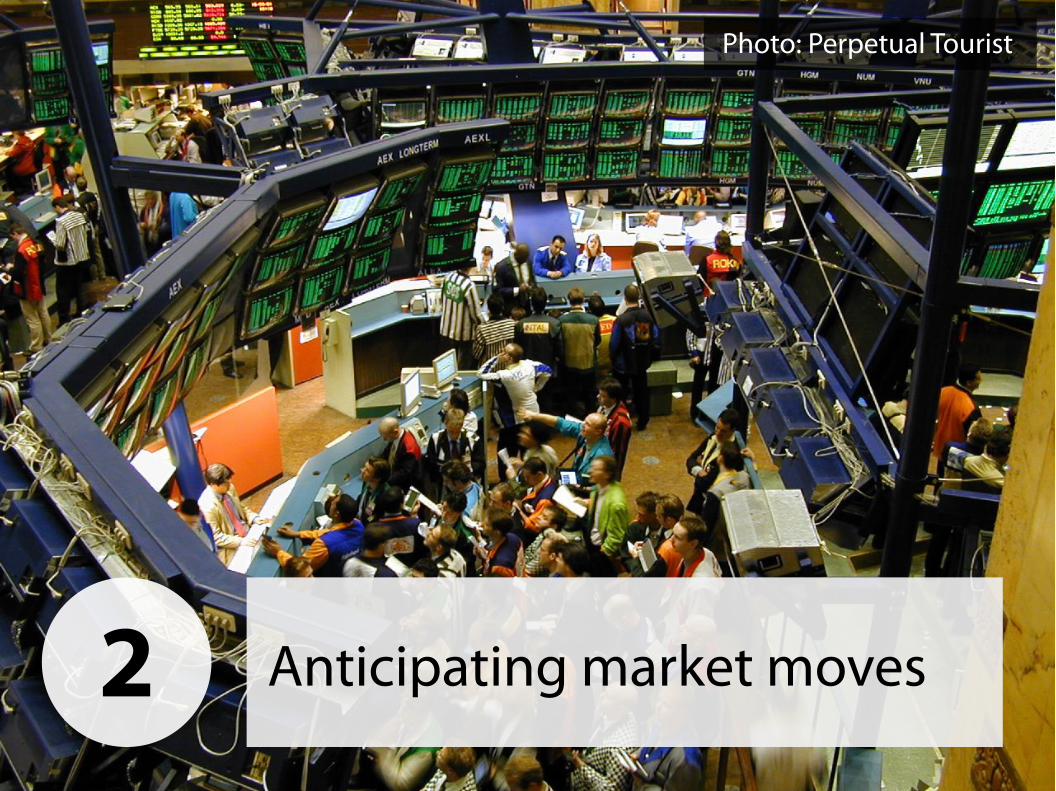
Photo: Perpetual Tourist
Anticipating market moves 2

Hypothetical strategy
week t
Moat et al. (2013); Preis et al. (2013)
number of Wikipedia page views
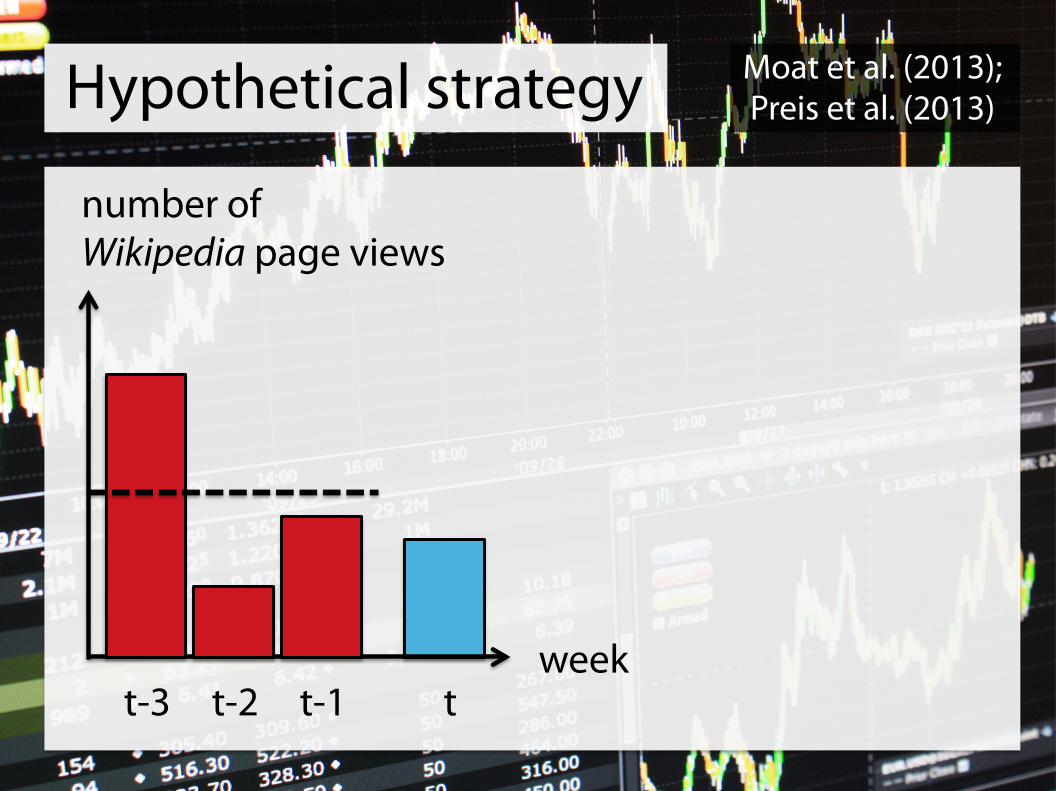
week t t-1 t-2 t-3
Moat et al. (2013); Preis et al. (2013) Hypothetical strategy
number of Wikipedia page views
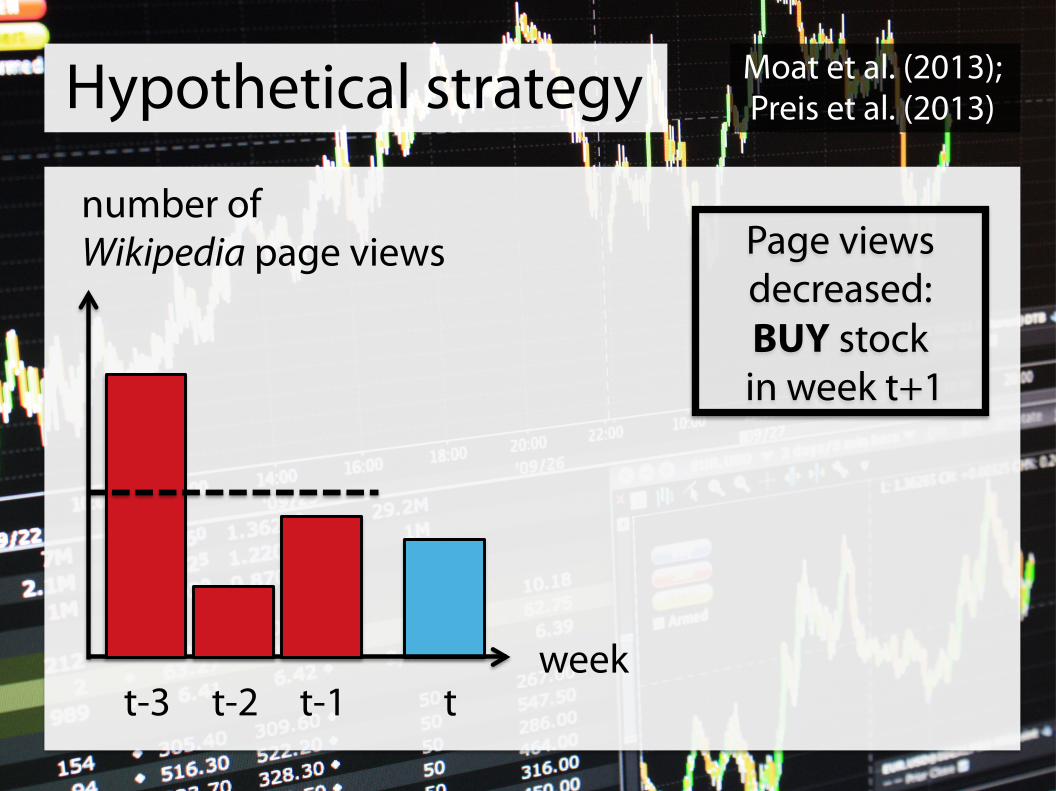
Page views decreased: BUY stock
in week t+1
week t t-1 t-2 t-3
Moat et al. (2013); Preis et al. (2013) Hypothetical strategy
number of Wikipedia page views
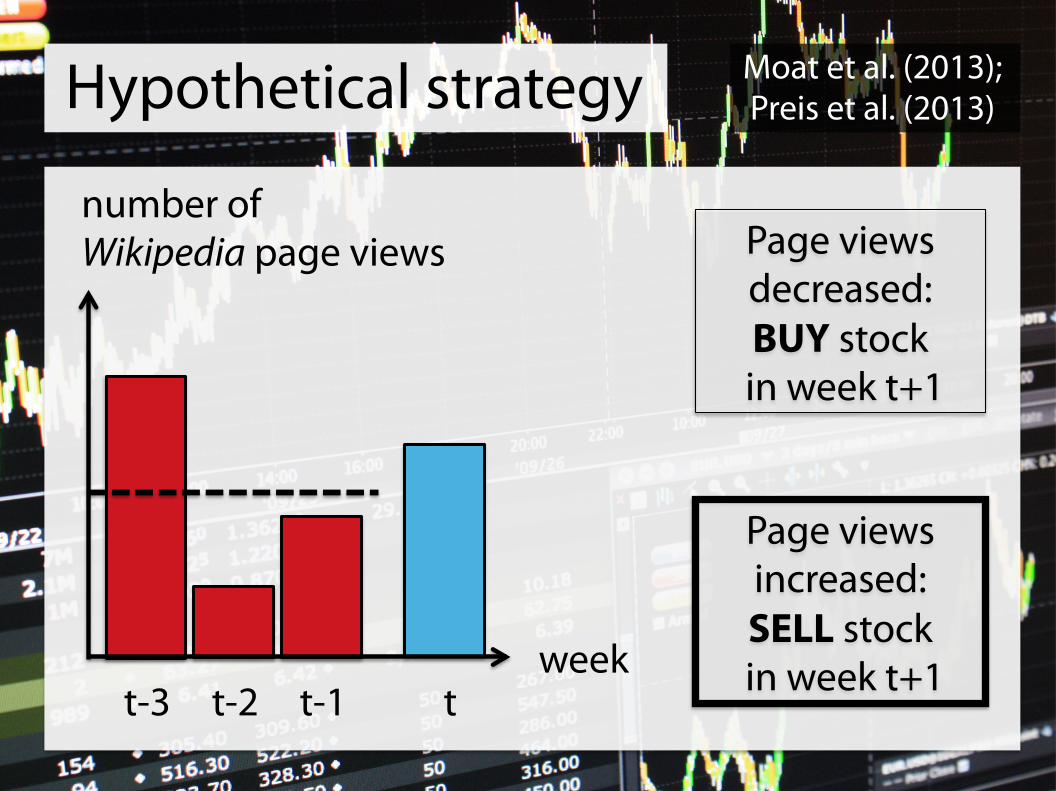
Page views decreased: BUY stock
in week t+1
Page views increased: SELL stock
in week t+1 week t t-1 t-2 t-3
Moat et al. (2013); Preis et al. (2013) Hypothetical strategy
number of Wikipedia page views
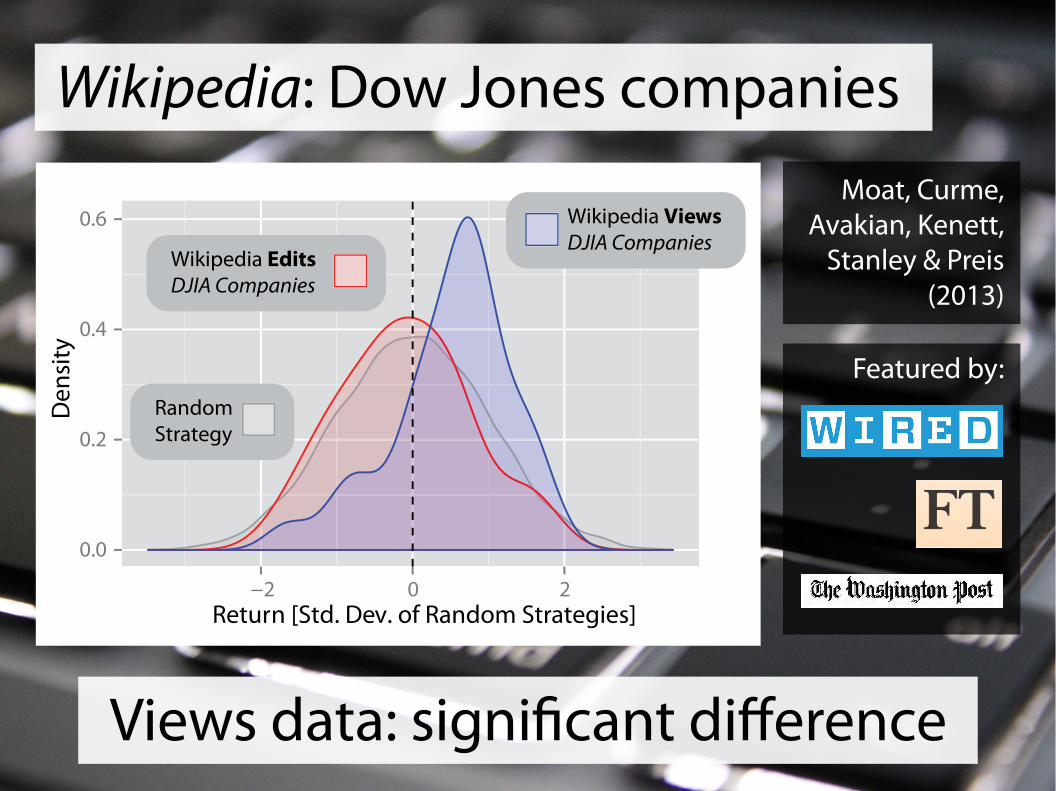
Wikipedia: Dow Jones companies
Views data: significant difference
Moat, Curme, Avakian, Kenett,
Stanley & Preis (2013)
Featured by: Return [Std. Dev. of Random Strategies]
Den
sity
0.0
0.2
0.4
0.6
−2 0 2
Wikipedia ViewsDJIA Companies
Wikipedia EditsDJIA Companies
RandomStrategy
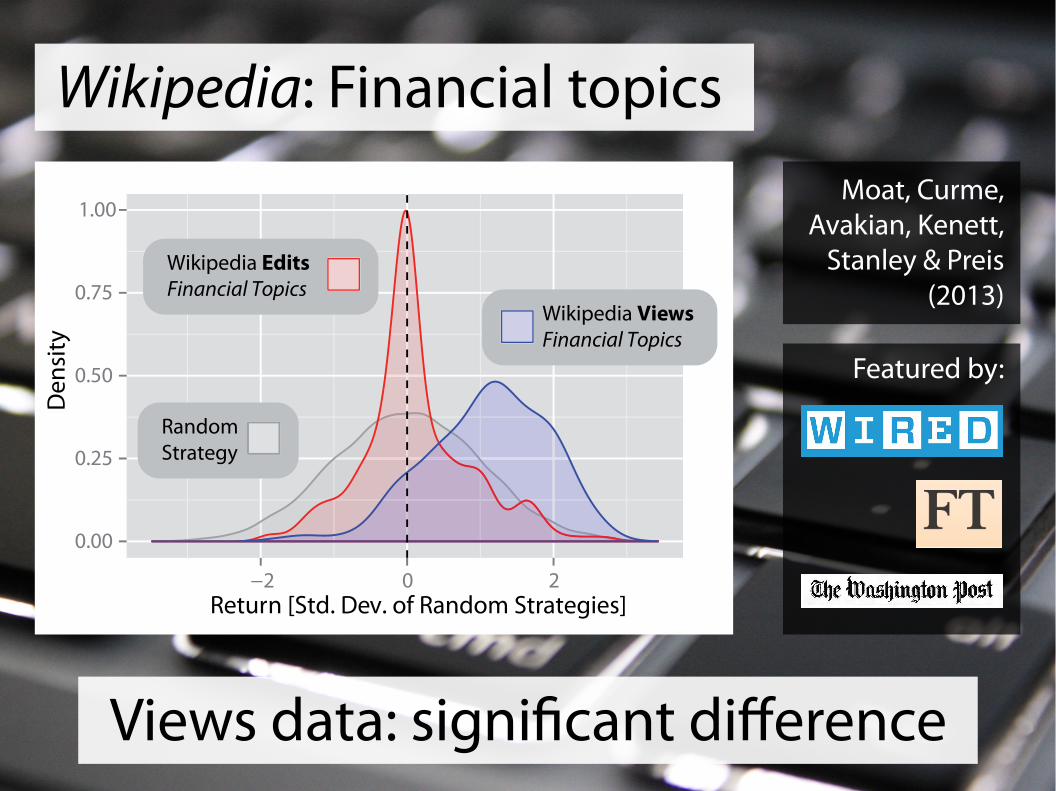
Wikipedia: Financial topics Moat, Curme,
Avakian, Kenett, Stanley & Preis
(2013)
Featured by:
Views data: significant difference
0.00
0.25
0.50
0.75
1.00
−2 0 2Return [Std. Dev. of Random Strategies]
Den
sity
Wikipedia ViewsFinancial Topics
Wikipedia EditsFinancial Topics
RandomStrategy
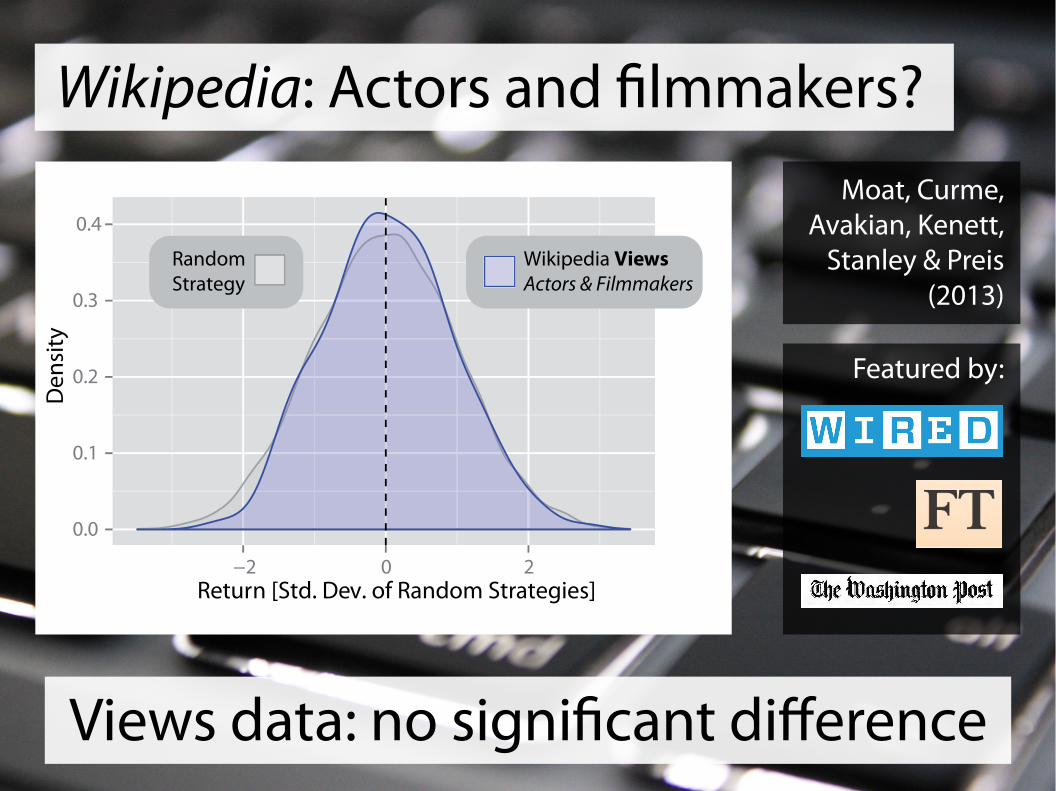
Wikipedia: Actors and filmmakers? Moat, Curme,
Avakian, Kenett, Stanley & Preis
(2013)
Featured by:
0.0
0.1
0.2
0.3
0.4
−2 0 2Return [Std. Dev. of Random Strategies]
Den
sity
Wikipedia ViewsActors & Filmmakers
RandomStrategy
Views data: no significant difference

Random strategy mean + 2 sds
Random strategy mean + 1 sd
return (random strategy sds)
0
1
2
-1
“debt” “culture”
How Google keywords perform
Preis, Moat & Stanley (2013)

Random strategy mean + 2 sds
Random strategy mean + 1 sd
return (random strategy sds)
0
1
2
-1
“debt” “culture”
“stocks”
“credit”
“garden” “train”
Preis, Moat & Stanley (2013)
How Google keywords perform
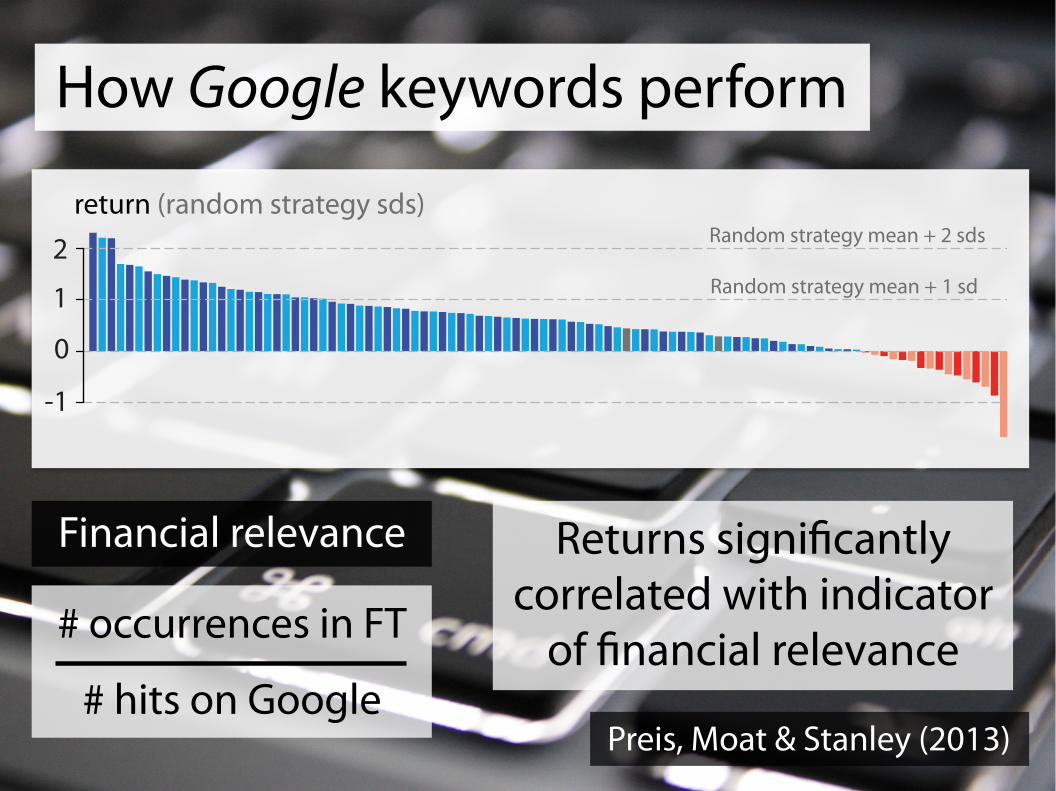
# occurrences in FT
# hits on Google
Returns significantly correlated with indicator
of financial relevance
Financial relevance
Random strategy mean + 2 sds
Random strategy mean + 1 sd
return (random strategy sds)
0
1
2
-1
Preis, Moat & Stanley (2013)
How Google keywords perform
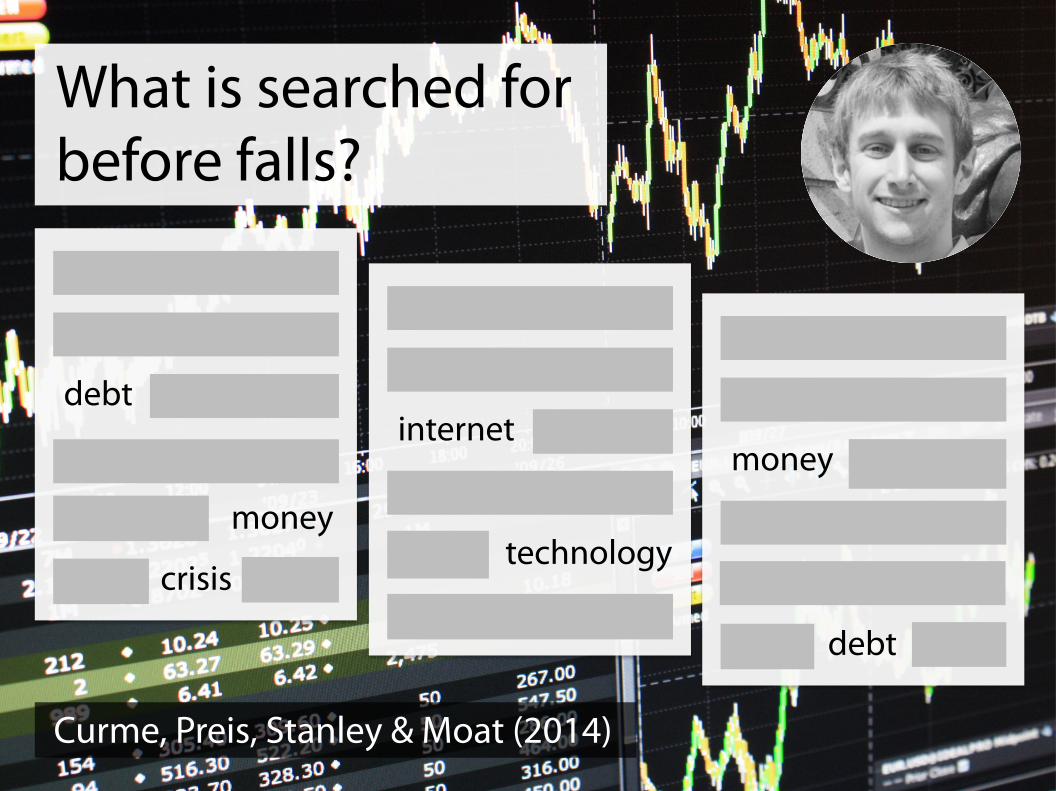
debt
money
crisis
internet
technology
money
debt
Curme, Preis, Stanley & Moat (2014)
What is searched for before falls?
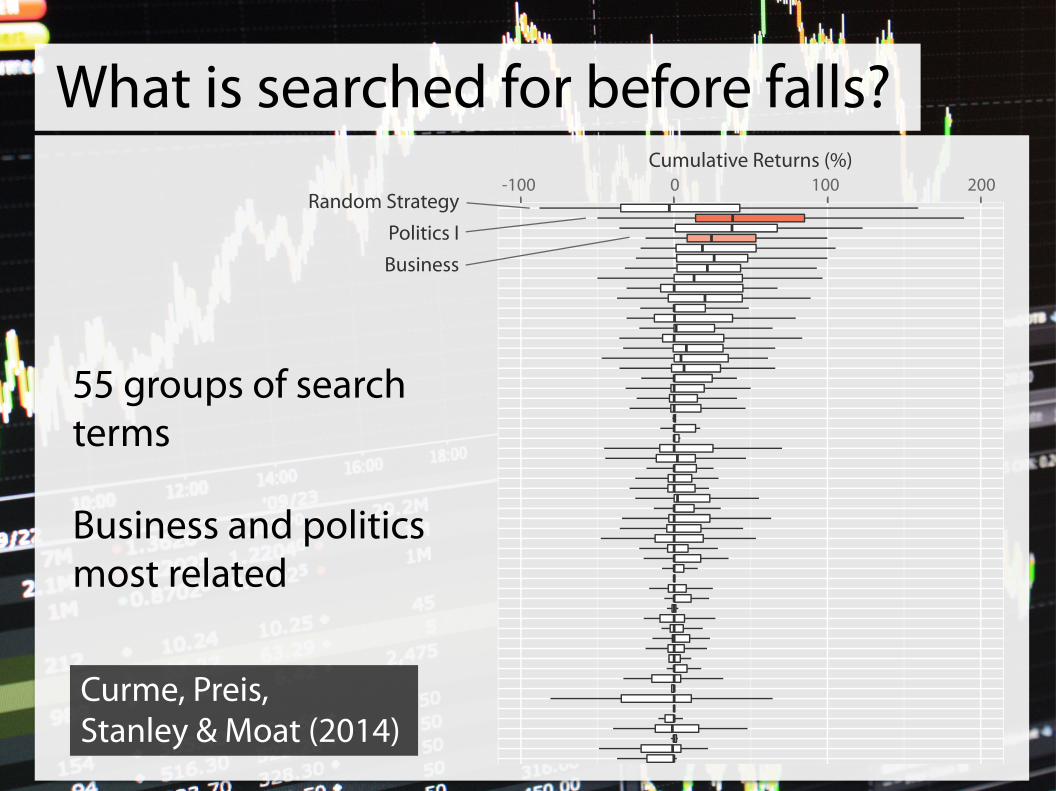
55 groups of search terms
Business and politics most related
Curme, Preis, Stanley & Moat (2014)
What is searched for before falls? Cumulative Returns (%)
-100 0 100 200Random Strategy
Politics IBusiness
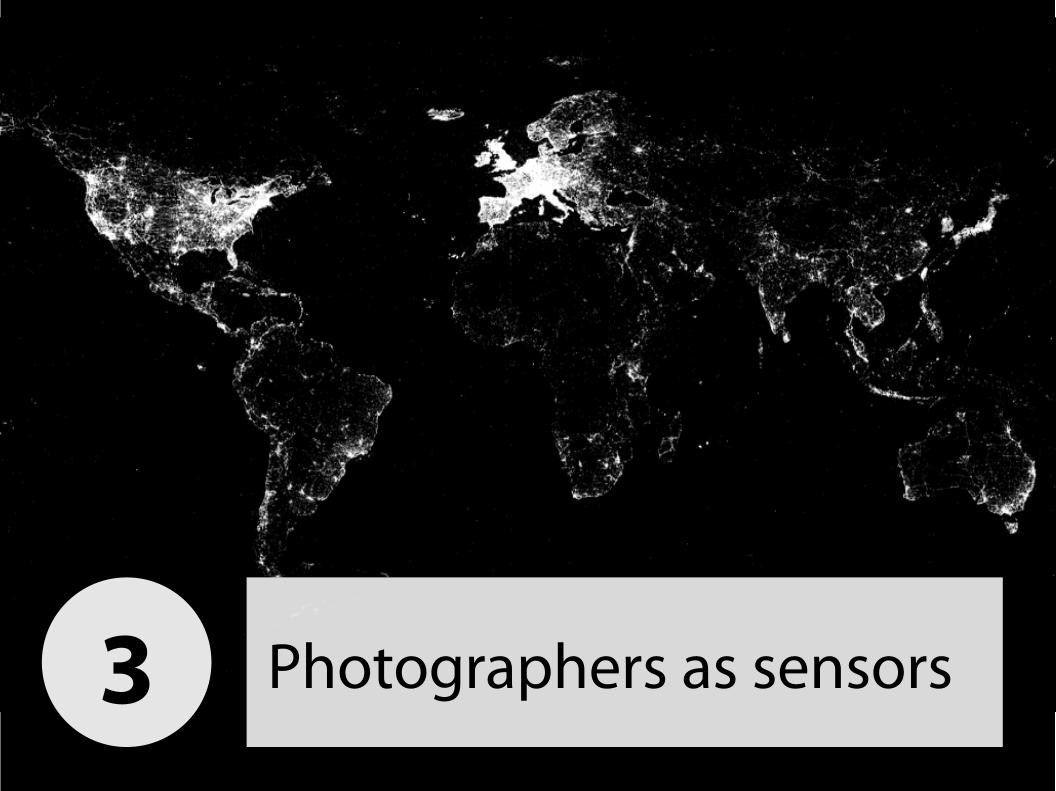
Photographers as sensors 3
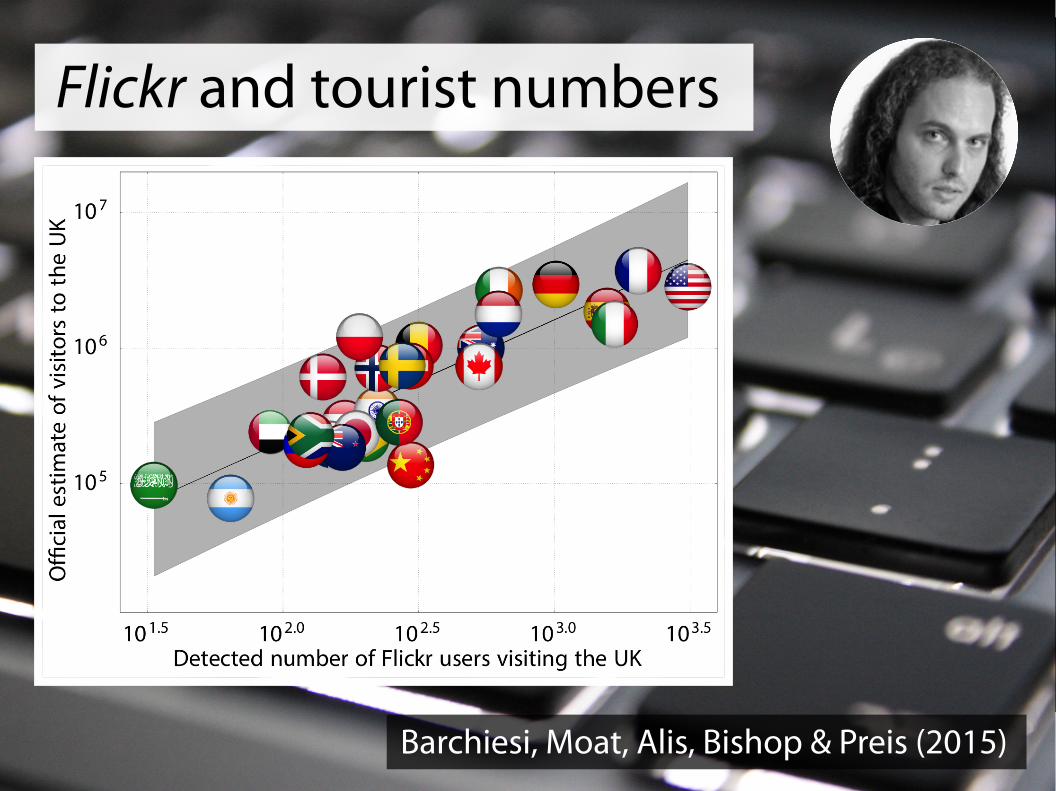
Flickr and tourist numbers
Barchiesi, Moat, Alis, Bishop & Preis (2015)
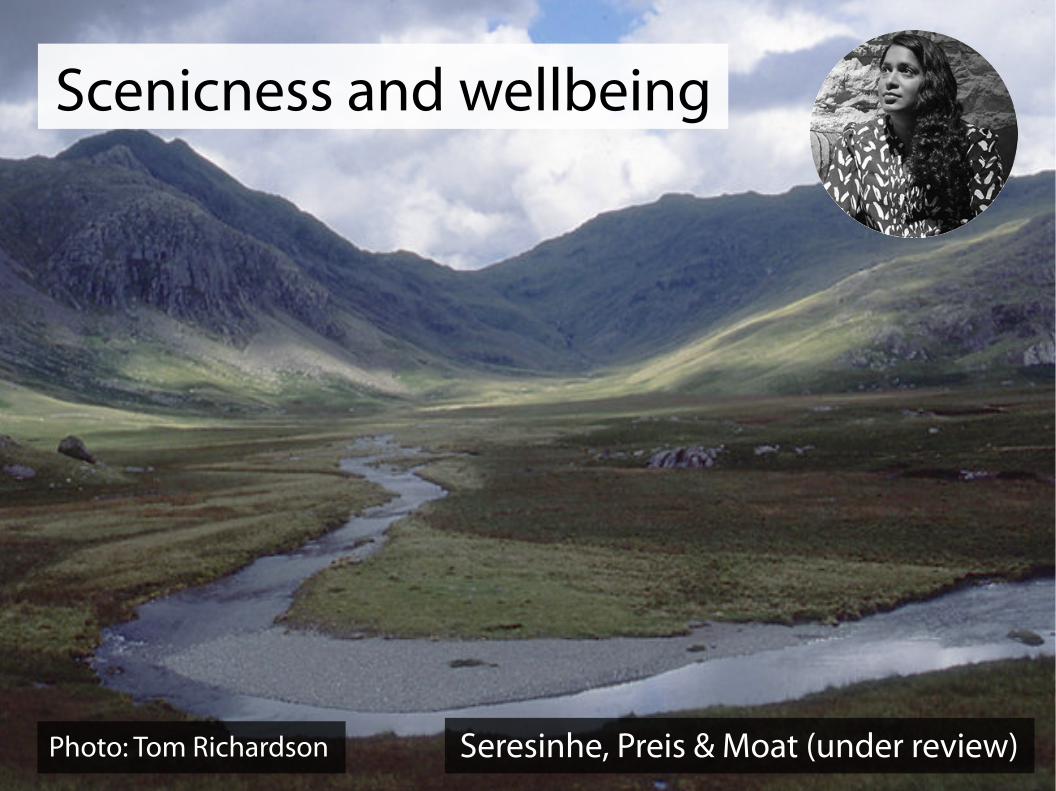
Seresinhe, Preis & Moat (under review)
Scenicness and wellbeing
Photo: Tom Richardson
A
D
Average percentageof greenspace
0 0.3 0.6 0.7 0.9 0.94 0.96 0.99
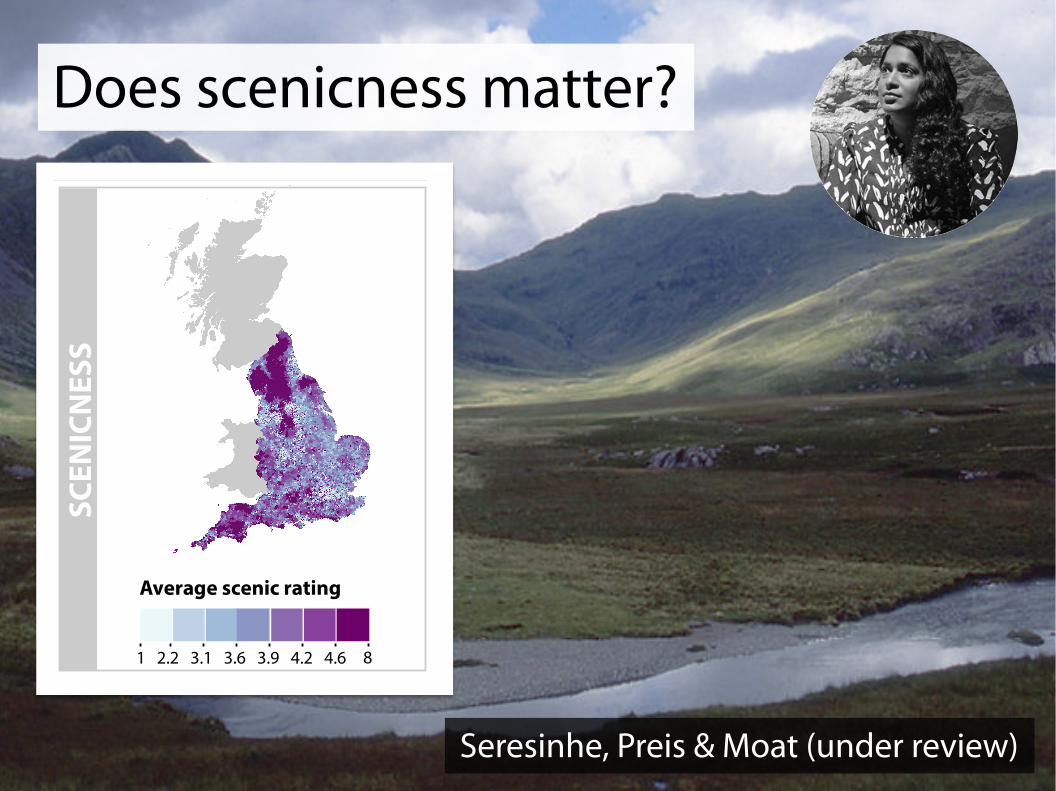
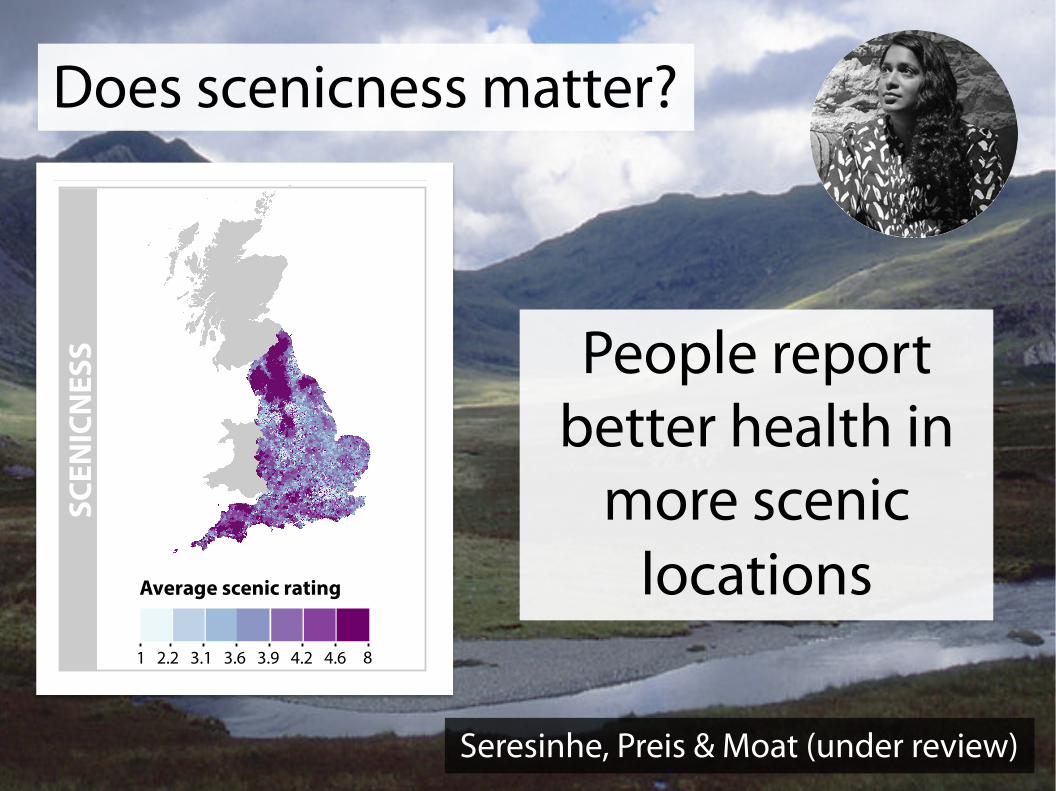
Average scenic rating
1 2.2 3.1 3.6 3.9 4.2 4.6 8
POO
R H
EALT
HG
REEN
SPA
CE
SCEN
ICN
ESS
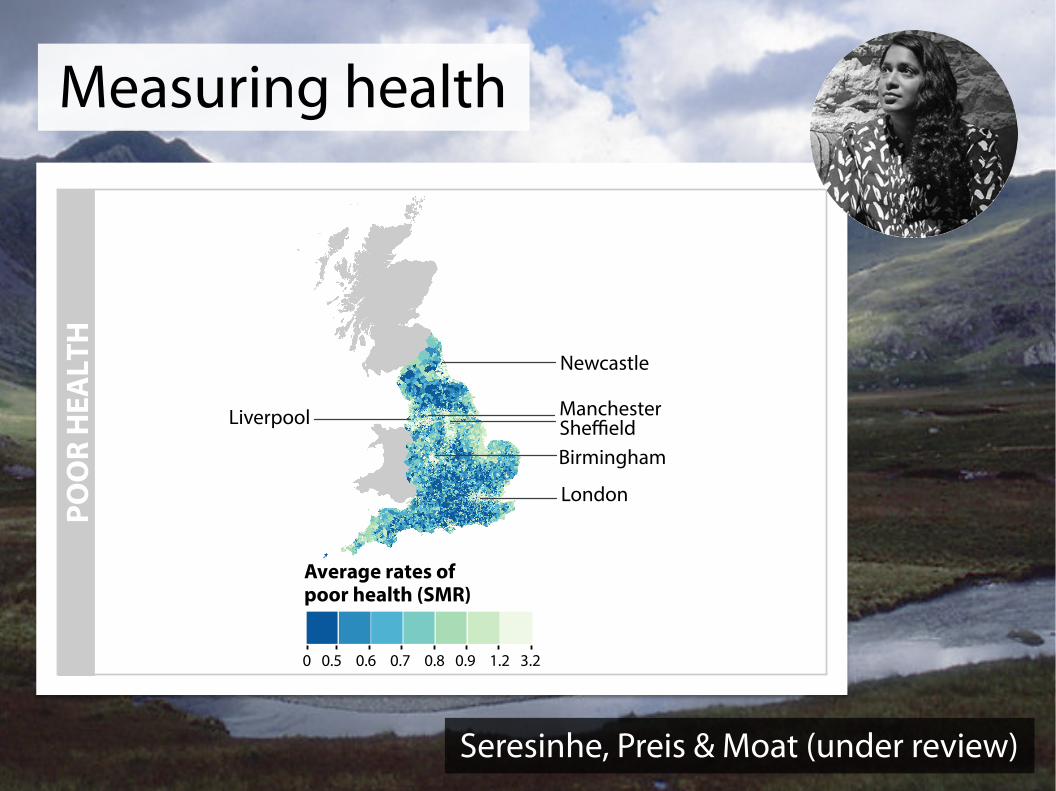
Average rates of poor health (SMR)
0 0.5 0.6 0.7 0.8 0.9 1.2 3.2
London
Birmingham
Manchester
Newcastle
Liverpool Sheffield
B C
0.00
0.25
0.50
0.75
1.00
All areas Urban Suburban Rural
Prob
ablit
y of
the
mod
el g
iven
the
data
(AIC
w)
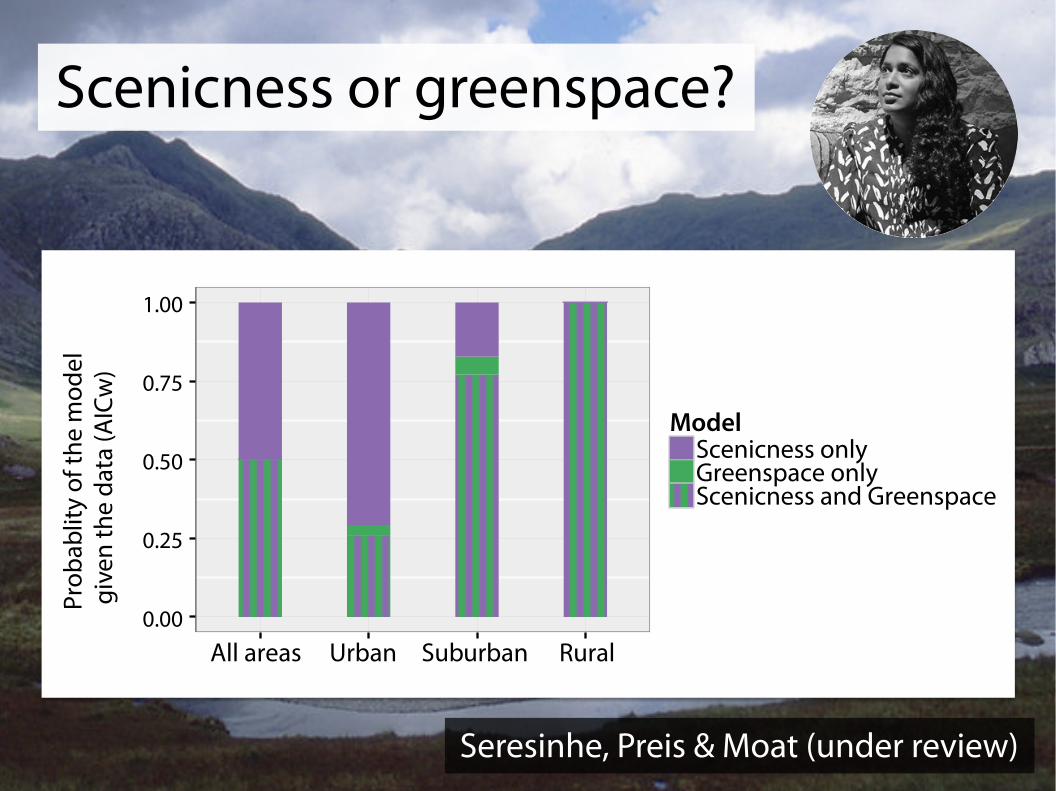
ModelScenicness onlyGreenspace onlyScenicness and Greenspace
Seresinhe, Preis & Moat (under review)
Measuring health
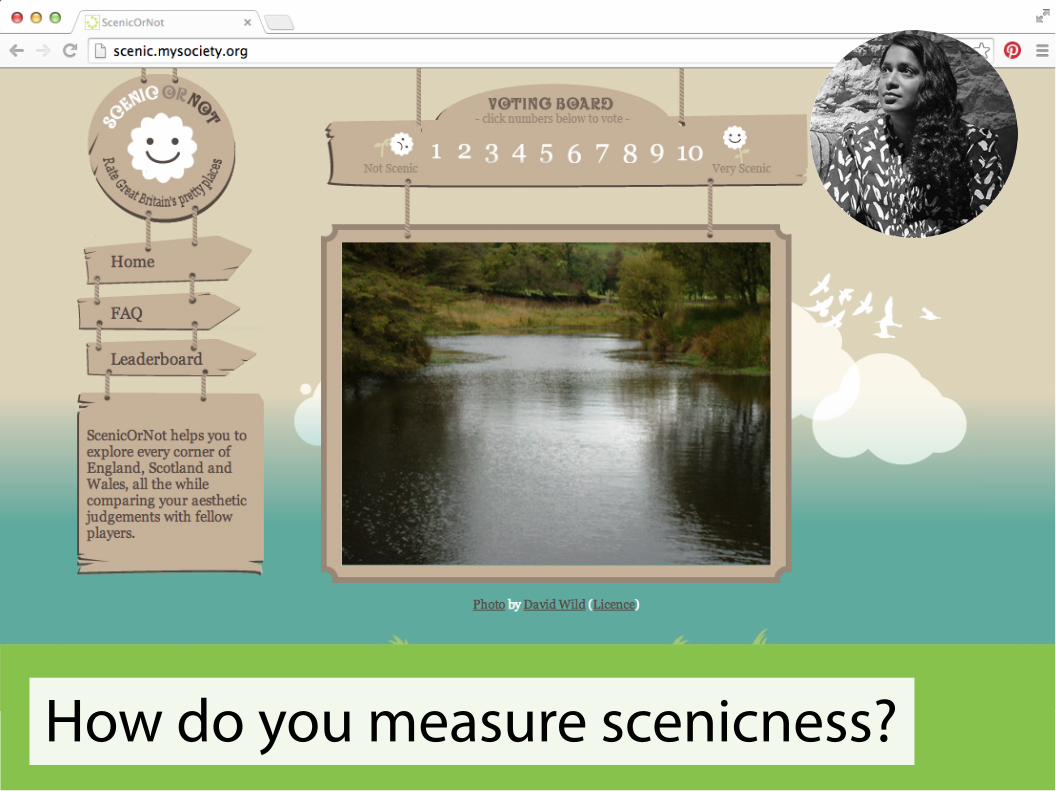
How do you measure scenicness?
Seresinhe, Preis & Moat (under review)
A
D
Average percentageof greenspace
0 0.3 0.6 0.7 0.9 0.94 0.96 0.99
Average scenic rating
1 2.2 3.1 3.6 3.9 4.2 4.6 8
POO
R H
EALT
HG
REEN
SPA
CE
SCEN
ICN
ESS
Average rates of poor health (SMR)
0 0.5 0.6 0.7 0.8 0.9 1.2 3.2
London
Birmingham
Manchester
Newcastle
Liverpool Sheffield
B C
0.00
0.25
0.50
0.75
1.00
All areas Urban Suburban Rural
Prob
ablit
y of
the
mod
el g
iven
the
data
(AIC
w)
ModelScenicness onlyGreenspace onlyScenicness and Greenspace
Does scenicness matter?
Seresinhe, Preis & Moat (under review)
A
D
Average percentageof greenspace
0 0.3 0.6 0.7 0.9 0.94 0.96 0.99
Average scenic rating
1 2.2 3.1 3.6 3.9 4.2 4.6 8
POO
R H
EALT
HG
REEN
SPA
CE
SCEN
ICN
ESS
Average rates of poor health (SMR)
0 0.5 0.6 0.7 0.8 0.9 1.2 3.2
London
Birmingham
Manchester
Newcastle
Liverpool Sheffield
B C
0.00
0.25
0.50
0.75
1.00
All areas Urban Suburban Rural
Prob
ablit
y of
the
mod
el g
iven
the
data
(AIC
w)
ModelScenicness onlyGreenspace onlyScenicness and Greenspace
People report better health in
more scenic locations
Does scenicness matter?
A
D
Average percentageof greenspace
0 0.3 0.6 0.7 0.9 0.94 0.96 0.99
Average scenic rating
1 2.2 3.1 3.6 3.9 4.2 4.6 8
POO
R H
EALT
HG
REEN
SPA
CE
SCEN
ICN
ESS
Average rates of poor health (SMR)
0 0.5 0.6 0.7 0.8 0.9 1.2 3.2
London
Birmingham
Manchester
Newcastle
Liverpool Sheffield
B C
0.00
0.25
0.50
0.75
1.00
All areas Urban Suburban Rural
Prob
ablit
y of
the
mod
el g
iven
the
data
(AIC
w)
ModelScenicness onlyGreenspace onlyScenicness and Greenspace
Seresinhe, Preis & Moat (under review)
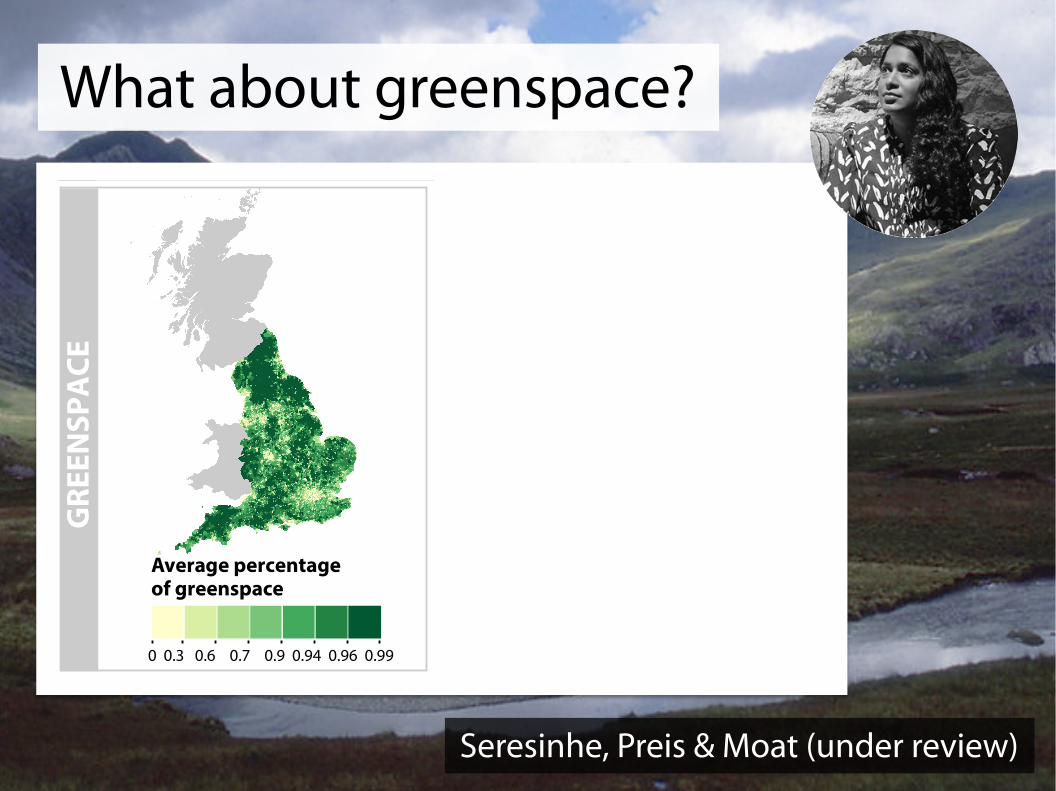
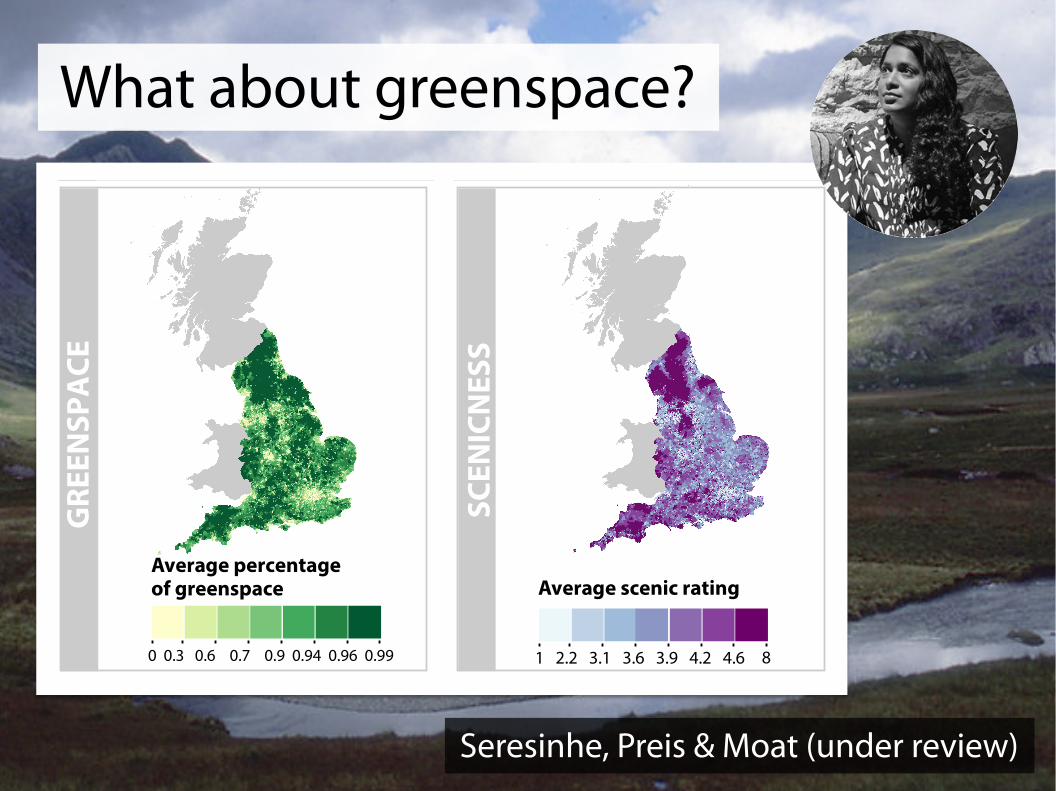
What about greenspace?
A
D
Average percentageof greenspace
0 0.3 0.6 0.7 0.9 0.94 0.96 0.99
Average scenic rating
1 2.2 3.1 3.6 3.9 4.2 4.6 8
POO
R H
EALT
HG
REEN
SPA
CE
SCEN
ICN
ESS
Average rates of poor health (SMR)
0 0.5 0.6 0.7 0.8 0.9 1.2 3.2
London
Birmingham
Manchester
Newcastle
Liverpool Sheffield
B C
0.00
0.25
0.50
0.75
1.00
All areas Urban Suburban Rural
Prob
ablit
y of
the
mod
el g
iven
the
data
(AIC
w)
ModelScenicness onlyGreenspace onlyScenicness and Greenspace
Seresinhe, Preis & Moat (under review)
What about greenspace?
A
D
Average percentageof greenspace
0 0.3 0.6 0.7 0.9 0.94 0.96 0.99
Average scenic rating
1 2.2 3.1 3.6 3.9 4.2 4.6 8
POO
R H
EALT
HG
REEN
SPA
CE
SCEN
ICN
ESS
Average rates of poor health (SMR)
0 0.5 0.6 0.7 0.8 0.9 1.2 3.2
London
Birmingham
Manchester
Newcastle
Liverpool Sheffield
B C
0.00
0.25
0.50
0.75
1.00
All areas Urban Suburban Rural
Prob
ablit
y of
the
mod
el g
iven
the
data
(AIC
w)
ModelScenicness onlyGreenspace onlyScenicness and Greenspace
Seresinhe, Preis & Moat (under review)
Scenicness or greenspace?
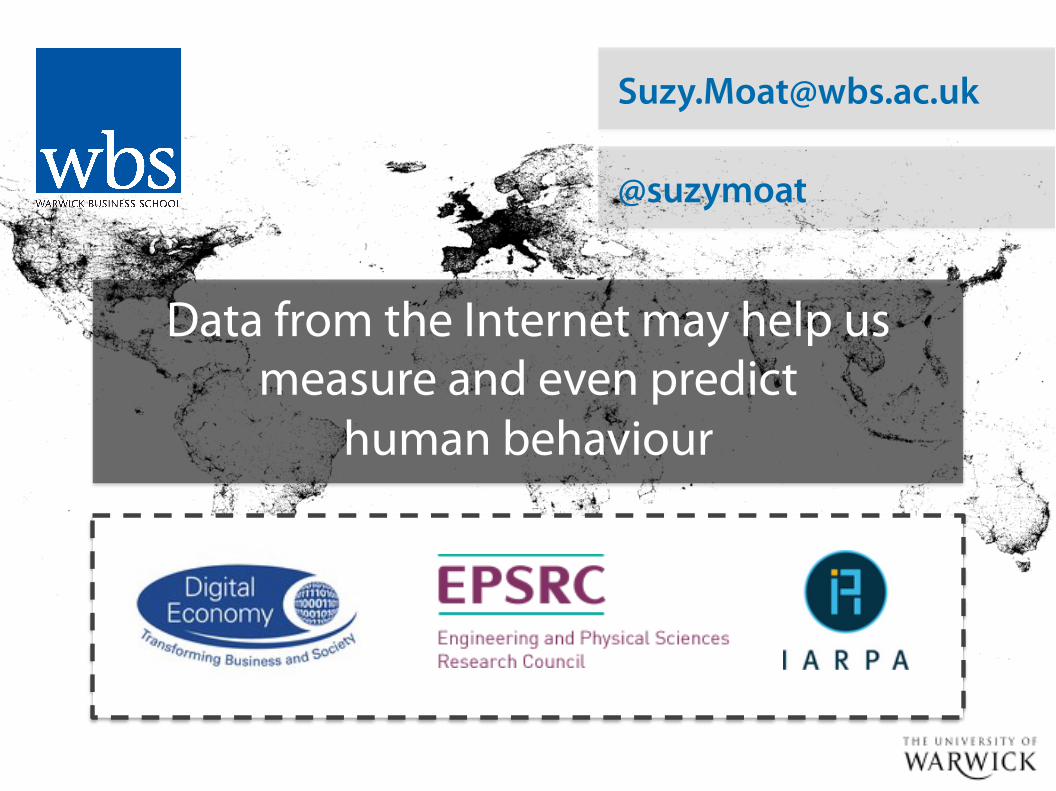
Data from the Internet may help us measure and even predict
human behaviour
@suzymoat