sensitive optical biosensors for unlabeled targets: a review · sensitive optical biosensors for...
TRANSCRIPT
a n a l y t i c a c h i m i c a a c t a 6 2 0 ( 2 0 0 8 ) 8–26
avai lab le at www.sc iencedi rec t .com
journa l homepage: www.e lsev ier .com/ locate /aca
Review
Sensitive optical biosensors for unlabeled targets: A review
Xudong Fan ∗, Ian M. White, Siyka I. Shopova, Hongying Zhu,Jonathan D. Suter, Yuze SunDepartment of Biological Engineering, University of Missouri, 240D, Bond Life Sciences Center,1201 E. Rollins Street, Columbia, Missouri 65211, USA
a r t i c l e i n f o
Article history:
Received 2 March 2008
Received in revised form
10 May 2008
Accepted 12 May 2008
Published on line 18 May 2008
a b s t r a c t
This article reviews the recent progress in optical biosensors that use the label-free detec-
tion protocol, in which biomolecules are unlabeled or unmodified, and are detected in their
natural forms. In particular, it will focus on the optical biosensors that utilize the refrac-
tive index change as the sensing transduction signal. Various optical label-free biosensing
platforms will be introduced, including, but not limited to, surface plasmon resonance, inter-
ferometers, waveguides, fiber gratings, ring resonators, and photonic crystals. Emphasis will
be given to the description of optical structures and their respective sensing mechanisms.
Keywords:
Optical biosensor
Photonic biosensor
Label-free
Examples of detecting various types of biomolecules will be presented. Wherever possible,
the sensing performance of each optical structure will be evaluated and compared in terms
of sensitivity and detection limit.
© 2008 Elsevier B.V. All rights reserved.
. . . . . . . . . . . . . . . . . . . . . . . . . . . . . . . . . . . . . . . . . . . . . . . . . . . . . . . . . . . . . . . . . . . . . . 2. . . . . . . . . . . . . . . . . . . . . . . . . . . . . . . . . . . . . . . . . . . . . . . . . . . . . . . . . . . . . . . . . . . . . 3. . . . . . . . . . . . . . . . . . . . . . . . . . . . . . . . . . . . . . . . . . . . . . . . . . . . . . . . . . . . . . . . . . . . . 3. . . . . . . . . . . . . . . . . . . . . . . . . . . . . . . . . . . . . . . . . . . . . . . . . . . . . . . . . . . . . . . . . . . . . 6. . . . . . . . . . . . . . . . . . . . . . . . . . . . . . . . . . . . . . . . . . . . . . . . . . . . . . . . . . . . . . . . . . . . . 6. . . . . . . . . . . . . . . . . . . . . . . . . . . . . . . . . . . . . . . . . . . . . . . . . . . . . . . . . . . . . . . . . . . . . 7. . . . . . . . . . . . . . . . . . . . . . . . . . . . . . . . . . . . . . . . . . . . . . . . . . . . . . . . . . . . . . . . . . . . . 8. . . . . . . . . . . . . . . . . . . . . . . . . . . . . . . . . . . . . . . . . . . . . . . . . . . . . . . . . . . . . . . . . . . . . 8. . . . . . . . . . . . . . . . . . . . . . . . . . . . . . . . . . . . . . . . . . . . . . . . . . . . . . . . . . . . . . . . . . . . . 9. . . . . . . . . . . . . . . . . . . . . . . . . . . . . . . . . . . . . . . . . . . . . . . . . . . . . . . . . . . . . . . . . . . . 10
Refractive index
Contents
1. Introduction. . . . . . . . . . . . . . . . . . . . . . . . . . . . . . . . . . . . . . . . . . . . . . .2. Optical label-free biosensor structures . . . . . . . . . . . . . . . . . . .
2.1. Surface plasmon resonance based biosensors . . . .2.2. Interferometer-based biosensors . . . . . . . . . . . . . . . . . .
2.2.1. Mach-Zehnder interferometer . . . . . . . . . . . .2.2.2. Young’s interferometer . . . . . . . . . . . . . . . . . . . .2.2.3. Hartman interferometer . . . . . . . . . . . . . . . . . .2.2.4. Backscattering interferometry . . . . . . . . . . . .
2.3. Optical waveguide based biosensors . . . . . . . . . . . . . .2.4. Optical ring resonator based biosensors . . . . . . . . . .
2.4.1. Chip-based ring resonator sensors . . . . . . . . . . . .2.4.2. Stand-alone microsphere based ring resonato2.4.3. Capillary-based opto-fluidic ring resonator se
∗ Corresponding author. Tel.: +1 573 884 2543; fax: +1 573 884 9676.E-mail address: [email protected] (X. Fan).
0003-2670/$ – see front matter © 2008 Elsevier B.V. All rights reserved.doi:10.1016/j.aca.2008.05.022
. . . . . . . . . . . . . . . . . . . . . . . . . . . . . . . . . . . . . . . . . . . . . . . . . . . . . . . . . . . . . . . 11r sensors . . . . . . . . . . . . . . . . . . . . . . . . . . . . . . . . . . . . . . . . . . . . . . . . . . . . 11nsors . . . . . . . . . . . . . . . . . . . . . . . . . . . . . . . . . . . . . . . . . . . . . . . . . . . . . . . . . 12
a n a l y t i c a c h i m i c a a c t a 6 2 0 ( 2 0 0 8 ) 8–26 9
2.5. Optical fiber based biosensors . . . . . . . . . . . . . . . . . . . . . . . . . . . . . . . . . . . . . . . . . . . . . . . . . . . . . . . . . . . . . . . . . . . . . . . . . . . . . . . . . . . . . . . . . 122.5.1. Fiber Bragg grating and long-period grating-based biosensors. . . . . . . . . . . . . . . . . . . . . . . . . . . . . . . . . . . . . . . . . . . . . . 122.5.2. Other optical fiber based label-free biosensors . . . . . . . . . . . . . . . . . . . . . . . . . . . . . . . . . . . . . . . . . . . . . . . . . . . . . . . . . . . . . . 13
2.6. Photonic crystal based sensors . . . . . . . . . . . . . . . . . . . . . . . . . . . . . . . . . . . . . . . . . . . . . . . . . . . . . . . . . . . . . . . . . . . . . . . . . . . . . . . . . . . . . . . . 143. Outlook . . . . . . . . . . . . . . . . . . . . . . . . . . . . . . . . . . . . . . . . . . . . . . . . . . . . . . . . . . . . . . . . . . . . . . . . . . . . . . . . . . . . . . . . . . . . . . . . . . . . . . . . . . . . . . . . . . . . . . . . 15
. . . . .. . . . .
1
OtcsmaGitelombtstQscddtaamisdT(anddtaissw
UoRaa[
example, the RI for protein is 1.5 vs. 1.33 for buffer solu-tion), resulting in a RI change near the sensor surface, whichcan be detected optically as the sensing transduction signal.In most label-free optical sensors, the sensing light is con-
Acknowledgments . . . . . . . . . . . . . . . . . . . . . . . . . . . . . . . . . . . . . . . .References . . . . . . . . . . . . . . . . . . . . . . . . . . . . . . . . . . . . . . . . . . . . . . . . .
. Introduction
ptical biosensors are a powerful detection and analysis toolhat has vast applications in biomedical research, health-are, pharmaceuticals, environmental monitoring, homelandecurity, and the battlefield [1]. They are immune to electro-agnetic interference, capable of performing remote sensing,
nd can provide multiplexed detection within a single device.enerally, there are two detection protocols that can be
mplemented in optical biosensing: fluorescence-based detec-ion and label-free detection. In fluorescence-based detection,ither target molecules or biorecognition molecules areabeled with fluorescent tags, such as dyes; the intensityf the fluorescence indicates the presence of the targetolecules and the interaction strength between target and
iorecognition molecules. While fluorescence-based detec-ion is extremely sensitive, with the detection limit down to aingle molecule [2], it suffers from laborious labeling processeshat may also interfere with the function of a biomolecule.uantitative analysis is challenging due to the fluorescenceignal bias, as the number of fluorophores on each moleculeannot be precisely controlled [3]. In contrast, in label-freeetection, target molecules are not labeled or altered, and areetected in their natural forms. This type of detection is rela-ively easy and cheap to perform, and allows for quantitativend kinetic measurement of molecular interaction. Addition-lly, as discussed later, some label-free detection mechanismseasure refractive index (RI) change induced by molecular
nteractions, which is related to the sample concentration orurface density, instead of total sample mass. As a result, theetection signal does not scale down with the sample volume.his characteristic is particularly attractive when ultrasmall
femtoliter to nanoliter) detection volume is involved and isdvantageous over fluorescence-based detection whose sig-al usually depends on the total number of analytes in theetection volume or on the detection surface. Despite all theseifferences between fluorescence-based and label-free detec-ion, both protocols are being widely used in optical sensorsnd provide vital and complementary information regardingnteractions among biomolecules, which makes optical sen-ors more versatile than other types of sensing technologies,uch as surface acoustic wave and quartz crystal microbalancehere only label-free detection can be implemented.
In this article, we will discuss label-free optical detection.nder this category, there exist a number of detection meth-ds, including RI detection, optical absorption detection, and
aman spectroscopic detection. RI and absorption are the realnd imaginary part of the more general complex RI constantnd are related to each other via the Kronig–Kramers relations4]. Raman detection is unique in that, on one hand, like RI and. . . . . . . . . . . . . . . . . . . . . . . . . . . . . . . . . . . . . . . . . . . . . . . . . . . . . . . . . . . . . . . 16. . . . . . . . . . . . . . . . . . . . . . . . . . . . . . . . . . . . . . . . . . . . . . . . . . . . . . . . . . . . . . . 16
absorption detection, target molecules are not labeled; on theother hand, emitted Raman light is used for sensing, similar tofluorescence-based detection. Here, we will further limit thescope of our article to RI-based label-free detection. Opticalabsorption and Raman-based biosensing can be found else-where [5,6]. Note that some of the RI-based sensors can detectboth the RI of bulk solution (refractometer) and the RI changeinduced by molecule binding (biosensor) whereas others canbe used only for bulk solution RI detection. We will only dis-cuss those that have been demonstrated for biosensing or havepotential capability of biosensing.
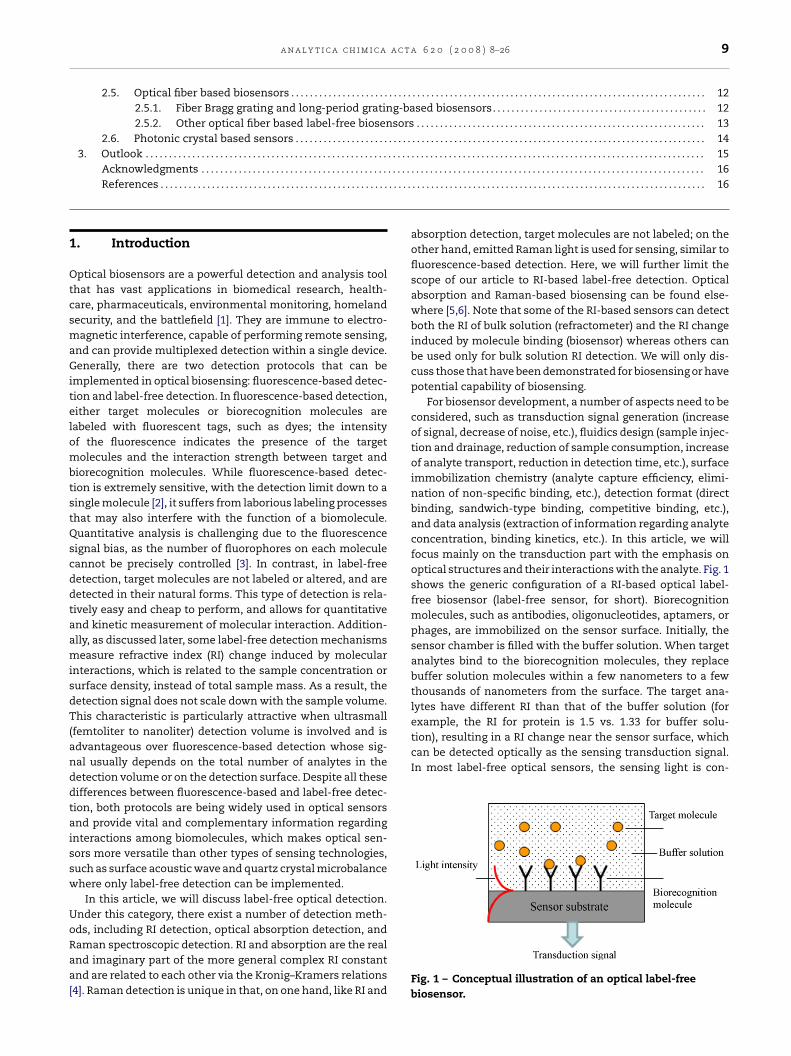
For biosensor development, a number of aspects need to beconsidered, such as transduction signal generation (increaseof signal, decrease of noise, etc.), fluidics design (sample injec-tion and drainage, reduction of sample consumption, increaseof analyte transport, reduction in detection time, etc.), surfaceimmobilization chemistry (analyte capture efficiency, elimi-nation of non-specific binding, etc.), detection format (directbinding, sandwich-type binding, competitive binding, etc.),and data analysis (extraction of information regarding analyteconcentration, binding kinetics, etc.). In this article, we willfocus mainly on the transduction part with the emphasis onoptical structures and their interactions with the analyte. Fig. 1shows the generic configuration of a RI-based optical label-free biosensor (label-free sensor, for short). Biorecognitionmolecules, such as antibodies, oligonucleotides, aptamers, orphages, are immobilized on the sensor surface. Initially, thesensor chamber is filled with the buffer solution. When targetanalytes bind to the biorecognition molecules, they replacebuffer solution molecules within a few nanometers to a fewthousands of nanometers from the surface. The target ana-lytes have different RI than that of the buffer solution (for
Fig. 1 – Conceptual illustration of an optical label-freebiosensor.

a c t
10 a n a l y t i c a c h i m i c acentrated near the sensor surface with an evanescent fieldexponentially decaying into the bulk solution with a char-acteristic decay length of a few tens to a few hundreds ofnanometers. Therefore, it is capable of detecting the RI changeinduced by the analyte binding that is within the decay length.However, for those analytes that are not captured by thebiorecognition molecules, and therefore, are far away fromthe sensing surface, the sensing signal decreases significantly.As a consequence, this evanescent sensing provides a meansto distinguish actual target molecules from those that do notbind to the sensing surface but may still be present in bulksolution.
In sensor development, sensitivity is an important param-eter to evaluate the sensor performance. Sensitivity is themagnitude of sensor transduction signal change in responseto the change in analyte. Fundamentally, sensitivity is deter-mined by the strength of light-matter interaction [7–9]. Inmost evanescent wave based sensors, it is determined by thefraction of light in solution or the light intensity at the sen-sor surface. Sensor detection limit (DL) is another importantparameter to characterize the sensor performance. The DL canbe deduced by taking into account the noise in the transduc-tion signal, �, i.e., the minimum resolvable signal: DL = �/S,where S is the sensitivity. For an optical RI-based label-freesensor, typically there are three ways to specify the DL. First,since all these sensors are sensitive to the RI change in bulksolution, DL in units of refractive index units (RIU) is natu-rally used to quantify the sensor performance, which enablesa rough comparison of the sensing capability among differ-ent optical technologies and structures. The second way is touse surface mass density (or total mass) in units of pg mm−2
(or pg), which is what a biosensor actually measures. Whileexperimentally surface mass density is difficult to determineaccurately, it reflects the intrinsic detection capability of asensor and can be used to evaluate or compare the sensorperformance. The third way is to use sample concentration (inunits of ng mL−1 or molarity). Sample concentration is quiteuseful and easy to determine from an experimental point ofview, as no detailed information regarding the mass densityon the surface is needed. However, the DL defined in this man-ner depends on the target molecule and its affinity to thebiorecognition molecule on the surface, and therefore needsto be specified for each type of a biomolecule. These threeDLs are correlated and the detailed relationship among themneeds to be studied for each individual optical biosensor.
Improvement in the DL can be accomplished by increasingthe sensitivity or reducing the noise level. Sensitivity can beenhanced by increasing the light-matter interaction. In mostcases, this amounts to increasing the fraction of light near thesensing surface (examples of which will be shown later). Fora label-free optical biosensor, the most commonly seen noiseis from temperature fluctuations, which results in a thermo-optic effect (i.e., temperature-dependent RI changes) and athermo-mechanic effect (e.g., thermal expansion) in both sen-sor substrate and buffer solution. A general approach to reducethe thermally induced noise is to implement a temperature
control, such as a thermoelectric cooler to stabilize temper-ature. Another method is to balance the thermo-optic andthermo-mechanic effects. For example, most solvents havea negative thermo-optic coefficient, which can be exploreda 6 2 0 ( 2 0 0 8 ) 8–26
to counteract the thermo-optic and thermo-mechanic effectsof the solid substrate that have a positive coefficient. Withan appropriate design, the temperature-induced noise can besignificantly reduced [10–12]. A third method is to employ areference channel, which is either built into the same sen-sor or placed on a different sensor nearby, to reduce so-calledcommon-mode noise, such as temperature related noise, bulkRI change, and non-specific binding. Through these methods,the sensor performance can be improved significantly.
In the past decade, optical sensor development has beena fascinating and fast-paced area. Various optical structureshave been investigated for sensitive label-free detection. Thisarticle will review the recent advancement in optical label-free biosensors that are based on RI detection. We willselect the following optical structures that we believe repre-sent the majority of research activities in optical label-freesensor development: (1) surface plasmon resonance basedbiosensors; (2) interferometer-based biosensors; (3) opticalwaveguide based biosensors; (4) optical ring resonator basedbiosensors; (5) optical fiber based biosensors; and (6) pho-tonic crystal based biosensors. Note that it is common that anoptical label-free sensor involves two or more optical struc-tures mentioned above to enhance its sensing performance.The above selection and categorization are solely the authors’choice. Emphasis will be given to the description of these opti-cal structures and their respective sensing mechanisms. Inparticular, we will focus on the work done after 2000. Examplesof detecting various types of biomolecules will be presented.Wherever possible, the sensing performance of each opticalstructure will be evaluated and compared in terms of sensi-tivity and DL (see Table 1).
2. Optical label-free biosensor structures
2.1. Surface plasmon resonance based biosensors
Surface plasmon resonance (SPR) biosensor was first demon-strated for biosensing in 1983 by Liedberg et al. [13]. Since thenit has been extensively explored and has gradually become avery powerful label-free tool to study the interactions betweenthe target and biorecognition molecules. The principle, devel-opment, and applications of SPR biosensors have been welldescribed in several excellent review papers [14–17].
A surface plasmon wave (SPW) is a charge density oscilla-tion that occurs at the interface of two media with dielectricconstants of opposite signs, such as a metal (gold or silver) anda dielectric. There are four basic methods to excite the SPR, asshown in Fig. 2: prism coupling [18], waveguide coupling [19],fiber optic coupling [20], and grating coupling [21,22]. In theprism coupling configuration (Fig. 2(A)), the incident light istotally reflected at the prism–metal interface and generates anevanescent field penetrating into the metal layer. At the reso-nant angle or resonant wavelength, the propagation constantof the evanescent field matches that of the SPW as described
in Eq. (1), and as a result, the photon will be coupled into theSPW.2�
�np sin � = ˇsp, (1)

a n a l y t i c a c h i m i c a a c t a 6 2 0 ( 2 0 0 8 ) 8–26 11
Table 1 – Detection limits of various optical biosensors
Technology platform Optical structures Analyte Detection limit Ref.
Surface plasmon resonance Surface plasmon resonance Bulk solution 10−5-10−8 RIU [36–41]Long range SPR Bulk solution 10−7-10−8 RIU [43,45]Surface plasmon resonanceimaging (SPRI)
Bulk solution 10−5-10−7 RIU [53–56]
SPRI Protein 1 nM [58]Optical heterodyne SPR Protein 0.2 nM [59]Phase sensitive SPR Protein 1.3 nM [60]Wavelength modulated SPR DNA 10 pM (Note 1) [63]SPRI DNA and RNA 10 nM [64]Flow injection SPR DNA 54 fM, 1.38 fM (Note
1)[65,66]
Angle modulated SPR Protein (PSA) 0.15 ng mL−1 (Note 1) [67]SPR Protein (CA19-9) 66.7 unit mL−1 [69]SPR Protein (�-fetoprotein) 50 ng mL−1 [70]Prism-based SPR Bacteria (E. coli) 106 cfu mL−1 [74]
Salmonella yphimurium 100 cfu mL−1 [75]
BIAcore 2000 SPR Bacteria 25 cfu mL−1 [76]
Interferometer Mach-Zehnderinterferometer
Bulk solution 10−7 RIU [83]
Protein 20 pg mm−2 [82]
Young’s interferometer Bulk solution ∼1 × 10⁻⁷ RIU [89,90]Virus 1000 particles mL−1 [91]
Hartman interferometer DNA 4 ng mL−1 [95]Protein 5 ng mL−1,
0.1 ng mL−1 (Note 1)[95,96]
Virus 107 pfu mL−1 [95]Bacteria 5 × 10⁸ cfu mL−1,
5 × 10⁵ cfu mL−1
(Note 1)
[95]
Backscattering interferometerPorous silicon DNA 2 pM [98]BioCD Protein 0.1 ng mL−1 [100]Microchannel
backscatteringBulk solution 7 × 10⁻⁹ RIU [105]
Protein femto-mole (Note 2) [103]Protein picomolar (Note 3) [106]
Waveguide Resonant mirror Protein ∼0.1 pg mm−2 [113]Cell 106 cells mL−1 [108]
Metal-clad waveguide Bacterial spore ∼105 spores mL−1 [119]Cell ∼10 cells mm−2
(Note 2)[121]
Reverse symmetrywaveguide
Cell 60 cells mm−2 (Note2)
[123]
Symmetrical metal-cladwaveguide
Bulk solution 2 × 10⁻⁷ RIU [129]
Ring resonator Ring on a chip Bulk solution 10−4 to 10−7 RIU [168,171,185,189]DNA ∼100 nM [186]Protein 20–250 pg mm−2,
0.1 nM[168,173,190]
Bacteria 105 cfu mL−1 [186]
Dielectric microsphere Bulk solution 10−7 RIU [144]DNA 1 pg mm−2 [134]Protein 10 pg mL−1 (trypsin),
1 unit mL−1
(thrombin)
[145,151]
Virus ∼1 pg mm−2 [143]Bacteria 100 cfu mm−2 (Note
2)[140]

12 a n a l y t i c a c h i m i c a a c t a 6 2 0 ( 2 0 0 8 ) 8–26
Table 1 (Continued )
Technology platform Optical structures Analyte Detection limit Ref.
Capillary opto-fluidic ring Bulk solution 10−6-10−7 RIU [152]DNA 4 pg mm−2, 10 pM [163]Protein ∼1 pg mm−2, 3 pM
(Note 2)[157]
Virus 1000 particles mL−1 [164]
Optical fiber Fiber Bragg grating Bulk solution ∼10−6 RIU [204–209]DNA 0.7 �g mL−1, 0.1 �M [209]
Long-period grating Bulk solution 10−4 RIU [219]Protein 2 �g mL−1 [218]
Nanofiber Bulk solution 10−7 RIU [223]
Fiber coupler Bulk solution 4 × 10⁻⁶ RIU [227]Protein 0.5 �g mL−1 [227]
Fiber Fabry-Perot cavity Bulk solution 10−5 RIU [207,231]DNA 76 �M, 1.7 ng [229]Protein 25 �g mL−1 [228]
Photonic crystal 2-D PC Bulk solution 10−5 RIU [240,241]Protein 0.4 pg mm−2 (Notes 2
and 4)[240,241]
2-D PC microcavity Bulk solution ∼10−3 RIU [234,235]Protein 1 fg [237]
PC waveguide Protein 0.15 �M [239]1-D PC microcavity array Bulk solution 7 × 10⁻⁵ RIU [246]PCF Bulk solution 10−4 RIU [219]
(3) Bi
Notes: (1) With gold nanoparticle amplification. (2) Adsorption result.Results obtained after solution containing protein is dried.where � is the incident wavelength, np the prism refractiveindex, � the incident angel and ˇsp is the propagation con-stant of the SPW. Prism coupling is the most convenient SPRconfiguration and generally has the best sensing DL; however,the prism is bulky and it is difficult to integrate. Waveguide
coupling offers a good alternative to the prism; it is robustand easy to integrate with other optical and electrical com-ponents. The light propagates in a waveguide through totalinternal reflection and generates an evanescent field at theFig. 2 – Various SPR sensor configurations. (A) Prism coupling, (Bside-polished fiber coupling, (E) grating coupling and (F) long-ranReprinted with permission from refs. [15,20,24,44].
nding takes place in free solution rather than on a solid substrate. (4)
waveguide–metal interface, which excites the SPW in thesame way as in the prism configuration (Fig. 2(B)). Optical fibersare also used to excite the SPW in an easy and flexible way.As shown in Fig. 2(C), a small portion of the fiber is removedand then coated with a layer of metal film. Several different
fiber optic SPR biosensor configurations have been developedbased on side-polished single-mode fiber (Fig. 2(D)) [23,24],side-polished multimode fiber [25], polarization maintainingfiber [26], and D-shaped fiber [27]. Additionally, the SPW can) waveguide coupling, (C) optical fiber coupling, (D)ge and short-range surface plasmon (LRSP and SRSP).

a c t a
bpatoa
wiwnatttit[
icamutFah[mSFtmha
cpfit1mSaAdbstsrmissl
a n a l y t i c a c h i m i c a
e excited by grating coupling (Fig. 2(E)), which can be massroduced with low lost. In this way, a light wave is incident onmetallic grating. If the momentum of diffracted light parallel
o the grating surface is the same as the propagation constantf the surface plasmon, the light will be coupled into the SPWs described in Eq. (2):
2�
�nd sin � + m
2�
�= ±ˇsp, (2)
here nd is the dielectric medium RI, m an integer represent-ng the diffraction order and � is the grating period. However,
ith the grating coupling, the incident light directly illumi-ates the metal surface, therefore it requires the sample fluidnd microfluidics to be optically transparent. The detection ofhe SPR change induced by the binding of target moleculeso the sensing surface can be accomplished by monitoringhe resonant angle [28], resonant wavelength [29] or resonantntensity change [30]. Recently, several groups also exploredhe detection of the changes in phase [31–33] or polarization34].
The commercialized SPR sensors, as exemplified by thenstrument from Biacore [35], are typically based on prismoupling and have a DL between 1 × 10⁻⁶ to 1 × 10⁻⁷ RIU andmass surface density DL around 1 pg mm−2. An order ofagnitude improvement in DL, i.e., 10−8 RIU, was achieved
sing a bicell photodetector instead of an array of photode-ectors that is commonly employed in an SPR sensor [36].or optical fiber coupled SPR biosensor, typically the DL isround 10−5 to 10−6 RIU [27,37]. A better DL of 5–7 × 10⁻⁷ RIUas been achieved by multiple peak SPR fiber optic sensors
38] and by spectral interrogation in a side-polished single-ode fiber using depolarized light [24]. In waveguide-based
PR biosensors, the DL is usually from 10−5 to 10−6 RIU [29,39].or the grating coupling configuration, the DL ranges from 10−5
o 10−6 RIU [40,41]. Besides the optical structures, detectionethods also influence the detection limit. Phase detection
as the best DL over other detection methods and it is typicallybout 10−7 RIU [33,42].
Although these basic SPR structures have good DL thatan satisfy most research requirements, there still exist twootential problems that will limit their applications in someelds. First, the evanescent field in those basic SPR struc-ures only penetrates into the surrounding medium for about00 nm, and thus it is very difficult to detect the large targetolecules like cells and bacteria. Second, there is only one
PW to detect the RI change. It is impossible to differenti-te the surface RI change and the bulk solution RI change.s a result, the sensing performance is deteriorated whenetecting the target molecules in a complex solution, such aslood samples. To overcome those two problems, a new opticaltructure has been developed, as illustrated in Fig. 2(F), wherehe metal layer is sandwiched by two dielectric layers with aimilar RI [43–47]. Two new surface plasmon modes called longange surface plasmon (LRSP) and short range surface plas-
on (SRSP) form, which are bound to both metal–dielectric
nterfaces. Using this dual mode of the LRSP and SRSP, theensor is able to differentiate the background RI change andurface bound RI change [46]. Furthermore, the LRSP has aonger penetration length in the surrounding medium, mak-6 2 0 ( 2 0 0 8 ) 8–26 13
ing it suitable for cell and bacterium detection. The LRSP alsoexhibits an excellent DL as low as 2 × 10⁻⁷ to 2 × 10⁻⁸ RIU[43,45].
There are many ultra sensitive SPR biosensors but most ofthem only can detect one analyte. For practical applications,there is an urgent need for the development of SPR biosen-sors capable of multi-analyte detection. SPR sensors based onmulti-channel structures [48,49] could provide a method fordetecting multiple analytes simultaneously, but they are notsuitable for high throughput detection. The SPR imaging (SPRI)technique is so far the most promising tool for high through-put detection with a DL of approximately 10−5 RIU [50–53].The typical SPRI sensor is based on prism coupling, in whichmonochromatic incident light is expanded, passes through aprism and strikes the interface of the thin film and a prismat the coupling angle, exciting a broad area of the sensingsurface. The reflected light is imaged on a CCD camera. Simi-lar to the micro-array technique, in SPRI the sensing chip isdivided into many small sensing spots for detecting differ-ent analytes. A few other measurement methodologies werealso developed for SPRI, such as dual wavelength SPRI sys-tem [54] and polarization contrast imaging [55] with DLs of2 × 10−6 RIU, respectively. Recently, 5 × 10⁻⁷ RIU was achievedwith a compact SPRI system [56].
In the past few years, SPR and SPRI have been applied inmolecular biology for the detection of proteins with a DL rang-ing from picomolar to nanomolar [56–61], and detection ofDNA molecules [62–65] with the DL as low as 54 fM with aflow injection device [65] and as low as 1.38 fM when aidedby signal amplification through gold nanoparticles [66]. SPRalso provides sensitive and fast detection of cancer biomarkers[67–70] and other biomarkers [71–73] with the DL at ng mL−1
level for medical diagnosis. Additionally, SPR biosensors havebeen used for bacterial detection for environmental monitor-ing, food safety and homeland security with a DL ranging from25 to 106 cfu mL−1 [74–76].
2.2. Interferometer-based biosensors
2.2.1. Mach-Zehnder interferometerThe operation principle of the integrated Mach-Zehnder inter-ferometer (MZI) is illustrated in Fig. 3(A). Coherent, singlefrequency, single polarization light from a laser enters thesingle-mode input waveguide and is split equally at a Y-junction. One branch has a window over the top of it allowingthe evanescent field of that branch to interact with the sam-ple while the reference arm is protected from the sample witha thick cladding layer. The two branches recombine at theoutput, resulting in interference, and a photodetector mea-sures the intensity. Generally, the waveguide structure mustbe single polarization and single mode so that multimodal andcross-polarization interference do not appear at the output. Achange in the RI at the surface of the sensor arm results in anoptical phase change on the sensing arm and a subsequentchange in the light intensity measured at the photodetector,as described by: I(�n ) ∝ cos(�n k L), where �n , k , and
eff eff 0 eff 0L are the RI change, the amplitude of wave vector, and thelength of the sensing region, respectively. Typically, increasingthe length of the sensing window increases the sensing signal.However, note that because of the cosine-dependent intensity

14 a n a l y t i c a c h i m i c a a c t a 6 2 0 ( 2 0 0 8 ) 8–26
ann[90,
Fig. 3 – (A) Mach-Zehnder interferometer sensor. (B) Multi-chinterferometer sensor. Reprinted with permission from refs.
function, the signal change is not easily resolvable near themaximum and minimum of the cosine function. This is onepenalty of using the MZI device as a sensor as compared tosensors that have a linear intensity response.
The first biosensing demonstration using an integrated MZIwas performed by Heideman et al. [77]. The authors created aMZI on a silicon substrate with a Si3N4 waveguide and etchedgratings for input/output coupling. The RI DL was experimen-tally determined to be around 5 × 10⁻⁶ RIU. An antibody forhuman chorionic gonadotropin (hCG) was adsorbed onto onechannel, and hCG was then specifically detected. The experi-mental DL was 50 pM hCG. Nearly at the same time, Ingenhoffet al., used in integrated MZI for the detection of monolayerformations of adsorbed biomolecules [78], and shortly there-after, the same group made incremental improvements byoptimizing the waveguide materials [79].
Waveguide technologies improved in the years that fol-lowed these pioneering demonstrations. Brosinger et al. [80]and Schipper et al. [81] utilized a SiON or Si3N4 waveg-uide with a ribbed structure on a silicon substrate. Themeasured RI DL was around 10−5 RIU, and the authors demon-strated sensitive detection of an IgG molecular monolayer [80].Additionally, this work demonstrated that in principle, thereference arm of the MZI can be used to cancel out com-mon mode noise terms, such as temperature modulations,RI changes, and non-specific adsorption. A fluidic systemwas constructed to allow different surface treatments oneach arm so that the sensing arm was prepared for specificdetection while the reference arm was prepared to cancel non-specific binding. However, it should be noted that becausethe surfaces of the sensing and reference arms are biologi-cally different, it is expected that the non-specific adsorptiononto each surface will be different. A follow-up to this workwas later published by Weisser et al. [82], in which theauthors claim detection of 1% of a streptavidin monolayeron the sensing surface using the same MZI design and abiotin biorecognition layer. This translates to a protein DLof 20 pg mm−2.
A number of engineering enhancements for integrated MZIsensors were incorporated in the work by Heideman and Lam-beck [83]. As the authors demonstrated, applying a properlydesigned constant ac signal to the phase modulator revealsthe quadrature points of the MZI’s sinusoidal output inten-
sity response through a simple demodulation circuit. Recallthat one drawback of the MZI structure is that the sinusoidal-based response results in a sensitivity loss at the maxima andminima of the cosine term. However, the quadrature pointsel Young’s interferometer sensor. (C) Hartman95].
move continuously linearly during a sensing event, and thustracking the quadrature points instead of the output intensityeliminates the problem of decreasing sensitivity at the maxi-mum and minimum of the MZI sinusoidal response. With thisand other engineering improvements, the authors showed a RIDL of 10−7 RIU. Despite the excellent bulk RI detection capa-bility, to date, no actual biosensing has been demonstratedyet.
Another important design improvement is to enable largerwaveguide core dimensions without sacrificing the single-mode behavior or the sensitivity. The previously discussedwaveguide core dimensions are on the order of 100 nm,which causes high loss at the input coupling interface.One well-studied waveguide architecture that can achievesingle-mode behavior with micrometer dimensions is theantiresonant reflective optical waveguide (ARROW). Further-more, this structure uses a reflective cladding of alternatinglayers of high and low refractive indices to push more lightabove the surface of the waveguide, and thus the sensitivityis not sacrificed with the larger dimensions. The ARROW wasfirst proposed in an integrated MZI by Jimenez et al. [84], andwas later implemented for biosensing by the same group [85].Also, a unique ARROW-based MZI structure has been proposedby Hsu and Huang that utilizes a vertically stacked dual-corewaveguide structure [86].
Further advancements to the integrated MZI functional-ity have been incorporated by Blanco et al. [87]. In this work,integrated MZI devices were fabricated on a wafer. Then, amicrofluidic network was constructed on top of the waferusing CMOS compatible multilevel polymer assembly technol-ogy. This network effectively interfaces with external tubingand precisely delivers the sample to the sensing area. Whilethis was the first demonstration of the integration of microflu-idics onto the wafer, it is expected that this is ultimatelyrequired for the effective development of waveguide-basedinterferometry biosensors.
2.2.2. Young’s interferometerIn parallel to the development of integrated MZI sensors,another interferometric technique based on an integratedYoung’s interferometer (YI) has been used in a similar way forbiosensing. In a YI, the coherent, single mode, single polar-ization light at the input is split into a reference arm and a
sensing arm. Instead of recombining the arms as in the MZI,the optical output of the two arms combines to form interfer-ence fringes on a detector screen, such as a CCD. The spatialintensity distribution, I(x), along the detector screen, x, is given
a c t a
b
I
wrdYtpq[
duDmambibbaEisetamwtwpaiob
iutsomop
2Abti[uoad
a n a l y t i c a c h i m i c a
y [88]:
(x) = 1 + cos(
2�nd
�0fx − ı
), (3)
here �0 is the wavelength in vacuum, n the effective RI, ı
epresents a phase shift due to a RI change, and d and f are theistance between the two arms and the distance between theI output and the screen, respectively. The equation shows
hat a phase change on the reference arm causes a shift in theosition of the interference fringes, which can be analyzeduickly with a fast Fourier transform of the spatial intensity
88].The first demonstration of an integrated YI for sensing was
emonstrated by Brandenburg and Henninger [88]. A follow-p to this work using the same design concept yielded a RIL of 10−7 RIU [89]. This is equivalent to the highest perfor-ance from the MZI, as expected, as the sensing mechanisms
re equivalent in the two interferometer designs. An enhance-ent to the basic design of the integrated YI was proposed
y Ymeti et al. a few years later to enable multiplexed sens-ng [90]. As shown in Fig. 3(B), the design uses four waveguideranches, three for sensing and one for reference. The spacingetween each sensing arm and the reference arm is uniquend does not share any harmonics. It can be deduced fromq. (3) that the frequency of the sinusoidal spatial intensitys dependent upon the spacing between the reference andensing channel, and thus three unique spatial frequenciesxist that can be resolved with Fourier analysis [90]. Withinhis work, the authors also optimized the design geometrynd the signal processing techniques in an effort to mini-ize phase noise and inter-channel cross-talk. Ultimately, itas concluded that the RI DL of this device is slightly better
han 10−7 RIU. These authors later demonstrated biosensingith this YI chip design [91]. Specific detection of herpes sim-lex virus type 1 (HSV-1) was performed using an anti-HSV-1ntibody immobilized on the interferometer surface, show-ng that 105 particles mL−1 in serum could be detected withinnly 30 min and that a DL of 103 particles mL−1 in phosphateuffered saline could be achieved.
A commercial product is currently available based on thentegrated YI technique from Fairfield Scientific [92]. The prod-ct, called AnaLight®, uses a polarization controller so thathe two polarizations of light can sequentially probe theample. This additional information enables the simultane-us measurement of analyte deposition quantification and RIeasurement. Experimental demonstrations of the analysis
f biotin/streptavidin binding utilizing the AnaLight have beenublished [93,94].
.2.3. Hartman interferometerthird and very similar interferometry configuration that has
een used for biosensing is the Hartman interferometer (HI). Inhis configuration, functionalization molecules are patternedn strips on top of a planar waveguide, as shown in Fig. 3(C)95]. Light is coupled into and out of the planar waveguide
sing gratings. Integrated optics is placed near the outputf the chip to create interference between pairs of function-lized strips. In the first biosensing demonstration with theevice, human chorionic gonadotropin (hCG) was detected6 2 0 ( 2 0 0 8 ) 8–26 15
down to concentrations of 5 ng mL−1 [95]. Also, detection downto 4 ng mL−1 of a 44-base-pair oligonucleotide with a 19-base-pair target sequence was demonstrated. The authors furtherdemonstrated detection of Influenza A and Salmonella. Infollow-up work, the authors performed detection of hCG, firstin serum [96], and then in whole blood [97]. To reduce thenon-specific adsorption signal, the authors used the refer-ence channel for subtraction (an antibody that is not specificto hCG was immobilized onto the reference arm) and usingbiotin-(poly)ethylene glycol (PEG) as a blocking agent. Also,the authors were able to demonstrate detection of 0.1 ng mL−1
by using an amplification method. After the sample was run,antibodies targeting hCG labeled with metal nanoparticleswere allowed to bind with the captured hCG [96,97]. Thiscaused an additional phase shift at the output that is largerthan the phase shift due to the hCG molecules alone.
2.2.4. Backscattering interferometryAlthough the three interferometry techniques described thusfar have differences in their design, the principle of detectionis quite the same. A guided wave undergoes a phase change asits evanescent field interacts with the sample. Thus, all threedesigns ultimately have similar performance, as well as sim-ilar design constraints. Most notably, to produce a sensitivedevice, a long interaction length between guided wave andsample is necessary. As a result, the size of these interfero-metric structures is often measured in centimeters.
A separate class of interferometry-based biosensors existcalled backscattering interferometry (BI). Some (but not all)BI implementations have achieved comparable performanceas the previously described interferometry techniques whileusing a much smaller sensing area. Typically, a BI system con-sists of a coherent single wavelength laser focused onto asmall sensing area and a detector to analyze the reflectedintensity. Sub-wavelength structures on the sensing surfaceresult in interference at the detector. Capture of proteins ontoa selected part of the illuminated structure change the inten-sity on the detector due to a phase change of the reflectionfrom this surface. This produces a sensing transduction signal.
This technique was used by Lin et al., who demonstratedone of the first implementations of this concept using a poroussilicon sensor surface [98]. The top and bottom surfaces of theporous sensor serve as the reflecting surfaces. When analytesare specifically captured by biorecognition molecules immo-bilized inside the pores, a shift in the interference signal isobserved. The authors show detection of 2 pM target DNAusing this sensor.
A second use of the BI technique is the biological compactdisk (BioCD) immunoassay [99,100]. In this work, a reflectivedisk is patterned with biorecognition molecules, such as anti-bodies. The disk is then “read” by spinning it while a focusedlaser beam reflects off the disk surface and the antibody spots.The edges of the biomolecular spots result in an interferencesignal. The disk is then incubated with the sample. If thebiorecognition spots capture proteins, the interference signalchanges when the disk is read again after drying. The authors
have demonstrated detection of 100 pg mL−1 of protein [100].This technique may provide the capability for ultra-fast read-out of thousands of sensors on the CD. The BioCD has beencommercialized by QuadraSpec [101].
16 a n a l y t i c a c h i m i c a a c t a 6 2 0 ( 2 0 0 8 ) 8–26
riou
Fig. 4 – Comparison of vaIn a related technique, Chang et al. performed BI detectionby patterning a reflective surface with strips of biorecognitionmolecules in a grating array which then capture polystyrenebeads coated with the ligand [102]. In this work, the authorscreated strips of biotinylated BSA and then incubated the sen-sor surface in a solution with streptavidin coated beads. Theresulting interference signal has the potential to provide aquantitative biological assay. The use of beads may serve asan excellent amplification mechanism.
In another use of backscattering interferometry, Markov etal. utilized the interference fringe pattern obtained from illu-minating a simple, rectangular microfluidic channel from thetop with a laser [103]. The walls of the microfluidic channel canbe patterned with biorecognition molecules and then used tocapture analytes from the sample. The authors showed thatas target analytes were captured by the channel, the interfer-ence signal measured by an avalanche photodiode produceda sensing signal. As a biodetection example, the binding ofIgG molecules by immobilized Protein A was demonstrated.Importantly, this design enables simple microfluidics withsmall sample volume. This group also demonstrated simi-lar biosensing results using a capillary microfluidic channel[104]. This system had previously been shown to have a RIDL of 10−9 RIU when used in a dual capillary configurationwith a reference channel [105]. Later, returning to the rectan-gular microfluidic channel concept, this group demonstratedthe use of BI for detection of biomolecular interactions in freesolution, as opposed to surface-based interactions only [106].While the picomolar DL is similar to other surface-sensingtechniques, this is the first known report of label-free detec-tion of biomolecular interactions in free solution.
2.3. Optical waveguide based biosensors
In the previous section, we have discussed interferometer-based biosensors, some of which employ waveguide struc-tures as the sensing element. In this section, we will introducea few new waveguide structures that have unique designs
and distinctive characteristics in comparison with the con-ventional waveguides.The resonant mirror (RM) design has been used as a biosen-sor sensor for over a decade [107–112]. In a resonant mirror,
s waveguide structures.
the mode is leaky at the waveguide-substrate boundary, incontrast to a conventional waveguide in which total internalreflection occurs at both waveguide-solution and waveguide-substrate boundaries. Fig. 4(B) shows the structure of the RM,where the high RI waveguide and the high RI substrate (orprism) are separated by a metal layer or a low loss and lowRI dielectric layer. When the incident light is at the resonantangle, the light can be coupled strongly into the high-indexwaveguide layer and has a strong reflection at the output sideof the RM. This resonant light travels along in the waveg-uide and has the evanescent field outside the waveguide. As aresult, the resonant angle is sensitive to the RI change near thewaveguide, which can be detected at the output side of the RM.Note that, unlike SPR, which operates only at the TM mode, RMsupports both TE and TM modes, which have different reso-nant angles [107]. The RM-based biosensor is commercializedby NeoSensors with a DL on the order of 0.1 pg mm−2 [113].
Metal clad waveguide (MCWG) or metal clad leaky waveg-uide (MCLW) is another optical structure that involves a metallayer [114–121]. The structure of the MCWG is schematicallyshown in Fig. 4(C). Note that in the MCWG, the light is guidedin a low RI layer and the metal layer works as a spacer to sep-arate the low RI waveguide and the high RI substrate, and topush more light into the solution layer to increase the light-matter interaction and hence the sensitivity. There are twotypes of MCWGs, dip type and peak type [118]. When the imag-inary part of the metal dielectric constant is small and themetal thickness is on the order of tens of nanometers, theMCWG is operated as a dip type, in which the reflection fea-tures a characteristic resonant dip. On the other hand, whenthe imaginary part of metal dielectric constant is high and themetal thickness is thin (only a few nanometers), the MCWG isoperated as a peak type and a characteristic peak emerges inthe reflection. Both the dip and peak can be used as a sensingsignal in which the response is an angular shift due to changesof the RI of the solution layer. Although both dip and peaktypes of the MCWG have a lower sensitivity than SPR, theyhave a much narrower dip or peak, making them a competitive
sensing technology to SPR [118].The MCWG has much longer penetration depth than RM,SPR, and regular waveguide [115]. A comparison between RMand the MCWG shows the MCWG is three times more sensitive
a c t a
tfMaowfsai
miatwttaFiRltwib
i(e
F(p
a n a l y t i c a c h i m i c a
o the bulk RI change in the solution, indicating a much largerraction of light in the evanescent field [116,120]. Therefore, the
CWG is very suitable for detection of cells that are typicallyfew microns in size [115,116,119,121]. Non-specific detectionf cells has been carried out on both dip and peak type MCWGith a DL of 8–9 cells mm−2 [121]. A DL of 8 × 10⁴ spores mL−1
or Bacillus subtilis var. niger bacterial spores was also demon-trated in a peak-type waveguide sensor [119]. Lipid bilayernd interactions between protein and a lipid bilayer were stud-ed with the dip type MCWG [114].
Reverse symmetry waveguides bear the similar designotivation, which is to push more light into solution to
ncrease the light interaction with large biomolecules, suchs cells [122–125]. In the conventional waveguide geometry,he lower cladding layer has a RI higher than that of solution,hich usually consists of water and has a RI of 1.33. Therefore,
he waveguide mode has a light intensity more concentratedoward the lower cladding layer, thus leaving less light to inter-ct with the analytes near to sensing surface. As shown inig. 4(D), in a reverse symmetry waveguide, nanoporous sil-ca is used as a lower cladding layer. Nanoporous silica has aI of 1.193, much lower than that of water. As a result, more
ight can be concentrated near the sensing surface to enhancehe sensor sensitivity. Non-specific detection of Escherichia colias demonstrated with reverse symmetry waveguides. The DL
s estimated to be 60 cells mm−2 [123], a few hundreds timesetter than that in the RM [108].
Recently, a symmetrical metal-clad waveguide was alsonvestigated theoretically and experimentally [126–129]Fig. 4(E)). It is shown that ultrahigh-order modes can bexcited through free space coupling. Those modes are sen-
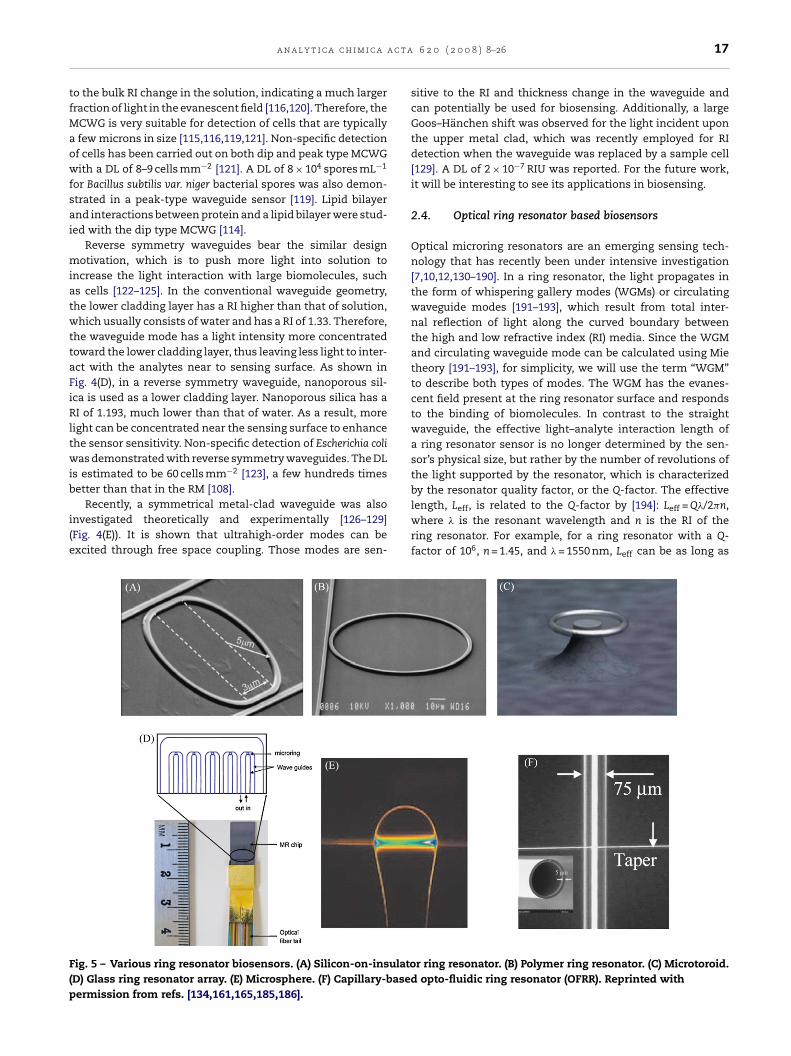
ig. 5 – Various ring resonator biosensors. (A) Silicon-on-insulatoD) Glass ring resonator array. (E) Microsphere. (F) Capillary-basedermission from refs. [134,161,165,185,186].
6 2 0 ( 2 0 0 8 ) 8–26 17
sitive to the RI and thickness change in the waveguide andcan potentially be used for biosensing. Additionally, a largeGoos–Hanchen shift was observed for the light incident uponthe upper metal clad, which was recently employed for RIdetection when the waveguide was replaced by a sample cell[129]. A DL of 2 × 10⁻⁷ RIU was reported. For the future work,it will be interesting to see its applications in biosensing.
2.4. Optical ring resonator based biosensors
Optical microring resonators are an emerging sensing tech-nology that has recently been under intensive investigation[7,10,12,130–190]. In a ring resonator, the light propagates inthe form of whispering gallery modes (WGMs) or circulatingwaveguide modes [191–193], which result from total inter-nal reflection of light along the curved boundary betweenthe high and low refractive index (RI) media. Since the WGMand circulating waveguide mode can be calculated using Mietheory [191–193], for simplicity, we will use the term “WGM”to describe both types of modes. The WGM has the evanes-cent field present at the ring resonator surface and respondsto the binding of biomolecules. In contrast to the straightwaveguide, the effective light–analyte interaction length ofa ring resonator sensor is no longer determined by the sen-sor’s physical size, but rather by the number of revolutions ofthe light supported by the resonator, which is characterizedby the resonator quality factor, or the Q-factor. The effective
length, Leff, is related to the Q-factor by [194]: Leff = Q�/2�n,where � is the resonant wavelength and n is the RI of thering resonator. For example, for a ring resonator with a Q-factor of 106, n = 1.45, and � = 1550 nm, Leff can be as long asr ring resonator. (B) Polymer ring resonator. (C) Microtoroid.opto-fluidic ring resonator (OFRR). Reprinted with

a c t
18 a n a l y t i c a c h i m i c a17 cm. Consequently, despite its small physical size, a ring res-onator can deliver sensing performance similar or superiorto a waveguide while using orders of magnitude less surfacearea and sample volume. Furthermore, due to the small sizeof ring resonators, high density sensor integration becomespossible.
The WGM spectral position, i.e., resonant wavelength, �,is related to the RI through the resonant condition [191]:� = 2�rneff/m, where r is the ring outer radius, neff the effectiveRI experienced by the WGM, and m is an integer. neff changeswhen the RI near the ring resonator surface is modified due tothe capture of target molecules on the surface, which in turnleads to a shift in the WGM spectral position. Thus, by directlyor indirectly monitoring the WGM spectral shift, it is possibleto obtain both quantitative and kinetic information about thebinding of molecules near the surface.
Ring resonators biosensors have so far been implementedin three major configurations (see Fig. 5): (1) microfabri-cated ring-, disk-, or microtoroid-shaped resonators on a chip(Fig. 5(A)–(D)) [12,165–168,171–173,175–181,183–186,189,190];(2) stand-alone dielectric microspheres [130–147,149,151,154,169,174,182] (Fig. 5(E)); and (3) capillary-based opto-fluidic ringresonators (OFRR) (Fig. 5(F)) [7,10,148,150,152–164,170,187].The advantages of the chip-based ring resonator includepotential of mass production and optoelectronic integrationcapabilities. However, except for a microtoroid, which has Q-factors larger than 108 after it undergoes thermal reflow tosmoothen the resonator surface, they usually have relativelylow Q-factors (typically 104 in water) due mainly to surfaceroughness [168,171,185]. Moreover, the fluidics needs to be fab-ricated separately and then mounted onto the ring resonatorsensors through multiple complicated steps [185,195], whichmay present many design challenges. In contrast, microspherering resonators possess much higher Q-factors (>106) owing tothe geometry and the extremely low surface roughness [194].Microspheres of a few tens to a few hundred micrometers indiameter can easily be made by heating the end of an opticalfiber by either an acetylene/hydrogen–oxygen torch or a CO2
laser. However, the major disadvantage of microsphere ringresonators is lack of mass production capability and difficul-ties in integration with fluidics, which requires a design of anexternal structure of channels and chambers [143]. The thirddesign, the OFRR, has been recently introduced; it is based on athin-walled capillary with a diameter of 50–200 �m and a wallthickness of a few micrometers [148,153] and can be made bypulling a glass preform under heat [148]. The OFRR can sup-port high Q-factor (∼106) WGMs in its circular cross-sectionthat have the evanescent field inside the core to interact withthe analytes flowing through the capillary, thus achieving dualuse of the capillary as the sensor and the microfluidic channel.
2.4.1. Chip-based ring resonator sensorsTheoretically, in the limit of shot noise, the DL for RI is esti-mated to be on the order of 10−9 RIU [177]. However, theexperimental results are still a few orders of magnitude awayfrom it. A bulk RI sensitivity of 140 nm RIU−1 was achieved with
a glass-based ring resonator of 60 �m in radius with Q ∼ 12,000[171]. The DL was calculated to be 1.8 × 10⁻⁵ RIU [171]. Simi-larly, the DL of a polymer ring of 45 �m in radius with Q = 20,000was estimated to be 5 × 10⁻⁵ RIU [168]. However, a better DLa 6 2 0 ( 2 0 0 8 ) 8–26
of 10−7 RIU was achieved in the same system by monitoringthe intensity variation [168]. The DL for protein molecules isestimated to be 250 pg mm−2 [168].
In another work, a silicon-on-insulator (SOI) ring resonatoron an area below 100 �m2 showed capability of detectingbulk RI change at a sensitivity of 70 nm RIU−1 with a DL of7 × 10−5 RIU [185]. A DL of 10 ng mL−1 of avidin was reportedon this device, which corresponds to only 1 fg molecular masson the sensor due to the small size of the resonator [185]. Simi-lar DL (0.1 nM, 6.8 ng mL−1 for avidin) was also achieved with a2-mm diameter SixNy/SiO2 ring resonator [173]. DNA and bac-teria detection were also demonstrated with the DL for E. coliof 105 cfu mL−1 [186].
Recently, the slot-waveguide based ring resonator wasdeveloped, which has a larger light–analyte interaction andhence a higher sensitivity, as more light is present in the slotthrough which biomolecules flow [189,190]. A slot-waveguidering resonator showed a RI sensitivity of over 200 nm RIU−1
and a DL of 2 × 10⁻⁴ RIU [189], and an estimated protein DL ofapproximately 20 pg mm−2 [190].
2.4.2. Stand-alone microsphere based ring resonatorsensorsWhile microsphere-based ring resonators have a lower RIsensitivity (20–50 nm RIU−1) due to their relatively large size(∼100 �m in diameter) [144], they benefit from a better spec-tral resolution resulting from much higher Q-factors (>106)[131,134,144]. As a consequence, the DL on the order of10−7 RIU can be achieved by directly monitoring the WGMspectral shift [144].
Streptavidin detection has been performed with micro-spheres. Binding stoichiometry of 1:1 between biotin-BSA andstreptavidin was estimated from the magnitude of the WGMshift. Due to high Q-factors, small molecule (∼50 Da) detectionwas predicted and experimentally demonstrated [131,146].Additionally, protease (such as trypsin) and thrombin detec-tion were also carried out with microsphere sensors [145,151].DNA detection with microspheres was first demonstrated byVollmer et al. [134] with a DL of 1 pg mm−2. The authors fur-ther showed the detection of single nucleotide polymorphisms(SNP) using two microspheres. As the ring resonator sup-ports multiple resonant wavelengths and both TE and TMmodes, two wavelengths were used in a microsphere sensor toindependently determine both the thickness and the opticaldielectric constant [136]. Furthermore, simultaneous use of TEand TM modes was employed to determine the orientation ofbiomolecules on the surface [142].
A comprehensive work on viral detection with a micro-sphere sensor that includes theoretical discussion as well asexperimental results was published recently [143]. It predictsthat the microsphere is capable of detecting virions down toa single particle. Experimental demonstration was performedwith MS2 at a concentration of 109 pfu mL−1. A DL for surfacedensity of 2 pg mm−2 was deduced.
Capabilities of microspheres of detecting larger bioparti-
cles, like bacteria, were theoretically studied and experimen-tally demonstrated through simple adsorption [140,141]. TheDL was estimated to be ∼1.2 × 102 mm−2 E. coli, which corre-sponds to ∼44 bacteria bound to the sphere. With the average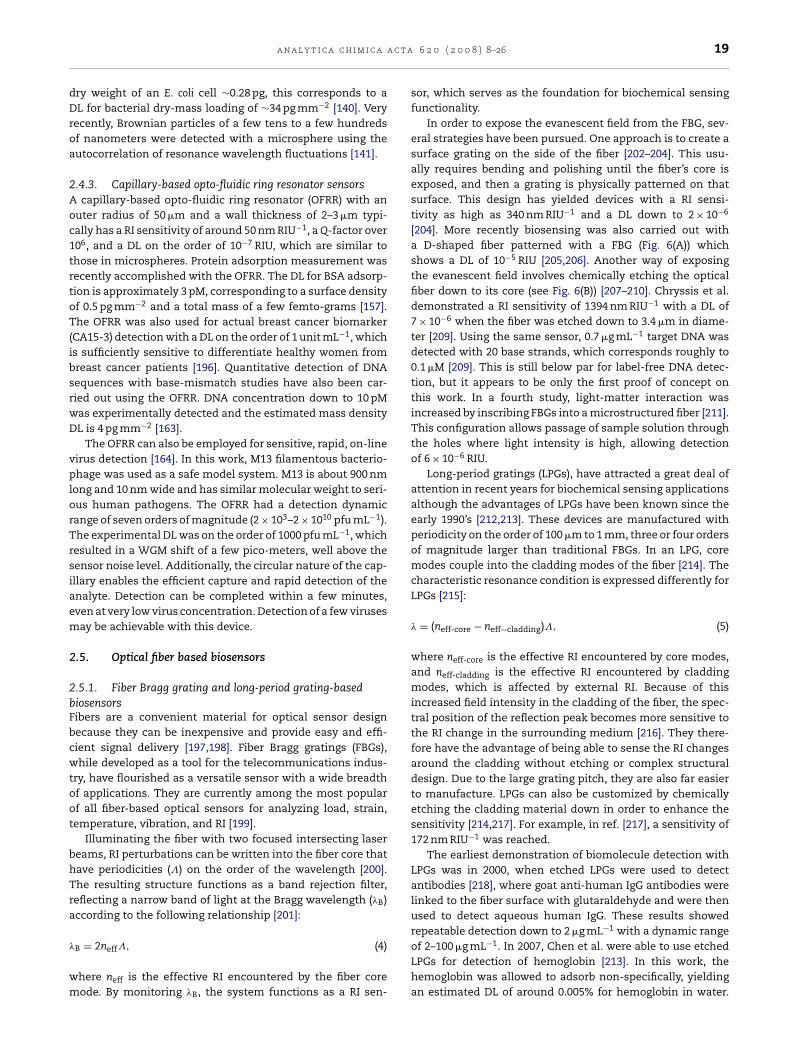
a c t a
dDroa
2Aoc1trtoT(ibsrwD
vplorTrsiaem
2
2bFbcwtoot
bhTra
�
wm
a n a l y t i c a c h i m i c a
ry weight of an E. coli cell ∼0.28 pg, this corresponds to aL for bacterial dry-mass loading of ∼34 pg mm−2 [140]. Very
ecently, Brownian particles of a few tens to a few hundredsf nanometers were detected with a microsphere using theutocorrelation of resonance wavelength fluctuations [141].
.4.3. Capillary-based opto-fluidic ring resonator sensorscapillary-based opto-fluidic ring resonator (OFRR) with an
uter radius of 50 �m and a wall thickness of 2–3 �m typi-ally has a RI sensitivity of around 50 nm RIU−1, a Q-factor over06, and a DL on the order of 10−7 RIU, which are similar tohose in microspheres. Protein adsorption measurement wasecently accomplished with the OFRR. The DL for BSA adsorp-ion is approximately 3 pM, corresponding to a surface densityf 0.5 pg mm−2 and a total mass of a few femto-grams [157].he OFRR was also used for actual breast cancer biomarker
CA15-3) detection with a DL on the order of 1 unit mL−1, whichs sufficiently sensitive to differentiate healthy women fromreast cancer patients [196]. Quantitative detection of DNAequences with base-mismatch studies have also been car-ied out using the OFRR. DNA concentration down to 10 pMas experimentally detected and the estimated mass densityL is 4 pg mm−2 [163].
The OFRR can also be employed for sensitive, rapid, on-lineirus detection [164]. In this work, M13 filamentous bacterio-hage was used as a safe model system. M13 is about 900 nm
ong and 10 nm wide and has similar molecular weight to seri-us human pathogens. The OFRR had a detection dynamicange of seven orders of magnitude (2 × 10³–2 × 10¹⁰ pfu mL−1).he experimental DL was on the order of 1000 pfu mL−1, whichesulted in a WGM shift of a few pico-meters, well above theensor noise level. Additionally, the circular nature of the cap-llary enables the efficient capture and rapid detection of thenalyte. Detection can be completed within a few minutes,ven at very low virus concentration. Detection of a few virusesay be achievable with this device.
.5. Optical fiber based biosensors
.5.1. Fiber Bragg grating and long-period grating-basediosensorsibers are a convenient material for optical sensor designecause they can be inexpensive and provide easy and effi-ient signal delivery [197,198]. Fiber Bragg gratings (FBGs),hile developed as a tool for the telecommunications indus-
ry, have flourished as a versatile sensor with a wide breadthf applications. They are currently among the most popularf all fiber-based optical sensors for analyzing load, strain,emperature, vibration, and RI [199].
Illuminating the fiber with two focused intersecting lasereams, RI perturbations can be written into the fiber core thatave periodicities (�) on the order of the wavelength [200].he resulting structure functions as a band rejection filter,eflecting a narrow band of light at the Bragg wavelength (�B)ccording to the following relationship [201]:
B = 2neff�, (4)
here neff is the effective RI encountered by the fiber coreode. By monitoring �B, the system functions as a RI sen-
6 2 0 ( 2 0 0 8 ) 8–26 19
sor, which serves as the foundation for biochemical sensingfunctionality.
In order to expose the evanescent field from the FBG, sev-eral strategies have been pursued. One approach is to create asurface grating on the side of the fiber [202–204]. This usu-ally requires bending and polishing until the fiber’s core isexposed, and then a grating is physically patterned on thatsurface. This design has yielded devices with a RI sensi-tivity as high as 340 nm RIU−1 and a DL down to 2 × 10⁻⁶
[204]. More recently biosensing was also carried out witha D-shaped fiber patterned with a FBG (Fig. 6(A)) whichshows a DL of 10−5 RIU [205,206]. Another way of exposingthe evanescent field involves chemically etching the opticalfiber down to its core (see Fig. 6(B)) [207–210]. Chryssis et al.demonstrated a RI sensitivity of 1394 nm RIU−1 with a DL of7 × 10−6 when the fiber was etched down to 3.4 �m in diame-ter [209]. Using the same sensor, 0.7 �g mL−1 target DNA wasdetected with 20 base strands, which corresponds roughly to0.1 �M [209]. This is still below par for label-free DNA detec-tion, but it appears to be only the first proof of concept onthis work. In a fourth study, light-matter interaction wasincreased by inscribing FBGs into a microstructured fiber [211].This configuration allows passage of sample solution throughthe holes where light intensity is high, allowing detectionof 6 × 10⁻⁶ RIU.
Long-period gratings (LPGs), have attracted a great deal ofattention in recent years for biochemical sensing applicationsalthough the advantages of LPGs have been known since theearly 1990’s [212,213]. These devices are manufactured withperiodicity on the order of 100 �m to 1 mm, three or four ordersof magnitude larger than traditional FBGs. In an LPG, coremodes couple into the cladding modes of the fiber [214]. Thecharacteristic resonance condition is expressed differently forLPGs [215]:
� = (neff-core − neff−cladding)�, (5)
where neff-core is the effective RI encountered by core modes,and neff-cladding is the effective RI encountered by claddingmodes, which is affected by external RI. Because of thisincreased field intensity in the cladding of the fiber, the spec-tral position of the reflection peak becomes more sensitive tothe RI change in the surrounding medium [216]. They there-fore have the advantage of being able to sense the RI changesaround the cladding without etching or complex structuraldesign. Due to the large grating pitch, they are also far easierto manufacture. LPGs can also be customized by chemicallyetching the cladding material down in order to enhance thesensitivity [214,217]. For example, in ref. [217], a sensitivity of172 nm RIU−1 was reached.
The earliest demonstration of biomolecule detection withLPGs was in 2000, when etched LPGs were used to detectantibodies [218], where goat anti-human IgG antibodies werelinked to the fiber surface with glutaraldehyde and were thenused to detect aqueous human IgG. These results showedrepeatable detection down to 2 �g mL−1 with a dynamic range
of 2–100 �g mL−1. In 2007, Chen et al. were able to use etchedLPGs for detection of hemoglobin [213]. In this work, thehemoglobin was allowed to adsorb non-specifically, yieldingan estimated DL of around 0.005% for hemoglobin in water.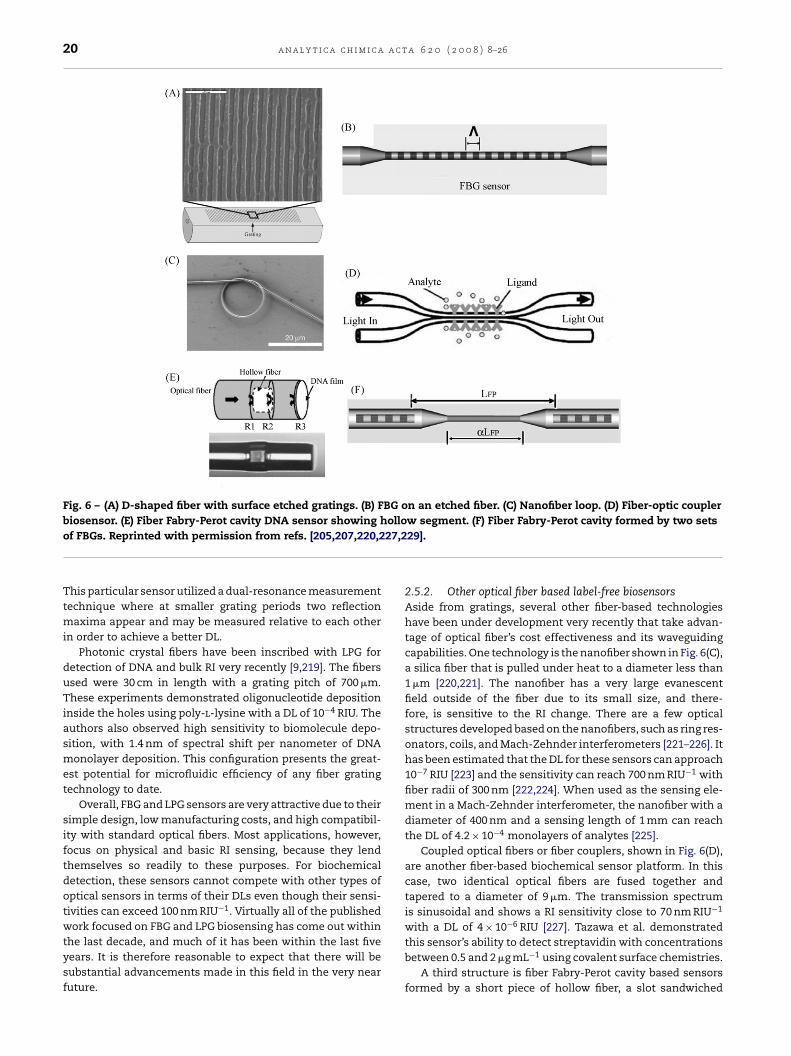
20 a n a l y t i c a c h i m i c a a c t a 6 2 0 ( 2 0 0 8 ) 8–26
Fig. 6 – (A) D-shaped fiber with surface etched gratings. (B) FBG on an etched fiber. (C) Nanofiber loop. (D) Fiber-optic couplerbiosensor. (E) Fiber Fabry-Perot cavity DNA sensor showing hollow segment. (F) Fiber Fabry-Perot cavity formed by two sets
27,2
of FBGs. Reprinted with permission from refs. [205,207,220,2This particular sensor utilized a dual-resonance measurementtechnique where at smaller grating periods two reflectionmaxima appear and may be measured relative to each otherin order to achieve a better DL.
Photonic crystal fibers have been inscribed with LPG fordetection of DNA and bulk RI very recently [9,219]. The fibersused were 30 cm in length with a grating pitch of 700 �m.These experiments demonstrated oligonucleotide depositioninside the holes using poly-l-lysine with a DL of 10−4 RIU. Theauthors also observed high sensitivity to biomolecule depo-sition, with 1.4 nm of spectral shift per nanometer of DNAmonolayer deposition. This configuration presents the great-est potential for microfluidic efficiency of any fiber gratingtechnology to date.
Overall, FBG and LPG sensors are very attractive due to theirsimple design, low manufacturing costs, and high compatibil-ity with standard optical fibers. Most applications, however,focus on physical and basic RI sensing, because they lendthemselves so readily to these purposes. For biochemicaldetection, these sensors cannot compete with other types ofoptical sensors in terms of their DLs even though their sensi-tivities can exceed 100 nm RIU−1. Virtually all of the publishedwork focused on FBG and LPG biosensing has come out within
the last decade, and much of it has been within the last fiveyears. It is therefore reasonable to expect that there will besubstantial advancements made in this field in the very nearfuture.29].
2.5.2. Other optical fiber based label-free biosensorsAside from gratings, several other fiber-based technologieshave been under development very recently that take advan-tage of optical fiber’s cost effectiveness and its waveguidingcapabilities. One technology is the nanofiber shown in Fig. 6(C),a silica fiber that is pulled under heat to a diameter less than1 �m [220,221]. The nanofiber has a very large evanescentfield outside of the fiber due to its small size, and there-fore, is sensitive to the RI change. There are a few opticalstructures developed based on the nanofibers, such as ring res-onators, coils, and Mach-Zehnder interferometers [221–226]. Ithas been estimated that the DL for these sensors can approach10−7 RIU [223] and the sensitivity can reach 700 nm RIU−1 withfiber radii of 300 nm [222,224]. When used as the sensing ele-ment in a Mach-Zehnder interferometer, the nanofiber with adiameter of 400 nm and a sensing length of 1 mm can reachthe DL of 4.2 × 10⁻⁴ monolayers of analytes [225].
Coupled optical fibers or fiber couplers, shown in Fig. 6(D),are another fiber-based biochemical sensor platform. In thiscase, two identical optical fibers are fused together andtapered to a diameter of 9 �m. The transmission spectrumis sinusoidal and shows a RI sensitivity close to 70 nm RIU−1
with a DL of 4 × 10⁻⁶ RIU [227]. Tazawa et al. demonstrated
this sensor’s ability to detect streptavidin with concentrationsbetween 0.5 and 2 �g mL−1 using covalent surface chemistries.A third structure is fiber Fabry-Perot cavity based sensorsformed by a short piece of hollow fiber, a slot sandwiched
a c t a
b[bot1fip2osHs
2
Portfdcotdtmsrt
Fwd
a n a l y t i c a c h i m i c a
etween two pieces of optical fiber, or a pair of FBGs (Fig. 6(E))228–232]. It can also be formed by a piece of tapered fiberetween a pair of FBGs (Fig. 6(F)) [207]. The spectral reflectancef these devices is sensitive to the RI near the fiber tip orhe fiber taper. A RI sensitivity of 71.2 nm RIU−1 and a DL of.4 × 10−5 RIU were demonstrated with a 5 mm long taperedber cavity [207]. This type of a device was also used to detectig/anti-pig IgG with a concentration of 25 �g mL−1 [228] and6-base ∼76 �M oligonucleotide with a total surface massf 1.7 ng [229]. Very recently, a slot fiber Fabry-Perot cavityhowed a RI sensitivity in excess of 1000 nm RIU−1 [231,232].owever, its applications in biosensing have yet to be demon-
trated.
.6. Photonic crystal based sensors
hotonic crystal (PC) biosensors are a novel type of label-freeptical biosensing platform, which has been presented in theecent literature [8,9,219,233–247]. A PC has a periodic dielec-ric structure with a periodicity on the order of a wavelength,rom which forms the photonic bandgap. Therefore, the inci-ent light whose wavelength lies within the photonic bandgapannot propagate through the PC and a wide bandgap emergesn the transmission (or reflection) spectrum. However, a pho-onic “defect” within the bandgap can be introduced by locallyisturbing the PC’s periodic structure, leading to the forma-ion of the defect mode. The light resonant with the defect
ode can propagate in the PC. As a result, on the transmis-ion (or reflection) spectrum, the defect mode appears as aelatively sharp peak within the bandgap. Since spectral posi-ion of the defect mode is highly sensitive to the change in the
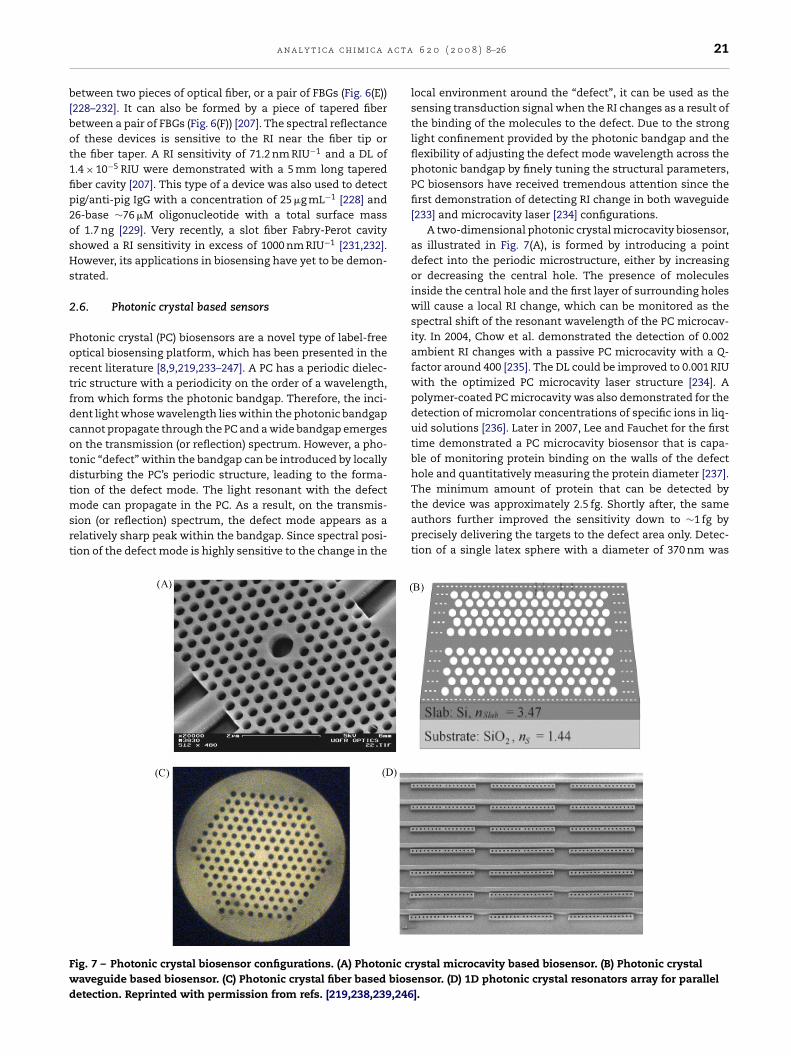
ig. 7 – Photonic crystal biosensor configurations. (A) Photonic craveguide based biosensor. (C) Photonic crystal fiber based biosetection. Reprinted with permission from refs. [219,238,239,246
6 2 0 ( 2 0 0 8 ) 8–26 21
local environment around the “defect”, it can be used as thesensing transduction signal when the RI changes as a result ofthe binding of the molecules to the defect. Due to the stronglight confinement provided by the photonic bandgap and theflexibility of adjusting the defect mode wavelength across thephotonic bandgap by finely tuning the structural parameters,PC biosensors have received tremendous attention since thefirst demonstration of detecting RI change in both waveguide[233] and microcavity laser [234] configurations.
A two-dimensional photonic crystal microcavity biosensor,as illustrated in Fig. 7(A), is formed by introducing a pointdefect into the periodic microstructure, either by increasingor decreasing the central hole. The presence of moleculesinside the central hole and the first layer of surrounding holeswill cause a local RI change, which can be monitored as thespectral shift of the resonant wavelength of the PC microcav-ity. In 2004, Chow et al. demonstrated the detection of 0.002ambient RI changes with a passive PC microcavity with a Q-factor around 400 [235]. The DL could be improved to 0.001 RIUwith the optimized PC microcavity laser structure [234]. Apolymer-coated PC microcavity was also demonstrated for thedetection of micromolar concentrations of specific ions in liq-uid solutions [236]. Later in 2007, Lee and Fauchet for the firsttime demonstrated a PC microcavity biosensor that is capa-ble of monitoring protein binding on the walls of the defecthole and quantitatively measuring the protein diameter [237].The minimum amount of protein that can be detected by
the device was approximately 2.5 fg. Shortly after, the sameauthors further improved the sensitivity down to ∼1 fg byprecisely delivering the targets to the defect area only. Detec-tion of a single latex sphere with a diameter of 370 nm wasystal microcavity based biosensor. (B) Photonic crystalensor. (D) 1D photonic crystal resonators array for parallel].

a c t
22 a n a l y t i c a c h i m i c aachieved [238]. The PC microcavity had a sensing area of∼40 �m2, with an active sensing volume of ∼0.15 �m3.
An optical biosensor based on light propagation through aPC waveguide (Fig. 7(B)) was presented by Skivesen et al. [239],where the cutoff wavelength of the PC waveguide was usedas the indicator for surrounding RI changes. Concentrationsof around 0.15 �M of BSA-solution were measured with excel-lent signal to noise ratio. However, compared to PC microcavitybased biosensors, this PC waveguide biosensor suffers fromrelatively larger sensing area, which requires a larger samplevolume.
A third class of PC biosensor is based on photonic crystalfiber (PCF), which is a fiber optic cable with air holes in thecross-section (Fig. 7(C)). PCF is a promising sensing platformfor two reasons. First, the air holes in the fiber can act as asimple fluidic channel to deliver the biological samples. Sec-ond, the unique light guiding mechanism of photonic crystalfiber ensures a strong light-matter interaction because of thelarge light-sample overlap. The array of air holes may holda sample volume of a few nL per cm of the fiber, which is adesirable advantage for biosensing applications. Rindorf et al.recently demonstrated the detection of biomolecules using along-period grating in a PCF, which has been discussed in theprevious section [9,219].
Cunningham et al. developed a unique type of PC biosen-sors that behaves as a narrowband wavelength reflectancefilter, where the sensor reflects nearly 100% of the incidentlight at the resonant wavelength [240]. The sensor oper-ates by measuring changes in the wavelength of reflectedlight as biochemical or cellular binding events take place onthe surface. The sensor is able to detect a molecular sur-face density of 0.4 pg mm−2 (after solution containing theprotein is dried) [241]. There are a number of advantagesfor this PC sensor structure. First, the sensor has a rela-tively good sensitivity as well as a large dynamic range,which enables it to measure biochemical entities from smallsize, such as biomolecular interactions [242,243] to largesize, such as live cells, cell membranes, virions and bacteria(also protein–cell interactions) [244]. Second, the sensor struc-ture is compatible with standard microtiter plate-based andmicroarray-based infrastructures that are most widely usedfor high throughput biomolecular interaction analysis. Third,the sensor can be measured either in “single point mode”or “imaging mode”, which greatly increases the overall res-olution and throughput of the system. Fourth, the sensorsare inexpensively manufactured on plastic film. This groupalso showed that when the PC sensor is operated in the nearultraviolet wavelength range, the surface-sensitivity to bulk-sensitivity ratio will be enhanced over 4.5 times compared tothe infrared range, which enables enhanced detection reso-lution for biomolecules on the biosensor surface and is veryuseful for small molecule detection or ultralow concentrationdetection [245]. This platform has now been commercializedby SRU Biosystems [248].
Mandal and Erickson recently demonstrated a novel opto-fluidic sensor array based on the use of arrays of 1D photonic
crystal resonators and a single bus waveguide (Fig. 7(D)), whichcan perform highly parallel, label-free detection of biomolecu-lar interactions [246]. The beauty of this structure is that eachPC resonator adjacent to the bus waveguide is independenta 6 2 0 ( 2 0 0 8 ) 8–26
from all others, which greatly enhances the device’s multi-plex detection capability. The simulation results predict thatthe DL is on the order of tens of attograms, and detection of7 × 10−5 RIU was demonstrated experimentally.
In summary, while the development of PC-based label-freebiosensor is still in its initial stage, based on the experimen-tal demonstrations achieved to date, PC structures are a verypromising biosensor platform. In PC biosensors, light can beconcentrated or localized in a very small volume, thus achiev-ing a large light-matter interaction with a volume down tofemtoliters. Parallel detection is also possible. However, fur-ther investigations are still needed to improve the overallperformance, such as surface chemistry, compatible microflu-idics for efficient sample delivery, and detection procedures,such as rinsing to minimize non-specific binding.
3. Outlook
In this article, we have overviewed recent progress in variousoptical biosensor structures for label-free detection. To date,some of them, like SPR, waveguides, and fiber gratings, arerelatively mature and have even been commercialized. Others,such as ring resonators and photonic crystals, although stillin their infancy, possess unique and advantageous propertiesover the state-of-the-art and may have great potential for nextgeneration label-free biosensors.
Eventually, the goals of label-free biosensors are to developportable or hand-held devices that can provide laboratorygrade sensing performance with low cost, low sample vol-ume and total mass, and improved multiplexed detectioncapabilities. Towards this end, we envision that a few lev-els of integration may be needed. The first integration is onthe optical sensor structure itself. For example, nano-fibersdescribed in Section 2.5.2 can be coiled to make a ring res-onator (Section 2.4) or to make an interferometer (Section2.2). FBG or LPG structures (Sections 2.5.1 and 2.5.2) can beinscribed onto a photonic crystal fiber (Section 2.6). Combi-nation or integration of different optical structures onto thesame sensor will leverage the advantages of each individ-ual structure to achieve a better performance. In addition,different detection protocols like fluorescence and Ramanspectroscopy can also be incorporated with the label-freedetection to provide complementary sensing information. Thesecond level of integration is between optical structures andmicrofluidics. Microfluidics has been under investigation forover a decade for lab-on-chip or micro total analysis sys-tems. A particular area called “opto-fluidics” has recentlydrawn tremendous attention, which specifically addresses theissues of how microfluidics interfaces with optical detection[249–251]. A few examples have been given in this review,including opto-fluidic ring resonators (Section 2.4) and pho-tonic crystal based LPG (Section 2.5.1). The last integrationis to incorporate light sources (such as lasers) and detec-tors directly onto the same sensor chip [252,253]. Currently,while miniaturization of sensors is underway, the light sources
and detectors used for those sensors are still bulky. Inte-gration of light sources, sensors, and detectors, as well asthe corresponding on-board or on-chip optical and elec-tronic controls (such as color filters and signal processors)
a c t a
wd
A
TClN
r
a n a l y t i c a c h i m i c a
ill be a critical step towards achieving a truly hand-heldevice.
cknowledgments
he authors gratefully thank the support from Americanhemical Society Petroleum Research Fund (43879-G10), Wal-
ace H. Coulter Early Career Award, NSF (ECCS-0729903), andIH (5K25EB006011-02).
e f e r e n c e s
[1] R. Narayanaswamy, O.S. Wolfbeis, Optical Sensors,Springer, New York, 2004.
[2] W.E. Moerner, Proc. Natl. Acad. Sci. 104 (2007) 12596.[3] W.G. Cox, V.L. Singer, Biotechniques 36 (2004) 114.[4] J.D. Jackson, Classical Electrodynamics, John Wiley & Sons,
Hoboken, NJ, 1999.[5] P.N. Prasad, Introduction to Biophotonics, John Wiley &
Sons, Inc., Hoboken, New Jersey, 2003.[6] T. Vo-Dinh, Biomedical Photonics Handbook, CRC Press,
Boca Raton, Florida, 2003.[7] I.M. White, X. Fan, Opt. Express 16 (2008) 1020.[8] N.A. Mortensen, S. Xiao, J. Pedersen, Microfluid. Nanofluid.
4 (2008) 117.[9] L. Rindorf, O. Bang, Opt. Lett. 33 (2008) 563.
[10] J.D. Suter, I.M. White, H. Zhu, X. Fan, Appl. Opt. 46 (2007)389.
[11] M. Han, A. Wang, Opt. Lett. 32 (2007) 1800.[12] A.M. Armani, R.P. Kulkarni, S.E. Fraser, R.C. Flagan, K.J.
Vahala, Science 317 (2007) 5839.[13] B. Liedberg, C. Nylander, I. Lunstrom, Sens. Actuators 4
(1983) 299.[14] J. Homola, S.S. Yee, G. Gauglitz, Sens. Actuators B Chem. 54
(1999) 3.[15] J. Homola, Anal. Bioanal. Chem. 377 (2003) 528.[16] X.D. Hoa, A.G. Kirk, M. Tabrizian, Biosens. Bioelectron. 23
(2007) 151.[17] J. Homola, Chem. Rev. 108 (2008) 462.[18] K. Matsubara, S. Kawata, S. Minami, Appl. Opt. 27 (1988)
1160.[19] B. Liedberg, I. Lundstrom, E. Stenberg, Sens. Actuators B
Chem. 11 (1993) 63.[20] A.K. Sharma, R. Jha, B.D. Gupta, IEEE Sens. J. 7 (2007) 1118.[21] F. Yu, S. Tian, D. Yao, W. Knoll, Anal. Chem. 76 (2004) 3530.[22] C.J. Alleyne, A.G. Kirk, R.C. McPhedran, N.-A.P. Nicorovici, D.
Maystre, Opt. Express 15 (2007) 8163.[23] R.C. Jorgenson, S.S. Yee, Sens. Actuators B Chem. 12 (1993)
213.[24] R. Slavık, J. Homola, J. Ctyroky, E. Brynda, Sens. Actuators B
Chem. 74 (2001) 106.[25] H.-Y. Lin, W.-H. Tsai, Y.-C. Tsao, B.-C. Sheu, Appl. Opt. 46
(2006) 800.[26] M. Piliarik, J. Homola, Z. Manıkova, J. Ctyroky, Sens.
Actuators B Chem. 90 (2003) 236.[27] M.-H. Chiu, S.-F. Wang, R.-S. Chang, Opt. Lett. 30 (2003) 233.[28] M. Manuel, B. Vidal, R. Lopez, S. Alegret, J.
Alonso-Chamarro, I. Garces, J. Mateo, Sens. Actuators BChem. 11 (1993) 455.
[29] J. Dostalek, J. Ctyroky, J. Homola, E. Brynda, M. Skalsky, P.
Nekvindova, J. Spirkova, J. Skvor, J. Schrofel, Sens.Actuators B Chem. 76 (2001) 8.[30] C. Movet, R.D. Harris, C. Maciag, B.J. Luff, J.S. Wilkinson, J.Piehler, A. Brecht, G. Gauglitz, R. Abuknesha, G. Ismail,Anal. Chim. Acta 338 (1997) 109.
6 2 0 ( 2 0 0 8 ) 8–26 23
[31] C.-M. Wu, M.-C. Pao, Opt. Express 12 (2004) 3509.[32] H.P. Ho, W.C. Law, S.Y. Wu, C. Lin, S.K. Kong, Biosens.
Bioelectron. 20 (2005) 2177.[33] R. Naraoka, K. Kajikawa, Sens. Actuators B Chem. 107
(2005) 952.[34] A.A. Kruchinin, Y.G. Vlasov, Sens. Actuators B Chem. 30
(1996) 77.[35] Website, http://www.biacore.com/lifesciences/index.html.[36] N.J. Tao, S. Boussaad, W.L. Huang, R.A. Arechabaleta, J.
D’Agnese, Rev. Sci. Instrum. 70 (1999) 4656.[37] R. Slavık, J. Homola, J. Ctyroky, Sens. Actuators B Chem. 54
(1999) 74.[38] D. Monzon-Hernandez, J. Villatoro, Sens. Actuators B
Chem. 115 (2006) 227.[39] A. Suzuki, J. Kondoh, Y. Matsui, S. Shiokawa, K. Suzuki,
Sens. Actuators B Chem. 106 (2005) 383.[40] F.C. Chien, C.Y. Lin, J.N. Yih, K.L. Lee, C.W. Chang, P.K. Wei,
C.C. Sun, S.J. Chen, Biosens. Bioelectron. 22 (2007) 2737.[41] J. Dostalek, J. Homola, M. Miler, Sens. Actuators B Chem.
107 (2005) 154.[42] P.I. Nikitin, A.N. Grigorenko, A.A. Beloglazov, M.V. Valeiko,
A.I. Savchuk, O.A. Savchuk, G. Steiner, C. Kuhne, A.Huebner, R. Salzer, Sens. Actuators A 85 (2000) 189.
[43] G.G. Nenninger, P. Tobiska, J. Homola, S.S. Yee, Sens.Actuators B Chem. 74 (2001) 145.
[44] J.T. Hastings, J. Guo, P.D. Keathley, P.B. Kumaresh, Y. Wei, S.Law, L.G. Bachas, Opt. Express 15 (2007) 17661.
[45] R. Slavık, J. Homola, Sens. Actuators B Chem. 123 (2007) 10.[46] J. Guo, P. Keathley, J. Hastings, Opt. Lett. (2008).[47] J.T. Hastings, IEEE Sens. J. 8 (2008) 170.[48] J. Dostalek, H. Vaisocherova, J. Homola, Sens. Actuators B
Chem. 108 (2005) 758.[49] J. Homola, H.B. Lu, G.G. Nenninger, J. Dostalek, S.S. Yee,
Sens. Actuators B Chem. 76 (2001) 403.[50] E.A. Smith, M.G. Erickson, A.T. Ulijasz, B. Weisblum, R.M.
Corn, Langmuir 19 (2003) 1486.[51] E. Fu, T. Chinowsky, J. Foley, J. Weinstein, P. Yager, Rev. Sci.
Instrum. 75 (2004) 2300.[52] A.W. Wark, H.J. Lee, R.M. Corn, Anal. Chem. 77 (2005) 3904.[53] J.S. Shumaker-Parry, C.T. Campbell, Anal. Chem. 76 (2004)
907.[54] A. Zybin, C. Grunwald, V.M. Mirsky, J. Kuhlmann, O.S.
Wolfbeis, K. Niemax, Anal. Chem. 77 (2005) 2393.[55] M. Piliarik, H. Vaisocherova, J. Homola, Biosens.
Bioelectron. 20 (2005) 2104.[56] T.M. Chinowsky, M.S. Grow, K.S. Johnston, K. Nelson, T.
Edwards, E. Fu, P. Yager, Biosens. Bioelectron. 22 (2007) 2208.[57] S. Tombelli, M. Minunni, E. Luzi, M. Mascini,
Bioelectrochemistry 67 (2005) 135.[58] H.J. Lee, D. Nedelkov, R.M. Corn, Anal. Chem. 78 (2006) 6504.[59] W.-C. Kuo, C. Chou, H.-T. Wu, Opt. Lett. 28 (2003) 1329.[60] W.-C. Law, P. Markowicz, K.-T. Yong, I. Roy, A. Baev, S.
Patskovsky, A.V. Kabashin, H.-P. Ho, P.N. Prasad, Biosens.Bioelectron. 23 (2007) 627.
[61] T.M. Chinowsky, J.G. Quinn, D.U. Bartholomew, R. Kaiser, J.L.Elkin, Sens. Actuators B Chem. 91 (2003) 266.
[62] Y.J. Li, J. Xiang, F. Zhou, Plasmonics 2 (2007) 79.[63] L. He, M.D. Musick, S.R. Nicewarner, F.G. Salinas, S.J.
Benkovic, M.J. Natan, C.D. Keating, J. Am. Chem. Soc. 122(2000) 9071.
[64] B.P. Nelson, T.E. Grimsrud, M.R. Liles, R.M. Goodman, R.M.Corn, Anal. Chem. 73 (2001) 1.
[65] F. Song, F. Zhou, J. Wang, N. Tao, J. Lin, R.L. Vellanowth, Y.Morquecho, J.W. Laidman, Nucleic Acids Res. 30 (2002) e72.
[66] X. Yao, X. Li, F. Toledo, C.Z. Lopez, M. Gutova, J. Momand, F.Zhou, Anal. Biochem. 354 (2006) 220.
[67] G.A.J. Besselink, R.P.H. Kooyman, P.J.H.J. van Os, G.H.M.Engbers, R.B.M. Schasfoorta, Anal. Biochem. 333 (2004) 165.
a c t
24 a n a l y t i c a c h i m i c a[68] C. Cao, J.P. Kim, B.W. Kim, H. Chae, H.C. Yoon, S.S. Yang, S.J.Sim, Biosens. Bioelectron. 21 (2006) 2106.
[69] J.W. Chung, R. Bernhardt, J.C. Pyun, Sens. Actuators BChem. 118 (2006) 28.
[70] Y. Teramura, H. Iwata, Anal. Biochem. 365 (2007) 201.[71] J. Wei, Y. Mu, D. Song, X. Fang, X. Liu, L. Bu, H. Zhang, G.
Zhang, J. Ding, W. Wang, Q. Jin, G. Luo, Anal. Biochem. 321(2003) 209.
[72] J.-F. Masson, L. Obando, S. Beaudoin, K. Booksh, Talanta 62(2004) 865.
[73] M. Miyashita, T. Shimada, H. Miyagawa, M. Akamatsu,Anal. Bioanal. Chem. 381 (2005) 667.
[74] A.D. Taylor, Q. Yu, S. Chen, J. Homola, S. Jiang, Sens.Actuators B Chem. 107 (2005) 202.
[75] B.-K. Oh, Y.-K. Kim, K.W. Park, W.H. Lee, J.-W. Choi, Biosens.Bioelectron. 19 (2004) 1497.
[76] J.W. Waswa, C. Debroy, J. Irudayaraj, J. Food Process Eng. 29(2006) 373.
[77] R.G. Heideman, R.P.H. Kooyman, J. Greve, Sens. Actuators BChem. 10 (1993) 209.
[78] J. Ingenhoff, B. Drapp, G. Gauglitz, Fresenius J. Anal. Chem.346 (1993) 580.
[79] G. Gauglitz, J. Ingenhoff, Fresenius J. Anal. Chem. 349 (1994)355.
[80] F. Brosinger, H. Freimuth, M. Lacher, W. Ehrfeld, E. Gedig, A.Katerkamp, F. Spener, K. Cammann, Sens. Actuators BChem. 44 (1997) 350.
[81] E.F. Schipper, A.M. Brugman, C. Dominguez, L.M. Lechuga,R.P.H. Kooyman, J. Greve, Sens. Actuators B Chem. 40 (1997)147.
[82] M. Weisser, G. Tovar, S. Mittler-Neher, W. Knoll, F. Brosinger,H. Freimuth, M. Lacher, W. Ehrfeld, Biosens. Bioelectron. 14(1999) 405.
[83] R.G. Heideman, P.V. Lambeck, Sens. Actuators B Chem. 61(1999) 100.
[84] D. Jimenez, E. Bartolome, M. Moreno, J. Munoz, C.Dominguez, Opt. Commun. 132 (1996) 437.
[85] F. Prieto, B. Sepulveda, A. Calle, A. Llobera, C. Domınguez,L.M. Lechuga, Sens. Actuators B Chem. 92 (2003) 151.
[86] S.-H. Hsu, Y.-T. Huang, J. Lightwave Technol. 23 (2005) 4200.[87] F.J. Blanco, M. Agirregabiria, J. Berganzo, K. Mayora, J.
Elizalde, A. Calle, C. Dominguez, L.M. Lechuga, J.Micromech. Microeng. 16. (2006).
[88] A. Brandenburg, R. Henninger, Appl. Opt. 33 (1994) 5941.[89] A. Brandenburg, Sens. Actuators B Chem. 39 (1997) 266.[90] A. Ymeti, J.S. Kanger, J. Greve, P.V. Lambeck, R. Wijn, R.G.
Heideman, Appl. Opt. 42 (2003) 5649.[91] A. Ymeti, J. Greve, P.V. Lambeck, T. Wink, S.W.F.M.v. Hovell,
T.A.M. Beumer, R.R. Wijn, R.G. Heideman, V. Subramaniam,J.S. Kanger, Nano Lett. 7 (2007) 394.
[92] Website, http://www.farfield-scientific.com/.[93] G.H. Cross, A.A. Reeves, S. Brand, J.F. Popplewell, L.L. Peel,
M.J. Swann, N.J. Freeman, Biosens. Bioelectron. 19 (2003)383.
[94] M.J. Swann, L.L. Peel, S. Carrington, N.J. Freeman, Anal.Biochem. 329 (2004) 190.
[95] B.H. Schneider, J.G. Edwards, N.F. Hartman, Clin. Chem. 43(1997) 1757.
[96] B.H. Schneider, E.L. Dickinson, M.D. Vach, J.V. Hoijer, L.V.Howard, Biosens. Bioelectron. 15 (2000) 13.
[97] B.H. Schneider, E.L. Dickinson, M.D. Vach, J.V. Hoijer, L.V.Howard, Biosens. Bioelectron. 15 (2000) 597.
[98] V.S.-Y. Lin, K. Motesharei, K.-P.S. Dancil, M.J. Sailor, M.R.Ghadiri, Science 278 (1997) 840.
[99] M.M. Varma, H.D. Inerowicz, F.E. Regnier, D.D. Nolte,Biosens. Bioelectron. 19 (2004) 1371.
[100] M. Zhao, D. Nolte, W. Cho, F. Regnier, M. Varma, G.Lawrence, J. Pasqua, Clin. Chem. 52 (2006) 2135.
a 6 2 0 ( 2 0 0 8 ) 8–26
[101] Website, http://www.quadraspec.com/index.php.[102] C.-L. Chang, G. Acharya, C.A. Savran, Appl. Phys. Lett. 90
(2007) 233901.[103] D.A. Markov, K. Swinney, D.J. Bornhop, J. Am. Chem. Soc.
126 (2004) 16659.[104] H.S. Sørensen, N.B. Larsen, J.C. Latham, D.J. Bornhop, P.E.
Andersen, Appl. Phys. Lett. 89 (2006) 151108.[105] Z. Wang, D.J. Bornhop, Anal. Chem. 77 (2005) 7872.[106] D.J. Bornhop, J.C. Latham, A. Kussrow, D.A. Markov, R.D.
Jones, H.S. Sorensen, Science 317 (2007) 1732.[107] N.J. Goddard, D. Pollard-Knight, C.H. Maule, Analyst 119
(1994) 583.[108] H.J. Watts, C.R. Lowe, D.V. Pollard-Knight, Anal. Chem. 66
(1994) 2465.[109] N.J. Goddard, K. Singh, R.J. Holmes, B. Bastani, Sens.
Actuators B Chem. 51 (1998) 131.[110] N.J. Goddard, K. Singh, J.P. Hulme, C. Malins, R.J. Holmes,
Sens. Actuators A 100 (2002) 1.[111] P.E. Buckle, R.J. Davies, T. Kinning, D. Yeung, P.R. Edwards, D.
Pollard-Knight, C.R. Lowe, Biosens. Bioelectron. 8 (1993) 355.[112] R. Cush, J.M. Cronin, W.J. Stewart, C.H. Maule, J. Molloy, N.J.
Goddard, Biosens. Bioelectron. 8 (1993) 347.[113] Website, http://www.neosensors.com.[114] Z. Salamon, G. Tollin, Biophys. J. 80 (2001) 1557.[115] M. Zourob, S. Mohr, B.J.T. Brown, P.R. Fielden, M. McDonnell,
N.J. Goddard, Sens. Actuators B Chem. 90 (2003) 296.[116] M. Zourob, S. Mohr, P.R. Fielden, N.J. Goddard, Sens.
Actuators B Chem. 94 (2003) 304.[117] N. Skivesen, R. Horvath, H.C. Pedersen, Sens. Actuators B
Chem. 106 (2005) 668.[118] N. Skivesen, R. Horvath, H.C. Pedersen, Opt. Lett. 30 (2005)
1659.[119] M. Zourob, S. Mohr, B.J.T. Brown, P.R. Fielden, M.B.
McDonnell, N.J. Goddard, Anal. Chem. 77 (2005) 232.[120] M. Zourob, N.J. Goddard, Biosens. Bioelectron. 20 (2005)
1718.[121] N. Skivesen, R. Horvath, S. Thinggaard, N.B. Larsen, H.C.
Pedersen, Biosens. Bioelectron. 22 (2007) 1282.[122] R. Horvath, H.C. Pedersen, N.B. Larsen, Appl. Phys. Lett. 81
(2002) 2166.[123] R. Horvath, H.C. Pedersen, N. Skivesen, D. Selmeczi, N.B.
Larsen, Opt. Lett. 28 (2003) 1233.[124] N. Skivesen, R. Horvath, H.C. Pedersen, Opt. Lett. 28 (2003)
2473.[125] R. Horvath, H.C. Pedersen, N. Skivesen, D. Selmeczi, N.B.
Larsen, Appl. Phys. Lett. 86 (2005) 071101.[126] H. Li, Z. Cao, H. Lu, Q. Shen, Appl. Phys. Lett. 83 (2003) 2757.[127] H. Lu, Z. Cao, H. Li, Q. Shen, Appl. Phys. Lett. 85 (2004) 4579.[128] L. Chen, Z. Cao, F. Ou, H. Li, Q. Shen, H. Qiao, Opt. Lett. 32
(2007) 1432.[129] Y. Wang, H. Li, Z. Cao, T. Yu, Q. Shen, Y. He, Appl. Phys. Lett.
92 (2008) 061117.[130] A. Serpenguzel, S. Arnold, G. Griffel, Opt. Lett. 20 (1995) 654.[131] F. Vollmer, D. Braun, A. Libchaber, M. Khoshsima, I.
Teraoka, S. Arnold, Appl. Phys. Lett. 80 (2002) 4057.[132] S. Arnold, M. Khoshsima, I. Teraoka, S. Holler, F. Vollmer,
Opt. Lett. 28 (2003) 272.[133] I. Teraoka, S. Arnold, F. Vollmer, J. Opt. Soc. Am. B 20 (2003)
1937.[134] F. Vollmer, S. Arnold, D. Braun, I. Teraoka, A. Libchaber,
Biophys. J. 85 (2003) 1974.[135] M. Noto, M. Khoshsima, D. Keng, I. Teraoka, V. Kolchenko,
S. Arnold, Appl. Phys. Lett. 87 (2005) 223901.[136] M. Noto, F. Vollmer, D. Keng, I. Teraoka, S. Arnold, Opt. Lett.
30 (2005) 510.[137] O. Gaathon, J. Culic-Viskota, M. Mihnev, I. Teraoka, S.
Arnold, Appl. Phys. Lett. 89 (2006).[138] I. Teraoka, S. Arnold, J. Opt. Soc. Am. B 23 (2006) 1381.
a c t a
a n a l y t i c a c h i m i c a[139] I. Teraoka, S. Arnold, J. Opt. Soc. Am. B 23 (2006) 1434.[140] H.-C. Ren, F. Vollmer, S. Arnold, A. Libchaber, Opt. Express
15 (2007) 17410.[141] D. Keng, S.R. McAnanama, I. Teraoka, S. Arnold, Appl. Phys.
Lett. 91 (2007).[142] M. Noto, D. Keng, I. Teraoka, S. Arnold, Biophys. J. 92 (2007)
4466.[143] S. Arnold, R. Ramjit, D. Keng, V. Kolchenko, I. Teraoka,
Faraday Discuss. 137 (2008) 65.[144] N.M. Hanumegowda, C.J. Stica, B.C. Patel, I.M. White, X. Fan,
Appl. Phys. Lett. 87 (2005) 201107.[145] N.M. Hanumegowda, I.M. White, H. Oveys, X. Fan, Sens.
Lett. 3 (2005) 315.[146] I.M. White, N.M. Hanumegowda, X. Fan, Opt. Lett. 30 (2005)
3189.[147] N.M. Hanumegowda, I.M. White, X. Fan, Sens. Actuators B
Chem. 120 (2006) 207.[148] I.M. White, H. Oveys, X. Fan, Opt. Lett. 31 (2006) 1319.[149] I.M. White, H. Oveys, X. Fan, Spectroscopy 21 (2006) 36.[150] I.M. White, H. Oveys, X. Fan, T.L. Smith, J. Zhang, Appl.
Phys. Lett. 89 (2006) 191106.[151] H. Zhu, J.D. Suter, I.M. White, X. Fan, Sensors 6 (2006)
785.[152] X. Fan, I.M. White, H. Zhu, J.D. Suter, H. Oveys, SPIE Laser
Resonators and Beam Control X 6452 (2007) 6452.[153] M. Sumetsky, R.S. Windeler, Y. Dulashko, X. Fan, Opt.
Express 15 (2007) 14376.[154] I.M. White, H. Zhu, J.D. Suter, N.M. Hanumegowda, H.
Oveys, M. Zourob, X. Fan, IEEE Sens. J. 7 (2007) 28.[155] I.M. White, J. Gohring, X. Fan, Opt. Express 15 (2007) 17433.[156] I.M. White, J. Gohring, Y. Sun, G. Yang, S. Lacey, X. Fan,
Appl. Phys. Lett. 91 (2007) 241104.[157] H. Zhu, I.M. White, J.D. Suter, P.S. Dale, X. Fan, Opt. Express
15 (2007) 9139.[158] H. Zhu, I.M. White, J.D. Suter, M. Zourob, X. Fan, Anal.
Chem. 79 (2007) 930.[159] S.I. Shopova, H. Zhu, X. Fan, P. Zhang, Appl. Phys. Lett. 90
(2007) 221101.[160] S.I. Shopova, J.M. Cupps, P. Zhang, E.P. Henderson, S. Lacey,
X. Fan, Opt. Express 15 (2007) 12735.[161] S. Lacey, I.M. White, Y. Sun, S.I. Shopova, J.M. Cupps, P.
Zhang, X. Fan, Opt. Express 15 (2007) 15523.[162] S.I. Shopova, I.M. White, Y. Sun, H. Zhu, X. Fan, G.
Frye-Mason, A. Thompson, S.-j. Ja, Anal. Chem. 80 (2008)2232.
[163] J.D. Suter, I.M. White, H. Zhu, H. Shi, C.W. Caldwell, X. Fan,Biosens. Bioelectron. 23 (2008) 1003.
[164] H. Zhu, I.M. White, J.D. Suter, M. Zourob, X. Fan, Analyst 132(2008) 356.
[165] A.M. Armani, K.J. Vahala, Opt. Lett. 31 (2006) 1896.[166] C.-Y. Chao, L.J. Guo, Appl. Phys. Lett. 83 (2003) 1527.[167] C.Y. Chao, L.J. Guo, J. Lightwave Technol. 24 (2006) 1395.[168] C.-Y. Chao, W. Fung, L.J. Guo, IEEE J. Sel. Top. Quantum
Electron. 12 (2006) 134.[169] J. Yang, L.J. Guo, IEEE J. Sel. Top. Quantum Electron. 12
(2006) 143.[170] T. Ling, L.J. Guo, Opt. Express 15 (2007) 17424.[171] A. Yalcin, K.C. Popat, J.C. Aldridge, T.A. Desai, J. Hryniewicz,
N. Chbouki, B.E. Little, O. King, V. Van, S. Chu, D. Gill, M.Anthes-Washburn, M.S. Unlu, IEEE J. Sel. Top. QuantumElectron. 12 (2006) 148.
[172] A. Ksendzov, M.L. Homer, A.M. Manfreda, Electron. Lett. 40(2004).
[173] A. Ksendzov, Y. Lin, Opt. Lett. 30 (2005) 3344.
[174] A.T. Rosenberger, Opt. Express 15 (2007) 12959.[175] E. Krioukov, Opt. Lett. 27 (2002) 512.[176] E. Krioukov, D.J.W. Klunder, A. Driessen, J. Greve, C. Otto,Opt. Lett. 27 (2002) 1504.
6 2 0 ( 2 0 0 8 ) 8–26 25
[177] E. Krioukov, J. Greve, C. Otto, Sens. Actuators B Chem. 90(2003) 58.
[178] E. Krioukov, D. Klunder, A. Driessen, J. Grevea, C. Otto,Talanta 65 (2005) 1086.
[179] R.W. Boyd, J.E. Heebner, Appl. Opt. 40 (2001) 5742.[180] R.W. Boyd, J.E. Heebner, N.N. Lepeshkin, Q.H. Park, A.
Schweinsberg, G.W. Wicks, A.S. Baca, J.E. Fajardo, R.R.Hancock, M.A. Lewis, R.M. Boysel, M. Quesada, R. Welty,A.R. Bleier, J. Treichler, R.E. Slusher, J. Mod. Opt. 50 (2003)2543.
[181] A. Schweinsberg, S. Hocde, N.N. Lepeshkin, R.W. Boyd, C.Chase, J.E. Fajardo, Sens. Actuators B Chem. 123 (2007) 727.
[182] J.L. Nadeau, V.S. Ilchenko, D. Kossakovski, G.H. Bearman, L.Maleki, High-Q whispering-gallery mode sensor in liquids,in: A.V. Kudryashov (Ed.), Laser Resonators and BeamControl, vol. V, 2002, p. 172.
[183] S. Blair, Y. Chen, Appl. Opt. 40 (2001) 570.[184] J. Scheuer, W.M.J. Green, G.A. DeRose, A. Yariv, IEEE J. Sel.
Top. Quantum Electron. 11 (2005) 476.[185] K. De Vos, I. Bartolozzi, E. Schacht, P. Bienstman, R. Baets,
Opt. Express 15 (2007) 7610.[186] A. Ramachandran, S. Wang, J. Clarke, S.J. Ja, D. Goad, L.
Wald, E.M. Flood, E. Knobbe, J.V. Hryniewicz, S.T. Chu, D.Gill, W. Chen, O. King, B.E. Little, Biosens. Bioelectron. 23(2008) 939.
[187] V. Zamora, A. Dıez, M.V. Andres, B. Gimeno, Opt. Express 15(2007) 12011.
[188] M. Sumetsky, Opt. Express 15 (2007) 17449.[189] C.A. Barrios, K.B. Gylfason, B. Sanchez, A. Griol, H.
Sohlstrom, M. Holgado, R. Casquel, Opt. Lett. 32 (2007) 3080.[190] C.A. Barrios, M.J. Banuls, V. Gonzalez-Pedro, K.B. Gylfason,
B. Sanchez, A. Griol, A. Maquieira, H. Sohlstrom, M.Holgado, R. Casquel, Opt. Lett. 33 (2008) 708.
[191] R.K. Chang, A.J. Campillo, Optical Processes inMicrocavities, World Scientific, Singapore, 1996.
[192] C.F. Bohren, D.R. Huffman, Absorption and Scattering ofLight by Small Particles, John Wiley & Sons, New York, 1998.
[193] K. Vahala, Optical Microcavities, World Scientific,Singapore, 2005.
[194] M.L. Gorodetsky, A.A. Savchenkov, V.S. Ilchenko, Opt. Lett.21 (1996) 453.
[195] U. Levy, K. Campbell, A. Groismanb, S. Mookherjea, Y.Fainman, Appl. Phys. Lett. 88 (2006) 111107.
[196] X. Fan, I.M. White, S. Shopova, H. Zhu, J.D. Suter, Y. Sun, G.Yang, in: A. Matsko (Ed.), Practical Applications ofMicroresonators in Optics and Photonics, Taylor andFrancis, in press.
[197] E. Udd, Rev. Sci. Instrum. 66 (1995) 4015.[198] M.E. Bosch, A.J.R. Sanchez, C.B. Ojeda, Sensors 7 (2007) 797.[199] A.D. Kersey, M.A. Davis, H.J. Patrick, M. LeBlanc, K.P. Koo,
C.G. Askins, M.A. Putnam, E.J. Friebele, J. LightwaveTechnol. 15 (1997) 1442.
[200] I. Riant, C. R. Physique 4 (2003) 41.[201] K.O. Hill, Y. Fujii, D.C. Johnson, B.S. Kawasaki, Appl. Phys.
Lett. 32 (1978) 647.[202] W.V. Sorin, H.J. Shaw, J. Lightwave Technol. LT-3 (1985) 1041.[203] M.C. Farries, C.M. Ragdale, D.C.J. Reid, Electron. Lett. 28
(1992) 487.[204] K. Schroeder, W. Ecke, R. Mueller, R. Willsch, A. Andreev,
Meas. Sci. Technol. 12 (2001) 757.[205] K.H. Smith, B.L. Ipson, T.L. Lowder, A.R. Hawkins, R.H.
Selfridge, S.M. Schultz, Appl. Opt. 45 (2006) 1669.[206] T.L. Lowder, J.D. Gordon, S.M. Schultz, R.H. Selfridge, Opt.
Lett. 32 (2007) 2523.
[207] W. Liang, Y. Huang, Y. Xu, R.K. Lee, A. Yariv, Appl. Phys. Lett.86 (2005) 151122.[208] A.N. Chryssis, S.M. Lee, S.B. Lee, S.S. Saini, M. Dagenais,
IEEE Photonics Technol. Lett. 17 (2005) 1253.

a c t
26 a n a l y t i c a c h i m i c a[209] A.N. Chryssis, S.S. Saini, S.M. Lee, H. Yi, W.E. Bentley, M.Dagenais, IEEE J. Sel. Top. Quantum Electron. 11 (2005) 864.
[210] S.S. Saini, C. Stanford, S.M. Lee, J. Park, P. DeShong, W.E.Bentley, M. Dagenais, IEEE Photonics Technol. Lett. 19(2007) 1341.
[211] M.C.P. Huy, G. Laffont, V. Dewynter, P. Ferdinand, P. Roy, J.-L.Auguste, D. Pagnoux, W. Blanc, B. Dussardier, Opt. Lett.(2007) 2390.
[212] K.O. Hill, B. Malo, K.A. Vineberg, F. Bilodeau, D.C. Johnson, I.Skinner, Electron. Lett. 26 (1990) 1270.
[213] X. Chen, K. Zhou, L. Zhang, I. Bennion, Appl. Opt. 46 (2007)451.
[214] X. Shu, L. Zhang, I. Bennion, J. Lightwave Technol. 20 (2002)255.
[215] N. Burani, J. Laegsgaard, J. Opt. Soc. Am. B 22 (2005) 2487.[216] B.H. Lee, Y. Liu, S.B. Lee, S.S. Choi, Opt. Lett. 22 (1997) 1769.[217] N. Chen, B. Yun, Y. Cui, Appl. Phys. Lett. 88 (2006) 133902.[218] M.P. DeLisa, Z. Zhang, M. Shiloach, S. Pilevar, C.C. Davis, J.S.
Sirkis, W.E. Bentley, Anal. Chem. 72 (2000) 2895.[219] L. Rindorf, J.B. Jensen, M. Dufva, L.H. Pedersen, P.E. Hoiby, O.
Bang, Opt. Express 14 (2006) 8224.[220] L. Tong, R.R. Gattass, J.B. Ashcom, S. He, J. Lou, M. Shen, I.
Maxwell, E. Mazur, Nature 426 (2003) 816.[221] M. Sumetsky, Y. Dulashko, A. Hale, Opt. Express 12 (2004)
3521.[222] F. Xu, P. Horak, G. Brambilla, Opt. Express 15 (2007) 7888.[223] F. Xu, P. Horak, G. Brambilla, Opt. Express 15 (2007) 9385.[224] F. Xu, V. Pruneri, V. Finazzi, G. Brambilla, Opt. Express 16
(2008) 1062.[225] J. Lou, L. Tong, Z. Ye, Opt. Express 13 (2005) 2135.[226] L. Tong, J. Lou, Z. Ye, G.T. Svacha, E. Mazur, Nanotechnology
16 (2005) 1445.[227] H. Tazawa, T. Kanie, M. Katayama, Appl. Phys. Lett. 91
(2007) 113901.[228] Y. Zhang, H. Shibru, K.L. Cooper, A. Wang, Opt. Lett. 30
(2005) 1021.[229] X. Wang, K.L. Cooper, A. Wang, J. Xu, Z. Wang, Y. Zhang, Z.
Tu, Appl. Phys. Lett. 89 (2006) 163901.[230] Y. Zhang, X. Chen, Y. Wang, K.L. Cooper, A. Wang, J.
Lightwave Technol. 25 (2007) 1797.
a 6 2 0 ( 2 0 0 8 ) 8–26
[231] T. Wei, Y. Han, H.-L. Tsai, H. Xiao, Opt. Lett. 33 (2008)536.
[232] T. Wei, Y. Han, Y. Li, H.-L. Tsai, H. Xiao, Opt. Express 16(2008) 5764.
[233] J. Topol’ancik, P. Bhattacharya, J. Sabarinathan, P.C. Yu,Appl. Phys. Lett. 82 (2003) 1143.
[234] M. Loncar, A. Scherer, Y. Qiu, Appl. Phys. Lett. 82 (2003) 4648.[235] E. Chow, A. Grot, L.W. Mirkarimi, M. Sigalas, G. Girolami,
Opt. Lett. 29 (2004) 1093.[236] S. Chakravarty, J. Topol’ancik, P. Bhattacharya, S.
Chakrabarti, Y. Kang, M.E. Meyerhoff, Opt. Lett. 30 (2005)2578.
[237] M.R. Lee, P.M. Fauchet, Opt. Express 15 (2007) 4530.[238] M.R. Lee, P.M. Fauchet, Opt. Lett. 32 (2007) 3284.[239] N. Skivesen, A. Tetu, M. Kristensen, J. Kjems, L.H. Frandsen,
P.I. Borel, Opt. Express 15 (2007) 3169.[240] B. Cunningham, P. Li, B. Lin, J. Pepper, Sens. Actuators B
Chem. 81 (2002) 316.[241] P.Y. Li, B. Lin, J. Gerstenmaier, B.T. Cunningham, Sens.
Actuators B Chem. 99 (2004) 6.[242] B. Lin, J. Qiu, J. Gerstenmeier, P. Li, H. Pien, J. Pepper, B.
Cunningham, Biosens. Bioelectron. 17 (2002) 827.[243] B.T. Cunningham, L. Laing, Expert Rev. Proteomics 3 (2006)
271.[244] B. Lin, P. Li, B.T. Cunningham, Sens. Actuators B Chem. 114
(2006) 559.[245] N. Ganesh, I.D. Block, B.T. Cunningham, Appl. Phys. Lett. 89
(2006) 023901.[246] S. Mandal, D. Erickson, Opt. Express 16 (2008) 1623.[247] V.N. Konopsky, E.V. Alieva, Anal. Chem. 79 (2007) 4729.[248] Website, http://www.srubiosystems.com/.[249] C. Monat, P. Domachuk, B.J. Eggleton, Nat. Photon. 1 (2007)
106.[250] D. Psaltis, S.R. Quake, C. Yang, Nature 442 (2006) 381.[251] D. Erickson, Microfluid. Nanofluid. 4 (2008) 1.
[252] E. Thrush, O. Levi, L.J. Cook, J. Deich, A. Kurtz, S.J. Smith,W.E. Moerner, J.S. Harris, Sens. Actuators B Chem. 105(2005) 393.
[253] M. Lu, S. Choi, C. Wagner, J. Eden, B. Cunningham, Appl.Phys. Lett., in press.