sensitivity and uncertainty in crop water footprint...
TRANSCRIPT
Hydrol. Earth Syst. Sci., 18, 2219–2234, 2014www.hydrol-earth-syst-sci.net/18/2219/2014/doi:10.5194/hess-18-2219-2014© Author(s) 2014. CC Attribution 3.0 License.
Sensitivity and uncertainty in crop water footprint accounting:a case study for the Yellow River basinL. Zhuo, M. M. Mekonnen, and A. Y. Hoekstra
Twente Water Centre, University of Twente, Enschede, the Netherlands
Correspondence to:L. Zhuo ([email protected])
Received: 3 December 2013 – Published in Hydrol. Earth Syst. Sci. Discuss.: 7 January 2014Revised: 3 April 2014 – Accepted: 5 May 2014 – Published: 17 June 2014
Abstract. Water Footprint Assessment is a fast-growing fieldof research, but as yet little attention has been paid to theuncertainties involved. This study investigates the sensitiv-ity of and uncertainty in crop water footprint (in m3 t−1) es-timates related to uncertainties in important input variables.The study focuses on the green (from rainfall) and blue (fromirrigation) water footprint of producing maize, soybean, rice,and wheat at the scale of the Yellow River basin in the period1996–2005. A grid-based daily water balance model at a 5 by5 arcmin resolution was applied to compute green and bluewater footprints of the four crops in the Yellow River basinin the period considered. The one-at-a-time method was car-ried out to analyse the sensitivity of the crop water foot-print to fractional changes of seven individual input variablesand parameters: precipitation (PR), reference evapotranspi-ration (ET0), crop coefficient (Kc), crop calendar (plantingdate with constant growing degree days), soil water contentat field capacity (Smax), yield response factor (Ky) and max-imum yield (Ym). Uncertainties in crop water footprint esti-mates related to uncertainties in four key input variables: PR,ET0, Kc, and crop calendar were quantified through MonteCarlo simulations.
The results show that the sensitivities and uncertaintiesdiffer across crop types. In general, the water footprint ofcrops is most sensitive to ET0 andKc, followed by the cropcalendar. Blue water footprints were more sensitive to in-put variability than green water footprints. The smaller theannual blue water footprint is, the higher its sensitivity tochanges in PR, ET0, andKc. The uncertainties in the totalwater footprint of a crop due to combined uncertainties inclimatic inputs (PR and ET0) were about±20 % (at 95 %
confidence interval). The effect of uncertainties in ET0 wasdominant compared to that of PR. The uncertainties in thetotal water footprint of a crop as a result of combined key in-put uncertainties were on average±30 % (at 95 % confidencelevel).
1 Introduction
More than 2 billion people live in highly water stressed areas(Oki and Kanae, 2006), and the pressure on freshwater willinevitably be intensified by population growth, economic de-velopment and climate change in the future (Vörösmarty etal., 2000). The water footprint (Hoekstra, 2003) is increas-ingly recognized as a suitable indicator of human appropria-tion of freshwater resources and is becoming widely appliedto get better understanding of the sustainability of water use.In the period 1996–2005, agriculture contributed 92 % to thetotal water footprint of humanity (Hoekstra and Mekonnen,2012).
Water footprints within the agricultural sector have beenextensively studied, mainly focusing on the water footprintof crop production, at scales from a sub-national region (e.g.Aldaya and Llamas, 2008; Zeng et al., 2012; Sun et al.,2013), to a country level (e.g. Ma et al., 2006; Hoekstra andChapagain, 2007b; Kampman et al., 2008; Liu and Savenije,2008; Bulsink et al., 2010; Ge et al., 2011) to the global level(Hoekstra and Chapagain, 2007a; Liu et al., 2010; Siebertand Döll, 2010; Mekonnen and Hoekstra, 2011; Hoekstraand Mekonnen, 2012). The green or blue water footprint ofa crop is normally expressed by a single volumetric number
Published by Copernicus Publications on behalf of the European Geosciences Union.

2220 L. Zhuo et al.: Sensitivity and uncertainty in crop water footprint accounting – Yellow River basin
referring to an average value for a certain area and period.However, the water footprint of a crop is always estimatedbased on a large set of assumptions with respect to the mod-elling approach, parameter values, and data sets for inputvariables used, so that outcomes carry substantial uncertain-ties (Mekonnen and Hoekstra, 2010; Hoekstra et al., 2011).
Together with the carbon footprint and ecological foot-print, the water footprint is part of the “footprint family ofindicators” (Galli et al., 2012), a suite of indicators to trackhuman pressure on the surrounding environment. Nowadays,it is not hard to find information in literature on uncertaintiesin the carbon footprint of food products (Röös et al., 2010,2011) or uncertainties in the ecological footprint (Parker andTyedmers, 2012). However, there are hardly any sensitivityor uncertainty studies available in the water footprint field(Hoekstra et al., 2011), while only some subjective approx-imations and local rough assessments exist (Mekonnen andHoekstra, 2010, 2011; Hoekstra et al., 2012; Mattila et al.,2012). Bocchiola et al. (2013) assessed the sensitivity ofthe water footprint of maize to potential changes of cer-tain selected weather variables in northern Italy. Guieysseet al. (2013) assessed the sensitivity of the water footprintof fresh algae cultivation to changes in methods to estimateevaporation.
In order to provide realistic information to stakehold-ers in water governance, analysing the sensitivity and themagnitude of uncertainties in the results of a Water Foot-print Assessment in relation to assumptions and input vari-ables would be useful (Hoekstra et al., 2011; Mekonnen andHoekstra, 2011). Therefore, the objectives of this study are(1) to investigate the sensitivity of the water footprint of acrop to changes in input variables and parameters, and (2) toquantify the uncertainty in green, blue, and total water foot-prints of crops due to uncertainties in input variables at thescale of a river basin. The study focuses on the water foot-print of producing maize, soybean, rice, and wheat in the Yel-low River basin, China, for each separate year in the period1996–2005. Uncertainty in this study refers to the uncertaintyin water footprint that accumulates due to the uncertainties ininputs propagated through the accounting process, which isreflected in the resulting estimates (Walker et al., 2003).
2 Study area
The Yellow River basin (YRB), drained by the Yellow River(Huang He), is the second largest river basin in China,with a drainage area of 795× 103 km2 (YRCC, 2011). TheYellow River is 5464 km long, originates from the Bayan-gela Mountains of the Tibetan Plateau, flows through nineprovinces (Qinghai, Sichuan, Gansu, Ningxia, Inner Mon-golia, Shaanxi, Shanxi, Henan and Shandong), and finallydrains into the Bohai Sea (YRCC, 2011). The YRB is usu-ally divided into three reaches: the upper reach (upstreamof Hekouzhen, Inner Mongolia), the middle reach (upstream
of Taohuayu, Henan province) and the lower reach (draininginto the Bohai Sea).
The YRB is vital for food production, natural resourcesand socioeconomic development of China (Cai et al., 2011).The cultivated area of the YRB accounts for 13 % ofthe national total (CMWR, 2010). In 2000, the basin ac-counted for 14 % of the country’s crop production, with about7 million ha of irrigated land in a total cultivated area in thebasin of 13 million ha (Ringler et al., 2010). The water of theYellow River supports 150 million people with a per capitablue water availability of 430 m3 per year (Falkenmark andWidstrand, 1992; Ringler et al., 2010). The YRB is a net vir-tual water exporter (Feng et al., 2012) and suffers severe wa-ter scarcity. The blue water footprint in the basin is largerthan the maximum sustainable blue water footprint (runoffminus environmental flow requirements) 8 months out of theyear (Hoekstra et al., 2012).
3 Methods and data
3.1 Crop water footprint accounting
For the period 1996–2005, we calculated annual green andblue water footprints (WF) related to the production ofmaize, soybean, rice, and wheat in the YRB. The green andblue WF per unit mass of crop (m3 t−1) were calculated bydividing the green and blue crop water use (CWU, m3 ha−1)by the crop yield (Y , t ha−1), respectively (Hoekstra et al.,2011). The total WF refers to the sum of green and blue WF.
A grid-based dynamic water balance model, developed byMekonnen and Hoekstra (2010, 2011), is used to computedifferent components of CWU according to the daily soilwater balance. The model has a spatial resolution of 5 by5 arcmin (about 7.4 km× 9.3 km at the latitude of the YRB).The daily root zone soil water balance for growing a crop ineach grid cell in the model can be expressed in terms of soilmoisture (S[t], mm) (Mekonnen and Hoekstra, 2010):
S[t]=S[t−1]+I[t]+PR[t]+CR[t]−RO[t]−ET[t]−DP[t], (1)
whereS[t−1] (mm) refers to the soil water content on day(t − 1), I[t] (mm) the irrigation water applied on day t, PR[t]
(mm) precipitation, CR[t] (mm) the capillary rise from thegroundwater, RO[t] (mm) water runoff, ET[t] (mm) actualevapotranspiration and DP[t] (mm) deep percolation on dayt .
CWUgreenand CWUblue over the crop-growing period (inm3 ha−1) were calculated from the accumulated correspond-ing ET (mm day−1) (Hoekstra et al., 2011):
CWUgreen= 10 ×
lgp∑d=1
ETgreen (2)
CWUblue = 10 ×
lgp∑d=1
ETblue. (3)
Hydrol. Earth Syst. Sci., 18, 2219–2234, 2014 www.hydrol-earth-syst-sci.net/18/2219/2014/
L. Zhuo et al.: Sensitivity and uncertainty in crop water footprint accounting – Yellow River basin 2221
Table 1.Crop characteristics for maize, soybean, rice and wheat in the Yellow River basin.
Crop coefficients Planting Growing Relative crop-growing stages
Kc_ini Kc_mid Kc_end date period L_ini L_dev L_mid L_late(days)
Maize 0.70 1.20 0.25 1 Apr 150 0.20 0.27 0.33 0.20Soybean 0.40 1.15 0.50 1 Jun 150 0.13 0.17 0.50 0.20Rice 1.05 1.20 0.90 1 May 180 0.17 0.17 0.44 0.22Wheat 0.70 1.15 0.30 1 Oct 335 0.48 0.22 0.22 0.07
Sources: Allen et al. (1998); Chen et al. (1995); Chapagain and Hoekstra (2004).
The accumulation was done over the growing period from theday of planting (d = 1) to the day of harvest (lgp, the lengthof growing period in days). The factor 10 (m3 mm−1 ha−1)is applied to convert the mm to m3 ha−1. The daily ET(mm day−1) was computed according to Allen et al. (1998)as
ET = Ks[t] × Kc[t] × ET0[t], (4)
where Kc[t] is the crop coefficient,Ks[t] a dimension-less transpiration-reduction factor dependent on availablesoil water, and ET0[t] the reference evapotranspiration(mm day−1). The crop calendar andKc values for each cropwere assumed to be constant for the whole basin, as shownin Table 1.Ks[t] is assessed based on a daily function of themaximum and actual available soil moisture in the root zone(Allen et al., 1998):
Ks[t] =
{ s[t](1−p)×Smax[t]
S[t] < (1 − p) × Smax[t]
1 otherwise,(5)
whereSmax[t] is the maximum available soil water in the rootzone (mm, when soil water content is at field capacity), andp the fraction ofSmax that a crop can extract from the rootzone without suffering water stress, which is a function ofET0 andKc (Allen et al., 1998).
WF of the four crops in the YRB was estimated cover-ing both rain-fed and irrigated agriculture. In the case ofrain-fed crop production, blue CWU is zero and green CWU(m3 ha−1) was calculated by aggregating the daily values ofET over the length of the growing period. In the case of irri-gated crop production, green CWU was assumed to be equalto the ET for the case without irrigation. The blue CWU wasestimated as the actual ET for the case with sufficient irriga-tion minus the green CWU (Mekonnen and Hoekstra, 2010,2011).
The crop yield is influenced by water stress (Mekonnenand Hoekstra, 2010). The actual harvested yield (Y , t ha−1)at the end of crop-growing period for each grid cell wasestimated using the equation proposed by Doorenbos andKassam (1979):
Y = Ym ×
[1 − Ky
(1 −
∑lgpd=1 ET
CWR
)], (6)
whereYm is the maximum yield (t ha−1), obtained by multi-plying the corresponding provincial average yield values by afactor of 1.2 (Reynolds et al., 2000).Ky is the yield responsefactor obtained from Doorenbos and Kassan (1979). CWRrefers to the crop water requirement for the whole growingperiod (mm period−1) (which is equal toKc × ET0).
3.2 Sensitivity and uncertainty analysis
The estimation of crop WF requires a number of input vari-ables and parameters to the model, including daily precipita-tion (PR), daily reference evapotranspiration (ET0), crop co-efficients (Kc) in the different growing stages, crop calendar(planting date and length of the growing period), soil watercontent at field capacity (Smax), yield response factor (Ky)and maximum yield (Ym). The one-at-a-time method (seebelow) was applied to investigate the sensitivity of CWU,Y and WF to changes in these inputs. The uncertainties inWF due to uncertainties in PR, ET0, Kc, and crop calen-dar were assessed through Monte Carlo simulations. We as-sumed that systematic errors in original climate observationsat stations had been removed already. Uncertainties in vari-ables PR, ET0 andKc were assumed random, independentand close to a normal (Gaussian) distribution (Ahn, 1996; Xuet al., 2006a; Droogers and Allen, 2002; Meyer et al., 1989;Troutman, 1985).
3.2.1 Sensitivity analysis
The “one-at-a-time” or “sensitivity curve” method is a sim-ple but practical way of sensitivity analysis to investigate theresponse of an output variable to variation of input values(Hamby, 1994; Sun et al., 2012). With its simplicity and in-tuitionism, the method is popular and has been widely used(Ahn, 1996; Goyal, 2004; Xu et al., 2006a, b; Estévez etal., 2009). The method was performed by introducing frac-tional changes to one input variable, while keeping other
www.hydrol-earth-syst-sci.net/18/2219/2014/ Hydrol. Earth Syst. Sci., 18, 2219–2234, 2014
2222 L. Zhuo et al.: Sensitivity and uncertainty in crop water footprint accounting – Yellow River basin
inputs constant. The sensitivity curve of the resultant relativechange in the output variable was then plotted against therelative change of the input variable. The sensitivity analy-sis was carried out for each year in the period 1996–2005.For each cropped grid cell, we varied each input variablewithin a certain range. Then, the annual average level of theresponses in CWU,Y , and (green, blue, and total) WF of thecrops for the basin as a whole were recorded. With respect tothe input variables PR, ET0 andKc, we shifted each withinthe range of±2 SD (2× standard deviation of input uncer-tainties), which represents the 95 % confidence interval foruncertainties in the input variable. In terms of the crop cal-endar, we varied the planting date (D) within ±30 days ofconstant growing degree days (GDD) and relative length ofcrop-growing stages (Allen et al., 1998) (Table 1). The cumu-lative GDD (◦ day), measuring heat units during crop growth,has vastly improved expression and prediction of the crop’sphenological cycle compared to other approaches, such astime of the year or number of days (McMaster and Wilhelm,1997). In the study, a crop’s GDD was calculated per year,following the most widely used “Method 1” (McMaster andWilhelm, 1997), by summing the difference of the daily basetemperature and the average air temperature over the refer-ence crop-growing period in days (Table 1). The base tem-perature is the temperature below which crop growth doesnot progress. The base temperature of each crop was obtainedfrom FAO (Raes et al., 2012). ParametersSmax, Ky andYmwere varied within the range of±20 % of the default value.
3.2.2 Uncertainty analysis
The advantage of uncertainty analysis with the Monte Carlo(MC) simulation is that the model to be tested can be of anycomplexity (Meyer, 2007). MC simulations were carried outat the basin level to quantify the uncertainties in estimatedWF due to uncertainties in individual or multiple input vari-ables. The uncertainty analysis was carried out separatelyfor 3 years within the study period: 1996 (wet year), 2000(dry year), and 2005 (average year). For each MC simulation,1000 runs were performed. Based on the set of WF estimatesfrom those runs, the mean (µ) and standard deviation (SD)is calculated; with 95 % confidence, WF falls in the range ofµ ± 2 SD. The SD will be expressed as a percentage of themean.
3.2.3 Input uncertainty
Uncertainty in precipitation (PR)
Uncertainties in the Climate Research Unit Time Series(CRU-TS) (Harris et al., 2014) grid precipitation values usedfor WF accounting in this study come from two sources: themeasurement errors inherent in station observations, and er-rors which occur during the interpolation of station data inconstructing the grid database (Zhao and Fu, 2006; Fekete
et al., 2004; Phillips and Marks, 1996). Zhao and Fu (2006)compared the spatial distribution of precipitation as in theCRU database with the corresponding observations overChina and revealed that the differences between the CRUdata and observations vary from−20 to 20 % in the areawhere the YRB is located. For this study, we assume a±20 %range around the CRU precipitation data as the 95 % confi-dence interval (2 SD = 20 %).
Uncertainty in reference evapotranspiration (ET0)
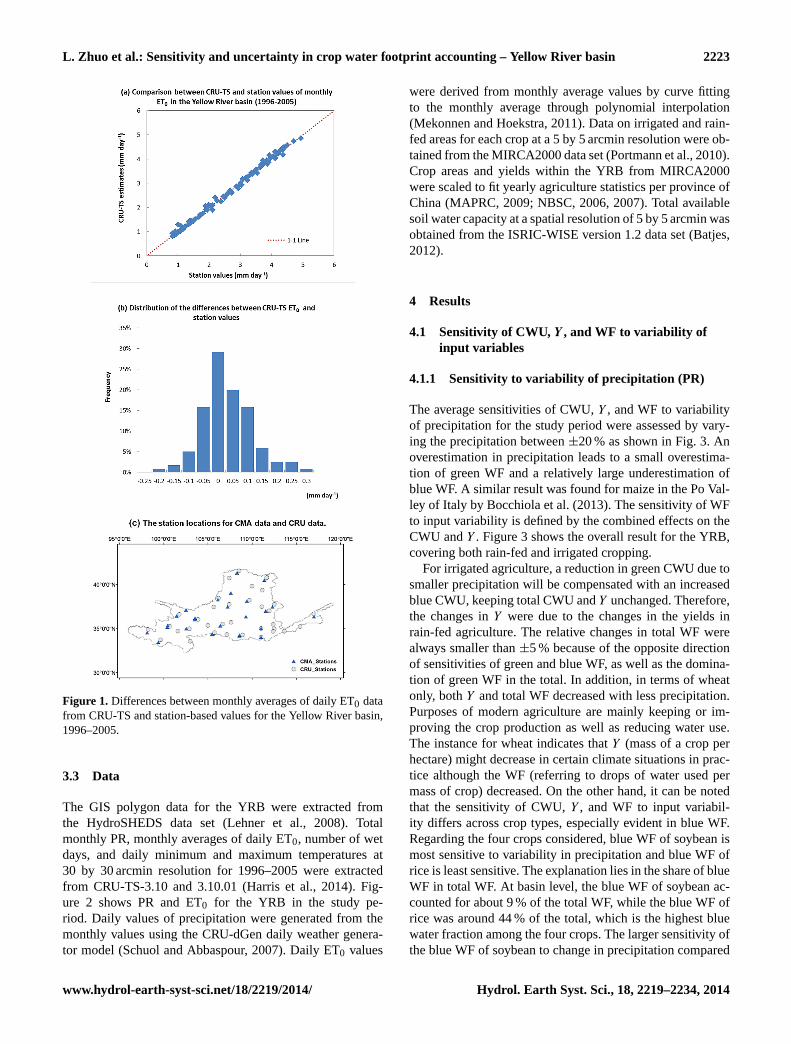
The uncertainties in the meteorological data used in estimat-ing ET0 will be transferred into uncertainties in the ET0 val-ues. The method used to estimate the CRU-TS ET0 data set isthe Penman–Monteith (PM) method (Allen et al., 1998). ThePM method has been recommended (Allen et al., 1998) forits high accuracy at station level within±10 % from the ac-tual values under all ranges of climates (Jensen et al., 1990).With respect to the gridded ET0 calculation, the interpo-lation may cause additional error (Thomas, 2008; Phillipsand Marks, 1996). There is no detailed information on un-certainty in the CRU-TS ET0 data set. We estimated dailyET0 values (mm day−1) for the period 1996–2005 from ob-served climatic data at 24 meteorological stations spread outin the YRB (CMA, 2008) by the PM method. Then we com-pared, station by station, the monthly averages of those cal-culated daily ET0 values to the corresponding monthly ET0values in the CRU-TS data set (Fig. 1a). The differences be-tween the station values and CRU-TS values ranged from−0.23 to 0.27 mm day−1 with a mean of 0.005 mm day−1
(Fig. 1b). The standard deviation (SD) of the differences was0.08 mm day−1, 5 % from the station values, which impliesan uncertainty range of±10 % (2 SD) at 95 % confidence in-terval. The locations of CMA stations were different fromthe stations used for generating the CRU data set (Harris etal., 2014) (see Fig. 1c), which was one of the sources of theuncertainty. We added the basin level uncertainty in monthlyET0 values due to uncertainties in interpolation (±10 % at95 % confidence level) and the uncertainty related to the ap-plication of the PM method (another±10 % at 95 % con-fidence level) to arrive at an overall uncertainty of±20 %(2 SD) for the ET0 data. We acknowledge that this is a crudeestimate of uncertainty, but there is no better method.
Uncertainty in crop characteristics
We used theKc values from Table 1 for the whole basin. Ac-cording to Jagtap and Jones (1989), theKc value for a certaincrop can vary by 15 %. We adopted this value and assumedthe 95 % uncertainty range falls within±15 % (2 SD) fromthe meanKc values. Referring to the crop calendar, we as-sumed that the planting date for each crop fluctuated within±30 days from the original planting date used, holding thesame length of GDD for each year. Table 2 summarises theuncertainty scenarios considered in the study.
Hydrol. Earth Syst. Sci., 18, 2219–2234, 2014 www.hydrol-earth-syst-sci.net/18/2219/2014/
L. Zhuo et al.: Sensitivity and uncertainty in crop water footprint accounting – Yellow River basin 2223
Figure 1. Differences between monthly averages of daily ET0 datafrom CRU-TS and station-based values for the Yellow River basin,1996–2005.
3.3 Data
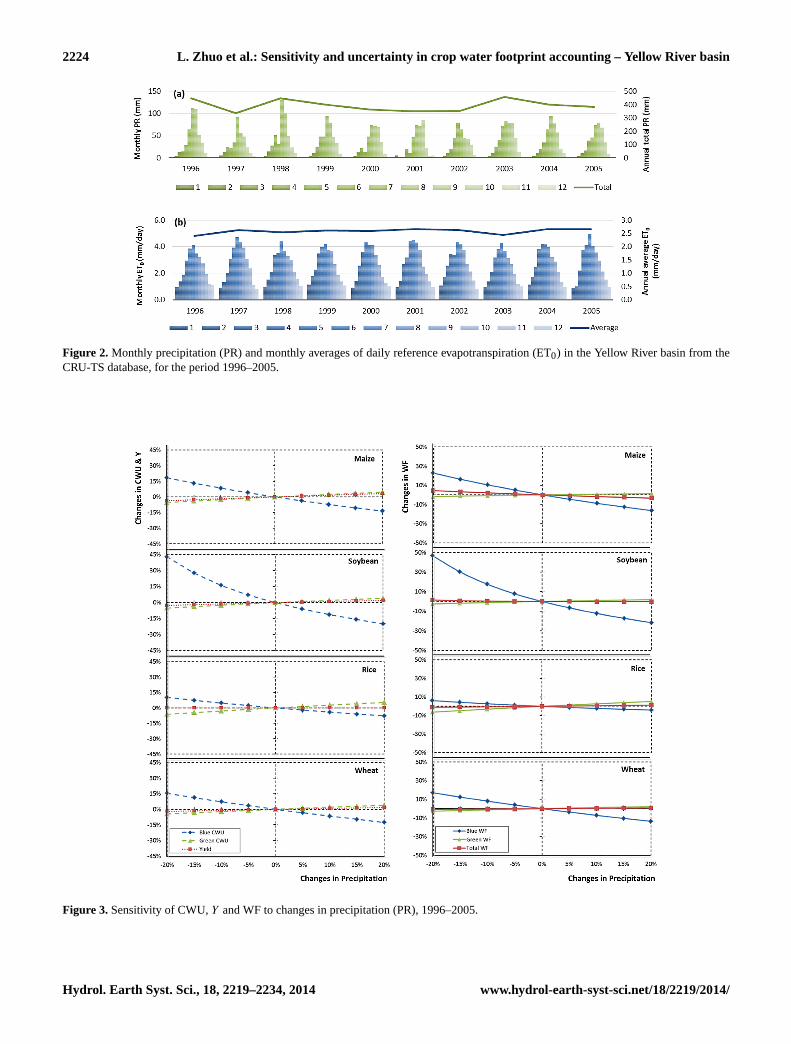
The GIS polygon data for the YRB were extracted fromthe HydroSHEDS data set (Lehner et al., 2008). Totalmonthly PR, monthly averages of daily ET0, number of wetdays, and daily minimum and maximum temperatures at30 by 30 arcmin resolution for 1996–2005 were extractedfrom CRU-TS-3.10 and 3.10.01 (Harris et al., 2014). Fig-ure 2 shows PR and ET0 for the YRB in the study pe-riod. Daily values of precipitation were generated from themonthly values using the CRU-dGen daily weather genera-tor model (Schuol and Abbaspour, 2007). Daily ET0 values
were derived from monthly average values by curve fittingto the monthly average through polynomial interpolation(Mekonnen and Hoekstra, 2011). Data on irrigated and rain-fed areas for each crop at a 5 by 5 arcmin resolution were ob-tained from the MIRCA2000 data set (Portmann et al., 2010).Crop areas and yields within the YRB from MIRCA2000were scaled to fit yearly agriculture statistics per province ofChina (MAPRC, 2009; NBSC, 2006, 2007). Total availablesoil water capacity at a spatial resolution of 5 by 5 arcmin wasobtained from the ISRIC-WISE version 1.2 data set (Batjes,2012).
4 Results
4.1 Sensitivity of CWU,Y , and WF to variability ofinput variables
4.1.1 Sensitivity to variability of precipitation (PR)
The average sensitivities of CWU,Y , and WF to variabilityof precipitation for the study period were assessed by vary-ing the precipitation between±20 % as shown in Fig. 3. Anoverestimation in precipitation leads to a small overestima-tion of green WF and a relatively large underestimation ofblue WF. A similar result was found for maize in the Po Val-ley of Italy by Bocchiola et al. (2013). The sensitivity of WFto input variability is defined by the combined effects on theCWU andY . Figure 3 shows the overall result for the YRB,covering both rain-fed and irrigated cropping.
For irrigated agriculture, a reduction in green CWU due tosmaller precipitation will be compensated with an increasedblue CWU, keeping total CWU andY unchanged. Therefore,the changes inY were due to the changes in the yields inrain-fed agriculture. The relative changes in total WF werealways smaller than±5 % because of the opposite directionof sensitivities of green and blue WF, as well as the domina-tion of green WF in the total. In addition, in terms of wheatonly, bothY and total WF decreased with less precipitation.Purposes of modern agriculture are mainly keeping or im-proving the crop production as well as reducing water use.The instance for wheat indicates thatY (mass of a crop perhectare) might decrease in certain climate situations in prac-tice although the WF (referring to drops of water used permass of crop) decreased. On the other hand, it can be notedthat the sensitivity of CWU,Y , and WF to input variabil-ity differs across crop types, especially evident in blue WF.Regarding the four crops considered, blue WF of soybean ismost sensitive to variability in precipitation and blue WF ofrice is least sensitive. The explanation lies in the share of blueWF in total WF. At basin level, the blue WF of soybean ac-counted for about 9 % of the total WF, while the blue WF ofrice was around 44 % of the total, which is the highest bluewater fraction among the four crops. The larger sensitivity ofthe blue WF of soybean to change in precipitation compared
www.hydrol-earth-syst-sci.net/18/2219/2014/ Hydrol. Earth Syst. Sci., 18, 2219–2234, 2014
2224 L. Zhuo et al.: Sensitivity and uncertainty in crop water footprint accounting – Yellow River basin
Figure 2. Monthly precipitation (PR) and monthly averages of daily reference evapotranspiration (ET0) in the Yellow River basin from theCRU-TS database, for the period 1996–2005.
Figure 3. Sensitivity of CWU,Y and WF to changes in precipitation (PR), 1996–2005.
Hydrol. Earth Syst. Sci., 18, 2219–2234, 2014 www.hydrol-earth-syst-sci.net/18/2219/2014/
L. Zhuo et al.: Sensitivity and uncertainty in crop water footprint accounting – Yellow River basin 2225
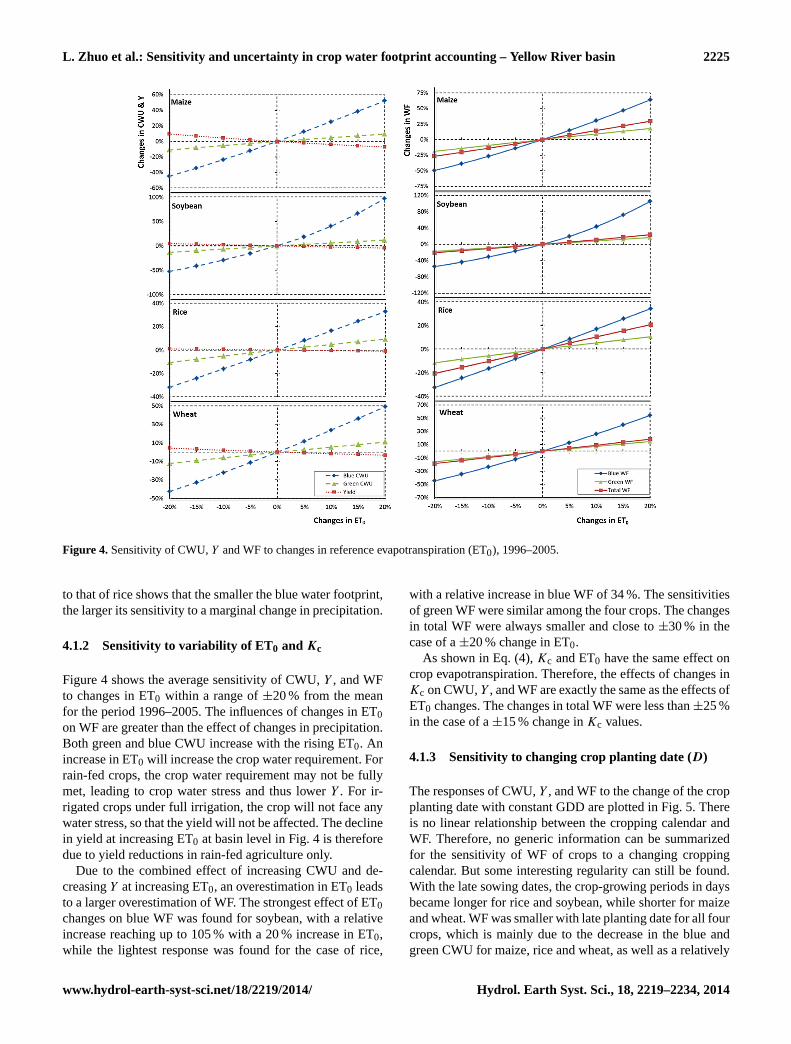
Figure 4. Sensitivity of CWU,Y and WF to changes in reference evapotranspiration (ET0), 1996–2005.
to that of rice shows that the smaller the blue water footprint,the larger its sensitivity to a marginal change in precipitation.
4.1.2 Sensitivity to variability of ET0 and Kc
Figure 4 shows the average sensitivity of CWU,Y , and WFto changes in ET0 within a range of±20 % from the meanfor the period 1996–2005. The influences of changes in ET0on WF are greater than the effect of changes in precipitation.Both green and blue CWU increase with the rising ET0. Anincrease in ET0 will increase the crop water requirement. Forrain-fed crops, the crop water requirement may not be fullymet, leading to crop water stress and thus lowerY . For ir-rigated crops under full irrigation, the crop will not face anywater stress, so that the yield will not be affected. The declinein yield at increasing ET0 at basin level in Fig. 4 is thereforedue to yield reductions in rain-fed agriculture only.
Due to the combined effect of increasing CWU and de-creasingY at increasing ET0, an overestimation in ET0 leadsto a larger overestimation of WF. The strongest effect of ET0changes on blue WF was found for soybean, with a relativeincrease reaching up to 105 % with a 20 % increase in ET0,while the lightest response was found for the case of rice,
with a relative increase in blue WF of 34 %. The sensitivitiesof green WF were similar among the four crops. The changesin total WF were always smaller and close to±30 % in thecase of a±20 % change in ET0.
As shown in Eq. (4),Kc and ET0 have the same effect oncrop evapotranspiration. Therefore, the effects of changes inKc on CWU,Y , and WF are exactly the same as the effects ofET0 changes. The changes in total WF were less than±25 %in the case of a±15 % change inKc values.
4.1.3 Sensitivity to changing crop planting date (D)
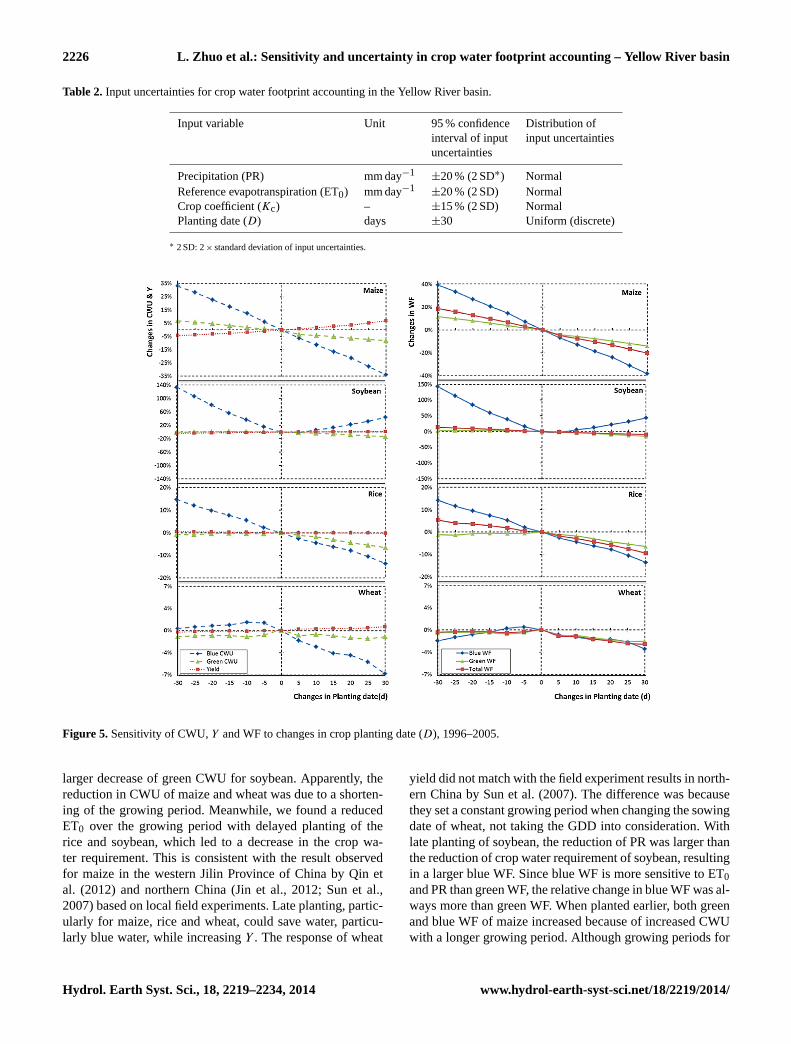
The responses of CWU,Y , and WF to the change of the cropplanting date with constant GDD are plotted in Fig. 5. Thereis no linear relationship between the cropping calendar andWF. Therefore, no generic information can be summarizedfor the sensitivity of WF of crops to a changing croppingcalendar. But some interesting regularity can still be found.With the late sowing dates, the crop-growing periods in daysbecame longer for rice and soybean, while shorter for maizeand wheat. WF was smaller with late planting date for all fourcrops, which is mainly due to the decrease in the blue andgreen CWU for maize, rice and wheat, as well as a relatively
www.hydrol-earth-syst-sci.net/18/2219/2014/ Hydrol. Earth Syst. Sci., 18, 2219–2234, 2014
2226 L. Zhuo et al.: Sensitivity and uncertainty in crop water footprint accounting – Yellow River basin
Table 2. Input uncertainties for crop water footprint accounting in the Yellow River basin.
Input variable Unit 95 % confidence Distribution ofinterval of input input uncertaintiesuncertainties
Precipitation (PR) mm day−1±20 % (2 SD∗) Normal
Reference evapotranspiration (ET0) mm day−1±20 % (2 SD) Normal
Crop coefficient (Kc) – ±15 % (2 SD) NormalPlanting date (D) days ±30 Uniform (discrete)
∗ 2 SD: 2× standard deviation of input uncertainties.
Figure 5. Sensitivity of CWU,Y and WF to changes in crop planting date (D), 1996–2005.
larger decrease of green CWU for soybean. Apparently, thereduction in CWU of maize and wheat was due to a shorten-ing of the growing period. Meanwhile, we found a reducedET0 over the growing period with delayed planting of therice and soybean, which led to a decrease in the crop wa-ter requirement. This is consistent with the result observedfor maize in the western Jilin Province of China by Qin etal. (2012) and northern China (Jin et al., 2012; Sun et al.,2007) based on local field experiments. Late planting, partic-ularly for maize, rice and wheat, could save water, particu-larly blue water, while increasingY . The response of wheat
yield did not match with the field experiment results in north-ern China by Sun et al. (2007). The difference was becausethey set a constant growing period when changing the sowingdate of wheat, not taking the GDD into consideration. Withlate planting of soybean, the reduction of PR was larger thanthe reduction of crop water requirement of soybean, resultingin a larger blue WF. Since blue WF is more sensitive to ET0and PR than green WF, the relative change in blue WF was al-ways more than green WF. When planted earlier, both greenand blue WF of maize increased because of increased CWUwith a longer growing period. Although growing periods for
Hydrol. Earth Syst. Sci., 18, 2219–2234, 2014 www.hydrol-earth-syst-sci.net/18/2219/2014/
L. Zhuo et al.: Sensitivity and uncertainty in crop water footprint accounting – Yellow River basin 2227
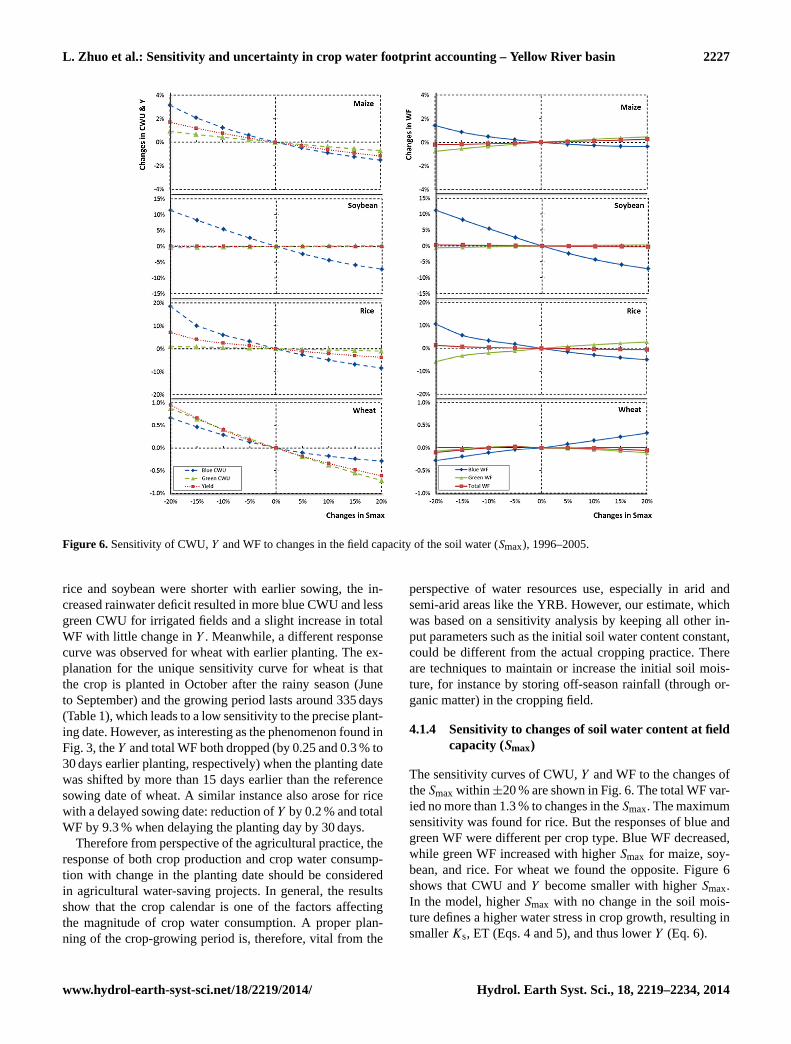
Figure 6. Sensitivity of CWU,Y and WF to changes in the field capacity of the soil water (Smax), 1996–2005.
rice and soybean were shorter with earlier sowing, the in-creased rainwater deficit resulted in more blue CWU and lessgreen CWU for irrigated fields and a slight increase in totalWF with little change inY . Meanwhile, a different responsecurve was observed for wheat with earlier planting. The ex-planation for the unique sensitivity curve for wheat is thatthe crop is planted in October after the rainy season (Juneto September) and the growing period lasts around 335 days(Table 1), which leads to a low sensitivity to the precise plant-ing date. However, as interesting as the phenomenon found inFig. 3, theY and total WF both dropped (by 0.25 and 0.3 % to30 days earlier planting, respectively) when the planting datewas shifted by more than 15 days earlier than the referencesowing date of wheat. A similar instance also arose for ricewith a delayed sowing date: reduction ofY by 0.2 % and totalWF by 9.3 % when delaying the planting day by 30 days.
Therefore from perspective of the agricultural practice, theresponse of both crop production and crop water consump-tion with change in the planting date should be consideredin agricultural water-saving projects. In general, the resultsshow that the crop calendar is one of the factors affectingthe magnitude of crop water consumption. A proper plan-ning of the crop-growing period is, therefore, vital from the
perspective of water resources use, especially in arid andsemi-arid areas like the YRB. However, our estimate, whichwas based on a sensitivity analysis by keeping all other in-put parameters such as the initial soil water content constant,could be different from the actual cropping practice. Thereare techniques to maintain or increase the initial soil mois-ture, for instance by storing off-season rainfall (through or-ganic matter) in the cropping field.
4.1.4 Sensitivity to changes of soil water content at fieldcapacity (Smax)
The sensitivity curves of CWU,Y and WF to the changes oftheSmax within ±20 % are shown in Fig. 6. The total WF var-ied no more than 1.3 % to changes in theSmax. The maximumsensitivity was found for rice. But the responses of blue andgreen WF were different per crop type. Blue WF decreased,while green WF increased with higherSmax for maize, soy-bean, and rice. For wheat we found the opposite. Figure 6shows that CWU andY become smaller with higherSmax.In the model, higherSmax with no change in the soil mois-ture defines a higher water stress in crop growth, resulting insmallerKs, ET (Eqs. 4 and 5), and thus lowerY (Eq. 6).
www.hydrol-earth-syst-sci.net/18/2219/2014/ Hydrol. Earth Syst. Sci., 18, 2219–2234, 2014
2228 L. Zhuo et al.: Sensitivity and uncertainty in crop water footprint accounting – Yellow River basin
4.1.5 Sensitivity to parameters for yield simulation
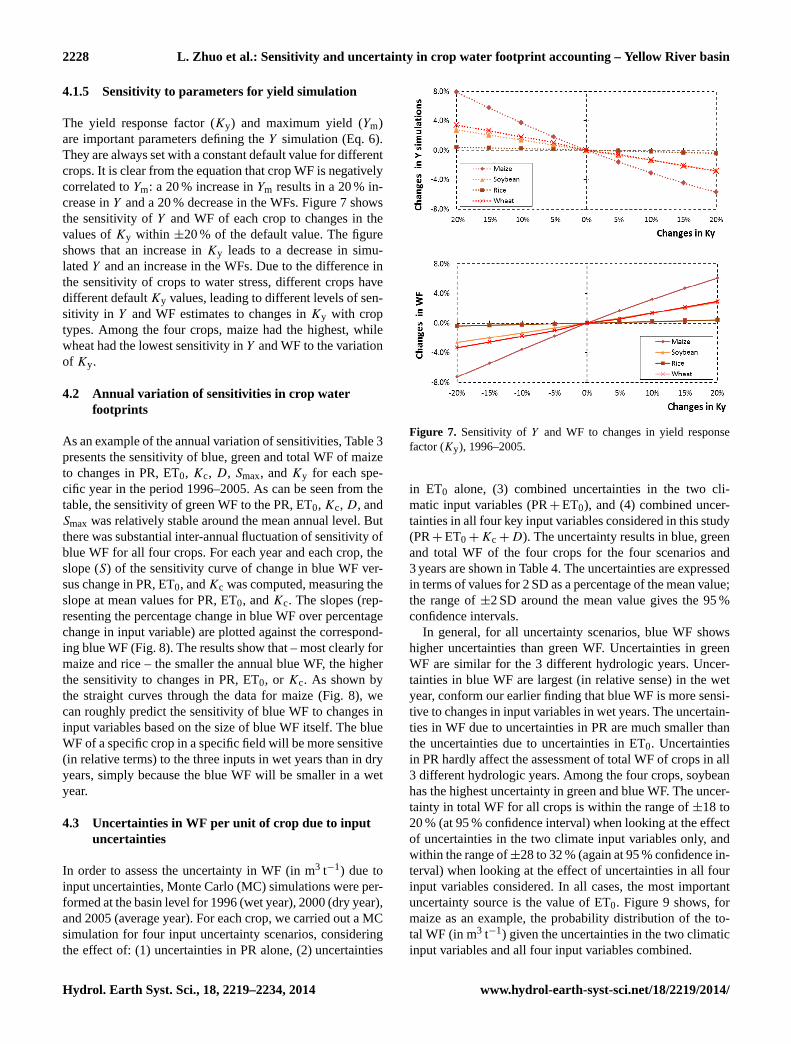
The yield response factor (Ky) and maximum yield (Ym)are important parameters defining theY simulation (Eq. 6).They are always set with a constant default value for differentcrops. It is clear from the equation that crop WF is negativelycorrelated toYm: a 20 % increase inYm results in a 20 % in-crease inY and a 20 % decrease in the WFs. Figure 7 showsthe sensitivity ofY and WF of each crop to changes in thevalues ofKy within ±20 % of the default value. The figureshows that an increase inKy leads to a decrease in simu-latedY and an increase in the WFs. Due to the difference inthe sensitivity of crops to water stress, different crops havedifferent defaultKy values, leading to different levels of sen-sitivity in Y and WF estimates to changes inKy with croptypes. Among the four crops, maize had the highest, whilewheat had the lowest sensitivity inY and WF to the variationof Ky.
4.2 Annual variation of sensitivities in crop waterfootprints
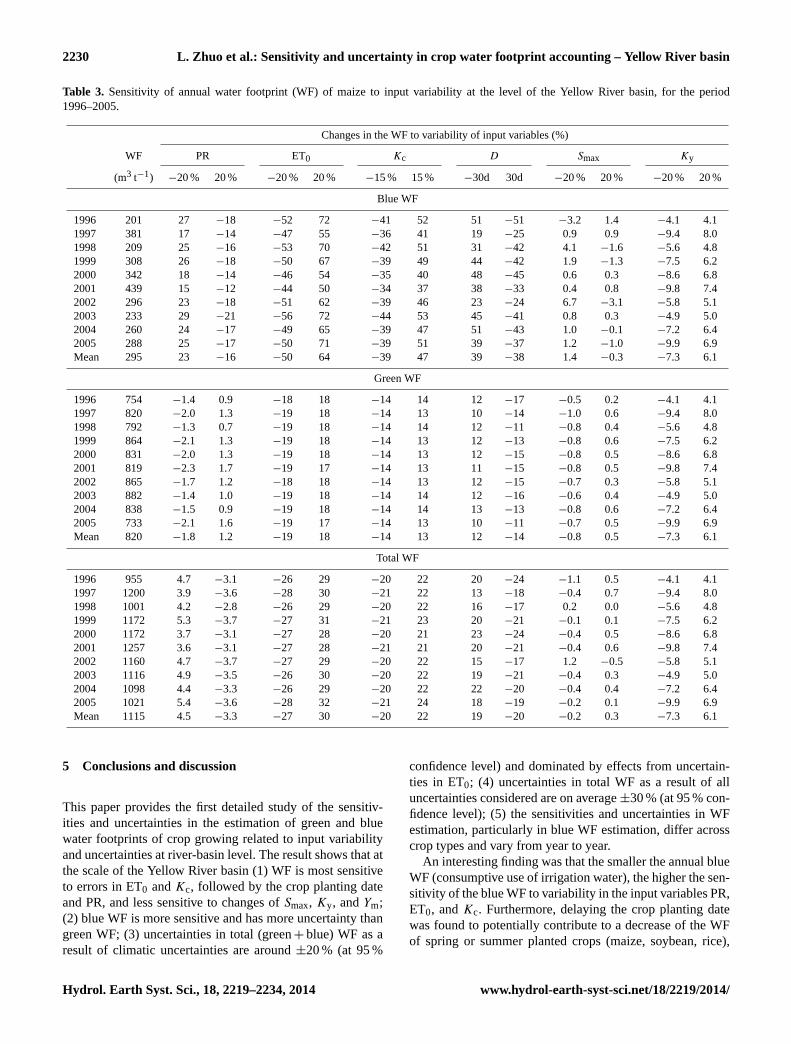
As an example of the annual variation of sensitivities, Table 3presents the sensitivity of blue, green and total WF of maizeto changes in PR, ET0, Kc, D, Smax, andKy for each spe-cific year in the period 1996–2005. As can be seen from thetable, the sensitivity of green WF to the PR, ET0, Kc, D, andSmax was relatively stable around the mean annual level. Butthere was substantial inter-annual fluctuation of sensitivity ofblue WF for all four crops. For each year and each crop, theslope (S) of the sensitivity curve of change in blue WF ver-sus change in PR, ET0, andKc was computed, measuring theslope at mean values for PR, ET0, andKc. The slopes (rep-resenting the percentage change in blue WF over percentagechange in input variable) are plotted against the correspond-ing blue WF (Fig. 8). The results show that – most clearly formaize and rice – the smaller the annual blue WF, the higherthe sensitivity to changes in PR, ET0, or Kc. As shown bythe straight curves through the data for maize (Fig. 8), wecan roughly predict the sensitivity of blue WF to changes ininput variables based on the size of blue WF itself. The blueWF of a specific crop in a specific field will be more sensitive(in relative terms) to the three inputs in wet years than in dryyears, simply because the blue WF will be smaller in a wetyear.
4.3 Uncertainties in WF per unit of crop due to inputuncertainties
In order to assess the uncertainty in WF (in m3 t−1) due toinput uncertainties, Monte Carlo (MC) simulations were per-formed at the basin level for 1996 (wet year), 2000 (dry year),and 2005 (average year). For each crop, we carried out a MCsimulation for four input uncertainty scenarios, consideringthe effect of: (1) uncertainties in PR alone, (2) uncertainties
Figure 7. Sensitivity of Y and WF to changes in yield responsefactor (Ky), 1996–2005.
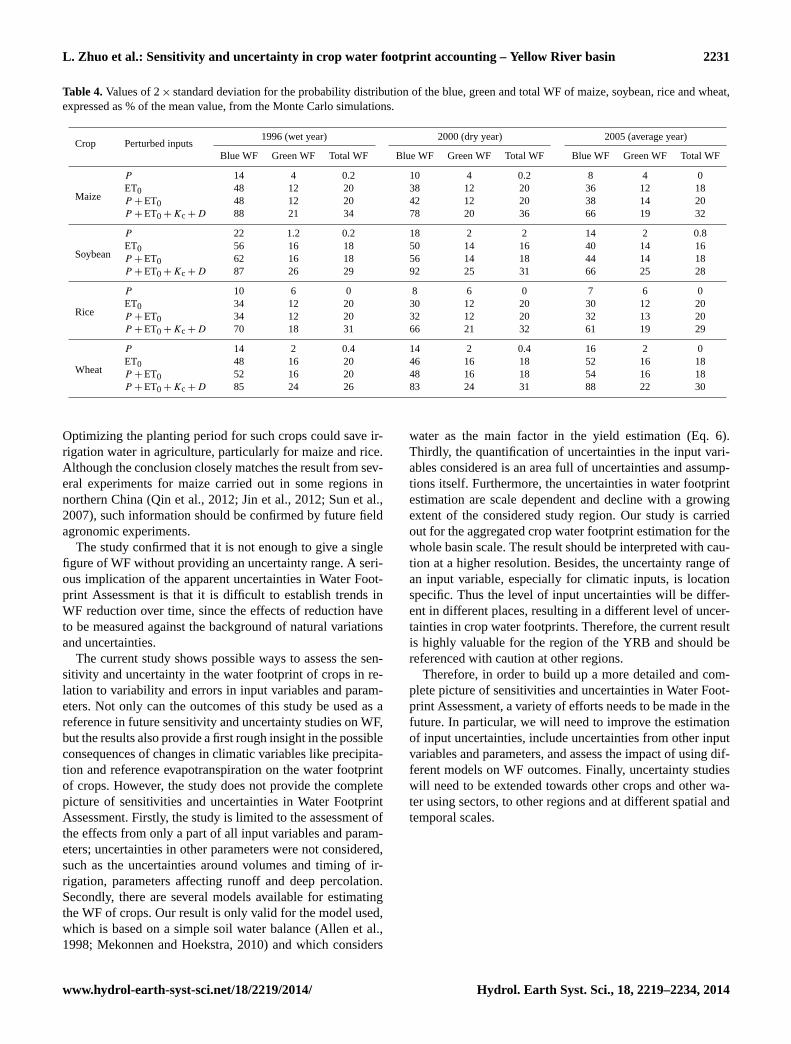
in ET0 alone, (3) combined uncertainties in the two cli-matic input variables (PR+ ET0), and (4) combined uncer-tainties in all four key input variables considered in this study(PR+ ET0 + Kc + D). The uncertainty results in blue, greenand total WF of the four crops for the four scenarios and3 years are shown in Table 4. The uncertainties are expressedin terms of values for 2 SD as a percentage of the mean value;the range of±2 SD around the mean value gives the 95 %confidence intervals.
In general, for all uncertainty scenarios, blue WF showshigher uncertainties than green WF. Uncertainties in greenWF are similar for the 3 different hydrologic years. Uncer-tainties in blue WF are largest (in relative sense) in the wetyear, conform our earlier finding that blue WF is more sensi-tive to changes in input variables in wet years. The uncertain-ties in WF due to uncertainties in PR are much smaller thanthe uncertainties due to uncertainties in ET0. Uncertaintiesin PR hardly affect the assessment of total WF of crops in all3 different hydrologic years. Among the four crops, soybeanhas the highest uncertainty in green and blue WF. The uncer-tainty in total WF for all crops is within the range of±18 to20 % (at 95 % confidence interval) when looking at the effectof uncertainties in the two climate input variables only, andwithin the range of±28 to 32 % (again at 95 % confidence in-terval) when looking at the effect of uncertainties in all fourinput variables considered. In all cases, the most importantuncertainty source is the value of ET0. Figure 9 shows, formaize as an example, the probability distribution of the to-tal WF (in m3 t−1) given the uncertainties in the two climaticinput variables and all four input variables combined.
Hydrol. Earth Syst. Sci., 18, 2219–2234, 2014 www.hydrol-earth-syst-sci.net/18/2219/2014/

L. Zhuo et al.: Sensitivity and uncertainty in crop water footprint accounting – Yellow River basin 2229
Figure 8. The slope (S) of the sensitivity curve for the blue WF for each crop for each year in the period 1996–2005 (vertical axis) plottedagainst the blue WF of the crop in the respective year (x axis). The graph on the left shows the relative sensitivity of blue WF to PR; thegraph on the right shows the relative sensitivity of blue WF to ET0 or Kc. The sensitivities to ET0 andKc were the same. The trend lines inboth graphs refer to the data for maize.
Figure 9. Probability distribution of the total WF of maize given the combined uncertainties in PR and ET0 (graphs at the left) and given thecombined uncertainties in PR, ET0, Kc andD (graphs at the right), for the years 1996, 2000 and 2005.
www.hydrol-earth-syst-sci.net/18/2219/2014/ Hydrol. Earth Syst. Sci., 18, 2219–2234, 2014
2230 L. Zhuo et al.: Sensitivity and uncertainty in crop water footprint accounting – Yellow River basin
Table 3. Sensitivity of annual water footprint (WF) of maize to input variability at the level of the Yellow River basin, for the period1996–2005.
Changes in the WF to variability of input variables (%)
WF PR ET0 Kc D Smax Ky
(m3 t−1) −20 % 20 % −20 % 20 % −15 % 15 % −30d 30d −20 % 20 % −20 % 20 %
Blue WF
1996 201 27 −18 −52 72 −41 52 51 −51 −3.2 1.4 −4.1 4.11997 381 17 −14 −47 55 −36 41 19 −25 0.9 0.9 −9.4 8.01998 209 25 −16 −53 70 −42 51 31 −42 4.1 −1.6 −5.6 4.81999 308 26 −18 −50 67 −39 49 44 −42 1.9 −1.3 −7.5 6.22000 342 18 −14 −46 54 −35 40 48 −45 0.6 0.3 −8.6 6.82001 439 15 −12 −44 50 −34 37 38 −33 0.4 0.8 −9.8 7.42002 296 23 −18 −51 62 −39 46 23 −24 6.7 −3.1 −5.8 5.12003 233 29 −21 −56 72 −44 53 45 −41 0.8 0.3 −4.9 5.02004 260 24 −17 −49 65 −39 47 51 −43 1.0 −0.1 −7.2 6.42005 288 25 −17 −50 71 −39 51 39 −37 1.2 −1.0 −9.9 6.9Mean 295 23 −16 −50 64 −39 47 39 −38 1.4 −0.3 −7.3 6.1
Green WF
1996 754 −1.4 0.9 −18 18 −14 14 12 −17 −0.5 0.2 −4.1 4.11997 820 −2.0 1.3 −19 18 −14 13 10 −14 −1.0 0.6 −9.4 8.01998 792 −1.3 0.7 −19 18 −14 14 12 −11 −0.8 0.4 −5.6 4.81999 864 −2.1 1.3 −19 18 −14 13 12 −13 −0.8 0.6 −7.5 6.22000 831 −2.0 1.3 −19 18 −14 13 12 −15 −0.8 0.5 −8.6 6.82001 819 −2.3 1.7 −19 17 −14 13 11 −15 −0.8 0.5 −9.8 7.42002 865 −1.7 1.2 −18 18 −14 13 12 −15 −0.7 0.3 −5.8 5.12003 882 −1.4 1.0 −19 18 −14 14 12 −16 −0.6 0.4 −4.9 5.02004 838 −1.5 0.9 −19 18 −14 14 13 −13 −0.8 0.6 −7.2 6.42005 733 −2.1 1.6 −19 17 −14 13 10 −11 −0.7 0.5 −9.9 6.9Mean 820 −1.8 1.2 −19 18 −14 13 12 −14 −0.8 0.5 −7.3 6.1
Total WF
1996 955 4.7 −3.1 −26 29 −20 22 20 −24 −1.1 0.5 −4.1 4.11997 1200 3.9 −3.6 −28 30 −21 22 13 −18 −0.4 0.7 −9.4 8.01998 1001 4.2 −2.8 −26 29 −20 22 16 −17 0.2 0.0 −5.6 4.81999 1172 5.3 −3.7 −27 31 −21 23 20 −21 −0.1 0.1 −7.5 6.22000 1172 3.7 −3.1 −27 28 −20 21 23 −24 −0.4 0.5 −8.6 6.82001 1257 3.6 −3.1 −27 28 −21 21 20 −21 −0.4 0.6 −9.8 7.42002 1160 4.7 −3.7 −27 29 −20 22 15 −17 1.2 −0.5 −5.8 5.12003 1116 4.9 −3.5 −26 30 −20 22 19 −21 −0.4 0.3 −4.9 5.02004 1098 4.4 −3.3 −26 29 −20 22 22 −20 −0.4 0.4 −7.2 6.42005 1021 5.4 −3.6 −28 32 −21 24 18 −19 −0.2 0.1 −9.9 6.9Mean 1115 4.5 −3.3 −27 30 −20 22 19 −20 −0.2 0.3 −7.3 6.1
5 Conclusions and discussion
This paper provides the first detailed study of the sensitiv-ities and uncertainties in the estimation of green and bluewater footprints of crop growing related to input variabilityand uncertainties at river-basin level. The result shows that atthe scale of the Yellow River basin (1) WF is most sensitiveto errors in ET0 andKc, followed by the crop planting dateand PR, and less sensitive to changes ofSmax, Ky, andYm;(2) blue WF is more sensitive and has more uncertainty thangreen WF; (3) uncertainties in total (green+ blue) WF as aresult of climatic uncertainties are around±20 % (at 95 %
confidence level) and dominated by effects from uncertain-ties in ET0; (4) uncertainties in total WF as a result of alluncertainties considered are on average±30 % (at 95 % con-fidence level); (5) the sensitivities and uncertainties in WFestimation, particularly in blue WF estimation, differ acrosscrop types and vary from year to year.
An interesting finding was that the smaller the annual blueWF (consumptive use of irrigation water), the higher the sen-sitivity of the blue WF to variability in the input variables PR,ET0, andKc. Furthermore, delaying the crop planting datewas found to potentially contribute to a decrease of the WFof spring or summer planted crops (maize, soybean, rice),
Hydrol. Earth Syst. Sci., 18, 2219–2234, 2014 www.hydrol-earth-syst-sci.net/18/2219/2014/
L. Zhuo et al.: Sensitivity and uncertainty in crop water footprint accounting – Yellow River basin 2231
Table 4.Values of 2× standard deviation for the probability distribution of the blue, green and total WF of maize, soybean, rice and wheat,expressed as % of the mean value, from the Monte Carlo simulations.
Crop Perturbed inputs1996 (wet year) 2000 (dry year) 2005 (average year)
Blue WF Green WF Total WF Blue WF Green WF Total WF Blue WF Green WF Total WF
Maize
P 14 4 0.2 10 4 0.2 8 4 0ET0 48 12 20 38 12 20 36 12 18P + ET0 48 12 20 42 12 20 38 14 20P + ET0 + Kc + D 88 21 34 78 20 36 66 19 32
Soybean
P 22 1.2 0.2 18 2 2 14 2 0.8ET0 56 16 18 50 14 16 40 14 16P + ET0 62 16 18 56 14 18 44 14 18P + ET0 + Kc + D 87 26 29 92 25 31 66 25 28
Rice
P 10 6 0 8 6 0 7 6 0ET0 34 12 20 30 12 20 30 12 20P + ET0 34 12 20 32 12 20 32 13 20P + ET0 + Kc + D 70 18 31 66 21 32 61 19 29
Wheat
P 14 2 0.4 14 2 0.4 16 2 0ET0 48 16 20 46 16 18 52 16 18P + ET0 52 16 20 48 16 18 54 16 18P + ET0 + Kc + D 85 24 26 83 24 31 88 22 30
Optimizing the planting period for such crops could save ir-rigation water in agriculture, particularly for maize and rice.Although the conclusion closely matches the result from sev-eral experiments for maize carried out in some regions innorthern China (Qin et al., 2012; Jin et al., 2012; Sun et al.,2007), such information should be confirmed by future fieldagronomic experiments.
The study confirmed that it is not enough to give a singlefigure of WF without providing an uncertainty range. A seri-ous implication of the apparent uncertainties in Water Foot-print Assessment is that it is difficult to establish trends inWF reduction over time, since the effects of reduction haveto be measured against the background of natural variationsand uncertainties.
The current study shows possible ways to assess the sen-sitivity and uncertainty in the water footprint of crops in re-lation to variability and errors in input variables and param-eters. Not only can the outcomes of this study be used as areference in future sensitivity and uncertainty studies on WF,but the results also provide a first rough insight in the possibleconsequences of changes in climatic variables like precipita-tion and reference evapotranspiration on the water footprintof crops. However, the study does not provide the completepicture of sensitivities and uncertainties in Water FootprintAssessment. Firstly, the study is limited to the assessment ofthe effects from only a part of all input variables and param-eters; uncertainties in other parameters were not considered,such as the uncertainties around volumes and timing of ir-rigation, parameters affecting runoff and deep percolation.Secondly, there are several models available for estimatingthe WF of crops. Our result is only valid for the model used,which is based on a simple soil water balance (Allen et al.,1998; Mekonnen and Hoekstra, 2010) and which considers
water as the main factor in the yield estimation (Eq. 6).Thirdly, the quantification of uncertainties in the input vari-ables considered is an area full of uncertainties and assump-tions itself. Furthermore, the uncertainties in water footprintestimation are scale dependent and decline with a growingextent of the considered study region. Our study is carriedout for the aggregated crop water footprint estimation for thewhole basin scale. The result should be interpreted with cau-tion at a higher resolution. Besides, the uncertainty range ofan input variable, especially for climatic inputs, is locationspecific. Thus the level of input uncertainties will be differ-ent in different places, resulting in a different level of uncer-tainties in crop water footprints. Therefore, the current resultis highly valuable for the region of the YRB and should bereferenced with caution at other regions.
Therefore, in order to build up a more detailed and com-plete picture of sensitivities and uncertainties in Water Foot-print Assessment, a variety of efforts needs to be made in thefuture. In particular, we will need to improve the estimationof input uncertainties, include uncertainties from other inputvariables and parameters, and assess the impact of using dif-ferent models on WF outcomes. Finally, uncertainty studieswill need to be extended towards other crops and other wa-ter using sectors, to other regions and at different spatial andtemporal scales.
www.hydrol-earth-syst-sci.net/18/2219/2014/ Hydrol. Earth Syst. Sci., 18, 2219–2234, 2014
2232 L. Zhuo et al.: Sensitivity and uncertainty in crop water footprint accounting – Yellow River basin
Acknowledgements.The authors would like to thank reviewerTuomas J. Mattila, an anonymous reviewer and editor for valuablecomments and suggestions. L. Zhuo is grateful for the scholar-ship she received from the China Scholarship Council (CSC),No. 2011630181.
Edited by: G. H. de Rooij
References
Ahn, H.: Sensitivity for correlated input variables and propagatederrors in evapotranspiration estimates from a humid region, Wa-ter Resour. Res., 32, 2507–2516, 1996.
Aldaya, M. M. and Llamas, M. R.: Water footprint analysis forthe Guadiana river basin, Value of Water research Report SeriesNo. 35, UNESCO-IHE, Delft, the Netherlands, 2008.
Allen, R. G., Pereira, L. S., Raes, D., and Smith, M.: Crop evapo-transpiration: guidelines for computing crop water requirements,FAO Drainage and Irrigation Paper 56, Food and Agriculture Or-ganization, Rome, Italy, 1998.
Batjes, N. H.: ISRIC-WISE global data set of derived soil propertieson a 5 by 5 arc-minutes grid (version 1.2), Report 2012/01, avail-able at:www.isric.org, ISRIC – World Soil Information, Wa-geningen, the Netherlands, 2012.
Bocchiola, D., Nana, E., and Soncini, A.: Impact of climate changescenarios on crop yield and water footprint of maize in the Povalley of Italy, Agr. Water Manage., 116, 50–61, 2013.
Bulsink, F., Hoekstra, A. Y., and Booij, M. J.: The water footprintof Indonesian provinces related to the consumption of crop prod-ucts, Hydrol. Earth Syst. Sci., 14, 119–128, doi:10.5194/hess-14-119-2010, 2010.
Cai, X. M., Yang, Y.-C. E., Ringler, C., Zhao, J. S., and You, L. Z.:Agricultural water productivity assessment for the Yellow RiverBasin, Agr. Water Manage., 98, 1297–1306, 2011.
Chapagain, A. K. and Hoekstra, A. Y.: Water footprints of nations,Value of Water Research Report Series No. 16, UNESCO-IHE,Delft, the Netherlands, 2004.
Chen, Y., Guo, G., Wang, G., Kang, S., Luo, H., and Zhang, D.:Main crop water requirement and irrigation of China, Hydraulicand Electric Press, Beijing, China, 1995.
CMA: SURF_CLI_CHN_MUL_MON_CES v3.0, China Meteoro-logical Data Sharing Service System, Chinese MeteorologicalAdministration, available at:http://cdc.cma.gov.cn(last access:November 2011), 2008.
CMWR: China Water Resources Bulletin 2009, China Ministry ofWater Resources, available at:www.mwr.gov.cn, last access: Oc-tober 2010.
Doorenbos, J. and Kassam, A. H.: Yield response to water, FAODrainage and Irrigation Paper 33, FAO, Rome, Italy, 1979.
Droogers, P. and Allen, R. G.: Estimating reference evapotranspi-ration under inaccurate data conditions, Irrig. Drain., 16, 33–45,2002.
Estévez, J., Gavilán, P., and Berengena, J.: Sensitivity analysis of aPenman-Monteith type equation to estimate reference evapotran-spiration in southern Spain, Hydrol. Process., 23, 3342–3353,2009.
Falkenmark, M. and Widstrand, C.: Population and water resources:a delicate balance. Population Bulletin, Population ReferenceBureau, Washington, D.C., USA, 1992.
Fekete, B. M., Vörösmarty, C. J., Roads, J. O., and Willmott, C.J.: Uncertainties in precipitation and their impacts on runoff esti-mates, J. Climate, 17, 294–304, 2004.
Feng, K. S., Siu, Y. L., Guan, D., and Hubacek, K.: Assessing re-gional virtual water flows and water footprints in the YellowRiver Basin, China: A consumption based approach, Appl. Ge-ogr., 32, 691–701, 2012.
Galli, A., Wiedmann, T., Ercin, E., Knoblauch, D., Ewing, B., andGiljum, S.: Integrating ecological, carbon and water footprintinto a “footprint family” of indicators: Definition and role intracking human pressure on the planet, Ecol. Indic., 16, 100–112,2012.
Ge, L., Xie, G., Zhang, C., Li, S., Qi, Y., Cao, S., and He, T.: Anevaluation of China’s water footprint, Water Resour. Manage.,25, 2633–2647, 2011.
Goyal, R. K.: Sensitivity of evapotranspiration to global warming: acase study of arid zone of Rajasthan (India), Agr. Water Manage.,69, 1–11, 2004.
Guieysse, B., Béchet, Q., and Shilton, A.: Variability and uncer-tainty in water demand and water footprint assessments of freshalgae cultivation based on case studies from five climatic regions,Bioresource Technol. 128, 317–323, 2013.
Hamby, D. M.: A review of techniques for parameter sensitivityanalysis of environmental models, Environ. Monit. Assess., 32,135–154, 1994.
Harris, I., Jones, P. D., Osborn, T. J., and Lister, D. H.: Up-dated high-resolution grids of monthly climatic observations– the CRU TS3.10 Dataset, Int. J. Climatol., 34, 623–642,doi:10.1002/joc.3711, 2014.
Hoekstra, A. Y. (Ed.): Virtual water trade, in: Proceedings of the In-ternational Expert Meeting on Virtual Water Trade, IHE Delft,the Netherlands, 12–13 December 2002, Value of Water Re-search Report Series No. 12, UNESCO-IHE, Delft, the Nether-lands, 2003.
Hoekstra, A. Y. and Chapagain, A. K.: Water footprints of nations:water use by people as a function of their consumption pattern,Water Resour. Manage., 21, 35–48, 2007a.
Hoekstra, A. Y. and Chapagain, A. K.: The water footprints of Mo-rocco and the Netherlands: Global water use as a result of do-mestic consumption of agricultural commodities, Ecol. Econ.,64, 143–151, 2007b.
Hoekstra, A. Y. and Mekonnen, M. M.: The water footprint of hu-manity, P. Natl. Acad. Sci. USA, 109, 3232–3237, 2012.
Hoekstra, A. Y., Chapagain, A. K., Aldaya, M. M., and Mekonnen,M. M.: The water footprint assessment manual: Setting the globalstandard, Earthscan, London, UK, 2011.
Hoekstra, A. Y., Mekonnen, M. M., Chapagain, A. K., Mathews, R.E., and Richter, B. D.: Global monthly water scarcity: Blue waterfootprints versus blue water availability, PLoS ONE, 7, e32688,doi:10.1371/journal.pone.0032688, 2012.
Jagtap, S. S. and Jones, J. W.: Stability of crop coefficients underdifferent climate and irrigation management practices, IrrigationSci., 10, 231–244, 1989.
Jensen, M. E., Burman, R. D., and Allen, R. G. (Eds.): Evaporationand irrigation water requirements, ASCE Manuals and Reportson Engineering Practices No. 70, American Society of Civil En-gineers, New York, USA, 1990.
Jin, L., Cui, H., Li, B., Zhang, J., Dong, S., and Liu, P.: Effects ofintegrated agronomic management practices on yield and nitro-
Hydrol. Earth Syst. Sci., 18, 2219–2234, 2014 www.hydrol-earth-syst-sci.net/18/2219/2014/
L. Zhuo et al.: Sensitivity and uncertainty in crop water footprint accounting – Yellow River basin 2233
gen efficiency of summer maize in North China, FIELD CROPRES, 134, 30–35, 2012.
Kampman, D. A., Hoekstra, A. Y., and Krol, M. S.: The water foot-print of India, Value of Water Research Report Series No. 32,UNESCO-IHE, Delft, the Netherlands, 2008.
Lehner, B., Verdin, K., and Jarvis, A.: New global hydrography de-rived from space borne elevation data, Eos, 89, 93–94, 2008.
Liu, J. and Savenije, H. H. G.: Food consumption patterns and theireffect on water requirement in China, Hydrol. Earth Syst. Sci.,12, 887–898, doi:10.5194/hess-12-887-2008, 2008.
Liu, Q., Yang, Z., Cui, B., and Sun, S.: The temporal trends of refer-ence evapotranspiration and its sensitivity to key meteorologicalvariables in the Yellow River Basin, China, Hydrol. Process., 24,2171–2181, 2010.
Ma, J., Hoekstra, A. Y., Wang, H., Chapagain, A. K., and Wang, D.:Virtual versus real water transfers within China, Philos. T. Roy.Soc. B, 361, 835–842, 2006.
MAPRC: Sixty years agricultural statistics of New China, Ministryof Agriculture of the People’s Republic of China, China Agricul-ture Press, Beijing, China, 2009.
Mattila, T., Leskinen, P., Soimakallio, S., and Sironen, S.: Uncer-tainty in environmentally conscious decision making: beer orwine?, Int. J. Life Cycle Ass., 17, 696–705, 2012.
McMaster, G. S. and Wilhelm, W. W.: Growing degree days: oneequation, two interpretations, Agr. Forest. Meteorol., 87, 297–300, 1997.
Mekonnen, M. M. and Hoekstra, A. Y.: A global and high-resolutionassessment of the green, blue and grey water footprint of wheat,Hydrol. Earth Syst. Sci., 14, 1259–1276, doi:10.5194/hess-14-1259-2010, 2010.
Mekonnen, M. M. and Hoekstra, A. Y.: The green, blue andgrey water footprint of crops and derived crop products, Hy-drol. Earth Syst. Sci., 15, 1577–1600, doi:10.5194/hess-15-1577-2011, 2011.
Meyer, S. J., Hubbard, K. G., and Wilhite, D. A.: Estimating po-tential evapotranspiration: the effect of random and systematicerrors, Agr. Forest. Meteorol., 46, 285–296, 1989.
Meyer, V. R.: Measurement uncertainty, J. Chromatogr. A, 1158,15–24, 2007.
NBSC: China agricultural statistical yearbook assembly 1949–2004, National Bureau of Statistics of China, China StatisticsPress, Beijing, China, 2006.
NBSC: China Rural statistical yearbook 2006, National Bureau ofStatistics of China, China Statistics Press, Beijing, China, 2007.
Oki, T. and Kanae, S.: Global hydrological cycles and world waterresources, Science, 313, 1068–1072, 2006.
Parker, R. W. R. and Tyedmers, P. H.: Uncertainty and natural vari-ability in the ecological footprint of fisheries: A case study of re-duction fisheries for meal and oil, Ecol. Indic., 16, 76–83, 2012.
Phillips, D. L. and Marks, D. G.: Spatial uncertainty analysis: prop-agation of interpolation errors in spatially distributed models,Ecol. Model., 91, 213–229, 1996.
Portmann, F. T., Siebert, S., and Döll, P.: MIRCA2000 – Globalmonthly irrigated and rain-fed crop areas around the year2000: A new high-resolution data set for agricultural and hy-drological modeling, Global Biogeochem. Cy., 24, GB1011,doi:10.1029/2008GB003435, 2010.
Qin, L. J., Jin, Y. H., and Duan, P. L.: Impact of different plantingdates on green water footprint of maize in western Jilin Province,Acta Ecol. Sin., 32, 7375–7382, 2012.
Raes, D., Steduto, P., Hisiao, T. C., and Fereres, E.: Reference Man-ual, Annex I – AquaCrop, Version 4.0, FAO, Land and WaterDivision, Rome, Italy, 2012.
Reynolds, C. A., Yitayew, M., Slack, D. C., Hutchinson, C. F.,Huete, A., and Petersen, M. S.: Estimating crop yields and pro-duction by integrating the FAO Crop Specific Water Balancemodel with real-time satellite data and ground-based ancillarydata, Int. J. Remote Sens., 21, 3487–3508, 2000.
Ringler, C., Cai, X. M., Wang, J. X., Ahmed, A., Xue, Y. P., Xu, Z.X., Yang, E. T., Zhao, J. S., Zhu, T. J., Cheng, L., Fu, Y. F., Fu,X. F., Gu, X. W. and You, L. Z.: Yellow River basin: living withscarcity, Water Int., 35, 681–701, 2010.
Röös, E., Sundberg, C., and Hansson, P. A.: Uncertainties in thecarbon footprint of food products: a case study on table potatoes,Int. J. Life Cycle Ass., 15, 478–488, 2010.
Röös, E., Sundberg, C., and Hansson, P. A.: Uncertainties in the car-bon footprint of refined wheat products: a case study on Swedishpasta, Int. J. Life Cycle Ass., 16, 338–350, 2011.
Schuol, J. and Abbaspour, K. C.: Using monthly weather statis-tics to generate daily data in a SWAT model application to WestAfrica, Ecol. Model., 201, 301–311, 2007.
Siebert, S. and Döll, P.: Quantifying blue and green virtual watercontents in global crop production as well as potential productionlosses without irrigation, J. Hydrol., 384, 198–217, 2010.
Sun, H., Zhang, X., Chen, S., Pei, D., and Liu, C.: Effects of har-vest and sowing time on the performance of the rotation of win-ter wheat-summer maize in the North China Plain, IND CROPPROD, 25, 239–247, 2007.
Sun, S. K., Wu, P. T., Wang, Y. B., and Zhao, X. N.: Temporal vari-ability of water footprint for maize production: The case of Bei-jing from 1978 to 2008, Water Resour. Manage., 27, 2447–2463,2013.
Sun, X. Y., Newham, L. T. H., Croke, B. F. W., and Norton, J. P.:Three complementary methods for sensitivity analysis of a waterquality model, Environ. Model. Softw., 37, 19–29, 2012.
Thomas, A.: Development and properties of 0.25-degree griddedevapotranspiration data fields of China for hydrological studies,J. Hydrol., 358, 145–158, 2008.
Troutman, B. M.: Errors and Parameter Estimation in Precipitation–Runoff Modeling: 1. Theory, Water Resour. Res., 21, 1195–1213,1985.
Vörösmarty, C. J., Green, P., Salisbury, J., and Lammers, R. B.:Global water resources: Vulnerability from climate change andpopulation growth, Science, 289, 284–288, 2000.
Walker, W. E., Harremoës, P., Rotmans, J., Van der Sluis, J. P.,Van Asselt, M. B. A., Janssen, P., and Krayer von Krauss, M.P.: Defining uncertainty: a conceptual basis for uncertainty man-agement in model-based decision support, Integrat. Ass., 4, 5–17,2003.
Xu, C. Y., Tunemar, L., Chen, Y. Q. D., and Singh, V. P.: Evaluationof seasonal and spatial variations of lumped water balance modelsensitivity to precipitation data errors, J. Hydrol., 324, 80–93,2006a.
Xu, C. Y., Gong, L. B., Jiang, T., Chen, D. L., and Singh, V. P.:Analysis of spatial distribution and temporal trend of reference
www.hydrol-earth-syst-sci.net/18/2219/2014/ Hydrol. Earth Syst. Sci., 18, 2219–2234, 2014
2234 L. Zhuo et al.: Sensitivity and uncertainty in crop water footprint accounting – Yellow River basin
evapotranspiration and pan evaporation in Changjiang (YangtzeRiver) catchment, J. Hydrol., 327, 81–93, 2006b.
YRCC: Yellow River water resource bulletin 2010, available at:www.yellowriver.gov.cn, Yellow River Conservancy Commis-sion, Zhengzhou, China, 2011.
Zeng, Z., Liu, J., Koeneman, P. H., Zarate, E., and Hoekstra, A. Y.:Assessing water footprint at river basin level: a case study for theHeihe River Basin in northwest China, Hydrol. Earth Syst. Sci.,16, 2771–2781, doi:10.5194/hess-16-2771-2012, 2012.
Zhao, T. B. and Fu, C. B.: Comparison of products from ERA-40,NCEP-2, and CRU with station data for summer precipitationover China, Adv. Atmos. Sci., 23, 593–604, 2006.
Hydrol. Earth Syst. Sci., 18, 2219–2234, 2014 www.hydrol-earth-syst-sci.net/18/2219/2014/