sensors measurements and instrumentation lab · the sensor sit in line with water line and the...
TRANSCRIPT

SENSORS MEASUREMENTS
AND
INSTRUMENTATION LAB
Department of Electrical and Electronics Engineering
Gokaraju Rangaraju Institute of Engineering & Technology
Bachupally ,Kukatpally , Hyderabad
Telangana State - 500 090

GOKARAJU RANGARAJU INSTITUTE OF ENGINEERING AND TECHNOLOGY
(Autonomous) Bachupally, Hyderabad-500 090
CERTIFICATE
This is to certify that it is a bonafide record of practical work done in the Sensors Measurements and Instrumentation Laboratory during the year 2014-2015.
Name: Roll No: Branch:
Signature of staff member
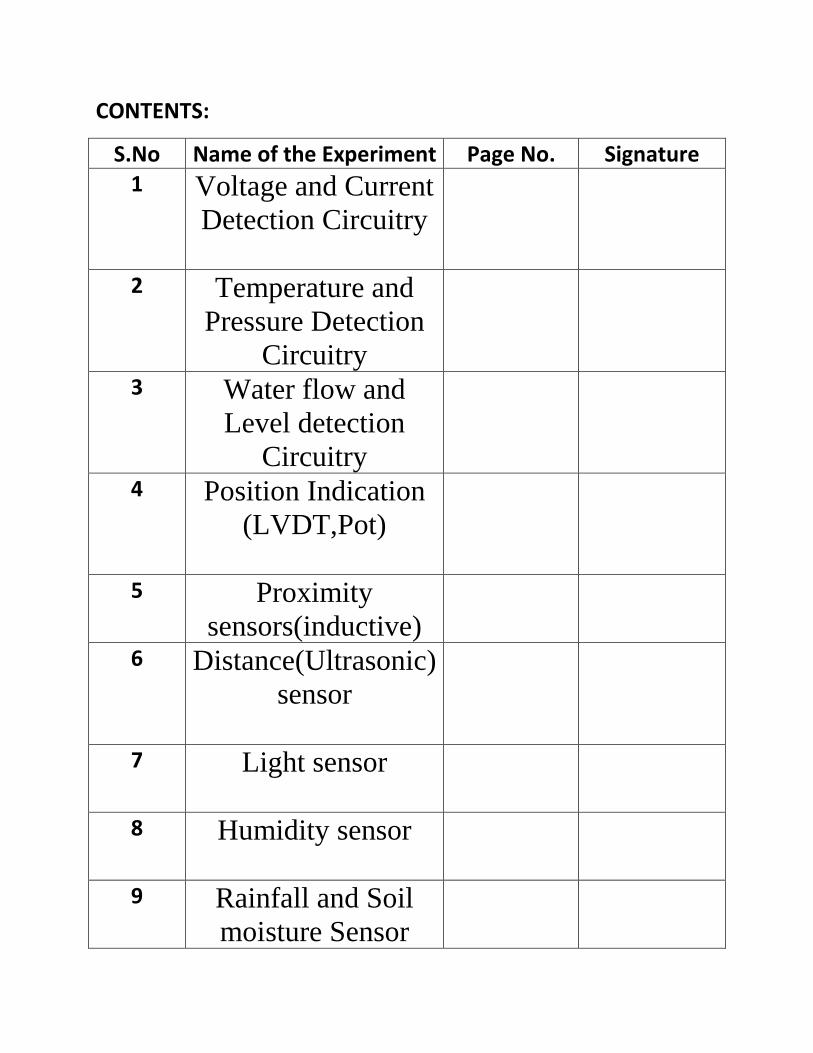
CONTENTS:
S.No Name of the Experiment Page No. Signature 1 Voltage and Current
Detection Circuitry
2 Temperature and
Pressure Detection
Circuitry
3 Water flow and
Level detection
Circuitry
4 Position Indication
(LVDT,Pot)
5 Proximity
sensors(inductive)
6 Distance(Ultrasonic)
sensor
7 Light sensor
8 Humidity sensor
9 Rainfall and Soil
moisture Sensor
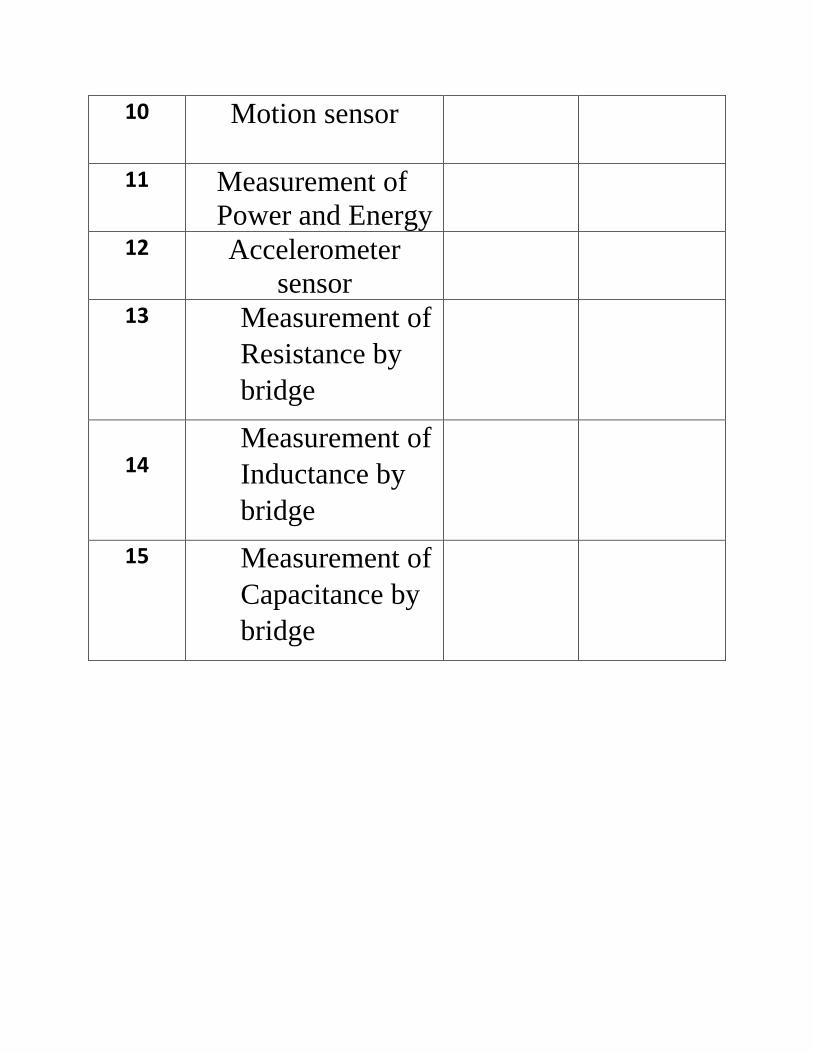
10 Motion sensor
11 Measurement of
Power and Energy
12 Accelerometer
sensor
13
Measurement of
Resistance by
bridge
14
Measurement of
Inductance by
bridge
15 Measurement of
Capacitance by
bridge
1. Voltage and Current Detection Circuitry
Aim: To sense the voltage across the Battery and Current through the Divider Circuit Using
Arduino
Apparatus: 1) Arduino UNO board
2) Two Resistors 1kΩ each
3) Small Bread Board
4) Connecting wires
5) Arduino software
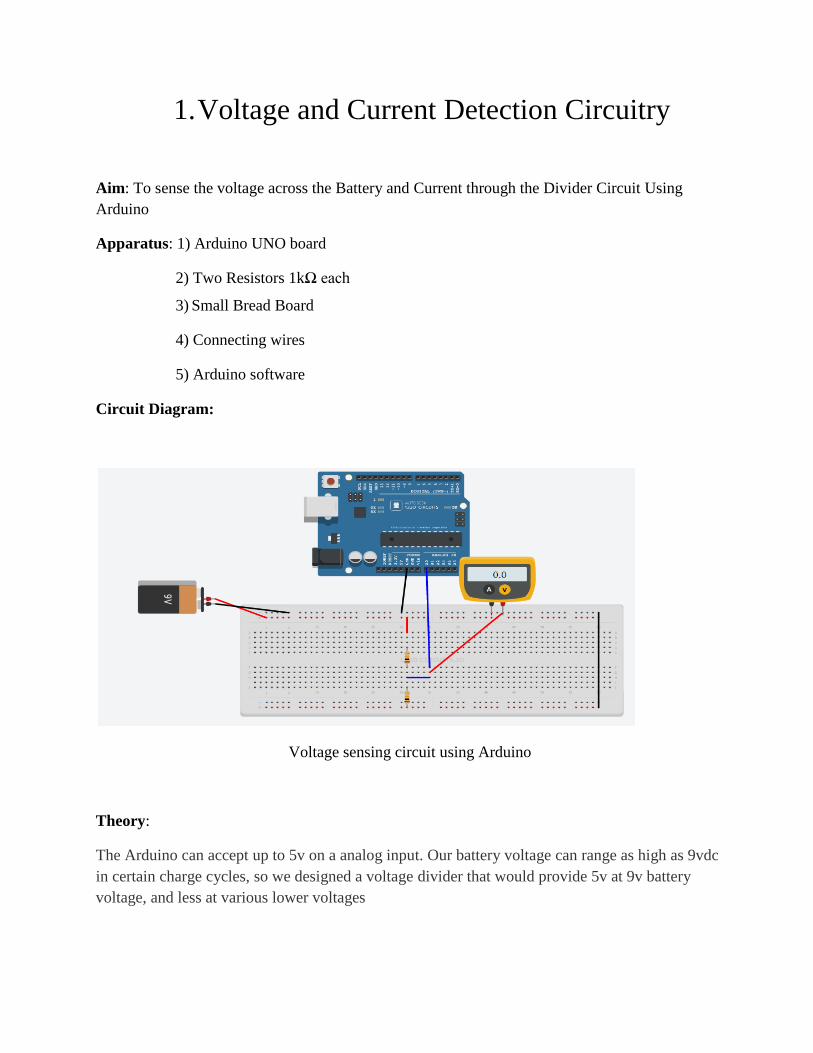
Circuit Diagram:
Voltage sensing circuit using Arduino
Theory:
The Arduino can accept up to 5v on a analog input. Our battery voltage can range as high as 9vdc
in certain charge cycles, so we designed a voltage divider that would provide 5v at 9v battery
voltage, and less at various lower voltages
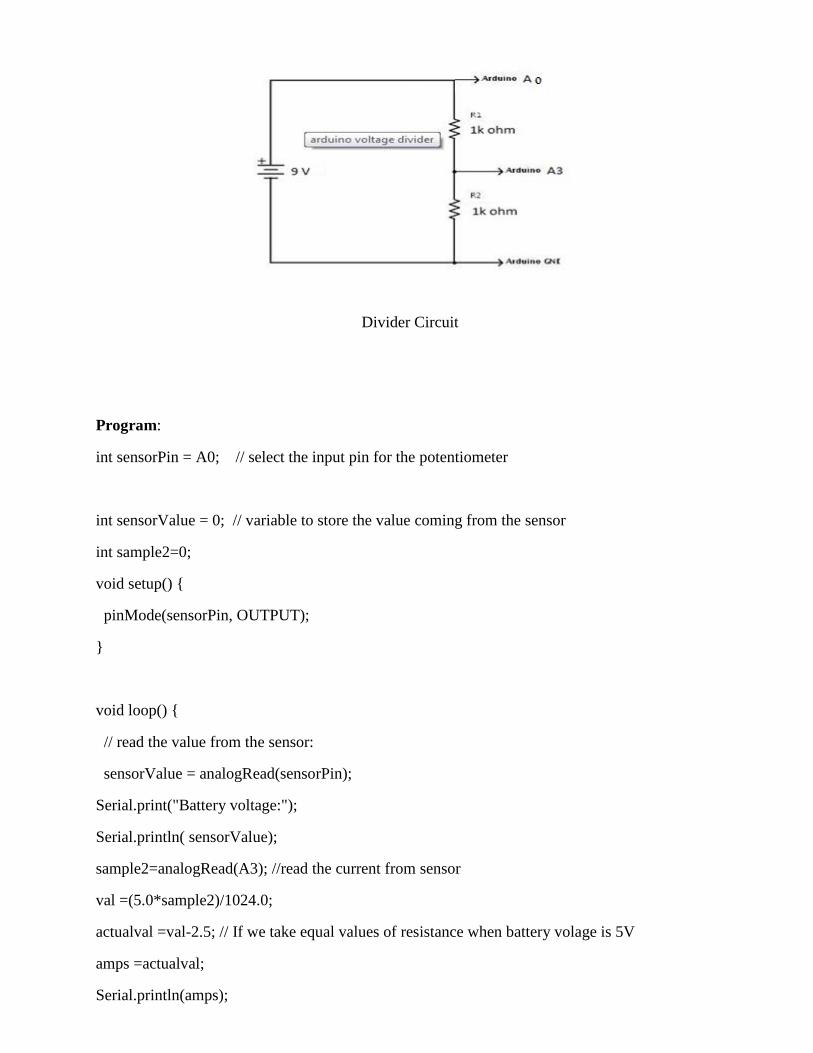
Divider Circuit
Program:
int sensorPin = A0; // select the input pin for the potentiometer
int sensorValue = 0; // variable to store the value coming from the sensor
int sample2=0;
void setup()
pinMode(sensorPin, OUTPUT);
void loop()
// read the value from the sensor:
sensorValue = analogRead(sensorPin);
Serial.print("Battery voltage:");
Serial.println( sensorValue);
sample2=analogRead(A3); //read the current from sensor
val =(5.0*sample2)/1024.0;
actualval =val-2.5; // If we take equal values of resistance when battery volage is 5V
amps =actualval;
Serial.println(amps);

delay(1000);
Observations:
Serial Monitor:
Result:
2. Temperature and Pressure Detection Circuitry
Aim: To sense the Temperature and Pressure using ARDUINO
Apparatus: 1) Arduino UNO board
2) GY-65 Sensor
3) Small Bread Board
4) Connecting wires
5) Arduino software
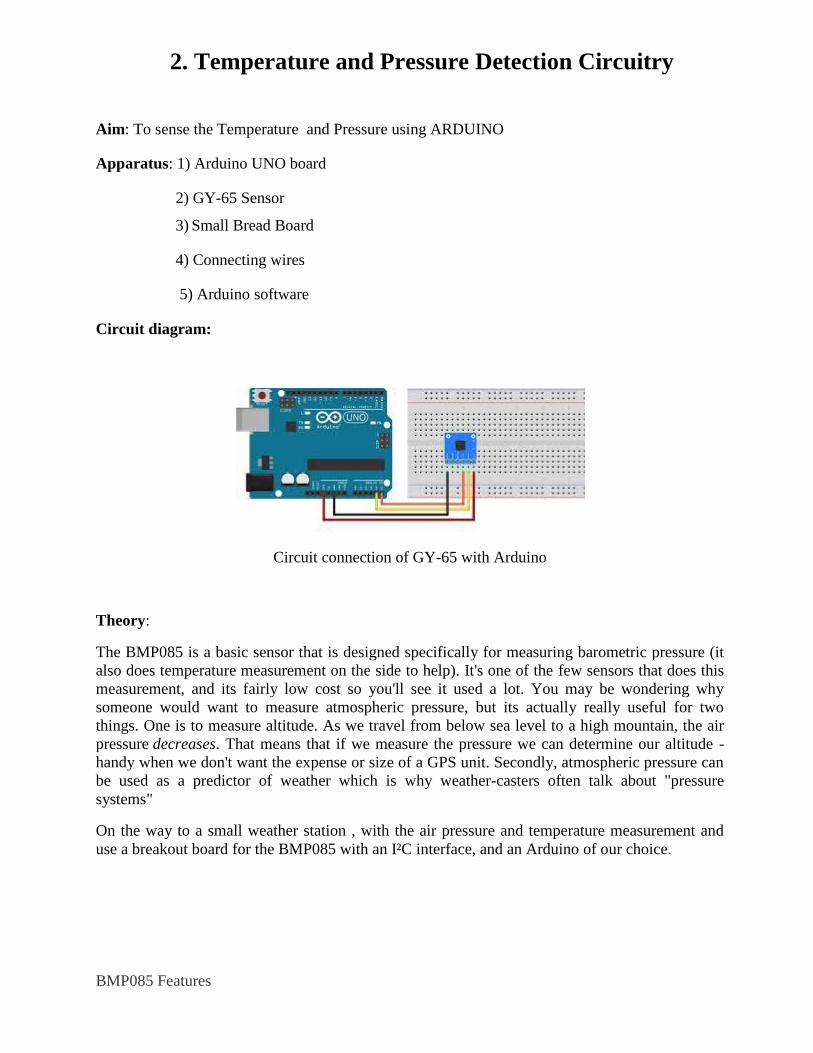
Circuit diagram:
Circuit connection of GY-65 with Arduino
Theory:
The BMP085 is a basic sensor that is designed specifically for measuring barometric pressure (it
also does temperature measurement on the side to help). It's one of the few sensors that does this
measurement, and its fairly low cost so you'll see it used a lot. You may be wondering why
someone would want to measure atmospheric pressure, but its actually really useful for two
things. One is to measure altitude. As we travel from below sea level to a high mountain, the air
pressure decreases. That means that if we measure the pressure we can determine our altitude -
handy when we don't want the expense or size of a GPS unit. Secondly, atmospheric pressure can
be used as a predictor of weather which is why weather-casters often talk about "pressure
systems"
On the way to a small weather station , with the air pressure and temperature measurement and
use a breakout board for the BMP085 with an I²C interface, and an Arduino of our choice.
BMP085 Features

BMP085 is low power (5uA) high precision (0.03hPa) pressure sensor for mobile devices and can
be connected to variety of microprocessors via I2C bus .
Pressure range: 300 - 1100hPa (~ altitude 9000 - 500m)
Supply voltage: VDDA: 1.8V-3.6V, VDDD 1.62V-3.6V
LCC8 package 5.0mm x 5.0x1.2mm
Low consumption: 5uA in standard mode
High accuracy: resolution ratio is 0.06hPa (0.5 meter) in low power mode, 0.03hPa (0.25
meter) in high linear mode
Temperature output
I2C interface
Temperature compensation
Leadless, RoHS standard
Response time: 7.5ms
Standby current: 0.1uA
Does not need external clock
Applications:
GPS pinpoint navigation (dead reckoning, fluctuation bridge detection)
Indoor and outdoor navigation
Detection for entertainment, sports, health care
Weather forecast
Vertical speed instruction (rise/sink speed)
Fan power control
Refer GY-65/BMP085 Datasheet
Program:
#include “wire.h”
#include “AdaFruit_BMP085.h”
AdaFruit_BMP085bmp;
Void Setup( )
Serial.begin(9600);
bmp.begin();
Void loop()
Serial.Print(“Temperature”);
Serial.Print(“bmp.readtemperature”);
Serial.Println(“ C”);
Serial.Print(“Pressure”);
Serial.Println(“ Pa”);
delay(500);
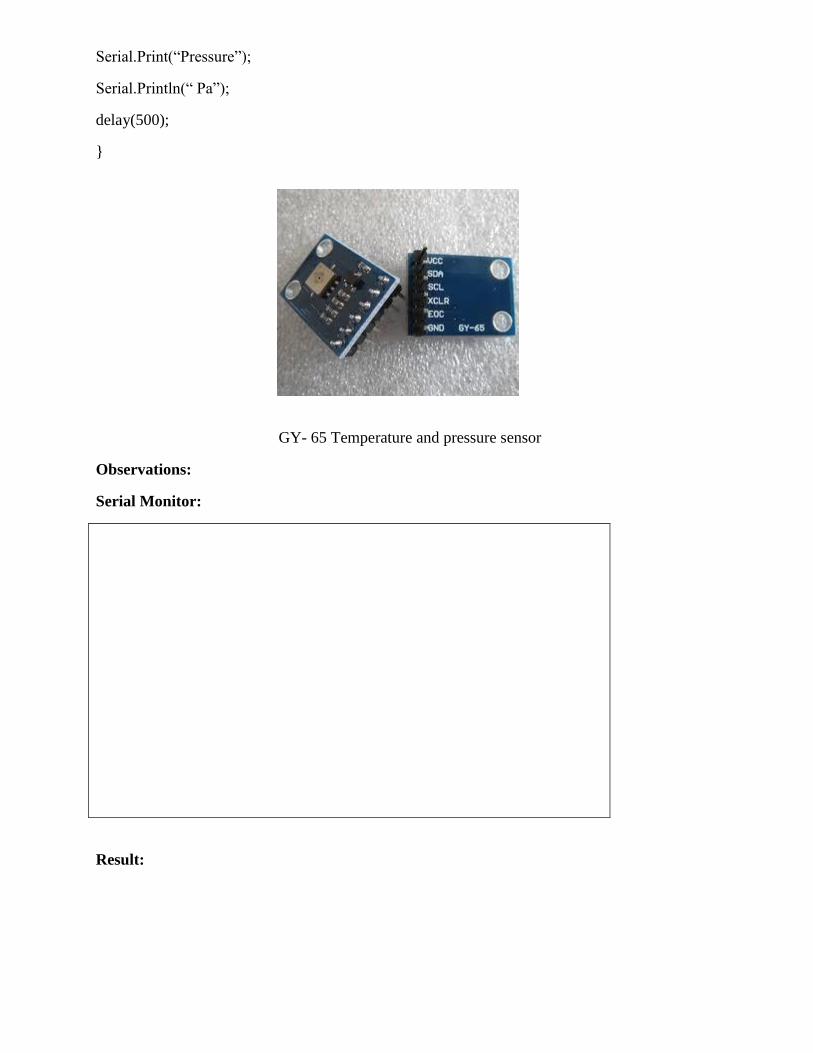
GY- 65 Temperature and pressure sensor
Observations:
Serial Monitor:
Result:
3. Water flow and level detection circuitry
Aim: To Measure the Water flow rate using Arduino
Apparatus: 1) Arduino UNO board
2) Water flow Sensor
3) Water pump
4) Water tank setup
5) Connecting wires
6) Arduino and Megunolink software
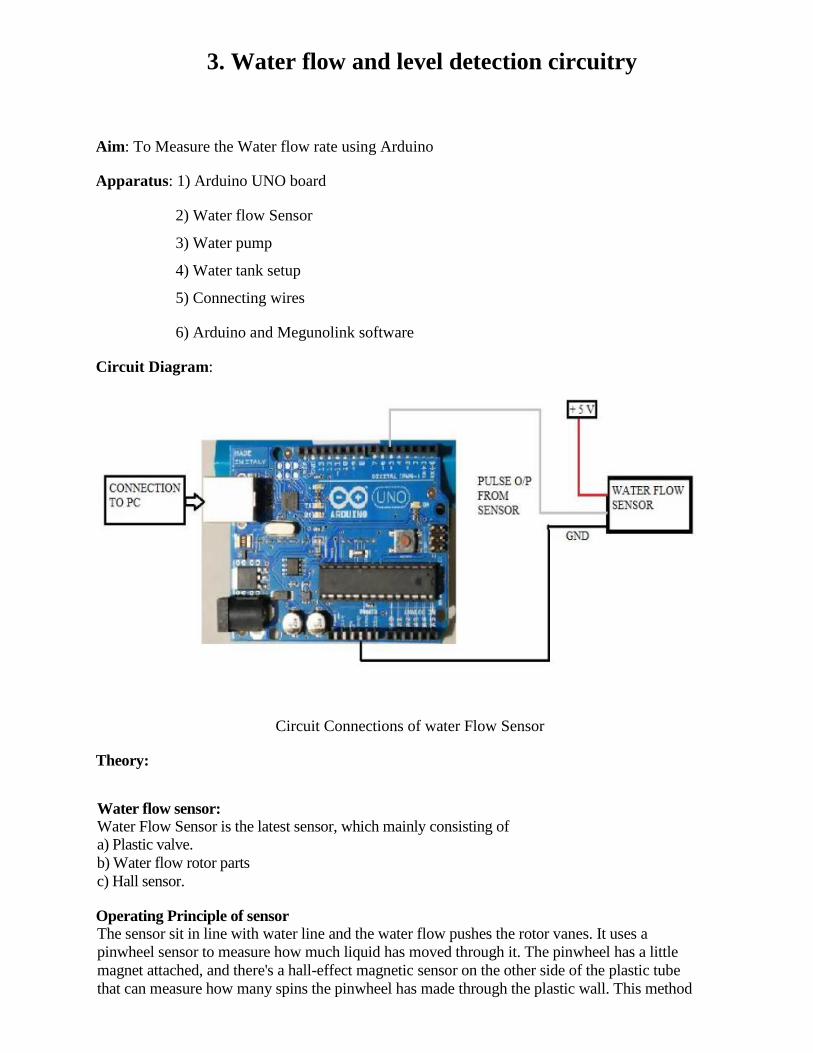
Circuit Diagram:
Circuit Connections of water Flow Sensor
Theory: Water flow sensor: Water Flow Sensor is the latest sensor, which mainly consisting of a) Plastic valve.
b) Water flow rotor parts
c) Hall sensor.
Operating Principle of sensor The sensor sit in line with water line and the water flow pushes the rotor vanes. It uses a
pinwheel sensor to measure how much liquid has moved through it. The pinwheel has a little
magnet attached, and there's a hall-effect magnetic sensor on the other side of the plastic tube
that can measure how many spins the pinwheel has made through the plastic wall. This method
allows the sensor to stay safe and dry.
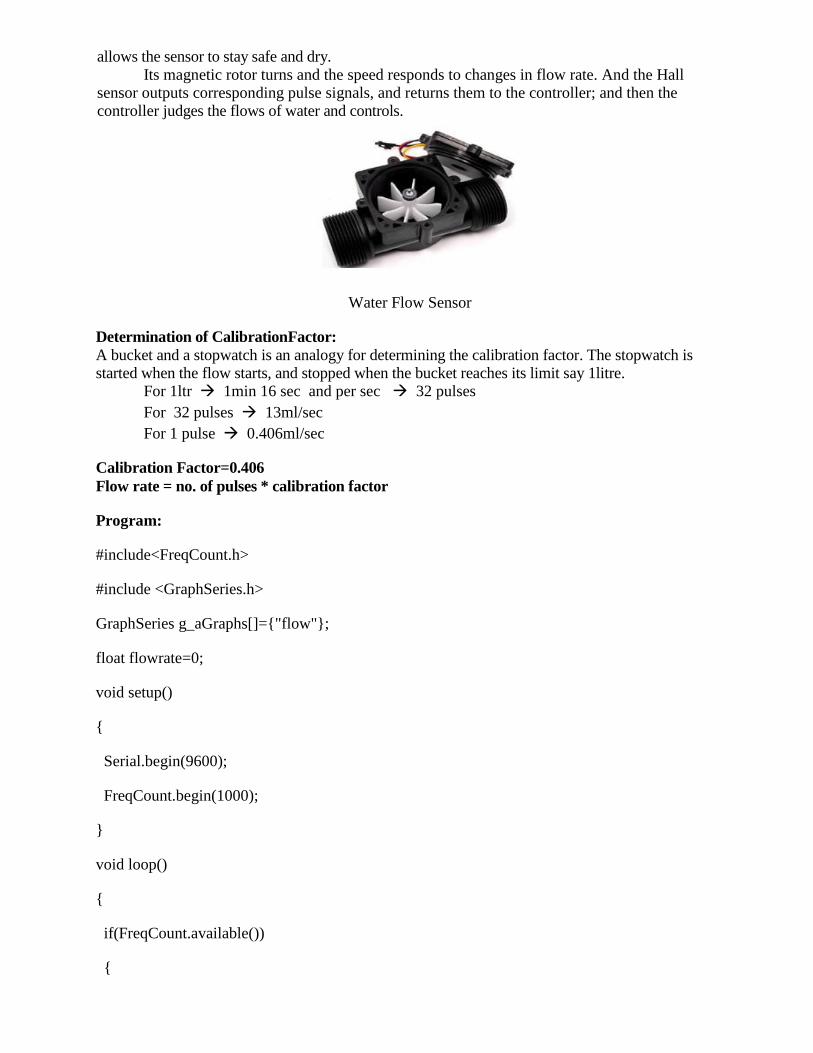
Its magnetic rotor turns and the speed responds to changes in flow rate. And the Hall sensor outputs corresponding pulse signals, and returns them to the controller; and then the controller judges the flows of water and controls.
Water Flow Sensor
Determination of CalibrationFactor:
A bucket and a stopwatch is an analogy for determining the calibration factor. The stopwatch is started when the flow starts, and stopped when the bucket reaches its limit say 1litre.
For 1ltr 1min 16 sec and per sec 32 pulses
For 32 pulses 13ml/sec
For 1 pulse 0.406ml/sec
Calibration Factor=0.406
Flow rate = no. of pulses * calibration factor
Program:
#include<FreqCount.h>
#include <GraphSeries.h>
GraphSeries g_aGraphs[]="flow";
float flowrate=0;
void setup()
Serial.begin(9600);
FreqCount.begin(1000);
void loop()
if(FreqCount.available())

unsigned long pulse=FreqCount.read();
flowrate=pulse*0.406;
Serial.print("flowrate=");
Serial.print(flowrate);
Serial.println(" ml/sec");
g_aGraphs[0].SendData(flowrate);
Observations:
Serial Monitor:
Result:
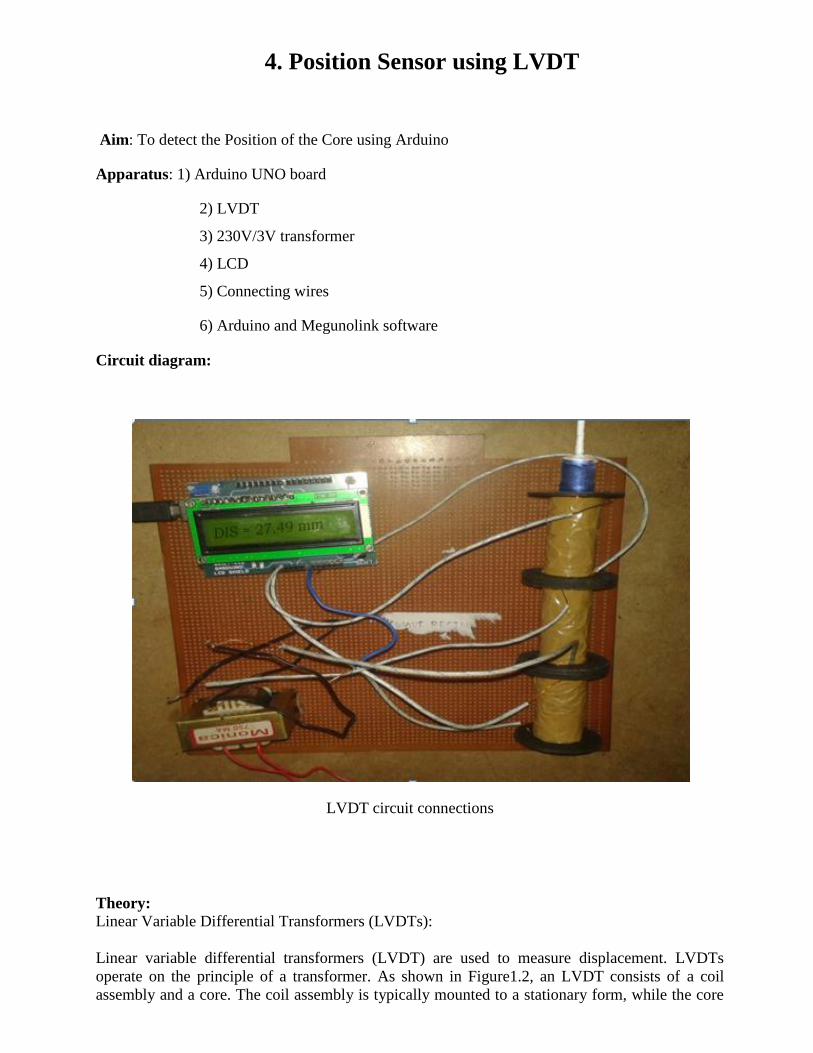
4. Position Sensor using LVDT
Aim: To detect the Position of the Core using Arduino
Apparatus: 1) Arduino UNO board
2) LVDT
3) 230V/3V transformer
4) LCD
5) Connecting wires
6) Arduino and Megunolink software
Circuit diagram:
LVDT circuit connections
Theory:
Linear Variable Differential Transformers (LVDTs):
Linear variable differential transformers (LVDT) are used to measure displacement. LVDTs
operate on the principle of a transformer. As shown in Figure1.2, an LVDT consists of a coil
assembly and a core. The coil assembly is typically mounted to a stationary form, while the core
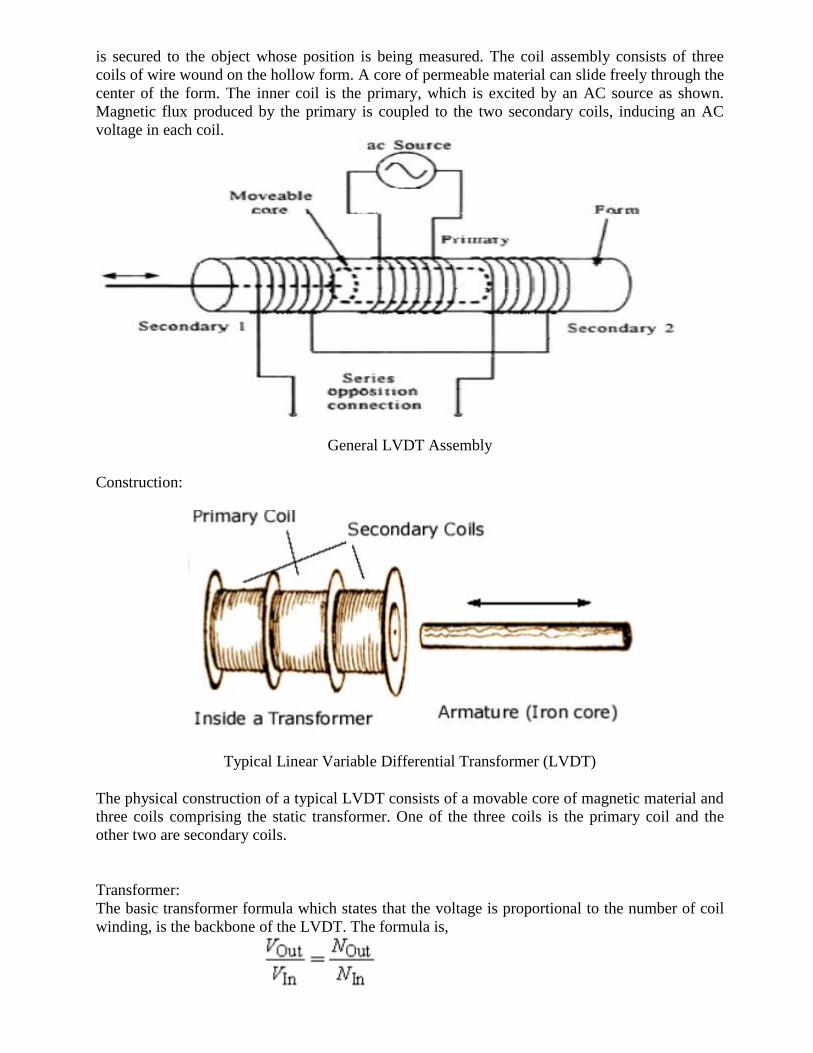
is secured to the object whose position is being measured. The coil assembly consists of three
coils of wire wound on the hollow form. A core of permeable material can slide freely through the
center of the form. The inner coil is the primary, which is excited by an AC source as shown.
Magnetic flux produced by the primary is coupled to the two secondary coils, inducing an AC
voltage in each coil.
General LVDT Assembly
Construction:
Typical Linear Variable Differential Transformer (LVDT)
The physical construction of a typical LVDT consists of a movable core of magnetic material and
three coils comprising the static transformer. One of the three coils is the primary coil and the
other two are secondary coils.
Transformer:
The basic transformer formula which states that the voltage is proportional to the number of coil
winding, is the backbone of the LVDT. The formula is,
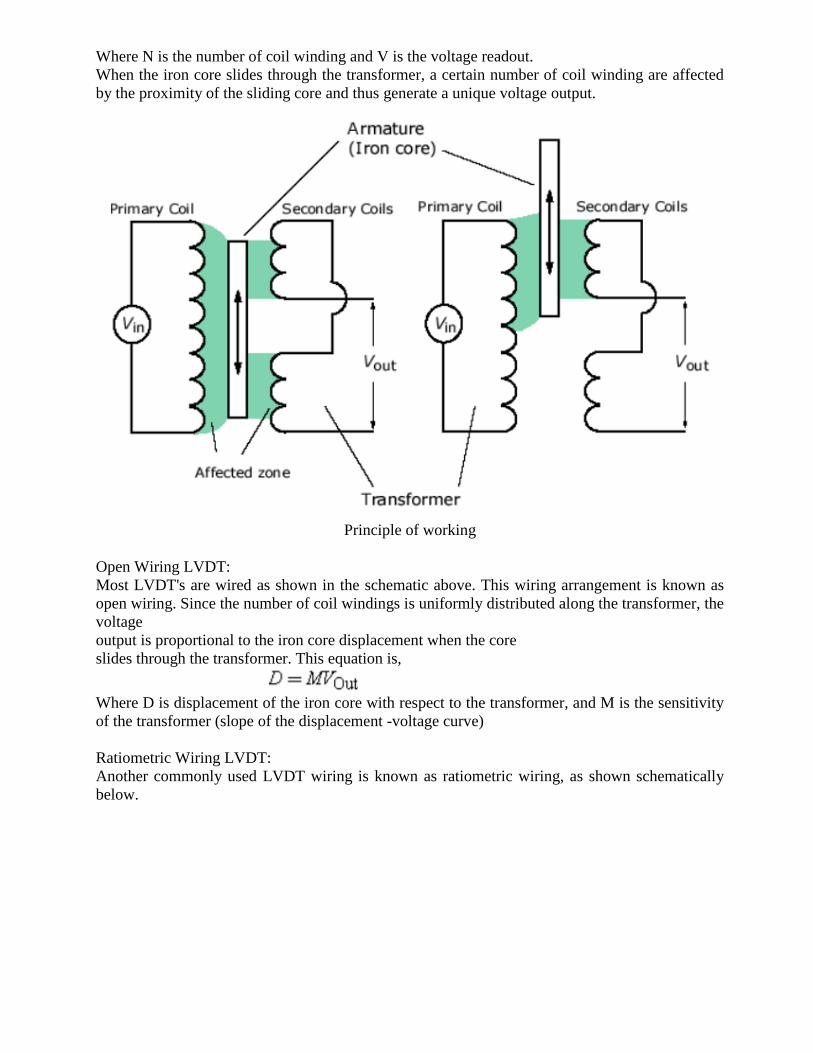
Where N is the number of coil winding and V is the voltage readout.
When the iron core slides through the transformer, a certain number of coil winding are affected
by the proximity of the sliding core and thus generate a unique voltage output.
Principle of working
Open Wiring LVDT:
Most LVDT's are wired as shown in the schematic above. This wiring arrangement is known as
open wiring. Since the number of coil windings is uniformly distributed along the transformer, the
voltage
output is proportional to the iron core displacement when the core
slides through the transformer. This equation is,
Where D is displacement of the iron core with respect to the transformer, and M is the sensitivity
of the transformer (slope of the displacement -voltage curve)
Ratiometric Wiring LVDT:
Another commonly used LVDT wiring is known as ratiometric wiring, as shown schematically
below.
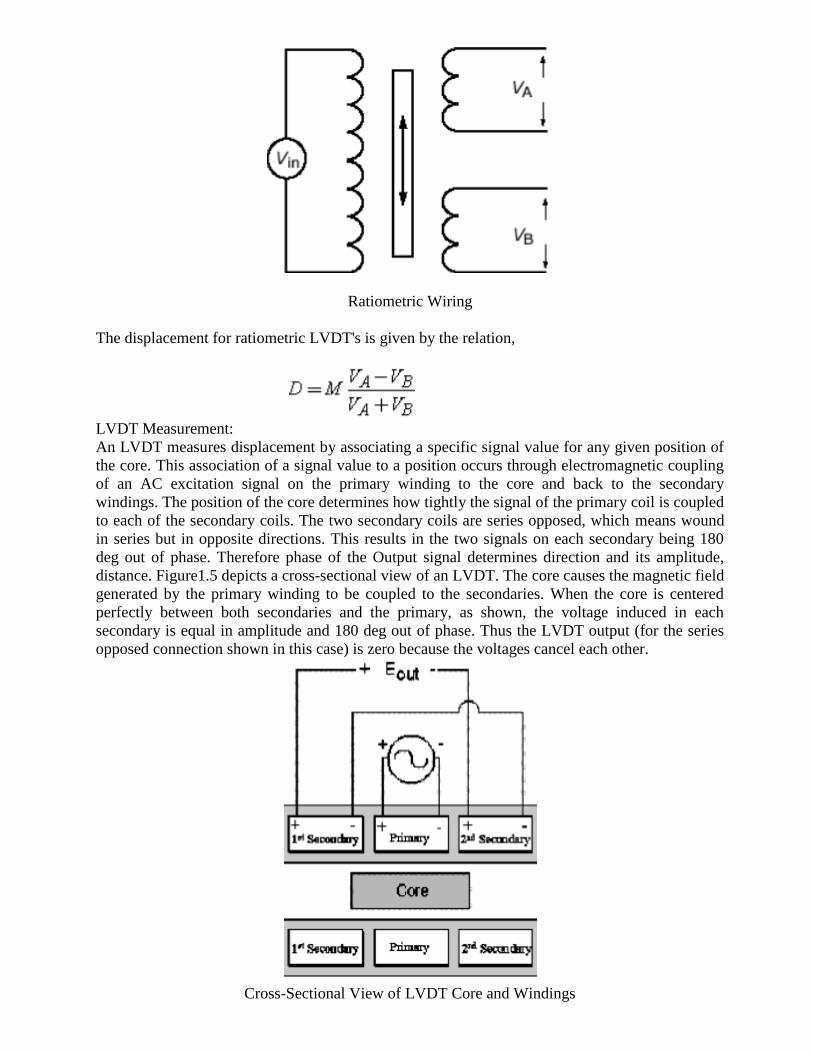
Ratiometric Wiring
The displacement for ratiometric LVDT's is given by the relation,
LVDT Measurement:
An LVDT measures displacement by associating a specific signal value for any given position of
the core. This association of a signal value to a position occurs through electromagnetic coupling
of an AC excitation signal on the primary winding to the core and back to the secondary
windings. The position of the core determines how tightly the signal of the primary coil is coupled
to each of the secondary coils. The two secondary coils are series opposed, which means wound
in series but in opposite directions. This results in the two signals on each secondary being 180
deg out of phase. Therefore phase of the Output signal determines direction and its amplitude,
distance. Figure1.5 depicts a cross-sectional view of an LVDT. The core causes the magnetic field
generated by the primary winding to be coupled to the secondaries. When the core is centered
perfectly between both secondaries and the primary, as shown, the voltage induced in each
secondary is equal in amplitude and 180 deg out of phase. Thus the LVDT output (for the series
opposed connection shown in this case) is zero because the voltages cancel each other.
Cross-Sectional View of LVDT Core and Windings
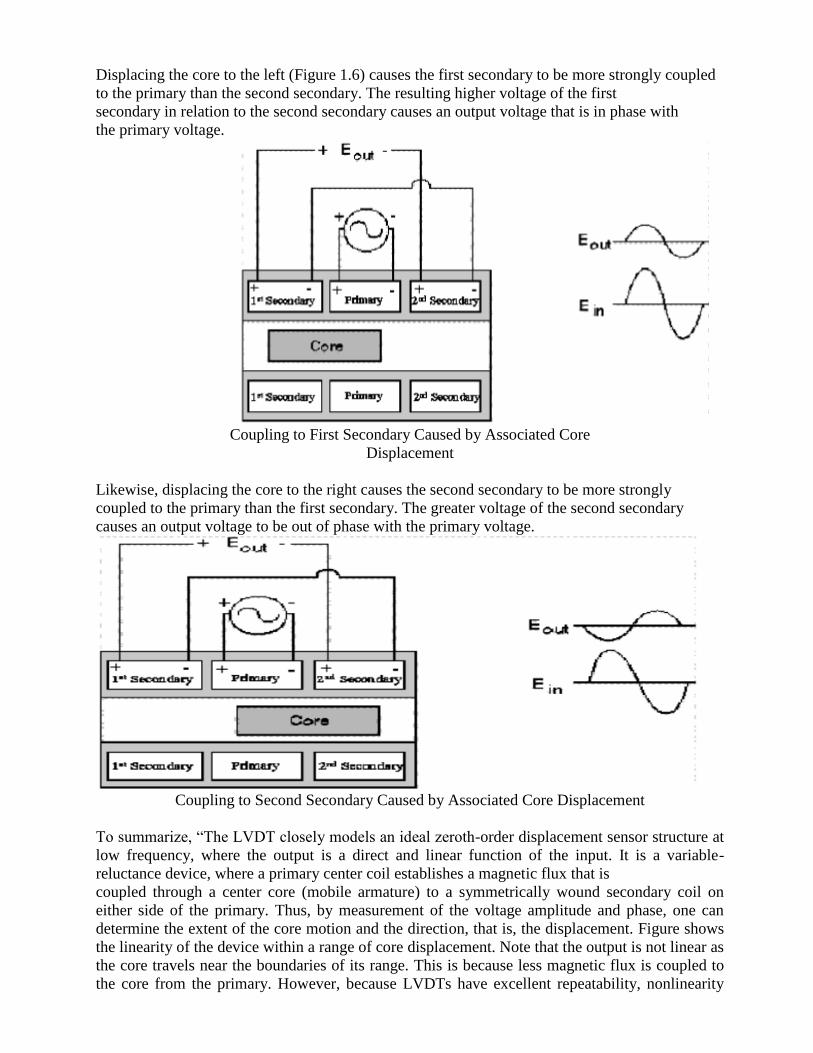
Displacing the core to the left (Figure 1.6) causes the first secondary to be more strongly coupled
to the primary than the second secondary. The resulting higher voltage of the first
secondary in relation to the second secondary causes an output voltage that is in phase with
the primary voltage.
Coupling to First Secondary Caused by Associated Core
Displacement
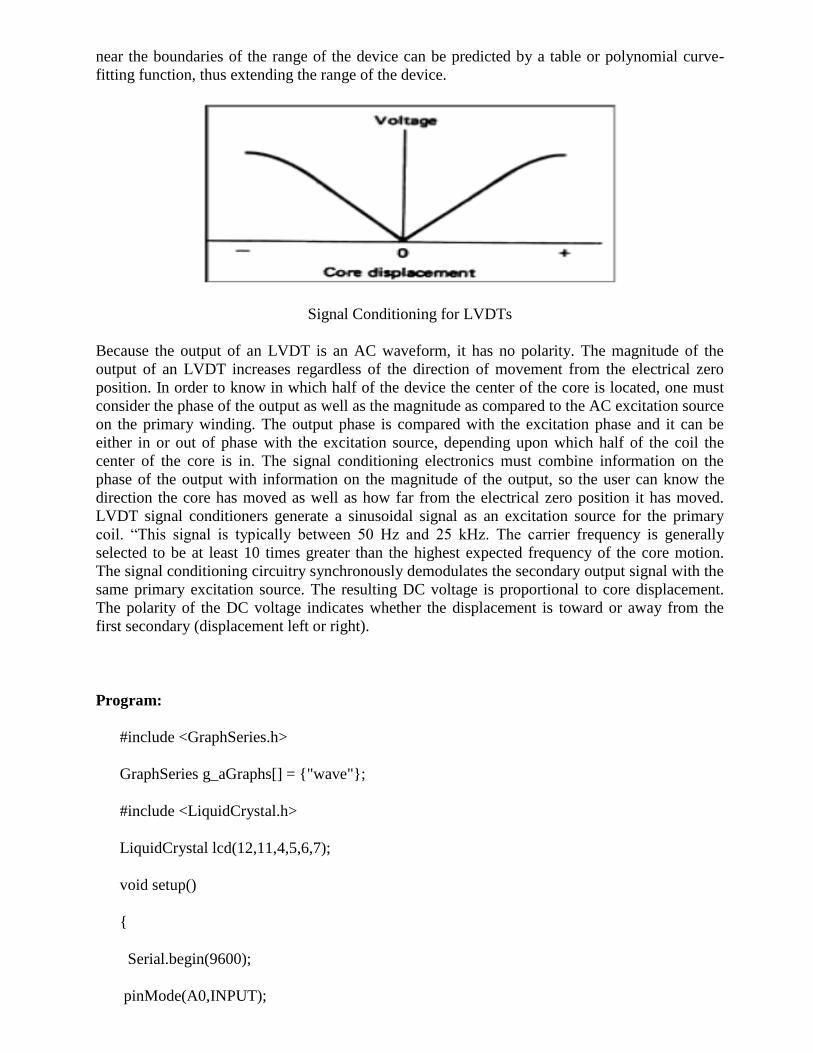
Likewise, displacing the core to the right causes the second secondary to be more strongly
coupled to the primary than the first secondary. The greater voltage of the second secondary
causes an output voltage to be out of phase with the primary voltage.
Coupling to Second Secondary Caused by Associated Core Displacement
To summarize, “The LVDT closely models an ideal zeroth-order displacement sensor structure at
low frequency, where the output is a direct and linear function of the input. It is a variable-
reluctance device, where a primary center coil establishes a magnetic flux that is
coupled through a center core (mobile armature) to a symmetrically wound secondary coil on
either side of the primary. Thus, by measurement of the voltage amplitude and phase, one can
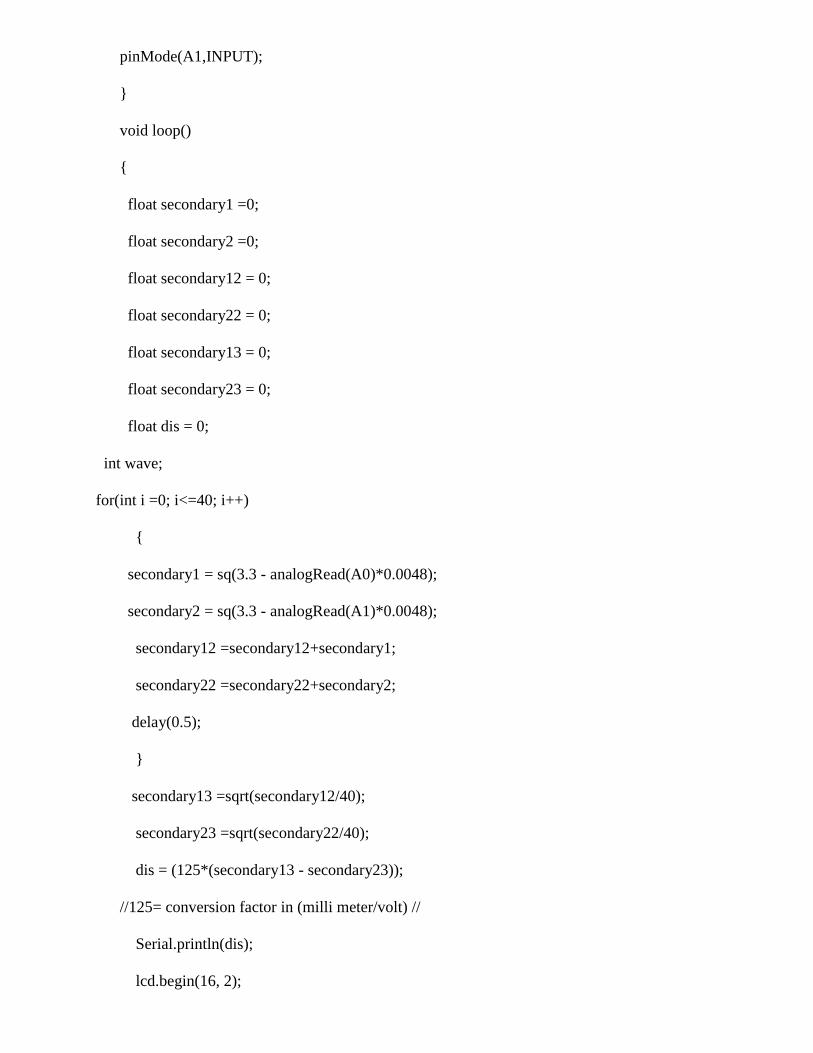
determine the extent of the core motion and the direction, that is, the displacement. Figure shows
the linearity of the device within a range of core displacement. Note that the output is not linear as
the core travels near the boundaries of its range. This is because less magnetic flux is coupled to
the core from the primary. However, because LVDTs have excellent repeatability, nonlinearity
near the boundaries of the range of the device can be predicted by a table or polynomial curve-
fitting function, thus extending the range of the device.
Signal Conditioning for LVDTs
Because the output of an LVDT is an AC waveform, it has no polarity. The magnitude of the
output of an LVDT increases regardless of the direction of movement from the electrical zero
position. In order to know in which half of the device the center of the core is located, one must
consider the phase of the output as well as the magnitude as compared to the AC excitation source
on the primary winding. The output phase is compared with the excitation phase and it can be
either in or out of phase with the excitation source, depending upon which half of the coil the
center of the core is in. The signal conditioning electronics must combine information on the
phase of the output with information on the magnitude of the output, so the user can know the
direction the core has moved as well as how far from the electrical zero position it has moved.
LVDT signal conditioners generate a sinusoidal signal as an excitation source for the primary
coil. “This signal is typically between 50 Hz and 25 kHz. The carrier frequency is generally
selected to be at least 10 times greater than the highest expected frequency of the core motion.
The signal conditioning circuitry synchronously demodulates the secondary output signal with the
same primary excitation source. The resulting DC voltage is proportional to core displacement.
The polarity of the DC voltage indicates whether the displacement is toward or away from the
first secondary (displacement left or right).
Program:
#include <GraphSeries.h>
GraphSeries g_aGraphs[] = "wave";
#include <LiquidCrystal.h>
LiquidCrystal lcd(12,11,4,5,6,7);
void setup()
Serial.begin(9600);
pinMode(A0,INPUT);
pinMode(A1,INPUT);
void loop()
float secondary1 =0;
float secondary2 =0;
float secondary12 = 0;
float secondary22 = 0;
float secondary13 = 0;
float secondary23 = 0;
float dis = 0;
int wave;
for(int i =0; i<=40; i++)
secondary1 = sq(3.3 - analogRead(A0)*0.0048);
secondary2 = sq(3.3 - analogRead(A1)*0.0048);
secondary12 =secondary12+secondary1;
secondary22 =secondary22+secondary2;
delay(0.5);
secondary13 =sqrt(secondary12/40);
secondary23 =sqrt(secondary22/40);
dis = (125*(secondary13 - secondary23));
//125= conversion factor in (milli meter/volt) //
Serial.println(dis);
lcd.begin(16, 2);

lcd.print("DIS=");
lcd.print(dis);
lcd.print(" mm");
g_aGraphs[wave].SendData(analogRead(A0));
g_aGraphs[wave].SendData(analogRead(A1));
delay(1000);
Observations:
Serial Monitor:
Result:


5. PROXIMITY SENSOR
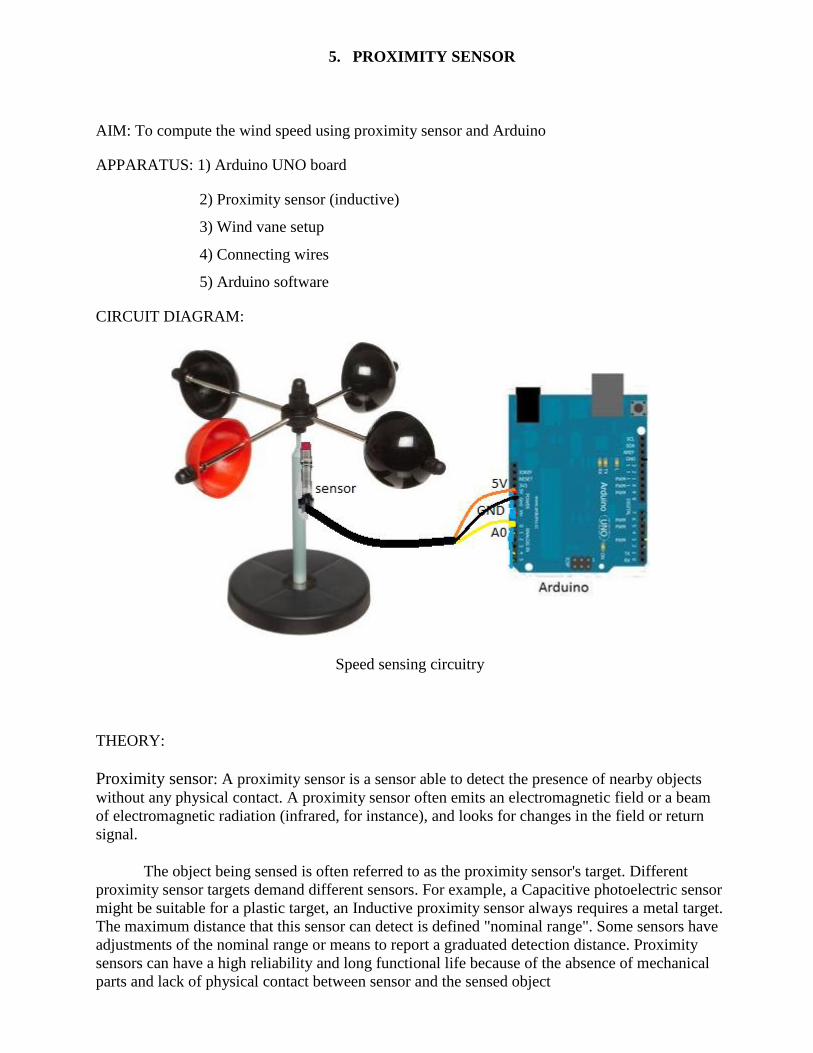
AIM: To compute the wind speed using proximity sensor and Arduino
APPARATUS: 1) Arduino UNO board
2) Proximity sensor (inductive)
3) Wind vane setup
4) Connecting wires
5) Arduino software
CIRCUIT DIAGRAM:
Speed sensing circuitry
THEORY:
Proximity sensor: A proximity sensor is a sensor able to detect the presence of nearby objects
without any physical contact. A proximity sensor often emits an electromagnetic field or a beam
of electromagnetic radiation (infrared, for instance), and looks for changes in the field or return
signal.
The object being sensed is often referred to as the proximity sensor's target. Different
proximity sensor targets demand different sensors. For example, a Capacitive photoelectric sensor
might be suitable for a plastic target, an Inductive proximity sensor always requires a metal target.
The maximum distance that this sensor can detect is defined "nominal range". Some sensors have
adjustments of the nominal range or means to report a graduated detection distance. Proximity
sensors can have a high reliability and long functional life because of the absence of mechanical
parts and lack of physical contact between sensor and the sensed object
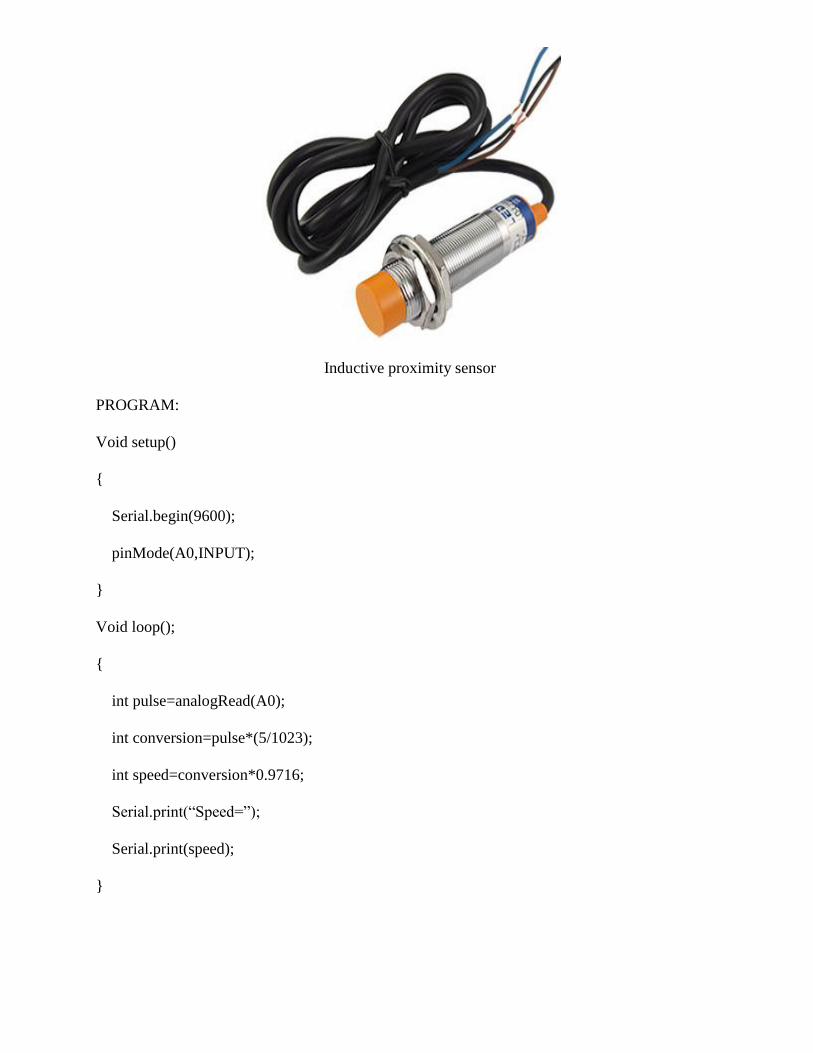
Inductive proximity sensor
PROGRAM:
Void setup()
Serial.begin(9600);
pinMode(A0,INPUT);
Void loop();
int pulse=analogRead(A0);
int conversion=pulse*(5/1023);
int speed=conversion*0.9716;
Serial.print(“Speed=”);
Serial.print(speed);

Observations:
Serial Monitor:
RESULT:
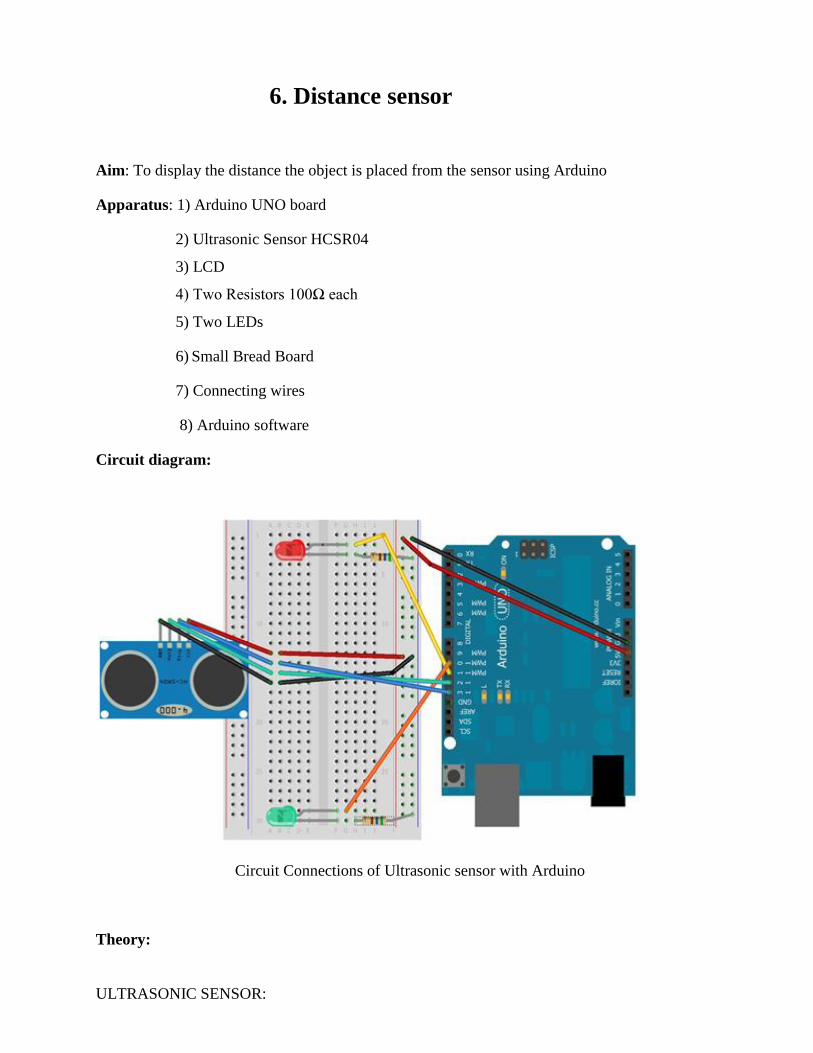
6. Distance sensor
Aim: To display the distance the object is placed from the sensor using Arduino
Apparatus: 1) Arduino UNO board
2) Ultrasonic Sensor HCSR04
3) LCD
4) Two Resistors 100Ω each
5) Two LEDs
6) Small Bread Board
7) Connecting wires
8) Arduino software
Circuit diagram:
Circuit Connections of Ultrasonic sensor with Arduino
Theory:
ULTRASONIC SENSOR:
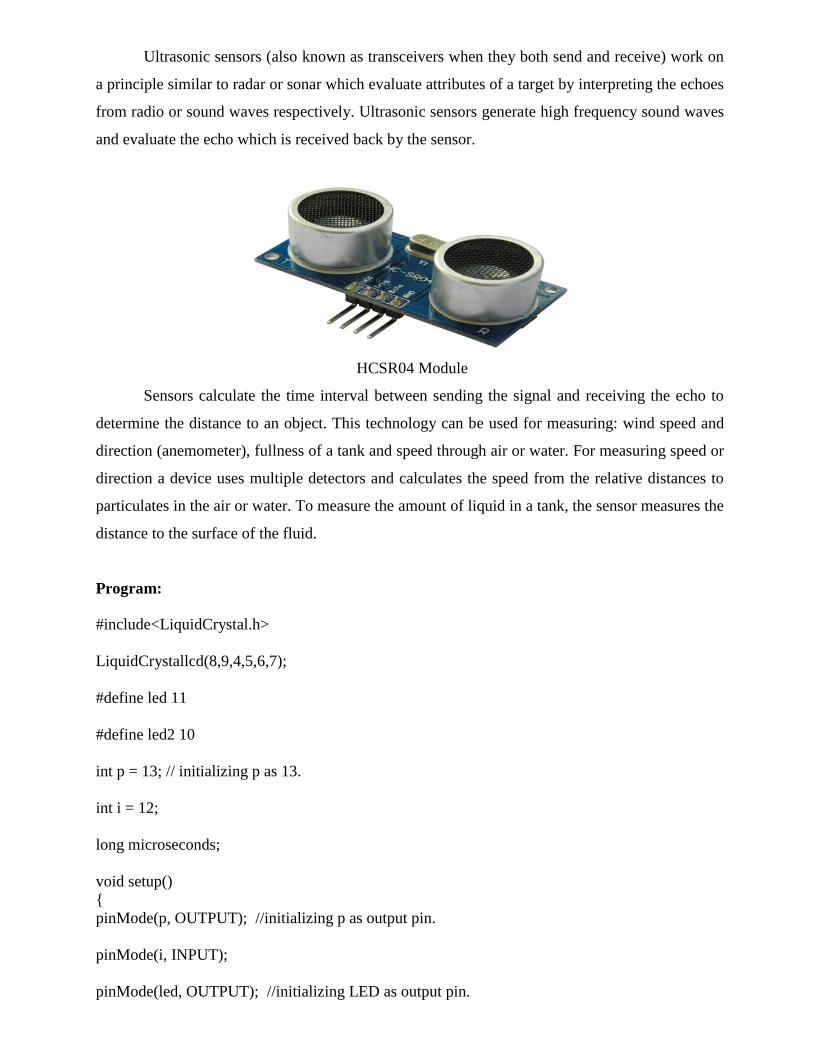
Ultrasonic sensors (also known as transceivers when they both send and receive) work on
a principle similar to radar or sonar which evaluate attributes of a target by interpreting the echoes
from radio or sound waves respectively. Ultrasonic sensors generate high frequency sound waves
and evaluate the echo which is received back by the sensor.
HCSR04 Module
Sensors calculate the time interval between sending the signal and receiving the echo to
determine the distance to an object. This technology can be used for measuring: wind speed and
direction (anemometer), fullness of a tank and speed through air or water. For measuring speed or
direction a device uses multiple detectors and calculates the speed from the relative distances to
particulates in the air or water. To measure the amount of liquid in a tank, the sensor measures the
distance to the surface of the fluid.
Program:
#include<LiquidCrystal.h>
LiquidCrystallcd(8,9,4,5,6,7);
#define led 11
#define led2 10
int p = 13; // initializing p as 13.
int i = 12;
long microseconds;
void setup()
pinMode(p, OUTPUT); //initializing p as output pin.
pinMode(i, INPUT);
pinMode(led, OUTPUT); //initializing LED as output pin.
pinMode(led2, OUTPUT);
lcd.begin(16,2);
Serial.begin(9600); //giving baud rate as 9600.
void loop()
long duration, inches, cm;
digitalWrite(p, LOW);
delayMicroseconds(2);
digitalWrite(p, HIGH);
delayMicroseconds(10);
digitalWrite(p, LOW);
delayMicroseconds(2);
duration = pulseIn(i, HIGH);
inches = microsecondsToInches(duration);
cm = microsecondsToCentimeters(duration);
if (cm < 10)
// This is where the LED On/Off happens
digitalWrite(led,HIGH); // When the Red condition is met, the Green LED should turn off
digitalWrite(led2,LOW);
else
digitalWrite(led,LOW);
digitalWrite(led2,HIGH);
lcd.print("DISTANCE=");
lcd.setCursor(0,1);

lcd.print(inches);
lcd.print("in, ");
lcd.print(cm);
lcd.print("cm");
Serial.print(inches);
Serial.print("in, ");
Serial.print(cm);
Serial.print("cm");
Serial.println();
delay(1000);
lcd.clear();
long microsecondsToInches(long microseconds)
// According to Parallax's datasheet for the PING))), there are
// 73.746 microseconds per inch (i.e. sound travels at 1130 feet per
// second). This gives the distance travelled by the ping, outbound
// and return, so we divide by 2 to get the distance of the obstacle.
return microseconds / 74 / 2;
long microsecondsToCentimeters(long microseconds)
return microseconds / 29 / 2;

Observations:
Serial Monitor:
Result:
7. Light sensor
Aim: To sense Light intensity using Arduino
Apparatus: 1) Arduino UNO board
2) Current Sensor
3) Two Resistors 1kΩ each
6) Small Bread Board
7) Connecting wires
8) Arduino software
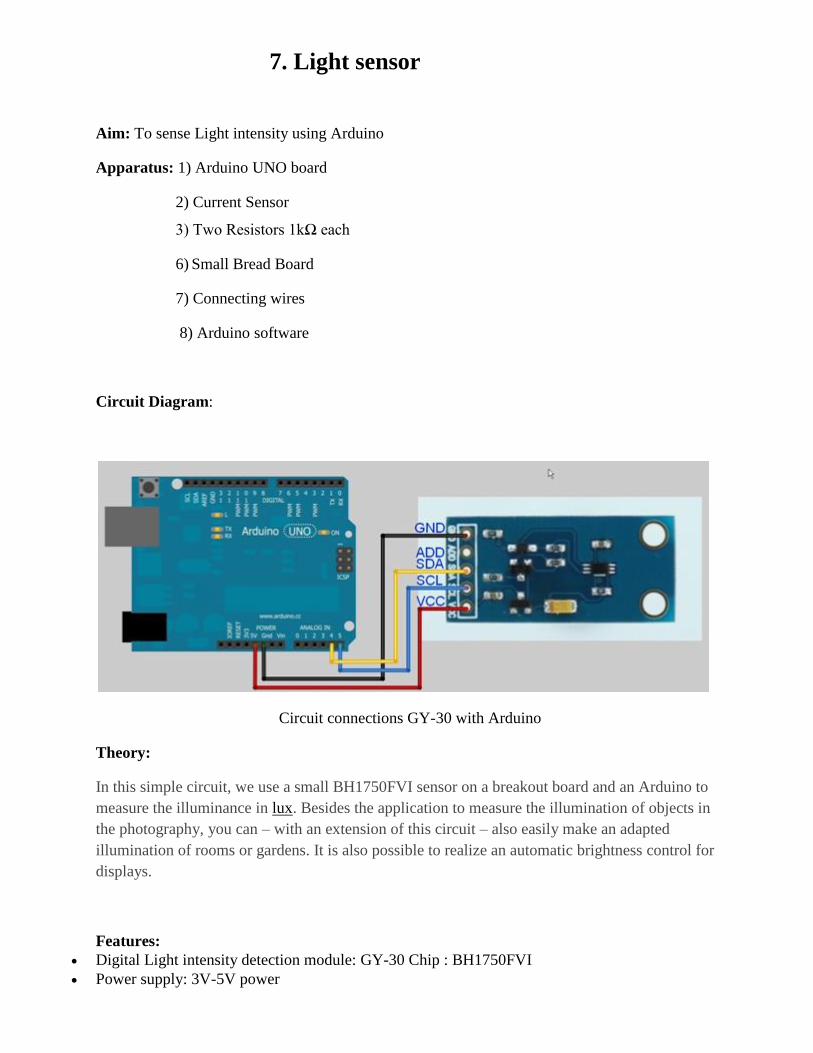
Circuit Diagram:
Circuit connections GY-30 with Arduino
Theory:
In this simple circuit, we use a small BH1750FVI sensor on a breakout board and an Arduino to
measure the illuminance in lux. Besides the application to measure the illumination of objects in
the photography, you can – with an extension of this circuit – also easily make an adapted
illumination of rooms or gardens. It is also possible to realize an automatic brightness control for
displays.
Features:
Digital Light intensity detection module: GY-30 Chip : BH1750FVI
Power supply: 3V-5V power
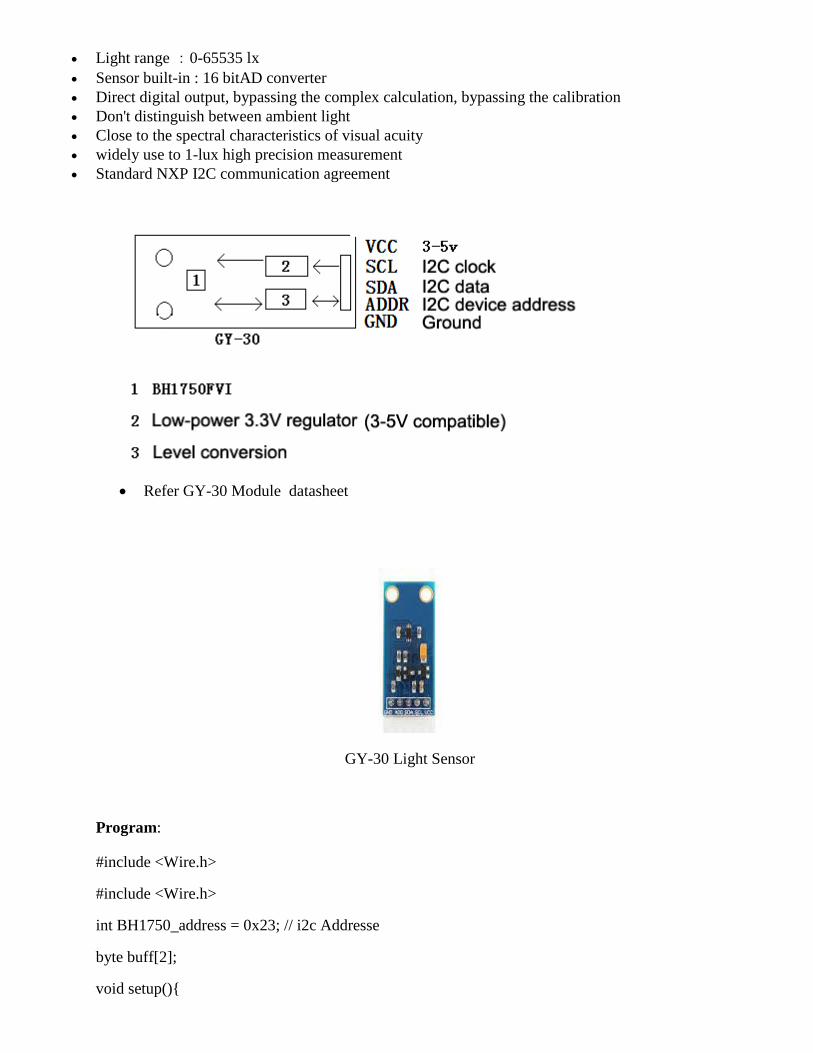
Light range :0-65535 lx
Sensor built-in : 16 bitAD converter
Direct digital output, bypassing the complex calculation, bypassing the calibration
Don't distinguish between ambient light
Close to the spectral characteristics of visual acuity
widely use to 1-lux high precision measurement
Standard NXP I2C communication agreement
Refer GY-30 Module datasheet
GY-30 Light Sensor
Program:
#include <Wire.h>
#include <Wire.h>
int BH1750_address = 0x23; // i2c Addresse
byte buff[2];
void setup()
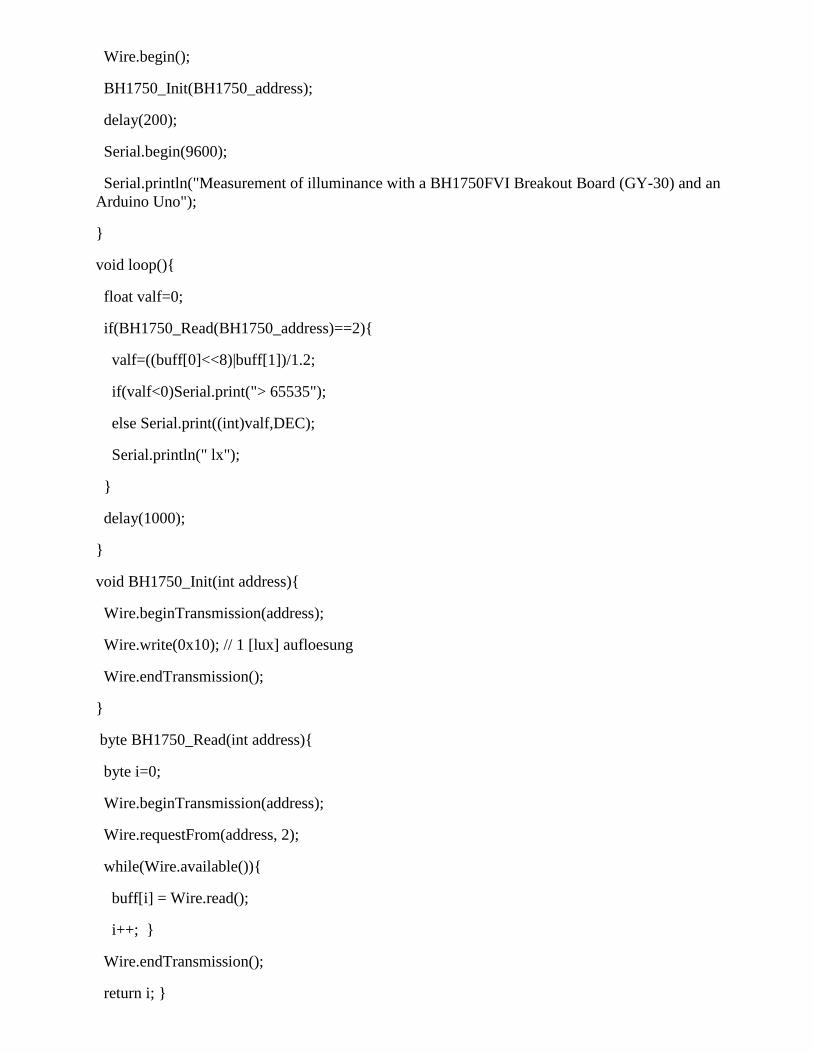
Wire.begin();
BH1750_Init(BH1750_address);
delay(200);
Serial.begin(9600);
Serial.println("Measurement of illuminance with a BH1750FVI Breakout Board (GY-30) and an
Arduino Uno");
void loop()
float valf=0;
if(BH1750_Read(BH1750_address)==2)
valf=((buff[0]<<8)|buff[1])/1.2;
if(valf<0)Serial.print("> 65535");
else Serial.print((int)valf,DEC);
Serial.println(" lx");
delay(1000);
void BH1750_Init(int address)
Wire.beginTransmission(address);
Wire.write(0x10); // 1 [lux] aufloesung
Wire.endTransmission();
byte BH1750_Read(int address)
byte i=0;
Wire.beginTransmission(address);
Wire.requestFrom(address, 2);
while(Wire.available())
buff[i] = Wire.read();
i++;
Wire.endTransmission();
return i;

Observations:
Serial Monitor:
Result:
8. Humidity sensor
Aim: To sense humidity using ARDUINO
Apparatus: 1) Arduino UNO board
2) DHT11 humidity Sensor
6) Small Bread Board
7) Connecting wires
8) Arduino software
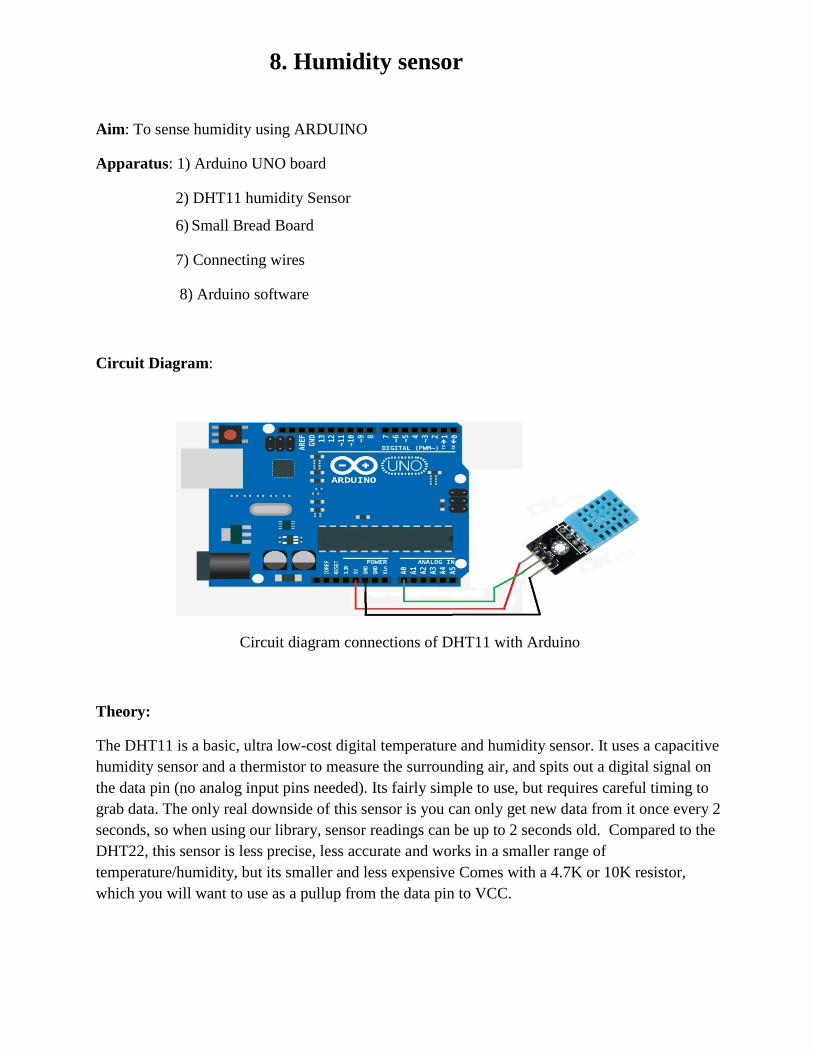
Circuit Diagram:
Circuit diagram connections of DHT11 with Arduino
Theory:
The DHT11 is a basic, ultra low-cost digital temperature and humidity sensor. It uses a capacitive
humidity sensor and a thermistor to measure the surrounding air, and spits out a digital signal on
the data pin (no analog input pins needed). Its fairly simple to use, but requires careful timing to
grab data. The only real downside of this sensor is you can only get new data from it once every 2
seconds, so when using our library, sensor readings can be up to 2 seconds old. Compared to the
DHT22, this sensor is less precise, less accurate and works in a smaller range of
temperature/humidity, but its smaller and less expensive Comes with a 4.7K or 10K resistor,
which you will want to use as a pullup from the data pin to VCC.
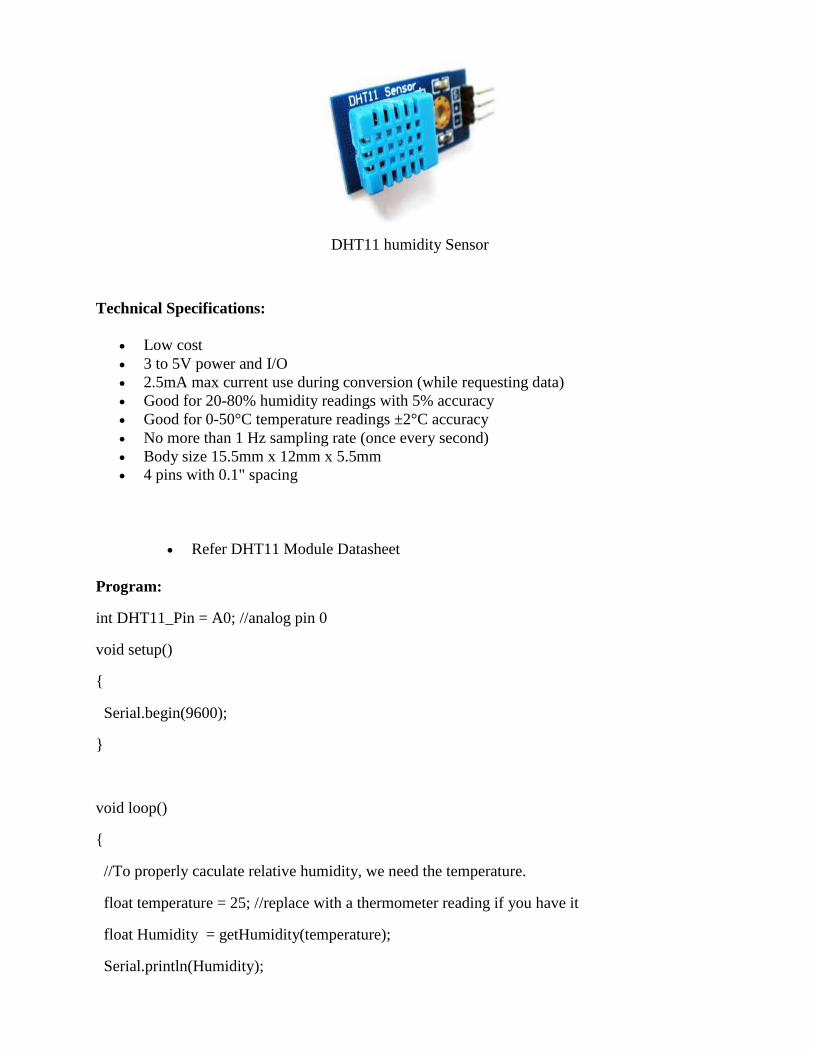
DHT11 humidity Sensor
Technical Specifications:
Low cost
3 to 5V power and I/O
2.5mA max current use during conversion (while requesting data)
Good for 20-80% humidity readings with 5% accuracy
Good for 0-50°C temperature readings ±2°C accuracy
No more than 1 Hz sampling rate (once every second)
Body size 15.5mm x 12mm x 5.5mm
4 pins with 0.1" spacing
Refer DHT11 Module Datasheet
Program:
int DHT11_Pin = A0; //analog pin 0
void setup()
Serial.begin(9600);
void loop()
//To properly caculate relative humidity, we need the temperature.
float temperature = 25; //replace with a thermometer reading if you have it
float Humidity = getHumidity(temperature);
Serial.println(Humidity);

delay(100); //just here to slow it down so you can read it
float getHumidity(float degreesCelsius)
//caculate relative humidity
float supplyVolt = 5.0;
// read the value from the sensor:
int DHT11_Value = analogRead(DHT11_Pin);
float voltage = DHT11_Value/1023. * supplyVolt; // convert to voltage value
float sensorRH = 161.0 * voltage / supplyVolt - 25.8;
float trueRH = sensorRH / (1.0546 - 0.0026 * degreesCelsius); //temperature adjustment
return trueRH;
Observations:
Serial Monitor:
Result:
9. Rainfall and soil moisture sensor
9.A Rainfall sensor
Aim: To detect the rainfall level using Arduino
Apparatus: 1) Arduino UNO board
2) Raindrop sensor
3) LM393 Driver
4) Connecting wires
5) Arduino software
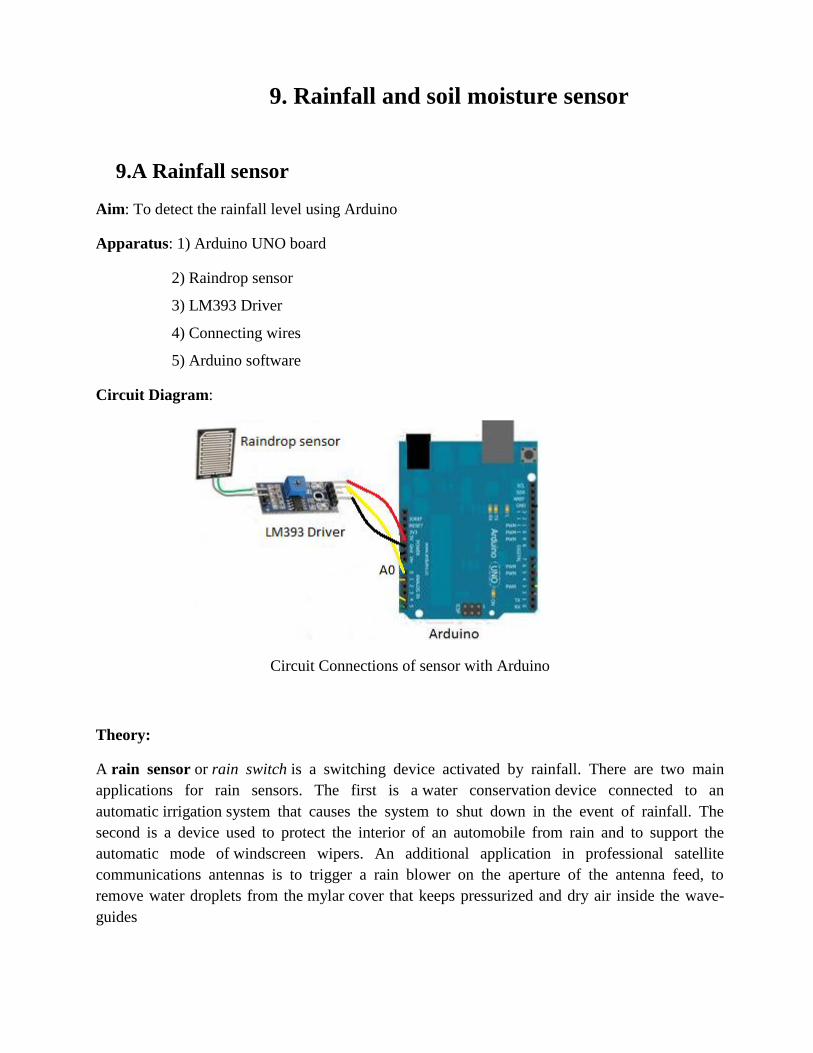
Circuit Diagram:
Circuit Connections of sensor with Arduino
Theory:
A rain sensor or rain switch is a switching device activated by rainfall. There are two main
applications for rain sensors. The first is a water conservation device connected to an
automatic irrigation system that causes the system to shut down in the event of rainfall. The
second is a device used to protect the interior of an automobile from rain and to support the
automatic mode of windscreen wipers. An additional application in professional satellite
communications antennas is to trigger a rain blower on the aperture of the antenna feed, to
remove water droplets from the mylar cover that keeps pressurized and dry air inside the wave-
guides
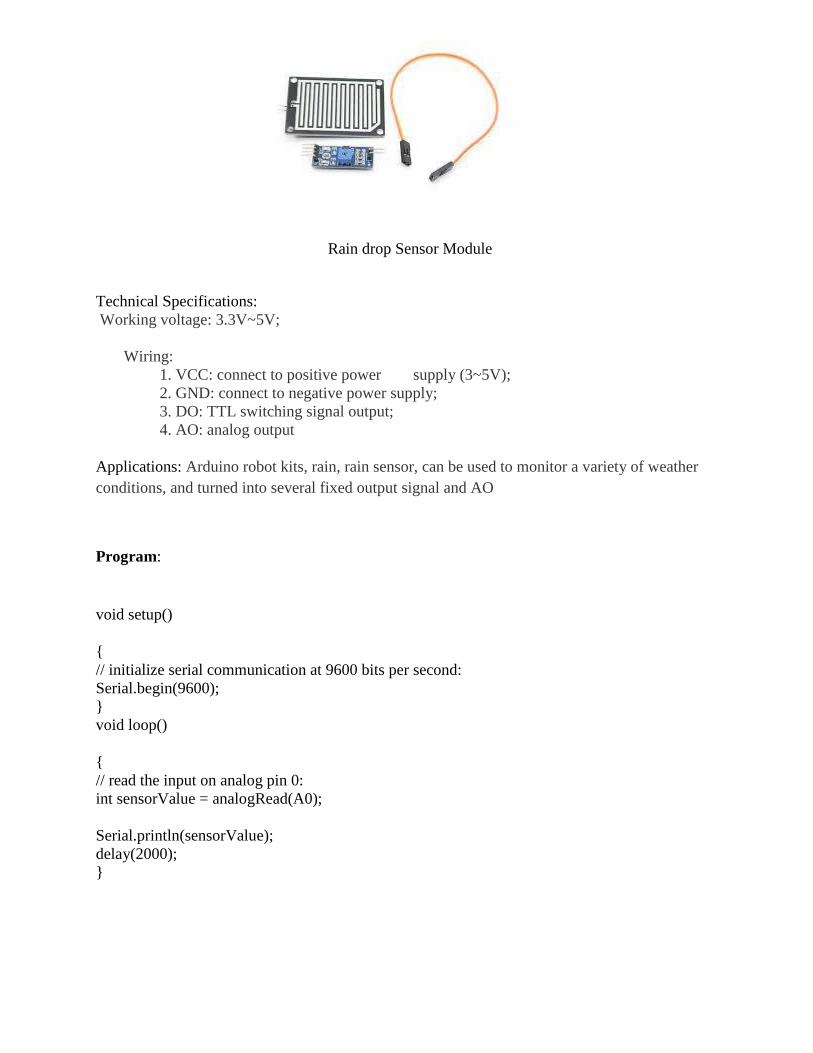
Rain drop Sensor Module
Technical Specifications:
Working voltage: 3.3V~5V;
Wiring:
1. VCC: connect to positive power supply (3~5V);
2. GND: connect to negative power supply;
3. DO: TTL switching signal output;
4. AO: analog output
Applications: Arduino robot kits, rain, rain sensor, can be used to monitor a variety of weather
conditions, and turned into several fixed output signal and AO
Program:
void setup()
// initialize serial communication at 9600 bits per second:
Serial.begin(9600);
void loop()
// read the input on analog pin 0:
int sensorValue = analogRead(A0);
Serial.println(sensorValue);
delay(2000);

Observations:
Serial Monitor:
Result:
9.B. Soil moisture detection circuitry
Aim: To detect the Moisture Content using Arduino
Apparatus: 1) Arduino UNO board
2) Soil moisture sensor
3) LM393 Driver
4) Connecting wires
5) Arduino software
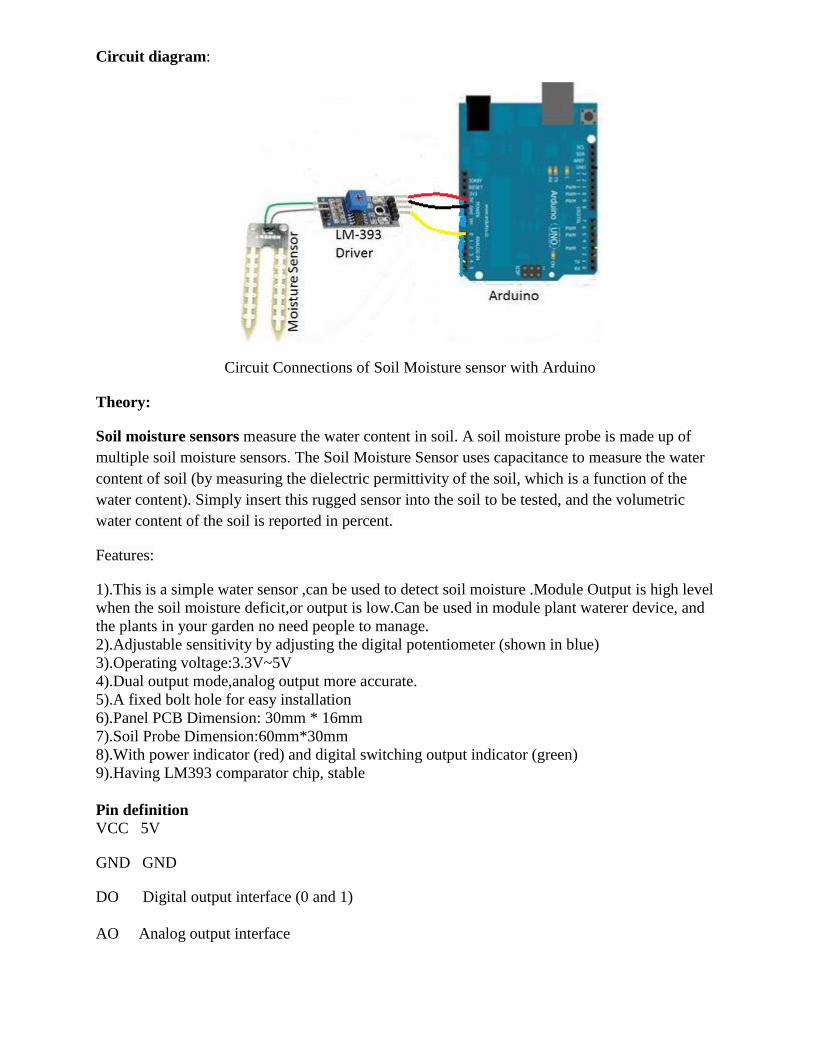
Circuit diagram:
Circuit Connections of Soil Moisture sensor with Arduino
Theory:
Soil moisture sensors measure the water content in soil. A soil moisture probe is made up of
multiple soil moisture sensors. The Soil Moisture Sensor uses capacitance to measure the water
content of soil (by measuring the dielectric permittivity of the soil, which is a function of the
water content). Simply insert this rugged sensor into the soil to be tested, and the volumetric
water content of the soil is reported in percent.
Features:
1).This is a simple water sensor ,can be used to detect soil moisture .Module Output is high level
when the soil moisture deficit,or output is low.Can be used in module plant waterer device, and
the plants in your garden no need people to manage.
2).Adjustable sensitivity by adjusting the digital potentiometer (shown in blue)
3).Operating voltage:3.3V~5V
4).Dual output mode,analog output more accurate.
5).A fixed bolt hole for easy installation
6).Panel PCB Dimension: 30mm * 16mm
7).Soil Probe Dimension:60mm*30mm
8).With power indicator (red) and digital switching output indicator (green)
9).Having LM393 comparator chip, stable
Pin definition
VCC 5V
GND GND
DO Digital output interface (0 and 1)
AO Analog output interface
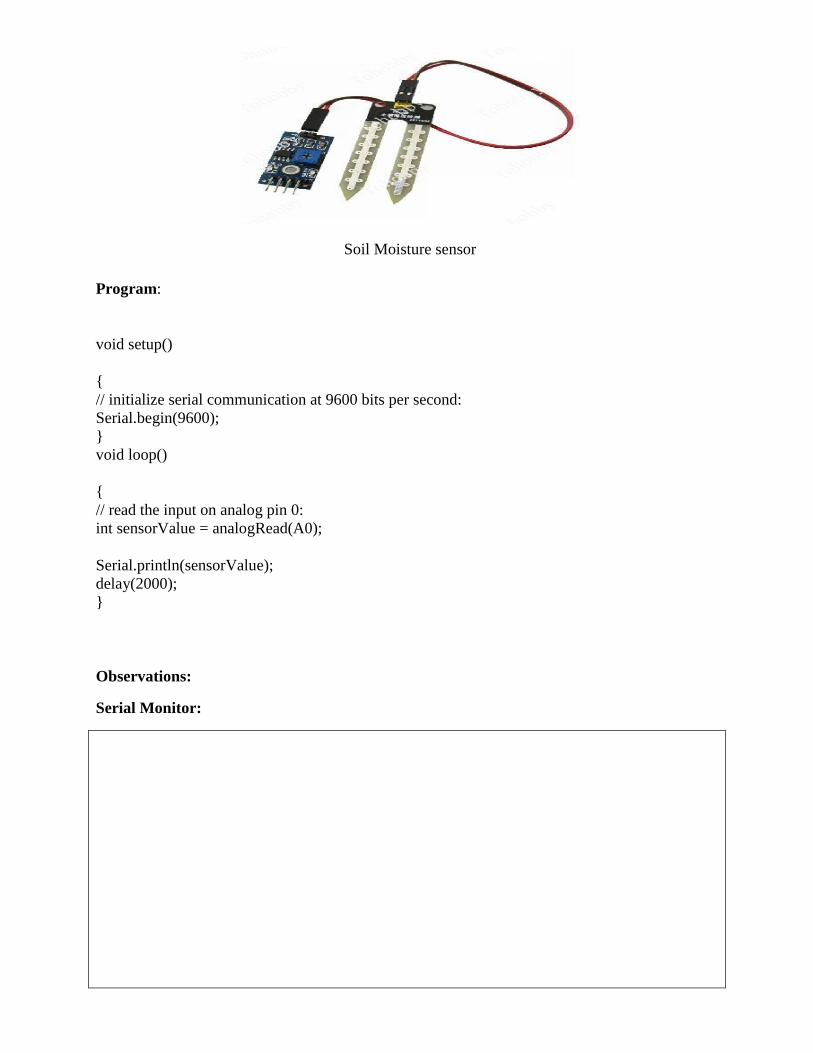
Soil Moisture sensor
Program:
void setup()
// initialize serial communication at 9600 bits per second:
Serial.begin(9600);
void loop()
// read the input on analog pin 0:
int sensorValue = analogRead(A0);
Serial.println(sensorValue);
delay(2000);
Observations:
Serial Monitor:

Result:
10. Motion Sensor
Aim: To detect the Motion using Arduino
Apparatus: 1) Arduino UNO board
2) Soil moisture sensor
3) LM393 Driver
4) Connecting wires
5) Arduino software
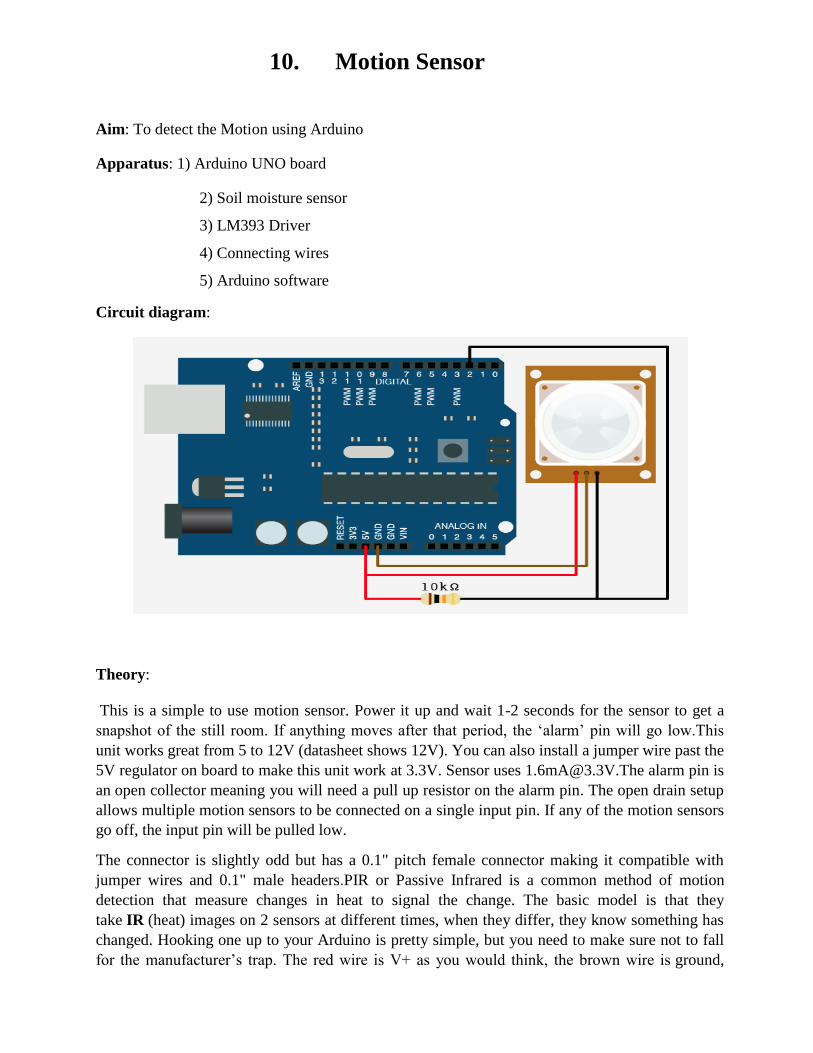
Circuit diagram:
Theory:
This is a simple to use motion sensor. Power it up and wait 1-2 seconds for the sensor to get a
snapshot of the still room. If anything moves after that period, the „alarm‟ pin will go low.This
unit works great from 5 to 12V (datasheet shows 12V). You can also install a jumper wire past the
5V regulator on board to make this unit work at 3.3V. Sensor uses [email protected] alarm pin is
an open collector meaning you will need a pull up resistor on the alarm pin. The open drain setup
allows multiple motion sensors to be connected on a single input pin. If any of the motion sensors
go off, the input pin will be pulled low.
The connector is slightly odd but has a 0.1" pitch female connector making it compatible with
jumper wires and 0.1" male headers.PIR or Passive Infrared is a common method of motion
detection that measure changes in heat to signal the change. The basic model is that they
take IR (heat) images on 2 sensors at different times, when they differ, they know something has
changed. Hooking one up to your Arduino is pretty simple, but you need to make sure not to fall
for the manufacturer‟s trap. The red wire is V+ as you would think, the brown wire is ground,
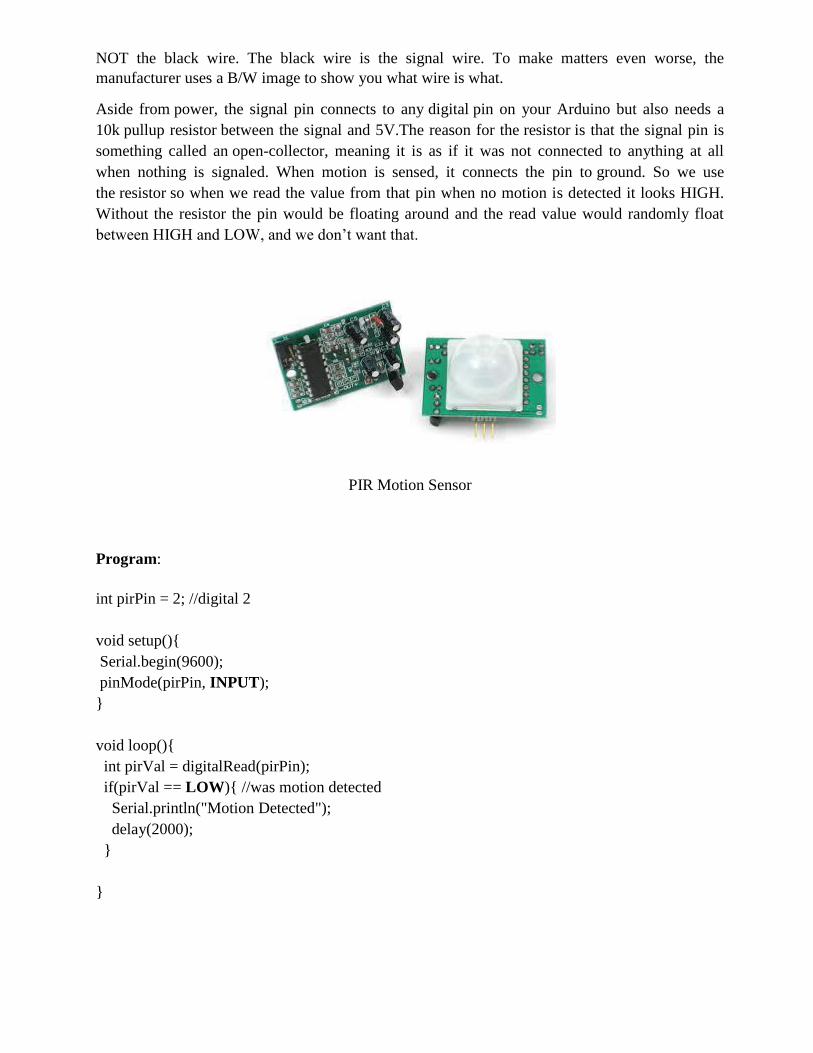
NOT the black wire. The black wire is the signal wire. To make matters even worse, the
manufacturer uses a B/W image to show you what wire is what.
Aside from power, the signal pin connects to any digital pin on your Arduino but also needs a
10k pullup resistor between the signal and 5V.The reason for the resistor is that the signal pin is
something called an open-collector, meaning it is as if it was not connected to anything at all
when nothing is signaled. When motion is sensed, it connects the pin to ground. So we use
the resistor so when we read the value from that pin when no motion is detected it looks HIGH.
Without the resistor the pin would be floating around and the read value would randomly float
between HIGH and LOW, and we don‟t want that.
PIR Motion Sensor
Program:
int pirPin = 2; //digital 2
void setup()
Serial.begin(9600);
pinMode(pirPin, INPUT);
void loop()
int pirVal = digitalRead(pirPin);
if(pirVal == LOW) //was motion detected
Serial.println("Motion Detected");
delay(2000);

Observations:
Serial Monitor:
Result:
11. Measurement of Power and Energy
AIM: To calibrate the given energy meter using a wattmeter.
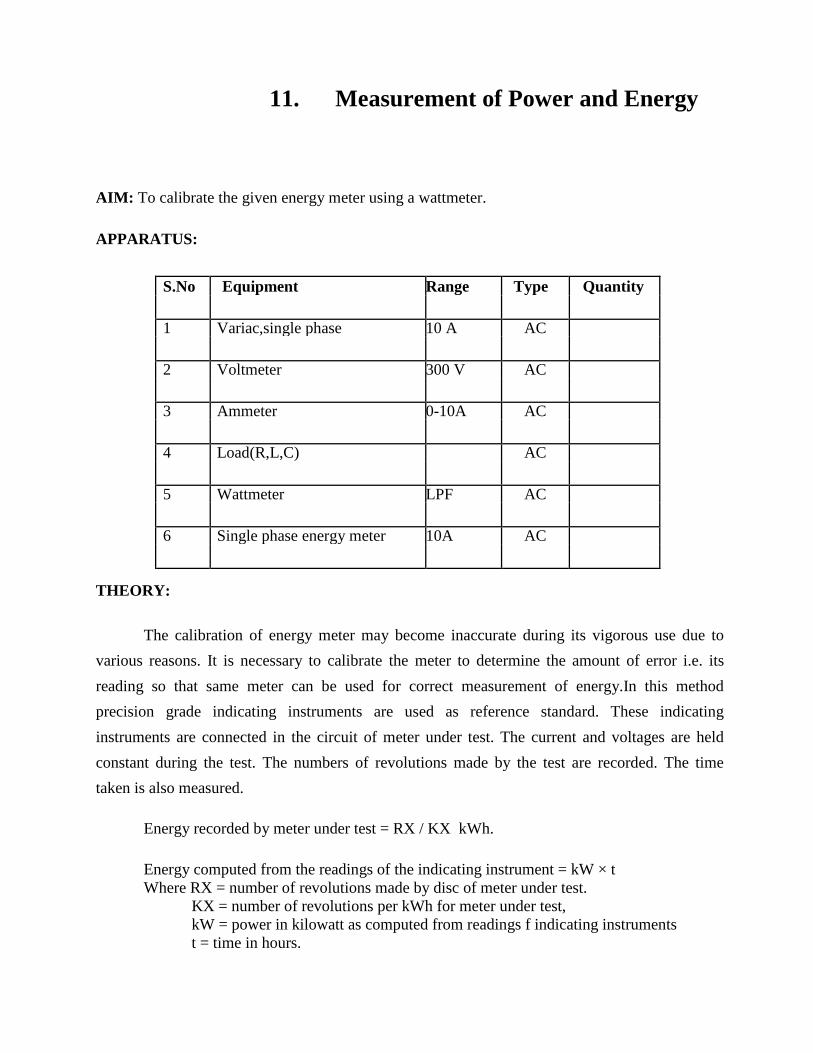
APPARATUS:
S.No Equipment Range Type Quantity
1 Variac,single phase 10 A AC
2 Voltmeter 300 V AC
3 Ammeter 0-10A AC
4 Load(R,L,C) AC
5 Wattmeter LPF AC
6 Single phase energy meter 10A AC
THEORY:
The calibration of energy meter may become inaccurate during its vigorous use due to
various reasons. It is necessary to calibrate the meter to determine the amount of error i.e. its
reading so that same meter can be used for correct measurement of energy.In this method
precision grade indicating instruments are used as reference standard. These indicating
instruments are connected in the circuit of meter under test. The current and voltages are held
constant during the test. The numbers of revolutions made by the test are recorded. The time
taken is also measured.
Energy recorded by meter under test = RX / KX kWh.
Energy computed from the readings of the indicating instrument = kW × t
Where RX = number of revolutions made by disc of meter under test.
KX = number of revolutions per kWh for meter under test,
kW = power in kilowatt as computed from readings f indicating instruments
t = time in hours.
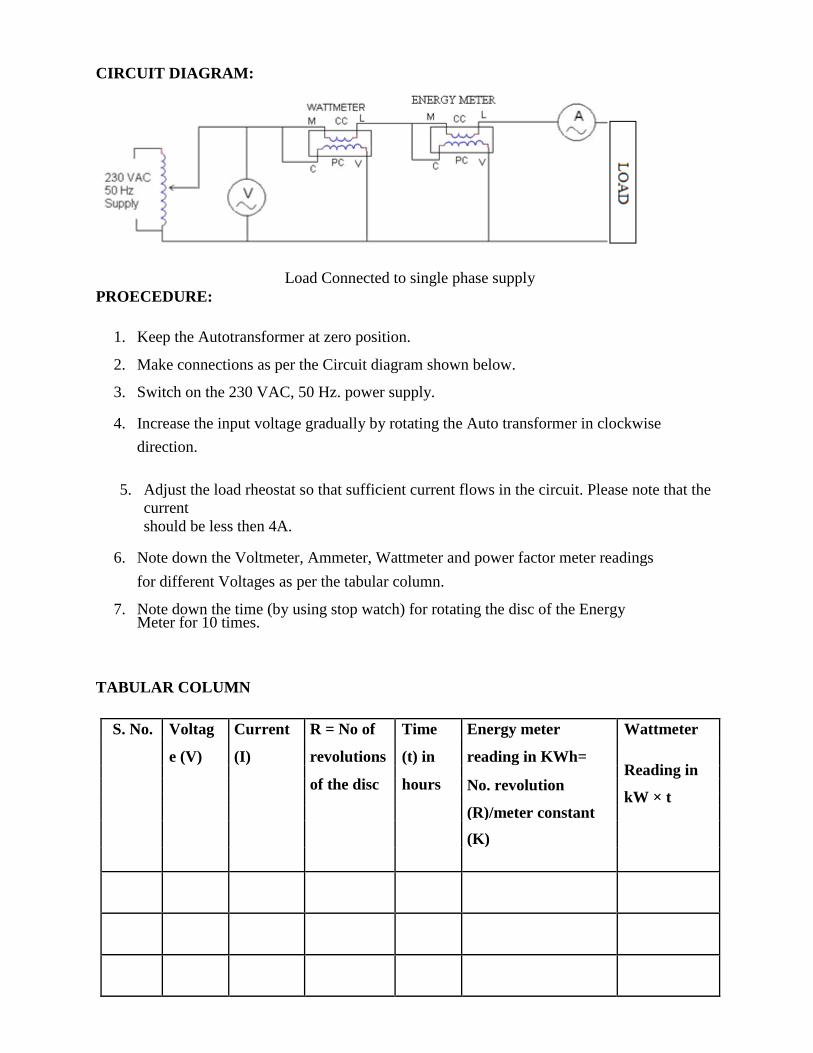
CIRCUIT DIAGRAM:
Load Connected to single phase supply
PROECEDURE:
1. Keep the Autotransformer at zero position.
2. Make connections as per the Circuit diagram shown below.
3. Switch on the 230 VAC, 50 Hz. power supply.
4. Increase the input voltage gradually by rotating the Auto transformer in clockwise
direction.
5. Adjust the load rheostat so that sufficient current flows in the circuit. Please note that the
current
should be less then 4A.
6. Note down the Voltmeter, Ammeter, Wattmeter and power factor meter readings
for different Voltages as per the tabular column.
7. Note down the time (by using stop watch) for rotating the disc of the Energy Meter for 10 times.
TABULAR COLUMN
S. No. Voltag Current R = No of Time Energy meter Wattmeter
e (V) (I) revolutions (t) in reading in KWh= Reading in
of the disc hours
No. revolution kW × t
(R)/meter constant
(K)

RESULT:
12. Accelerometer sensor
Aim: To Show how to take an analog 3-axis accelerometer and use it to sense simple orientation
with it using Arduino
Apparatus: 1) Arduino UNO board
2) ADXL335 3-axis accelerometer
3) Connecting wires
4) Arduino software
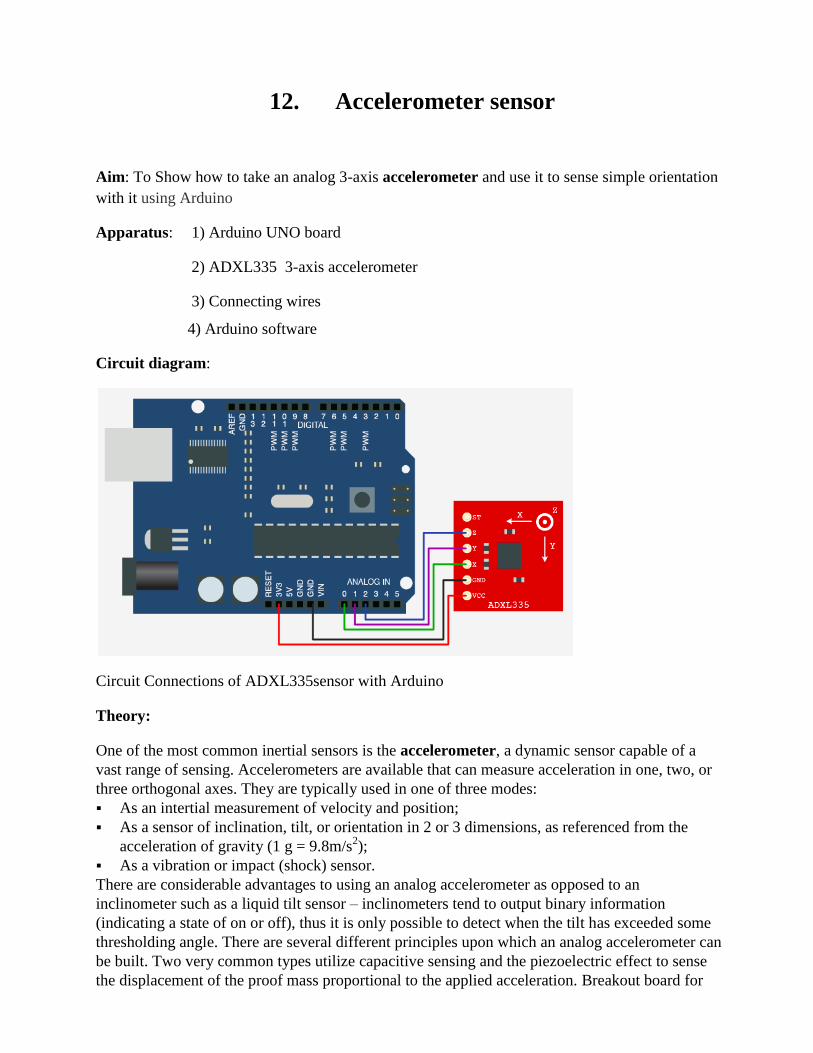
Circuit diagram:
Circuit Connections of ADXL335sensor with Arduino
Theory:
One of the most common inertial sensors is the accelerometer, a dynamic sensor capable of a
vast range of sensing. Accelerometers are available that can measure acceleration in one, two, or
three orthogonal axes. They are typically used in one of three modes:
As an intertial measurement of velocity and position;
As a sensor of inclination, tilt, or orientation in 2 or 3 dimensions, as referenced from the
acceleration of gravity (1 g = 9.8m/s2);
As a vibration or impact (shock) sensor.
There are considerable advantages to using an analog accelerometer as opposed to an
inclinometer such as a liquid tilt sensor – inclinometers tend to output binary information
(indicating a state of on or off), thus it is only possible to detect when the tilt has exceeded some
thresholding angle. There are several different principles upon which an analog accelerometer can
be built. Two very common types utilize capacitive sensing and the piezoelectric effect to sense
the displacement of the proof mass proportional to the applied acceleration. Breakout board for
the 3 axis ADXL335 from Analog Devices. This is the latest in a long, proven line of analog
sensors - the holy grail of accelerometers. The ADXL335 is a triple axis MEMS accelerometer
with extremely low noise and power consumption - only 320uA! The sensor has a full sensing
range of +/-3g.There is no on-board regulation, provided power should be between 1.8 and
3.6VDC.Board comes fully assembled and tested with external components installed. The
included 0.1uF capacitors set the bandwidth of each axis to 50Hz.
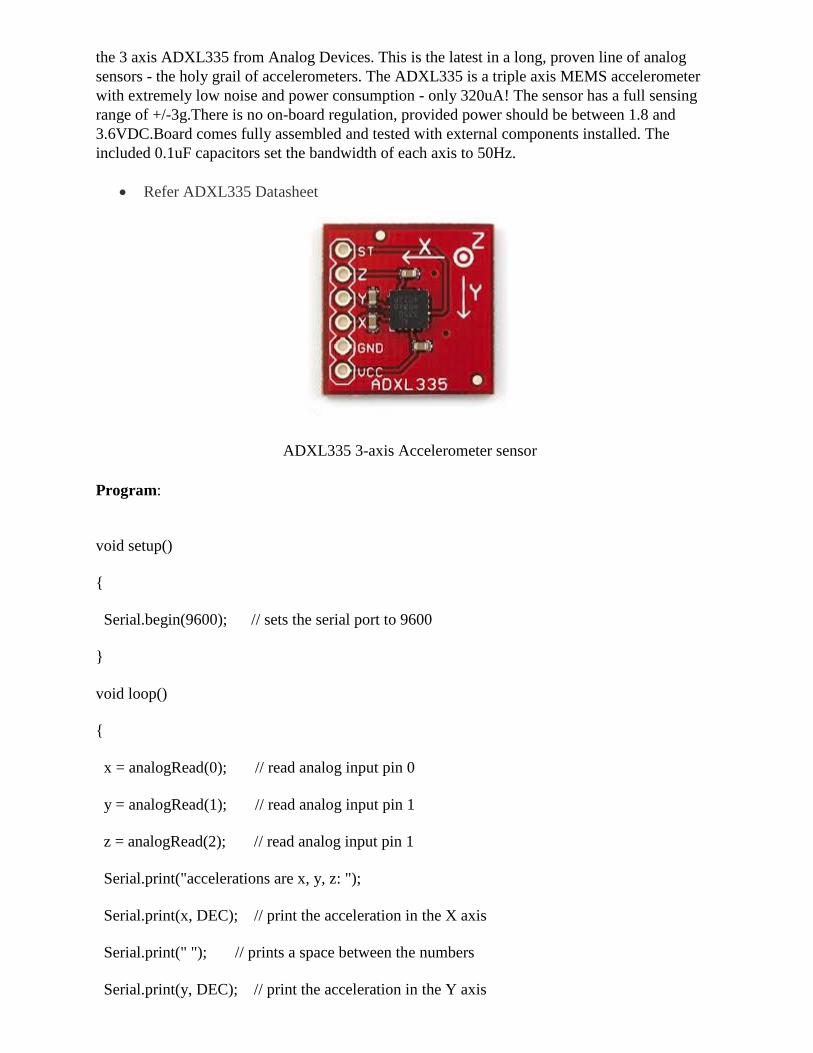
Refer ADXL335 Datasheet
ADXL335 3-axis Accelerometer sensor
Program:
void setup()
Serial.begin(9600); // sets the serial port to 9600
void loop()
x = analogRead(0); // read analog input pin 0
y = analogRead(1); // read analog input pin 1
z = analogRead(2); // read analog input pin 1
Serial.print("accelerations are x, y, z: ");
Serial.print(x, DEC); // print the acceleration in the X axis
Serial.print(" "); // prints a space between the numbers
Serial.print(y, DEC); // print the acceleration in the Y axis

Serial.print(" "); // prints a space between the numbers
Serial.println(z, DEC); // print the acceleration in the Z axis
delay(100); // wait 100ms for next reading
Observations:
Serial Monitor:
Result:
13.MEASUREMENT OF RESISTANCE
AIM: To determine the value of the resistance of given Kelvin Double Bridge
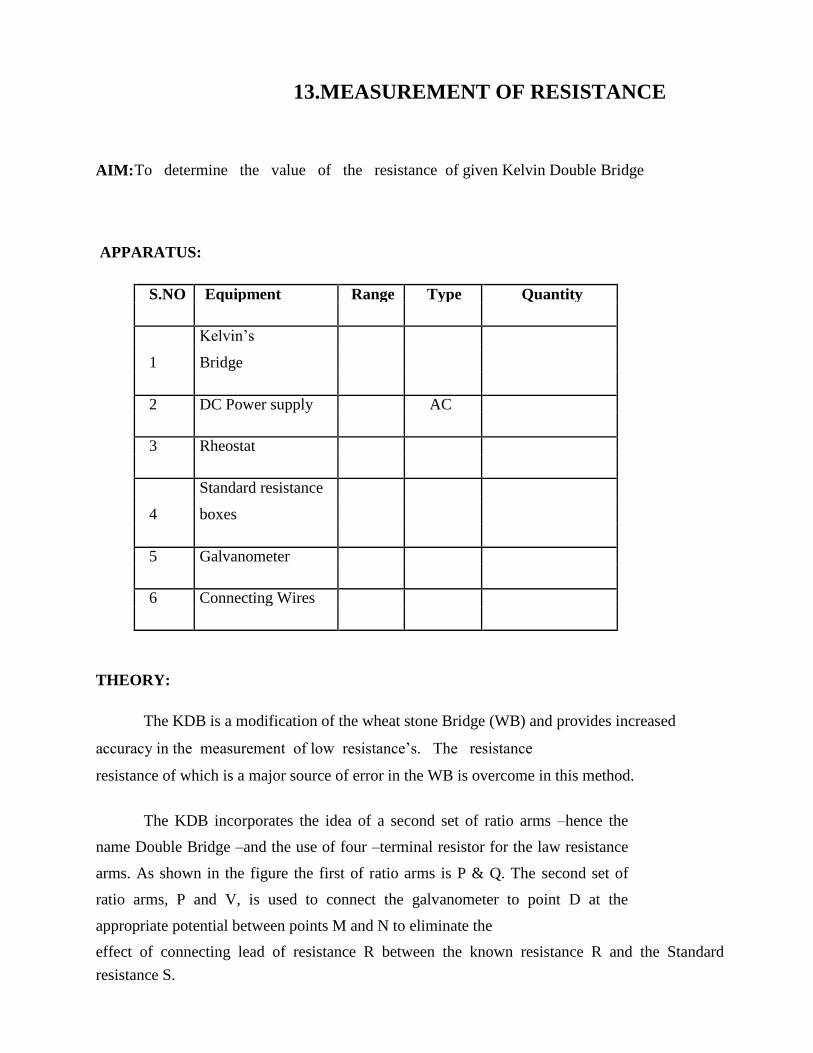
APPARATUS:
S.NO Equipment Range Type Quantity
Kelvin‟s
1 Bridge
2 DC Power supply AC
3 Rheostat
Standard resistance
4 boxes
5 Galvanometer
6 Connecting Wires
THEORY:
The KDB is a modification of the wheat stone Bridge (WB) and provides increased
accuracy in the measurement of low resistance‟s. The resistance
resistance of which is a major source of error in the WB is overcome in this method.
The KDB incorporates the idea of a second set of ratio arms –hence the
name Double Bridge –and the use of four –terminal resistor for the law resistance
arms. As shown in the figure the first of ratio arms is P & Q. The second set of
ratio arms, P and V, is used to connect the galvanometer to point D at the
appropriate potential between points M and N to eliminate the
effect of connecting lead of resistance R between the known resistance R and the Standard
resistance S.
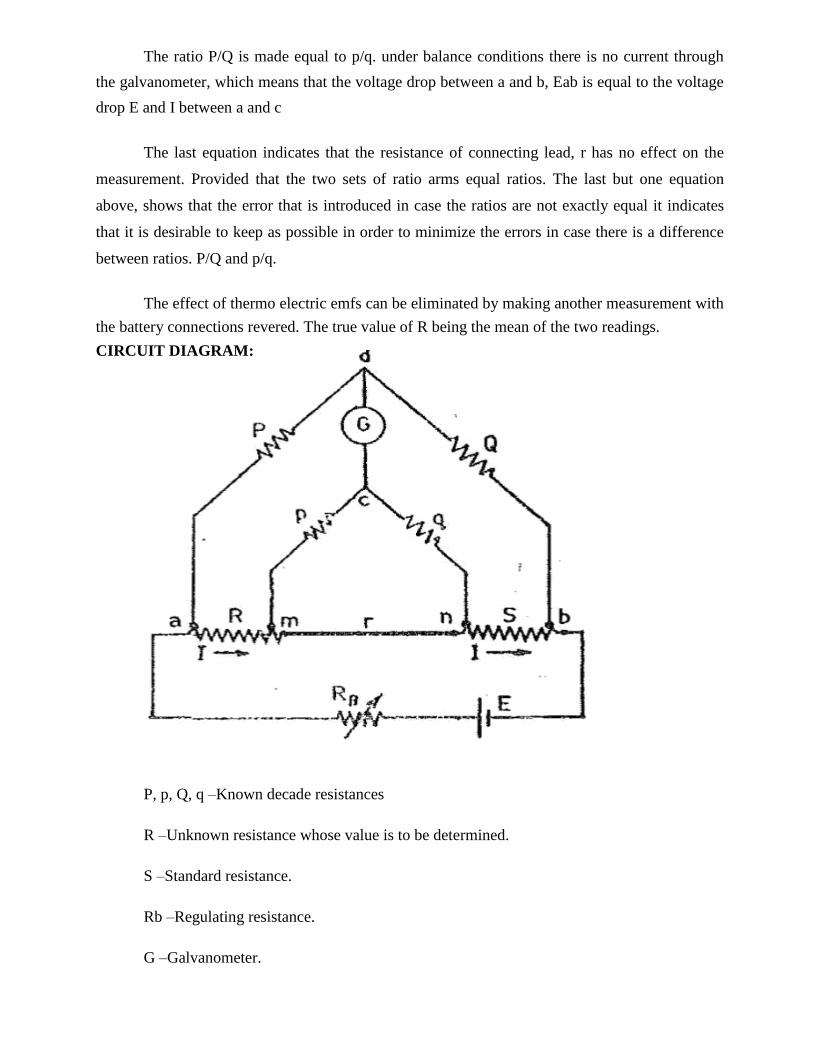
The ratio P/Q is made equal to p/q. under balance conditions there is no current through
the galvanometer, which means that the voltage drop between a and b, Eab is equal to the voltage
drop E and I between a and c
The last equation indicates that the resistance of connecting lead, r has no effect on the
measurement. Provided that the two sets of ratio arms equal ratios. The last but one equation
above, shows that the error that is introduced in case the ratios are not exactly equal it indicates
that it is desirable to keep as possible in order to minimize the errors in case there is a difference
between ratios. P/Q and p/q.
The effect of thermo electric emfs can be eliminated by making another measurement with
the battery connections revered. The true value of R being the mean of the two readings.
CIRCUIT DIAGRAM:
P, p, Q, q –Known decade resistances
R –Unknown resistance whose value is to be determined.
S –Standard resistance.
Rb –Regulating resistance.
G –Galvanometer.

K –Key switch.
PROCEDURE:
1. The connections as per the circuit diagram.
2. Keep Q = q = 1000 ohms and S = 1 ohm. The ratio P/Q should
a. always be kept equal to p/q. as Q =q, we must keep P = p.
b.To start with P and p may be kept at zero position.
3. Switch on the DC power supply and adjust the voltage to about 2
a. volts with the regulating resistance cut in fully.
4. Adjust P and p simultaneously to get balance. If a light spot
5. Galvanometer is used, then increases the sensitivity in steps and
a. get exact balance in the direct portion. Bring back the sensitivity
b.Knob of the galvanometer to the starting position.
6. Note the value of P.
7. Repeat steps (3) and (4) reversing the DC power supply polarity.
8. Repeat steps (3) to (5) above fo
9. Q = q = 100 ohms, 10 ohms, 1 ohms choosing suitable values for S
a. So that the value of p at balance is obtained in hundreds.
10. The unknown resistance is calculated in each case using the Formula R = P/Q.S
TABULAR COLUMN:
S.No Main dial Slide wire Multiplier
Result:
14.MEASUREMENT OF INDUCTANCE
AIM: To determine the values of the inductance of a given decade inductance box. APPARATUS: Anderson‟s Bridge kit, Probes
THEORY:
This is modified version-inductance of Maxwell‟s is measured in brid comparison with a
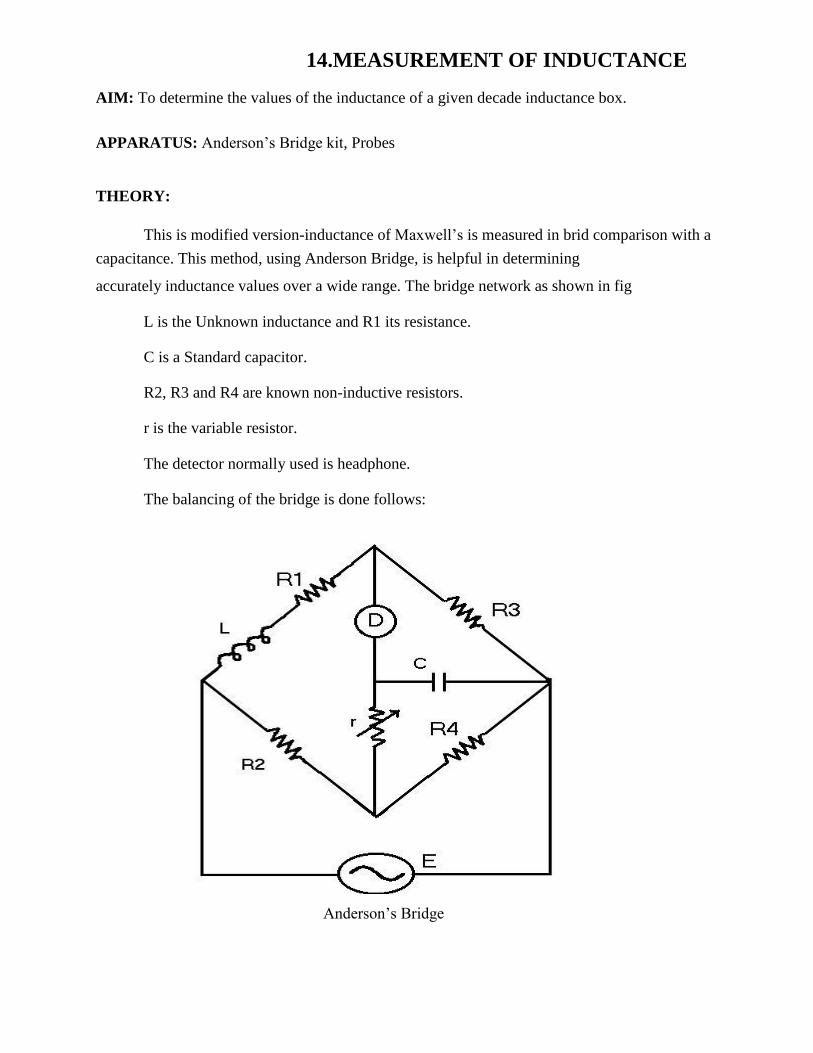
capacitance. This method, using Anderson Bridge, is helpful in determining accurately inductance values over a wide range. The bridge network as shown in fig
L is the Unknown inductance and R1 its resistance.
C is a Standard capacitor.
R2, R3 and R4 are known non-inductive resistors.
r is the variable resistor.
The detector normally used is headphone.
The balancing of the bridge is done follows:
Anderson‟s Bridge
The bridge is first balanced using d.c supply and head phone as detector. Resistance R2,
R3 and R4 are properly adjusted so that balance condition is obtained. and balancing of
the bridge is again obtained by adjusting resistance r
R1 = (R2R3/R4)-r1
L = C *[r (R3xR4) + (R3+R4)]R4
PROCEDURE:
1. Connect diagram of r inductance Anderson‟s measurement as shown bridge in fig
2. Select any one standard inductance (unknown) from given inductance bank
3. Now plug in the LED in to the socket adjust pot r and to get minimum glow.
4. After null position, unknown inductor L calculated by using standard formula which
is given above.
Observation:
RESULT:
15. MEASUREMENT OF CAPACITANCE
AIM:
To determine the value of given capacitor and to obtain its dissipation factor.
APPARATUS: Schering Bridge kit
Probes
THEORY:
Alternating current bridge methods are of outstanding importance for measurement of
electrical quantities, measurement of Inductance, Capacitance, Storage Factor, Loss Factor, etc.
may be made conveniently and accurately by employing AC bridge network.
The AC Bridge is a natural out growth of the Wheatstone bridge. An AC bridge, in its
basic form, consists of four arms, a source of excitation and a balanced (Null detector). In an
AC bridge each of the four arms is impedance, battery and the galvanometer of the Wheatstone
bridge are replaced respectively by an AC source and a detector sensitive to small alternating
potential difference.
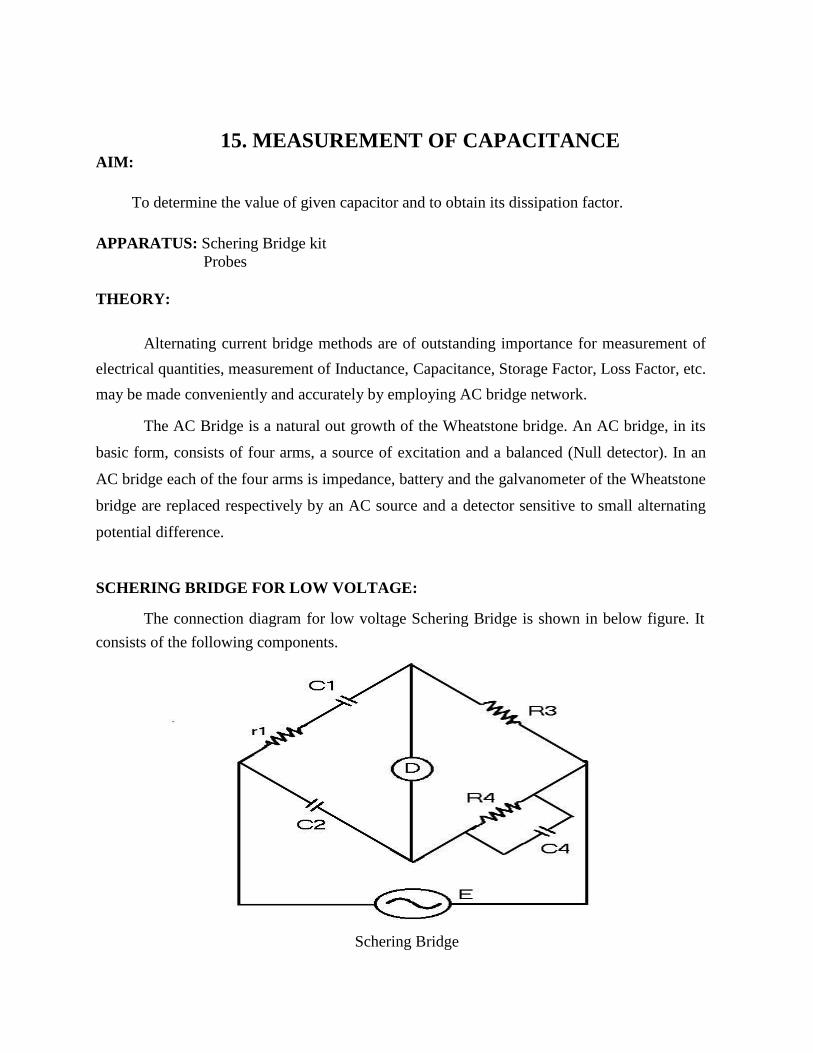
SCHERING BRIDGE FOR LOW VOLTAGE:
The connection diagram for low voltage Schering Bridge is shown in below figure. It
consists of the following components.
Schering Bridge
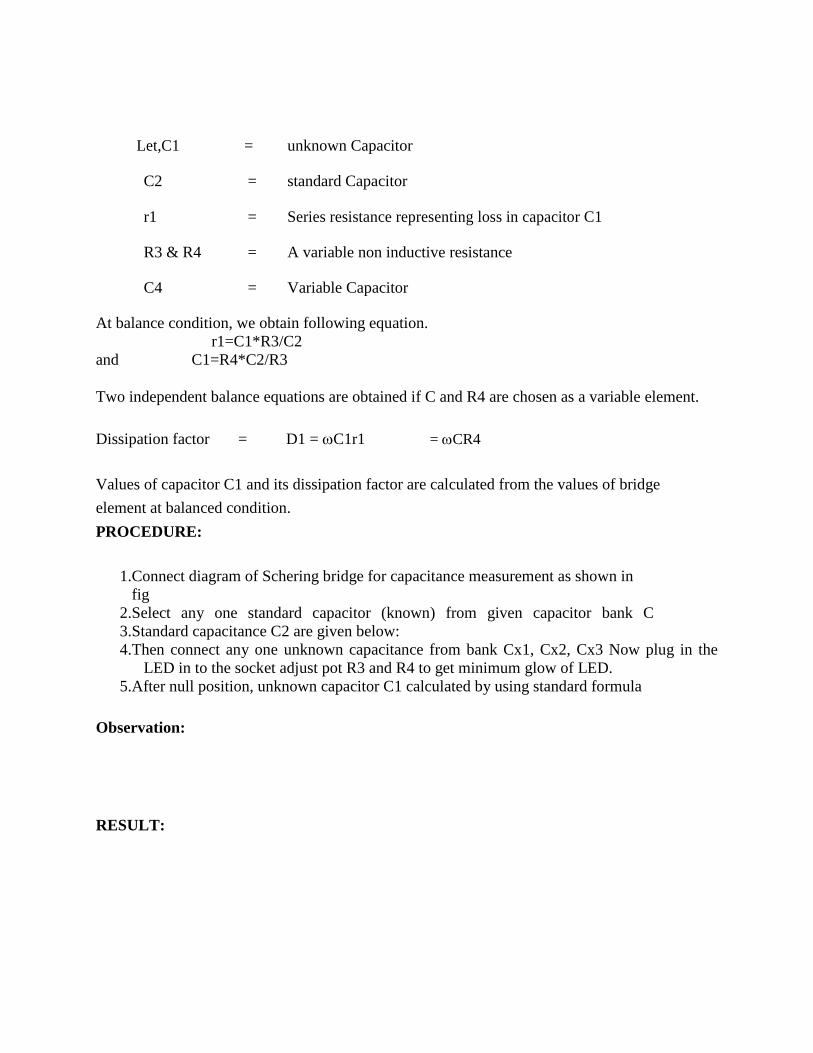
Let,C1 = unknown Capacitor
C2 = standard Capacitor
r1 = Series resistance representing loss in capacitor C1
R3 & R4 = A variable non inductive resistance
C4 = Variable Capacitor At balance condition, we obtain following equation.
r1=C1*R3/C2
and C1=R4*C2/R3
Two independent balance equations are obtained if C and R4 are chosen as a variable element.
Dissipation factor = D1 = C1r1 = CR4 Values of capacitor C1 and its dissipation factor are calculated from the values of bridge
element at balanced condition.
PROCEDURE:
1.Connect diagram of Schering bridge for capacitance measurement as shown in
fig
2.Select any one standard capacitor (known) from given capacitor bank C
3.Standard capacitance C2 are given below:
4.Then connect any one unknown capacitance from bank Cx1, Cx2, Cx3 Now plug in the
LED in to the socket adjust pot R3 and R4 to get minimum glow of LED.
5.After null position, unknown capacitor C1 calculated by using standard formula Observation: RESULT:
