sentac - university of minnesota
TRANSCRIPT

Sentencing Trends andCorrectional Treatment
in DelawareApril 10, 2002
A Report to the Joint Finance Committee of the Delaware General Assembly
prepared byThe Delaware Statistical Analysis Center, John P. O’Connell, Director
in consultation withElizabeth A. Peyton, Peyton Consulting Services and Peter B. Rockholz, Criminal Justice Solutions, Inc.
submitted by
SENTACThe Sentencing Accountability Commission of Delaware


Sentencing Trends andCorrectional Treatment
in Delaware
April 10, 2002
A Report to the Joint Finance Committeeof the
Delaware General Assembly
prepared byThe Delaware Statistical Analysis Center, John P. O’Connell, Director
in consultation withElizabeth A. Peyton, Peyton Consulting Services and
Peter B. Rockholz, Criminal Justice Solutions, Inc.
submitted by
SENTACThe Sentencing Accountability Commission of Delaware
Sentencing Trends and Correctional Treatment in Delaware
ii
SENTAC
Acknowledgments
MEMBERS OF THE SENTENCINGACCOUNTABILITY COMMISSION
Hon. Richard S. Gebelein, Chairman Hon. M. Jane BradyAssociate Judge, Superior Court Attorney General
Col. Aaron Chaffinch Joseph Schoell. Esq.Delaware State Police Governor’s Office
Hon. T. Henley Graves Hon. Patricia GriffinAssociate Judge, Superior Court Chief Magistrate
Hon. William Chapman Andre Bouchard, Esq.Associate Judge, Family Court
Col. John Cunningham Hon. Lawrence SullivanNew Castle County Police Public Defender
Hon. Stanley TaylorCommissioner of Correction
This project was supported by grant no. 2001DBBX0010 awarded by the Bureau of Justice Assistance,Office of Justice Programs, U.S. Department of Justice. The Bureau of Justice Assistance is a compo-nent of the Office of Justice Programs, which also includes the Bureau of Justice Statistics, the Na-tional Institute of Justice, the Office of Juvenile Justice and Delinquency Prevention, and the Office ofVictims of Crime. Points of view or opinions in this document are those of the author and do not nec-essarily represent the official position or policies of the United States Department of Justice. Thisproject was awarded by the Criminal Justice Council and points of view or opinions in this documentare those of the author and do not necessarily represent the official position or policies of the CriminalJustice Council.

Sentencing Trends and Correctional Treatment in Delaware
iii
SENTAC
Table of Contents
TABLE OF CONTENTS
FIGURES AND TABLES ................. iv
ACKNOWLEDGMENTS .................. v
EXECUTIVE SUMMARY ............... vii
Sentencing Trends ........................... vii
Correctional Treatment .................. viii
Recommendations .............................. x
INTRODUCTION ............................ 1
SENTENCING TRENDS INDELAWARE .................................... 3
Sentencing Reform In Delaware ....... 5Sentencing Guidelines ........................... 7Truth in Sentencing ................................ 8
SENTAC is a Process ........................... 9Flowing Down ........................................ 10Flowing Up .............................................. 10Guidelines for Violation of
Probation ............................................ 10Implementation of SENTAC
Graduated Sanctions ..................... 10
A Major Shift to Treatment: TheBiggest Change Yet .......................... 11
Addiction Sentencing ......................... 12
Sentencing Patterns Are Consistentwith Goals of SENTAC ...................... 13
SENTAC Fundamentally ChangesThe Criminal Justice System ........... 15
Focus on Offender Management .... 15Treatment is Woven into the
Fabric of Justice ................................ 17Population Trends ................................ 19Length of Stay ........................................ 21
Discussion ......................................... 22
CORRECTIONAL TREATMENTIN DELAWARE.............................. 25
Background and Overview ............. 27What is a Therapeutic
Community? ...................................... 29Therapeutic Communities Have
Emerged as the PreferredTreatment for Offenders ............... 31
Delaware’s Statewide CorrectionalTreatment System ............................ 33
Key/Crest Continuum .......................... 34Greentree Program .............................. 36
Methodology ................................... 38Methodological Limitations ............. 40How the System is Used—How
do People get There? ..................... 41
Results .............................................. 43A Comparison of Key and
Greentree ........................................... 43Crest Programs ...................................... 46Completion of Crest Enhances
the Results of Key ............................ 50Comparison of All Programs ............. 51
Qualitative Analysis ......................... 54The Greentree Program ...................... 54The Key/Crest Programs ..................... 55
Discussion ......................................... 57
RECOMMENDATIONS ................. 59
REFERENCES ............................... 61
APPENDIX A ................................ 63

Sentencing Trends and Correctional Treatment in Delaware
iv
SENTAC
Table of Contents
FIGURES
Figure 1. Pre- and Post-SENTACSentencing Alternatives ............................. 6
Figure 2. Percent Time Served:Pre-Post Truth in Sentencing .................... 9
Figure 3. SENTAC GraduatedSanctions ...................................................... 11
Figure 4. Violation of Probation:Admitted to DOC Level V ........................ 17
Figure 5. Delaware Prison Population :Sentences Greater Than One Year ........ 20
Figure 6. DOC Population Increasesand Changes ................................................ 21
Figure 7. Drug Complaints ........................... 28
Figure 8. Delaware (DOC) CorrectionalTreatment Beds .......................................... 35
Figure 9. Key and Greentree: PercentRearrested Any Felony:1999 Completers ........................................ 44
Figure 10. Key and Greentree: PercentRearrested Title 11 Violent Felony:1999 Completers ........................................ 45
Figure 11. DOCs Surveillance is High:VOPs Key and Greentree: 1999Completers ................................................... 46
Figure 12. All Level IV Crest Programs:Percent Rearrested Any Felony: 1999Completers ................................................... 47
Figure 13. All Level IV Crest Programs:Percent Rearrested Title 11 ViolentFelony: 1999 Completers ......................... 48
Figure 14. DOCs Surveillance is High: CrestVOPs: 1999 Completers ............................ 49
Figure 15. Key-Crest Comparison:Percent Rearrested Any Felony: 1999Completers ................................................... 50
Figure 16. Key-Crest Comparison:Percent Rearrested Title 11 ViolentFelony ............................................................. 51
Figure 17. All Programs: PercentRearrested Any Felony: 1999Completers ................................................... 52
Figure 18. All Programs: PercentRearrested Title 11 Violent Felony:1999 Completers ........................................ 53
TABLES
Table 1. Presumptive SentencingGuidelines ........................................................ 8
Table 2. Superior Court SentencingPatterns by Crime Type ............................ 14
Table 3. Superior Court VOPSentencing 1999 ........................................ 15
Table 4. Summary of 1999 SuperiorCourt Sentencing Patterns: NewCrimes and Violations of Probation ..... 18
Table 5. TC Model vs. Medical Model ........ 30
Table 6. Delaware’s Key and CrestContinuum ................................................... 37
Table 7. Key and Greentree 1999Snapshot Recidivism: PercentRearrested Any Felony ............................. 44
Table 8. Key and Greentree 1999Snapshot Recidivism: PercentRearrested Title 11 Violent Felony ........ 45
Table 9. Level IV Crest 1999 SnapshotRecidivism: Percent RearrestedAny Felony .................................................... 48
Table 10. Level IV Crest 1999 SnapshotRecidivism: Percent RearrestedTitle 11 Violent Felony .............................. 49
Table 11. Felony Rearrest 18 Months atRisk: Comparison of Boot Camp andCorrectional Treatment Programs ........ 53

Sentencing Trends and Correctional Treatment in Delaware
v
SENTAC
Acknowledgments
ACKNOWLEDGMENTS
This report would not have been possible without the contributions of a number ofpeople. David S. Swayze, Esq., volunteered his time to serve as chairman of the com-mittee that developed the draft report. Delaware Corrections Commissioner StanleyTaylor and I also served on the committee. Bryan Sullivan, Ph.D., Office of the Bud-get; Evelyn Nestlerode, Office of the Controller General; and Gail Riblett Rohm,Criminal Justice Council, provided additional support to the committee and helpedshape the report.
Statistical analysis was conducted by John P. O’Connell, Director, Delaware Statisti-cal Analysis Center. Essential staff included Charles P. Huenke, Karen Nold, BrieGannon, Kara Wrede and Richard Harris.
Qualitative analyses were conducted by Beth Peyton, Peyton Consulting Services,and Peter B. Rockholz, Criminal Justice Solutions. Ms. Peyton also served as leadwriter of the report.
Robert M. Hooper, Ph.D. and Sandra Buell from Spectrum Behavioral Services pro-vided information about Key, Crest and aftercare participants, and Ms. Frances Lewisprovided information related to Greentree.
A number of correctional and treatment staff, including wardens, security staff, pro-gram directors, clinical directors and clinical staff provided information and insight.Many program residents and facilitators also contributed their time and information.
I would be remiss if I did not also extend a thank you to the members of the JointFinance Committee of the General Assembly, the Office of the Controller Generaland the Office of the Budget, who made this work possible. Additional financialsupport for this project came from the Edward R. Byrne Memorial Formula Grant,which is administered by the Delaware Criminal Justice Council.
Richard S. GebeleinChairmanDelaware Sentencing Accountability Commission

This page is intentionally left blank.

Sentencing Trends and Correctional Treatment in Delaware
vii
SENTAC
Executive Summary
EXECUTIVE SUMMARYThe accompanying report is intended to explain, describe, and clarify the currentstate of sentencing practices, population trends, and correctional treatment in Dela-ware. It is structured in two interrelated parts, with the first section describing sen-tencing patterns and overall correctional trends, and the second section presentinginformation related to correctional treatment. This document was prepared at therequest of the Delaware General Assembly, who authorized the Sentencing Account-ability Commission (SENTAC) to prepare a report on sentencing trends as well as areport comparing recidivism rates among participants of the Greentree, Key, andCrest correctional treatment programs.
SENTENCING TRENDS
The sentencing reform efforts led by SENTAC have caused sweeping changes inthe administration of justice in the State of Delaware. What began as a five-stephierarchical framework for punishing offenders has evolved into a multi-layeredsystem designed to hold them accountable as well as to foster rehabilitation.
Delaware’s system reflects a comprehensive focus on offender management, and in-cludes a number of structural and programmatic options designed to punish offenderswhile addressing the underlying behavioral problems associated with their criminalactivity. Despite the complexities that result from integrating rehabilitative servicesinto Delaware’s punishment structure, SENTAC believes it is the right thing to do topromote individual change, reduce recidivism and protect the public.
Major findings related to overall correctional trends reveal that:
❒❒❒❒❒ The overall goals of SENTAC are largely being met. Superior Court sentenc-ing patterns indicate that offenders with serious and violent lead chargesreceive sentences to Level V incarceration while less serious offenders arearrayed among the less restrictive—and less expensive—Levels I through IV.
❒❒❒❒❒ SENTAC is holding offenders accountable. In 1999, the Superior Courthandled almost 70 percent more violations of probation (VOPs) than it didnew charges. Growth in the VOP population has been significant, andVOPs account for the single largest source of admissions (approximately40%) to Level V. Most of these admissions are to jail (sentences of oneyear or less). SENTAC anticipated growth in this population based on itsfocus on accountability, and these findings indicate the system is workingas it was designed.

Sentencing Trends and Correctional Treatment in Delaware
viii
SENTAC
Executive Summary
1Because of the shorter length of stay, 400 Crest beds translates to approximately 800 “slots” of 6–9months duration.
❒❒❒❒❒ Treatment is interwoven into the structure of sanctions in all supervisionlevels. Judges are imposing “addiction” sentences whereby all or a portionof a Level V sentence can be suspended upon successful completion of acorrectional treatment program (Key, Greentree, or bootcamp). At the endof 1999, 28 percent of the prison population was serving suspendable“addiction” sentences in Key or Greentree programs.
❒❒❒❒❒ The change under SENTAC has been large and rapid. The movement ofoffenders that occurs underneath the platform of sentencing—the “flowdowns” and “flow ups” into sanctions and treatment—is a hallmark of thesystem. This movement among the levels is designed to gradually returnoffenders to productive and crime-free status in the com-munity while preventing new criminal activity and to intercede when of-fenders do not comply with the requirements of supervision and treatment.
❒❒❒❒❒ While the overall DOC “count” population has grown substantially overthe years, much of the growth has been related to increased admissions inthe “detained” population (although time held in pre-trial detention hasremained stable, between 25-31 days); in Level IV programs; in Level Vtreatment programs; and in Level V programs that are not part of the majorinstitutional structure (boot camp). Length of stay in jail and prison re-mained relatively constant between 1997 and 1999.
❒❒❒❒❒ Although treatment slots have increased in Level IV, overall expansion ofwork release and other Level IV options has not kept pace. In fact, regular“non-treatment” work release has diminished in capacity. All offendersneed transitional support when they are facing the critical time—the cri-sis—of reentering the community.
CORRECTIONAL TREATMENT
The accompanying document presents a snapshot view of comparative recidivismamong the Key, Crest and Greentree programs for offenders discharged during 1999.The findings herein that relate to correctional treatment in Delaware should be con-sidered preliminary for several reasons that are described more fully in the body ofthe report.
Correctional treatment in Delaware rapidly expanded throughout the 1990s. Today,the Key and Crest continuum of therapeutic community (TC) treatment includesapproximately 600 institutional beds, 400 work release/Crest beds1, and approxi-mately 400 aftercare slots. The Greentree program expanded from about 25 residentsin the late 1980s to its current capacity of approximately 175 inmates.

Sentencing Trends and Correctional Treatment in Delaware
ix
SENTAC
Executive Summary
Preliminary findings from this study include:
❒❒❒❒❒ Delaware has established a comprehensive system of therapeutic commu-nity (TC) services throughout the correctional system. Research supportsthis model of treatment for offenders with long histories of substanceabuse, criminality, and other associated disorders.
❒❒❒❒❒ A continuum of treatment that begins in the prisons and transitions of-fenders into the community reduces recidivism. Institutional treatmentalone reduces recidivism, but results erode over time without transitionalcare and aftercare. This finding is consistent with other research findingsthat support a full continuum of treatment following release from custodialprograms.
❒❒❒❒❒ Delaware has established a continuum of TC services to provide institu-tional treatment, transitional services and aftercare, a model that hasshown positive outcomes in other research studies. It appears from thisstudy that too few offenders are receiving the full benefit of this con-tinuum. Sentencing and classification practices do not always support theutilization of the treatment continuum, and program placement appears tobe driven primarily by length of time on sentences and slot availability.SENTAC will examine more closely how offenders move through the cor-rectional treatment continuum in a scheduled follow-up study, and willrecommend corrective action to support optimal use of these services.
❒❒❒❒❒ The programs in Delaware are treating offenders with very serious crimi-nal histories, and any reductions in recidivism are positive. Improvementsto institutional management provided by TCs may also provide collateralbenefits such as reductions in violence, reduced disciplinary incidents andimproved institutional control.
❒❒❒❒❒ Results indicate that Greentree graduates do about as well as Key graduateswho do not complete Crest, but the effects of institutional treatment areenhanced if followed by transitional care in the community. In terms ofarrests for violent felonies, Key/Crest graduates have the lowest recidivismrates compared to other populations. The Crest program is effective at fur-ther reducing recidivism generally for Key graduates, as well as for offend-ers who enter the program following incarceration or who enter as directLevel IV sentences.
❒❒❒❒❒ Surveillance and supervision of offenders in treatment programs, and fol-lowing treatment completion, is high. The system is intervening when sub-stance abuse or behavioral slips occur by violating probation and seekingcourt action. This activity promotes public safety to a much larger extentthan was occurring pre-SENTAC.

Sentencing Trends and Correctional Treatment in Delaware
x
SENTAC
Executive Summary
RECOMMENDATIONS
Several important activities would improve the overall management of the system. Afull set of recommendations is included in the attached report. Briefly, they include:
❒❒❒❒❒ Continued examination of the issues related to VOPs. A scheduled follow-up study by SENTAC will provide more information regarding the VOPpopulation.
❒❒❒❒❒ Support of more comprehensive examination of the Level IV and Level VDOC “count” populations.
❒❒❒❒❒ Expansion of work release capacity in Level IV. Non-treatment work re-lease has diminished in capacity, and all offenders need transitional sup-port when they are reentering the community.
❒❒❒❒❒ Ongoing improvements in the correctional treatment continuum, includingadoption of the American Correctional Association’s Standards for Thera-peutic Communities and providing transitional care and aftercare for allTC graduates.
❒❒❒❒❒ Support of a process to re-examine the ways that offenders are placed intreatment services to support better use of the treatment continuum.
❒❒❒❒❒ Removal of restrictions on placing Key graduates into Crest programs atthe end of their Level V sentences and other barriers that prevent full useof the treatment continuum.
❒❒❒❒❒ Provide SENTAC with the resources to monitor and examine the impact ofthese corrective actions, as well as its overall impact, on an ongoing basis.

Sentencing Trends and Correctional Treatment in Delaware
1
SENTAC
Introduction
INTRODUCTIONThis report was prepared at the request of the Delaware General Assembly, whichauthorized the Sentencing Accountability Commission (SENTAC) to conduct a numberof research studies related to correctional treatment, sentencing, and correctional trendsin Delaware. A research plan was submitted by SENTAC and approved by the Officeof the Controller General and the Office of the Budget, and is included as Appendix A.
Section A of the research plan called for a report comparing recidivism rates amongparticipants in Greentree, Key, and Crest programs. Specifically, the report was toanswer the question, “What are the comparative recidivism rates among Greentree,Crest and Key?”
Section D of the research plan called for a report on sentencing trends. Specific ques-tions to be answered under this section include: “For what offenses are the offendersin the prisons?” “How long are they in the prisons?” “Are we complying with theSENTAC guidelines?”
This analysis was conducted under the auspices of SENTAC and its Sentencing Re-search Committee2, and was carried out by the Delaware Statistical Analysis Center(SAC) in consultation with Elizabeth A. Peyton of Peyton Consulting Services,located in Newark, Delaware, and Peter B. Rockholz of Criminal Justice Solutions,located in Middletown, Connecticut.
Although these two reports have different due dates3, as work progressed it becameapparent to researchers and to SENTAC that many of the findings related to sentenc-ing trends have direct bearing on the operations and results of the correctional treat-ment programs. In the interest of presenting a more complete picture, this documentpresents findings related to both sentencing trends and correctional treatment inDelaware.
Additional work, some of which may have bearing on the findings and conclusions ofthis report, will be conducted at a later date, with reports due to the General Assem-bly during 2002. Significantly, research related to the flow of offenders through cor-rectional treatment programs is due in October, 2002, and many of the findings re-lated to recidivism in correctional treatment programs are correlated with offendermovement. As such, the findings presented in the correctional treatment section ofthis report should be considered very preliminary.
This report is reflective of trends and patterns through calendar year 1999. As such,more current DOC population numbers should be factored into immediate policydecisionmaking.
2Members of the Sentencing Research Committee include Hon. Richard S. Gebelein, SENTAC Chair-man; Hon. Stanley W. Taylor, Commissioner of Correction; and David S. Swayze, Esq., who served asCommittee Chairman. Gail Riblett Rohm, Deputy Director, Criminal Justice Council, Bryan Sullivan,Budget Office, and Evelyn Nestlerode, Office of the Controller General, attended committee meetingsand contributed significantly to the work.3The report related to Section A is due on 3/31/02; the report related to Section D is due 10/31/02.

This page is intentionally left blank.

Sentencing Trends and Correctional Treatment in Delaware
3
SENTAC
Sentencing Trends in Delaware
SENTENCING TRENDSIN DELAWAREThis section of the report is intended tosatisfy the requirements set forth in theSENTAC Research Plan, Section D.

This page is intentionally left blank.

Sentencing Trends and Correctional Treatment in Delaware
5
SENTAC
Sentencing Trends in Delaware
SENTENCING TRENDS IN DELAWAREThis section of the report is intended to satisfy the requirements set forth in theSENTAC Research Plan, Section D.
SENTENCING REFORM IN DELAWARE
In 1986, the Sentencing Accountability Commission (SENTAC) adopted the MasterPlan for Sentencing Reform that was subsequently enacted by law and court rule inOctober 1987. This plan called for the establishment of a five-level system of gradu-ated sanctions ranging from the most secure—Level V incarceration, to the leastsecure—Level I administrative probation. Associated sentencing standards and prin-ciples were developed to place offenders along the supervision continuum basedupon their crimes and criminal histories. This system was designed to replace thetraditional “in-out” decision by judges whereby offenders were sentenced to eitherincarceration or probation. The overall goals of SENTAC, as established by theGeneral Assembly and listed in priority order, were to:
❒❒❒❒❒ Incapacitate the violence-prone offender;❒❒❒❒❒ Restore the victim, and;❒❒❒❒❒ Rehabilitate offenders.
These different levels of punishment and surveillance, referred to as “accountabilitylevels,” were intended to allow the judiciary to reserve incarceration for the mostserious and/or repetitive offenders, thereby minimizing prison costs while maximiz-ing opportunities for rehabilitation at the intermediate levels of sanctioning.
These accountability levels are:
❒❒❒❒❒ Level V—Incarceration. 24-hours a day in a secure correctional facility.Incarceration in Delaware includes jail (sentences to 12 months or less),prison (sentences to longer than 12 months), and sentences to life or death.In 1999, boot camp was added as another Level V sentencing option4.
❒❒❒❒❒ Level IV—Quasi-incarceration. Sentences to Level IV are designed toprovide a high level of surveillance (nine or more hours per day) in a com-munity setting. Currently, Level IV includes halfway-house supervision,home confinement with electronic monitoring, placement in a residentialtreatment facility, placement in a Violation of Probation (VOP) Center, orRe-Entry court supervision.
❒❒❒❒❒ Level III—Intensive Supervision. Level III includes multiple weeklydirect and collateral contacts (eight or more hours per week) between theintensive probation officer and the offender while the offender is still free
4Delaware has a unified Department of Correction, wherein jail, detention, prison and all communitycorrections programs are placed within that state agency.

Sentencing Trends and Correctional Treatment in Delaware
6
SENTAC
Sentencing Trends in Delaware
to live in the community. Level III can include requirements for day report-ing, as well as intensive supervision following completion of Boot Camp.This level is supervised by probation officers who should be carrying lim-ited caseloads of approximately one officer to 25 offenders.
❒❒❒❒❒ Level II—Field Supervision. Level II is best equated to the pre-SENTACsanction of probation. Offenders receive one to five hours of supervisionper month.
❒❒❒❒❒ Level I—Administration Supervision. Level I consists of initial report-ing and a monthly review of computerized arrest records, program partici-pation verification, and verification of payments of fines and restitution.
Figure 1, entitled Pre- and Post-SENTAC Sentencing Alternatives, compares sentencingoptions pre- and post-SENTAC.
Sentences at all levels are also designed to include conditions for victim reparation(restitution and/or community service), participation in appropriate treatment (sub-stance abuse, mental health, domestic violence, anger control, etc.) and other reha-bilitative activities such as job training, education, including obtaining a GeneralEquivalency Diploma (GED), and requirements to obtain and maintain employment.In particular, the intermediate sanctions are intended to provide sufficient publicsafety and punishment through the graduated loss of freedom and strict accounta-bility while maximizing the chance for rehabilitation.
Figure 1.
������������������������������������������������������������������������������������������������������������������������������������
������������������������������������������������������������������
����������������������������������������������������������������������������������������
������������������������������������������������������������������
Prison
Jail <=1 Yr.
Probation
Prison
Jail <=1 Yr.
Level I Probation
Level IV Probation
Level III Probation
Level II Probation
SENTAC October 1987
Pre SENTAC
Pre- and Post-SENTAC Sentencing Alternatives

Sentencing Trends and Correctional Treatment in Delaware
7
SENTAC
Sentencing Trends in Delaware
Sentencing Guidelines
SENTAC established sentencing guidelines to provide a rational and equitable systemfor the use of the graduated sanction system. (See Table 1, entitled Presumptive Sen-tencing Guidelines.) The guidelines serve as a tool to allocate resources to incapacitateviolent and recalcitrant offenders in expensive correctional facilities, and to providestrict, meaningful, and less expensive community-based options for non-violentoffenders. While the guidelines are voluntary and not prescriptive, the sentencingjudge is required by court rule to take them into account at the time of sentencing,and required by statute5to justify departure from the guidelines by articulating aggra-vating or mitigating circumstances that led to the departure.
The SENTAC sentencing guidelines, which are outlined in the SENTAC sentencingbenchbook, incorporate the statutory sentencing requirements regarding minimumand maximum sentences as well as the SENTAC intentions regarding graduatedsanctions. Crime severity at the time of conviction establishes the ranking for theseverity of punishment. Class A Felony crimes (statutes related to homicide and themost serious levels of rape) require a minimum sentence of 15 years at Level V and amaximum of life or death. Class B Felony crimes (less serious crimes involving deathand rape as well as robbery, kidnapping, and selling drugs) require a minimum sen-tence of two years at Level V and a maximum of 20 years at Level V6.
Class C Felony convictions have a sentencing range of “0 to 10 years” which meansone of the community graduated sanctions can be given as the sentence. However,the presumptive sentence for a Class C Felony crime is a Level V sentence of up to 30months. Class D Felony and Felony E violent crimes also have a presumptive Level Vsentence, but non-violent and less serious felony crimes and misdemeanors have apresumptive sentence for one of the graduated community sanctions. Presumptivesentences are also guided by the criminal history of the defendant.
Within these sentencing guidelines, aggravating and mitigating circumstances canplay a significant role. A mitigating circumstance, mentioned on the record, may al-low a Class C Felony offender to be placed in a midlevel sanction, and an aggravatingcircumstance can allow a misdemeanor conviction to result in a Level V sentence.When an offender is sentenced to Level V, the presumptive sentencing length isbased on up to 25 percent of the maximum term, and standards for violent offensesare structured at a higher percentage of the statutory maximum.
5Del. Code Ann. tit. 11, § 4204(m)(2001).
6Under Delaware’s Truth in Sentencing statute, any Level V sentence that must be imposed as a statu-tory minimum cannot be suspended and must be served in a Level V institution. The maximum goodtime that can be used to reduce any Level V sentence is 25 percent, although few offenders can earnthat amount.

Sentencing Trends and Correctional Treatment in Delaware
8
SENTAC
Sentencing Trends in Delaware
Presumptive Sentencing Guidelines
Felony A Level V: 15 Yr. Min. Prison
Felony B Level V: 2 Yr. Min. Prison
Felony C Violent Level V up to 2.5 Yrs. Prison Felony C Non Violent Level V up to 1 Year
Felony D Violent Level V up to 2 Yrs. Prison Felony D Non Violent Level III up to 2 Years
Felony E Violent Level V up to 15 Mos. Prison Felony E Non Violent Level II up to 2 Years
Felony F Violent Level V up to 9 Mos. Jail Felony F Non Violent Level II up to 21 Months
Felony G Violent Level V up to 6 Mos. Jail Felony G Non Violent Level II up to 12 Months
Misdemeanor A Violent Level II up to 12 Mos. Misdemeanor A Non Viol Level I up to 12 Months
Misdemeanor A Escape Level IV up to 3 Mos. Misd. A Order & Decency Level I up to 12 Months
Misdemeanor B Violent Level V up to 2 Mos. Jail Misdemeanor B Non Viol. Fines & Restitution
Unclassified Misdemeanor Fines & Restitution
Source: Delaware SENTAC Truth in Sentencing Benchbook 2001
Table 1.
Truth in Sentencing
In 1990, the Truth in Sentencing Act was implemented. The original sentencingguidelines were constructed so that the severity of punishment and supervisionwould coincide with the severity of the offense and prior criminal history. However,during the early years of SENTAC, the laws allowing for use of good time credits anda parole system that could release inmates after they served as little as 30 percent oftheir incarceration sentence undermined the SENTAC structure and eroded fairness.For example, in 1988 serious offenders such as homicide and sex offenders servedabout 30 to 33 percent of their sentence while theft offenders serving shorter sen-tences served about 73 to 78 percent of their sentence. These variances in percentageof time served resulted in little difference in actual incarceration time despite differ-ences in severity of crime and/or criminal history. In the early days of SENTAC aperson convicted of burglary—a violent crime—served on average 1.1 years and aperson convicted of theft—a non-violent crime—served on average 0.9 years7.
The Truth in Sentencing Act standardized the percentage of time served in a correc-tional facility at 75 percent of the original sentence. It also redefined and regulatedgood time credits and abolished parole eligibilty. The result has been that the actualpercentage of time served in a Level V facility ranges between 85 and 87 percent.
Although the Truth in Sentencing Act resulted in dramatic changes for bringing equityto time served, it was designed to have minimal impact on the overall incarceratedpopulation. The Act adjusted sentence lengths for various offenses to ensure that
SENTACSentencingGuidelines
serve as a toolto allocateresources
7DelSAC 1989. Impact of Truth in Sentencing on Prison and Jail Populations.
Under Truth inSentencing,
offendersincreased
time served toapproximately
85% of theirsentences.

Sentencing Trends and Correctional Treatment in Delaware
9
SENTAC
Sentencing Trends in Delaware
although the SENTAC principle of sentencing to 25 percent of the maximum termwas applied, actual time served was population neutral. Time served for some of theviolent crimes increased while actual time served for non-violent crimes decreased,and the population increases caused by sentencing patterns for the more serious of-fenders were offset by decreases in jail or prison time served by non-violent offenders.
Figure 2, entitled Percent Time Served: Pre-Post Truth in Sentencing, shows the averagetime served at Level V for pre-TIS and post-TIS populations. The top two bars indi-cate the average time served under TIS as well as the minimum time required to beserved under TIS. The bottom three bars show the average time served for pre-TISoffenders released under good time or meritorious time, as well as the average per-cent time served for offenders released via parole.
Figure 2.
SENTAC IS A PROCESS
The SENTAC system is designed to hold offenders at all levels accountable to thejustice system. As such, almost all sentences call for a graduated release from super-vision based on offender compliance and progress, and there is a statutory require-ment that all offenders who serve a Level V sentence of one year or more receivepost-release community supervision8. Typically, offenders sentenced to Level V (jailor prison) are required to spend time in Levels IV and III before being released toregular probation or being discharged from their obligation to the justice system.As a result of this shift, offenders in the community are under much closer scrutinythan they were pre-SENTAC. Likewise, failure to comply with conditions of lowersanction levels often results in movement up to higher levels and tighter surveillance.
Percent Time ServedPercent Time ServedPre-Post Truth in Sentencing
Truth in Sentencing Average
Truth in Sentencing Minimum
PreTruthSent Good Time
PreTruthSent Merit Time
PreTruthSent Parole
0% 10% 20% 30% 40% 50% 60% 70% 80% 90% 100%
DelSAC March 2002
8Del. Code Ann. tit. 11, § 4203(I)(2001).

Sentencing Trends and Correctional Treatment in Delaware
10
SENTAC
Sentencing Trends in Delaware
Flowing Down
Most offenders are sentenced to an initial level—Level V, IV, III, etc.—and then aftersuccessful completion of that level, they “flow down” to one or more lower levelsbefore their full sentence is completed. At each lower level the offender is expected tostay crime free, cooperate with court imposed restrictions, and follow instructionsregarding rehabilitation. This process of “flow down” sentencing is designed togradually return the offender to productive and crime-free status in the community.
Flowing Up
The system is also designed to increase supervision based on lack of progress or non-compliance. From the inception of SENTAC, Commissioners were aware that in-creased surveillance at the mid-level sanctions would likely result in an increase inviolations. This process of tightening supervision when offenders start to slip is re-ferred to as “flowing up,” and generally results from the recommendation of a proba-tion officer and a ruling from the sentencing court. For instance, a probation officerreporting that an offender on Level III in an outpatient treatment program has hadmultiple positive drug screens could result in the court violating the offender’s proba-tion (VOP) and issuing a new sentence to Level IV electronic home confinement,more intensive treatment, and closer monitoring to ensure that he attends his treat-ment program.
Guidelines for Violation of Probation
In 1991, SENTAC adopted violation of probation (VOP) standards as a means toorganize the wide-ranging responses associated with violations of probation. Prior tothe adoption of the violation of probation standards, some offenders who violatedtheir probation had the maximum Level V term imposed, while others may have hadtheir supervision increased by one level or had their conditions modified while re-maining at the same supervision level. Currently, the SENTAC policy is to move anoffender who violates his probation up one level of supervision, absent extenuatingcircumstances. Therefore, if an offender violates a Level IV electronic home confine-ment order, he can find himself serving a jail term of one year or less. To address theproblems of violence, use or possession of weapons, and willful noncompliance withtreatment conditions, an offender violating a Level III probation or even a Level IIprobation may, upon the violation, be sentenced to Level V.
Implementation of SENTAC Graduated Sanctions
Figure 3, entitled SENTAC Graduated Sanctions, shows that probation populationsgrew from 6,373 in 1984 to 15,545 in 1999. This represents about a five percentincrease per year.
In 1999, the Level I administrative supervision population had a count of 3,870.The Level II probation population was smaller in 1999 (6,085) than it was in 1987(8,200), reflecting in part the creation of Level I. The Level III intensive and dayreporting population had a count of 6,085. The Level IV population had a count of
Movementamong
accountabilitylevels is
designed togradually
returnoffenders toproductive
and crime-freestatus in thecommunity.

Sentencing Trends and Correctional Treatment in Delaware
11
SENTAC
Sentencing Trends in Delaware
1,539, and includes offenders sentenced to Level IV but held in a Level V major insti-tution (311), Level IV offenders at Work Release facilities (including those in Cresttreatment programs (675), and Level IV offenders on electronic home confinementor in the supervised custody program (553).
Figure 3.
Under SENTAC, the least serious offenders in the Level II population were transferredto Level I, administrative supervision. Populations in Levels III and IV have increasedas a result of direct sentencing from the courts, flow downs of successful offendersfrom Level V, or flow ups of violators from less restrictive levels of supervision.
A MAJOR SHIFT TO TREATMENT: THE BIGGEST CHANGE YET
During the late 1980s and throughout the 1990s, SENTAC initiated a number ofsignificant activities designed to meet its goal of rehabilitating offenders.
In 1988, the Department of Correction established the Key Therapeutic Community(TC) at Gander Hill. In 1991, the Crest Program, funded through a National Instituteon Drug Abuse (NIDA) research grant, was established by the University of Delawareas a work release TC located at the Plummer Work Release Center in Wilmington.These programs have rapidly expanded and currently consist of approximately 600institutional beds, 400 work release/Crest beds9, and approximately 400 aftercareslots. Key and Crest programs operate in all the major institutions and work releasecenters in the State, with the exception of the Delaware Correctional Center (DCC).In addition, the Greentree program, a self-help correctional treatment program that
SENTAC Graduated SanctionsSENTAC Starts October 1987
9Because of the shorter length of stay, 400 Crest beds translates to approximately 800 “slots” of 6–9months duration.

Sentencing Trends and Correctional Treatment in Delaware
12
SENTAC
Sentencing Trends in Delaware
operates at the Delaware Correctional Center, expanded from about 25 inmates inthe late 1980s to its current capacity of approximately 175 inmates.
In 1994, SENTAC’s Treatment Access Committee published a report, A CoordinatedApproach to Managing the Drug Involved Offender, that outlined the substance abuseand other treatment needs of Delaware’s offenders. This report led to the expansionof community-based substance abuse treatment for offenders, and supported thedevelopment of Delaware’s Drug Court Initiative. The Superior Court operates drugcourts in all three counties for sentenced and diverted offenders, as do both theCourt of Common Pleas and the Family Court. Drug court participants receive casemanagement support from the Treatment Access Center (TASC), which also beganin the early- to mid-1990s.
The development of these programs coincided with reported national research find-ings that showed reductions in criminal activity for substance involved offenderswho completed long-term treatment. In addition, the integration of treatment servicesinto Delaware’s sentencing scheme is associated with a shift in sentencing patterns,as judges and corrections professionals respond to relapse to drug use by increasingboth treatment and supervision intensity.
Today, Delaware has one of the most comprehensive treatment systems for offendersin the country, and it is viewed as a national (and international) model of excellence.
Addiction Sentencing
In the late 1990s, a new method of sentencing began to emerge from the courts. Priorto 1997, it was rare for a Level V sentence to include the possibility of suspension ofa portion of the sentence based upon successful completion of treatment programming.Starting in 1997, and increasing since, a number of Level V offenders have been re-ceiving “addiction sentences,” whereby judges state that all or a portion of a Level Vsentence can be suspended upon the successful completion of a correctional treatmentprogram (e.g., Key or Greentree). The logic underlying the shift to “suspendable”sentences is based on the fact that high percentages of our serious criminals areheavily involved in a drug addiction that perpetuates a criminal life style. If that dys-functional behavior can be addressed, it is believed that concomitant reductions incriminal activity will result. Structuring a suspendable sentence also provides consid-erable leverage to encourage treatment entry and successful treatment completion.
In addition to the DOC Key-Crest-Aftercare and Greentree programs, the statefurther invested in addiction treatment when the law was amended to provide forsuspended three year mandatory drug trafficking convictions with the condition thatoffenders successfully complete the six-month Delaware Adult Boot Camp and itsdrug treatment program10. A recent study of the Delaware Adult Boot Camp11 shows
10Del. Code Ann. tit. 11, § 6712(a)-(b)(2001).
11DelSAC 2001. Delaware’s Adult Boot Camp.
Thedevelopmentof Delaware’scorrectional
treatmentprogramscoincided
with reportednationalresearch
findings thatshowed
reductions incriminal
activity forsubstanceinvolved
offenders whocompletedlong-term
treatment...Today,
Delawarehas one ofthe most
comprehensivetreatment
systems foroffenders inthe country,
and it isviewed as a
national (andinternational)
model ofexcellence.

Sentencing Trends and Correctional Treatment in Delaware
13
SENTAC
Sentencing Trends in Delaware
that although a boot camp graduate may not be less likely to reappear in the criminaljustice system than other similar offenders, the amount of violent crime that theseoffenders are likely to be involved is significantly reduced.
SENTENCING PATTERNS ARE CONSISTENT WITHGOALS OF SENTAC
Delaware’s sentencing goals are being met in large measure. Table 2, entitled SuperiorCourt Sentencing Patterns by Crime Type, shows the highest sentencing level by levelof crime severity for Delaware Superior Court sentences in calendar year 1999. Thecrime categories are organized such that FA refers to felony A, FB refers to felony B,etc. Misdemeanors are categorized as MA, for misdemeanor A, etc., and V refers toviolations. Sentence severity ranges from the lowest level of punishment (“fine”)through the five SENTAC sentencing levels (I, administrative probation, through V,incarceration).
Within each of the sentencing levels, details are provided for specific sanctionswithin each level. For instance, Level IV is divided into general Level IV, Home Con-finement, and Treatment Level IV. Level V is divided into boot camp, jail (a sentenceof 12 months or less), prison (a sentence greater than 12 months), life sentences,death sentences, time served12, and Level V treatment.
The categories referred to as “Treatment Level V,” “Treatment Level IV,” etc. includethose sentences whereby the sentence may be suspended upon successful comple-tion. These “suspendable” sentences have been referred to as “addiction” sentences.The many other Superior Court sentences that direct or recommend substance abuseor other treatment for offenders (including drug court sentences, sentences to TASC,etc.) are not included in this table.
Table 2 shows that in 1999, a total of 5532 offenders were sentenced by SuperiorCourt for new crimes13. Overall, Superior Court sentencing patterns are consistentwith the goals of SENTAC, as offenders with serious and violent lead charges receivesentences to Level V incarceration, while less serious offenders are arrayed amongthe less restrictive Levels I through IV. For example, this chart shows that 100 per-cent of all Felony B offenders were sentenced to Level V, with 76.5 percent receivinga sentence to prison (greater than one year).
It is important to remember that those sentences denoted as treatment sentencesonly include those where the sentence is suspendable upon successful completion ofthe program—“addiction” sentences. Therefore, these figures do not reflect the sub-stantial numbers of offenders whose sentences contain conditions for treatment butare not subject to suspension upon successful completion.
12Time served is a sentence that stipulates the time served in detention prior to conviction as the fullLevel V sentence.
13Superior Court also disposed of 304 lead charges for felony DUI (246) and other crimes in Titles 21,4, 6 and 7 (58) during 1999.
SuperiorCourt
sentencingpatterns are
consistentwith the goals
of SENTAC.Offenders
with seriousand violent
lead chargesreceive
sentences toLevel V
incarceration;less serious
offenders arearrayed
among theless restrictive
Levels I–IV.

Sentencing Trends and Correctional Treatment in Delaware
14
SENTAC
Sentencing Trends in Delaware
Table 2.
F
A
FB
F
C
FD
F
E
FF
F
G
MA
M
B
M
V
To
tal
Tota
l C
onvic
tions
33
325
386
505
428
484
1043
2022
156
141
4
5527
% o
f T
ota
l 0.6
%
5.9
%
6.9
%
9.1
%
7.8
%
8.8
%
18.8
%
36.6
%
2.8
%
2.6
%
0.1
%
100.0
%
Fin
e
0.5
%
0.2
%
0.4
%
2.5
%
7.4
%
25.0
%
0.4
%
Level
I
0.2
%
0.5
%
0.8
%
0.3
%
6.0
%
15.2
%
9.5
%
75.0
%
3.1
%
Le
ve
l II
4.4
%
6.3
%
8.2
%
17.1
%
31.4
%
54.7
%
39.9
%
60.8
%
31.7
%
Le
ve
l II
I
18.9
%
19.6
%
28.3
%
36.0
%
30.4
%
26.9
%
27.8
%
16.2
%
25.3
%
Tre
atm
ent
Level III
0.3
%
0.2
%
0.2
%
0.5
%
0.2
%
To
tal
Le
ve
l II
I
19.2
%
19.6
%
28.5
%
36.0
%
30.5
%
27.4
%
27.8
%
16.2
%
25.5
%
L
eve
l IV
3.9
%
2.2
%
3.5
%
2.9
%
1.5
%
0.8
%
1.3
%
1.6
%
H
om
e C
onfinem
ent
7.5
%
10.1
%
10.0
%
12.6
%
5.6
%
0.8
%
4.4
%
4.8
%
T
reatm
ent
Level IV
2.6
%
3.0
%
4.7
%
3.3
%
2.7
%
1.4
%
1.9
%
2.1
%
To
tal
Le
vel
IV
14.0
%
15.3
%
18.2
%
18.8
%
9.8
%
3.0
%
7.6
%
8.6
%
Level
V
B
oo
t C
am
p
20.0
%
9.0
%
2.4
%
3.0
%
2.1
%
1.0
%
0.2
%
1.3
%
2.7
%
T
rea
tme
nt
Le
ve
l V
1.7
%
3.1
%
3.6
%
3.3
%
2.1
%
2.1
%
0.7
%
1.7
%
Ja
il (
<=
12
Mo
nth
s)
1.5
%
15.5
%
31.1
%
18.0
%
12.6
%
11.9
%
4.4
%
3.8
%
2.7
%
10.5
%
P
rison (
>1
2 M
on
ths)
63.7
%
76.5
%
28.8
%
14.6
%
12.4
%
5.2
%
5.8
%
0.2
%
10.9
%
L
ife
33.3
%
0.8
%
0.4
%
0.3
%
D
ea
th
3.0
%
0.0
%
Tim
e S
erv
ed
0.3
%
5.2
%
6.5
%
7.5
%
5.4
%
6.9
%
3.0
%
1.9
%
3.4
%
4.5
%
To
tal
Le
vel
V
100.0
%
100.0
%
62.5
%
58.6
%
44.2
%
27.3
%
27.8
%
8.5
%
7.0
%
6.1
%
30.7
%
To
tal
% b
y C
las
s
100%
100%
100%
100%
100%
100%
100%
100%
100%
100%
100%
100%
5 c
ases a
re n
ot
inclu
ded t
hat
are
bein
g r
evie
wed b
y S
EN
TA
C
Sup
erio
r C
ou
rt S
ente
nci
ng
Pat
tern
s b
y C
rim
e Ty
pe

Sentencing Trends and Correctional Treatment in Delaware
15
SENTAC
Sentencing Trends in Delaware
SENTAC FUNDAMENTALLY CHANGES THE CRIMINALJUSTICE SYSTEM
Focus on Offender Management
There is little question that the five-tier graduated sanction sentencing system,sentencing guidelines, and Truth in Sentencing, combined with the integration oftreatment and other programming into the sanction structure, have fundamentallychanged the criminal justice system. Both the courts and the DOC have becomemuch more active in their management of offenders. Offenders are continually moni-tored, through regular judicial oversight (most apparent in drug court), focused over-sight by probation and law enforcement officers (as in Operation Safe Streets), andthrough coordinated clinical oversight in correctional treatment programs (Key,Crest, Greentree and boot camp). Delaware has not only moved to a system that em-phasizes alternatives to incarceration, but has shifted to a system that expectsdemonstrable behavioral change in offenders or there will be consequences.
Perhaps the most profound impact of SENTAC has been the rapid and high volumemovement of offenders throughout the five-level system after initial sentencing (the“flow ups” and “flow downs”). Table 3, entitled Superior Court VOP Sentencing 1999,shows Superior Court sentencing patterns for violations of probation (VOPs) for 1999.
Superior Court VOP Sentencing 1999Final VOPs that Resulted in Level Movement
SANCTION LEVEL NUMBER OF VOPs PERCENTLEVEL I 34 0.9%LEVEL II 245 6.7%LEVEL III
Level III 842 22.9%Treatment Level III 14 0.4%
Total Level III 856 24.2%LEVEL IV
Level IV 352 9.6%Home Confinement 309 8.4%Treatment Level IV 463 12.6%
Total Level IV 1,124 30.6%LEVEL V
Boot Camp 68 1.8%Jail (12 mos. or less) 845 23.0%Prison (> 1 year) 98 2.7%Life 0 0.0%Death 0 0.0%Time Served 2 0.1%Treatment Level V 302 6.2%
Total Level V 1,315 36.8%
Total Superior Court 3,574 100.0%
Table 3.
Sentencing Trends and Correctional Treatment in Delaware
16
SENTAC
Sentencing Trends in Delaware
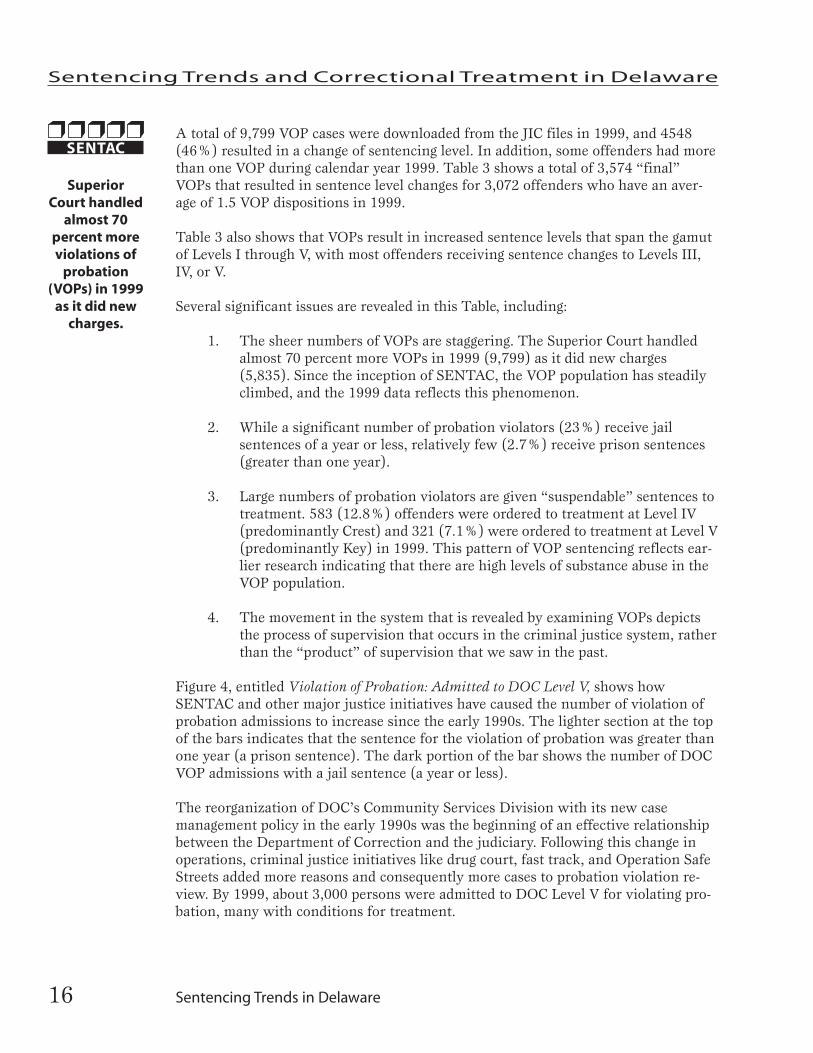
A total of 9,799 VOP cases were downloaded from the JIC files in 1999, and 4548(46%) resulted in a change of sentencing level. In addition, some offenders had morethan one VOP during calendar year 1999. Table 3 shows a total of 3,574 “final”VOPs that resulted in sentence level changes for 3,072 offenders who have an aver-age of 1.5 VOP dispositions in 1999.
Table 3 also shows that VOPs result in increased sentence levels that span the gamutof Levels I through V, with most offenders receiving sentence changes to Levels III,IV, or V.
Several significant issues are revealed in this Table, including:
1. The sheer numbers of VOPs are staggering. The Superior Court handledalmost 70 percent more VOPs in 1999 (9,799) as it did new charges(5,835). Since the inception of SENTAC, the VOP population has steadilyclimbed, and the 1999 data reflects this phenomenon.
2. While a significant number of probation violators (23%) receive jailsentences of a year or less, relatively few (2.7%) receive prison sentences(greater than one year).
3. Large numbers of probation violators are given “suspendable” sentences totreatment. 583 (12.8%) offenders were ordered to treatment at Level IV(predominantly Crest) and 321 (7.1%) were ordered to treatment at Level V(predominantly Key) in 1999. This pattern of VOP sentencing reflects ear-lier research indicating that there are high levels of substance abuse in theVOP population.
4. The movement in the system that is revealed by examining VOPs depictsthe process of supervision that occurs in the criminal justice system, ratherthan the “product” of supervision that we saw in the past.
Figure 4, entitled Violation of Probation: Admitted to DOC Level V, shows howSENTAC and other major justice initiatives have caused the number of violation ofprobation admissions to increase since the early 1990s. The lighter section at the topof the bars indicates that the sentence for the violation of probation was greater thanone year (a prison sentence). The dark portion of the bar shows the number of DOCVOP admissions with a jail sentence (a year or less).
The reorganization of DOC’s Community Services Division with its new casemanagement policy in the early 1990s was the beginning of an effective relationshipbetween the Department of Correction and the judiciary. Following this change inoperations, criminal justice initiatives like drug court, fast track, and Operation SafeStreets added more reasons and consequently more cases to probation violation re-view. By 1999, about 3,000 persons were admitted to DOC Level V for violating pro-bation, many with conditions for treatment.
SuperiorCourt handled
almost 70percent moreviolations of
probation(VOPs) in 1999
as it did newcharges.

Sentencing Trends and Correctional Treatment in Delaware
17
SENTAC
Sentencing Trends in Delaware
Figure 4.
Treatment is Woven into the Fabric of Justice
Only a few years ago, mandatory sentences, particularly those for drug crimes, wereviewed by SENTAC and others as working at cross purposes with sentencing guide-lines and judicial discretion. In a recent analysis of mandatory drug sentences, it wasdiscovered that currently at least half of the mandatory drug sentences include thesuspension of some Level V time for successfully completing either the DOC bootcamp or a DOC Level V drug treatment program14. Incarceration is still available forthe non-addicted or violent drug dealer, or to those who fail to respond to treatment,but drug offenders with serious addiction problems are being provided realistic moti-vation to begin to deal with their addictive behavior. Part of the rationale behind thisshift in the use and meaning of mandatory sentencing is based on the understandingof justice leaders that intervening in substance abuse can lead to significant reduc-tions in criminal activity—reductions that are not likely to occur if the substanceabuse remains unchecked.
Table 4, entitled Summary of 1999 Superior Court Sentencing Patterns: New Crimesand Violations of Probation, combines information about new sentences and VOPs,and shows changes in sentencing practices that are measurable and significant. Onlya few years ago, Superior Court sentencing to boot camp and treatment Level V, IV,or III did not exist.
Both thecourts and the
DOC havebecome much
more activein their
managementof offenders.
0
250
500
750
1000
1250
1500
1750
2000
2250
2500
2750
3000
3250
3500
1987 1988 1989 1990 1991 1992 1993 1994 1995 1996 1997 1998 1999DelS
AC M
arch
200
2
SENTACStarts
Truth inSentencing
Starts
DOC CaseManagement
Starts
SENTAC VOPGuidelines
Starts
Drug Court andFast Track
Start
OperationSafe Street
Starts
Violation of ProbationAdmitted to DOC Level V
14DelSAC March 28, 2001. Letter to Representative John Van Sant.

Sentencing Trends and Correctional Treatment in Delaware
18
SENTAC
Sentencing Trends in Delaware
Summary of 1999 Superior Court Sentencing PatternsNew Crimes and Violations of Probation
ViolationLevel of Sanction New Crime* of Probation** Total
Fine 46 0.8% 0 0.0% 46 0.5%Level I 183 3.1% 34 0.9% 217 2.3%Level II 1,777 30.4% 245 6.7% 2,022 21.5%Total Level III 1,420 24.3% 856 23.3% 2,276 24.2%
Level III 1,409 24.1% 842 22.9% 2,251 23.9%Treatment Level III 11 0.2% 14 0.4% 25 0.3%
Total Level IV 475 8.1% 1,124 30.6% 1,599 17.0%Level IV 91 1.6% 352 9.6% 443 4.7%Home Confinement 256 4.5% 309 8.4% 575 6.1%Treatment Level IV 119 2.0% 463 12.6% 582 6.2%
Total Level V 1,935 33.2% 1,315 36.8% 3,250 34.5%Boot Camp 152 2.6% 68 1.8% 220 2.3%Treatment Level V 97 1.7% 302 6.2% 399 4.2%Jail (12 mos. or less) 811 13.9% 845 23.0% 1,656 17.6%Prison (> than 12 months) 605 10.4% 98 2.7% 703 7.5%Life 16 0.3% 0 0.0% 16 0.2%Death 1 0.0% 0 0.0% 1 0.0%
Time served 253 4.2% 2 0.1% 255 2.7%
Total Superior Court 5,835 3,574 9,409
* The New Crime total of 5,835 is the lead charge for each conviction in calendar year 1999.This represents a total of 8,730 charges for 4,804 individuals.
** This number references the last active VOP sentence in 1999.
Table 4.
Table 4 shows that in 1999, a total of 220 persons were sentenced by Superior Courtto adult boot camp. 152 of these were sentenced for new criminal charges and 68were sentenced as violation of probation offenders. Many offenders who are offeredboot camp can avoid a lengthy or mandatory prison term.
An additional 399 offenders were sentenced to Level V treatment as a result of newcrimes (97) or VOPs (302). These offenders also have the opportunity to avoid alengthy prison term, since their sentences allow for a suspension of the prison sen-tence upon successful completion of the Level V correctional treatment program.
Because options have expanded, the judicial decision to incarcerate in prison is lowerthan in the past. A total of 703 offenders were sentenced to “regular” prison for newcrimes or VOPs, compared with 619 offenders who received suspendable or addictionsentences to Level V treatment or boot camp. Without the availability of treatmentsentences or boot camp, a large proportion of offenders sentenced to prison wouldlikely be serving lengthier non-suspendable prison sentences.
Jail sentences of terms less or equal to one year are the most frequent Level V sen-tence, accounting for about one-half of the Level V sentences (1,656 out of 3,250).Offenders who violate an existing probation account for about half of the offenders
The numbersof VOPs reflectSENTAC’s goal
of holdingoffenders
accountable,and reflectSENTAC’s
philosophyof offender
management.

Sentencing Trends and Correctional Treatment in Delaware
19
SENTAC
Sentencing Trends in Delaware
sentenced to jail terms (845 out of 1,656). This pattern reflects the seriousness thatthe system attaches to violations of sentence conditions or failure to change criminalbehavior.
A significant number of offenders were also sentenced to treatment at Level IV. Mostof these sentences are to Crest, with 119 offenders sentenced as the result of a newoffense and 582 ordered to Crest as the result of a probation violation. Many of thesesentences would likely have been to Level V if this option were not available.
Population Trends
In the previous section, we examined sentencing patterns from the Superior Court.To gain a better understanding of the impact of SENTAC, it is also important to ex-amine trends and changes in the overall incarcerated population. Information fromthe recently released 1997–1999 Delaware Department of Correction Incarceration FactBook 15 provides another view of correctional trends in Delaware.
The overall DOC “count” population has grown, but a lot of the growth has occurredin Level IV, and in expanded Level V settings such as boot camp and institutionaltreatment.
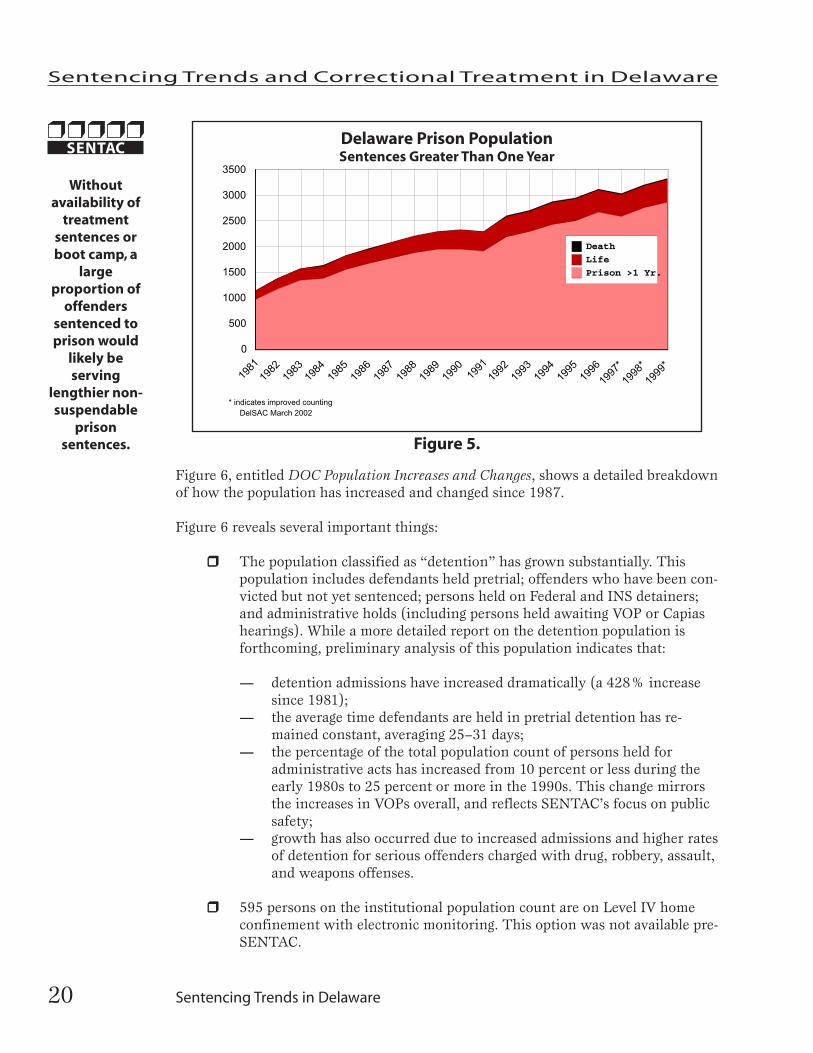
Figure 5, entitled Delaware Prison Population: Sentences Greater Than One Year, showsthe growth in the Level V prison population from 1981 through 199916.
Since 1981, the prison population has grown from 1,148 to 3,333. The most stableperiod in the growth of the prison population (sentences greater than one year) wasduring 1989 through 1991, when it was virtually stable. This was during the fullimplementation of SENTAC and Truth in Sentencing, and occurred before arrestsfor drug crimes began to spike. Much of the growth in the mid-1990s was largely dueto double digit increases in violent and drug crimes. It is important to note thatduring 1999, the prison population included a substantial number of inmates(28%) who were in Key or Greentree serving an addiction sentence that can besuspended upon successful program completion.
Since 1987 (pre-SENTAC) through 1999, the overall incarcerated population hasincreased from 2,979 to 6,750. However, many different populations are included inthis overall count. Although the Department of Correction furnishes beds and pillowsfor most of this population17, a substantial number (2,356) are in Level IV status, arein boot camp, or are serving “addiction” sentences which may be suspended uponprogram completion.
15DelSAC 2002. 1997–1999 Delaware Department of Correction Incarceration Fact Book.
16The population dip in 1997 reflects DelSAC’s improved method of accounting for DOC populations.This population count does not include those offenders sentenced to Level IV but held at Level V.
17644 of the total count are on electronic monitoring or supervised custody, and do not take up beds.
...drugoffenders with
seriousaddiction
problems arebeing
providedrealistic
motivation tobegin to deal
with theiraddictivebehavior.
...interveningin substance
abuse canlead to
significantreductions in
criminalactivity—
reductionsthat are not
likely to occurif the
substanceabuse remains
unchecked.
Sentencing Trends and Correctional Treatment in Delaware
20
SENTAC
Sentencing Trends in Delaware
Figure 5.
Figure 6, entitled DOC Population Increases and Changes, shows a detailed breakdownof how the population has increased and changed since 1987.
Figure 6 reveals several important things:
❒❒❒❒❒ The population classified as “detention” has grown substantially. Thispopulation includes defendants held pretrial; offenders who have been con-victed but not yet sentenced; persons held on Federal and INS detainers;and administrative holds (including persons held awaiting VOP or Capiashearings). While a more detailed report on the detention population isforthcoming, preliminary analysis of this population indicates that:
— detention admissions have increased dramatically (a 428% increasesince 1981);
— the average time defendants are held in pretrial detention has re-mained constant, averaging 25–31 days;
— the percentage of the total population count of persons held foradministrative acts has increased from 10 percent or less during theearly 1980s to 25 percent or more in the 1990s. This change mirrorsthe increases in VOPs overall, and reflects SENTAC’s focus on publicsafety;
— growth has also occurred due to increased admissions and higher ratesof detention for serious offenders charged with drug, robbery, assault,and weapons offenses.
❒❒❒❒❒ 595 persons on the institutional population count are on Level IV homeconfinement with electronic monitoring. This option was not available pre-SENTAC.
1981
1982
1983
1984
1985
1986
1987
1988
1989
1990
1991
1992
1993
1994
1995
1996
1997
*
1998
*
1999
*
0
500
1000
1500
2000
2500
3000
3500
Death
Life
Prison >1 Yr.
* indicates improved counting
DelSAC March 2002
Delaware Prison PopulationSentences Greater Than One Year
Withoutavailability of
treatmentsentences orboot camp, a
largeproportion of
offenderssentenced toprison would
likely beserving
lengthier non-suspendable
prisonsentences.

Sentencing Trends and Correctional Treatment in Delaware
21
SENTAC
Sentencing Trends in Delaware
Figure 6.
❒❒❒❒❒ The work release population now consists of mainly Level IV offenders(78%), and of those, 69 percent are in treatment programming servingsuspendable addiction sentences.
❒❒❒❒❒ In this snapshot of the 1999 population, 371 Level IV offenders were incar-cerated at Level V waiting movement to Level IV. Today, there are approxi-mately 95 people in this status.
❒❒❒❒❒ 604 offenders were serving jail sentences of one year or less.
❒❒❒❒❒ 28 percent of the 2,864 offenders sentenced to prison (sentences greater thanone year) are serving addiction sentences in Key or Greentree programs.
❒❒❒❒❒ The numbers of people sentenced to life (451) and death (18) have slowlyclimbed over the years. These people are permanent consumers of prisonbeds.
Length of Stay
According to the Fact Book18, time served patterns remained relatively stable between1997 and 1999. Released offenders sentenced to prison (sentences greater than 12months) served an average of 850 days, or 2.3 years. Released offenders sentenced tojail (sentences less than or equal to one year) serve 96 days on average.
...detentionadmissions
haveincreased
dramaticallysince 1981;
but theaverage timedefendantsare held in
pretrialdetention has
remainedconstant...
������������������������
������������������������������������������������
������������������������������������������������
������������������������������������������������
������������������������
������������������������������������������������
������������������������
������������������������������������������������������������������������
1987 19990
1,000
2,000
3,000
4,000
5,000
6,000
7,000
18 Death Sentence
451 Life Sentence
2,864 Prison >1Year 28% treatment���������� 604 Jail 1 Year < including Bootcamp���������� 371 Level IV Held at Level V: waiting for space/treatment
131 Work Release Level V����� 463 Work Release Level IV 69% treatment
49 Level V Supervised Custody����� 595 Level IV SupCust. Electronic Monitor
1,204 Detention
DelSAC March 2002
DOC Population Increases and Changes (Counts Shown June 1999)
DOC Population Increases and Changes(Counts Shown June 1999)
18DelSAC 2002. Supra.

Sentencing Trends and Correctional Treatment in Delaware
22
SENTAC
Sentencing Trends in Delaware
DISCUSSION
The sentencing reform efforts led by the Sentencing Accountability Commissionhave caused sweeping changes in the administration of justice in the State of Dela-ware. What began as a five-step hierarchical framework for punishing offenders hasevolved into a multi-layered system designed to hold them accountable as well as tofoster rehabilitation.
Delaware’s system reflects a comprehensive focus on offender management, and in-cludes a number of structural and programmatic options designed to punish offend-ers while addressing the underlying behavioral problems associated with their crimi-nal activity. By forging this system, Delaware has recognized that punishment alonemay be easy, but is also expensive in the short term (building expansion) and in thelong term (public safety). Rehabilitation, on the other hand, may sound easy, but it ismore difficult than simple punishment. And while it is not free, it is less expensivethan punishment alone. Despite the complexities that result from integrating reha-bilitative services into Delaware’s punishment structure, SENTAC believes it is theright thing to do to promote individual change and thus truly enhance public safety.
Many other states and jurisdictions are experimenting with sentencing alternatives,such as intensive probation, drug courts, and correctional treatment. However, un-like these other places, Delaware has incorporated these programs into a comprehen-sive framework for offender management. In Delaware, these programs do not sitoutside the mainstream justice system, but rather are part of the mainstream correc-tional system. They are an integral part of the justice landscape. While Delaware’ssystem is flexible enough to accommodate changes in the nature of crime and offend-ers, more discipline is needed to guide and manage the offender population.
The magnitude of change has been large and rapid. The movement of offenders thatoccurs underneath the platform of sentencing—the “flow downs” and “flow ups”into sanctions and treatment—is perhaps the most stunning finding from this re-search. Clearly, Delaware is as much or more involved with adjusting sanctions andtreatment as it is with making initial sentencing decisions. And it has so far managedthis change without significant infrastructure support.
The growth of the violation of probation population has been extremely significant,though predictable. SENTAC anticipated growth in this population based on its focuson accountability. This growth has so far been managed without the addition of newresources. However, a crisis has been avoided only because of the diligent work ofjustice professionals overall, the development of creative management strategies, andthe extraordinary efforts of a handful of individuals. Continuing to manage thispopulation under existing circumstances is risky.
While the overall DOC “count” population has grown substantially over the years,much of the growth has been in the population considered “detained,” in Level IVprograms, in Level V treatment programs, and in Level V programs that are not partof the major institutional structure (boot camp).
What beganas a five-stephierarchical
framework forpunishing
offenders hasevolved into amulti-layered
systemdesigned tohold them
accountableand foster
rehabilitation.

Sentencing Trends and Correctional Treatment in Delaware
23
SENTAC
Sentencing Trends in Delaware
The movement of Level IV offenders into and out of institutional settings is also verychallenging. Since 1999, the number of people waiting in Level V for Level IV place-ment has decreased from 371 to 95, in part because Morris Correctional Facility waschanged to a Level IV work release (and Crest) facility. Although treatment slotshave increased in Level IV, overall expansion of work release and other Level IVoptions has not kept pace. In fact, regular “non-treatment” work release has dimin-ished in capacity. All offenders need transitional support when they are facing thecritical time—the crisis—of reentering the community.
The challenge for the immediate future is to develop mechanisms to nurture theforward thinking and effective system that has been developed in Delaware.
Despite thecomplexities
that resultfrom
integratingrehabilitativeservices intoDelaware’s
punishmentstructure,
SENTACbelieves it is
the right thingto do to
promoteindividual
change andthus trulyenhance
public safety.
Delaware hasincorporatedcorrectional
treatmentprograms
into acomprehensiveframework for
offendermanagement.

This page is intentionally left blank.
Sentencing Trends and Correctional Treatment in Delaware
25
SENTAC
Correctional Treatment in Delaware
CORRECTIONALTREATMENT INDELAWAREThe following section of this report isintended to satisfy the requirements setforth in the SENTAC Research Plan,Section A.

This page is intentionally left blank.

Sentencing Trends and Correctional Treatment in Delaware
27
SENTAC
Correctional Treatment in Delaware
CORRECTIONAL TREATMENT IN DELAWAREThe following section of this report is intended to satisfy the requirements set forthin the SENTAC Research Plan, Section A.
BACKGROUND AND OVERVIEW
During the late 1980’s, Delaware, like the rest of the country, experienced tremen-dous increases in the numbers of drug offenders coming through the criminal justicesystem. In response, government leaders and policymakers conducted a number ofactivities to analyze this phenomenon and develop methods to address it.
In 1994, SENTAC published a report entitled “A Coordinated Approach to Managingthe Drug Involved Offender.” This report described the national research on substanceabuse in the offender population, and documented the level of substance abuse inDelaware’s correctional population. Major findings from the report include:
❒❒❒❒❒ There is a high need for substance abuse treatment among the incarceratedand non-incarcerated offender population in Delaware, and there is a highlevel of drug use in all five sanction levels;
❒❒❒❒❒ Large numbers of drug-involved offenders who could not function in strictcommunity sanction settings and who did not receive or complete drugtreatment remain in the system as probation violators in Level V. The mostheavily drug-involved population identified in the incarcerated populationis probation violators—with a 70 percent need for residential treatment;
❒❒❒❒❒ Despite the high level of illicit drug abuse in the offender population, thereis a large gap between services needed and services available19.
The findings in this 1994 report are still current when compared to more recent na-tional data. According to the Bureau of Justice Statistics, in 1997, 75 percent of Stateand 80 percent of Federal prisoners could be characterized as drug involved, and 21percent of State and more than 60 percent of Federal inmates were convicted on drugcharges20. Nearly 3.2 million adults are on probation in the United States, and about65 percent are drug involved, with almost 70 percent reporting past drug use21.Women in state prisons were more likely than men to have used drugs in the monthbefore their offense, and they were more likely to have committed their offenseswhile under the influence of drugs22.
19SENTAC Treatment Access Committee (March, 1994). A Coordinated Approach to Managing the DrugInvolved Offender.20Bureau of Justice Statistics (1999). Special Report: Substance Abuse and Treatment, State and FederalPrisoners, 1997. Washington, DC: U.S. Department of Justice.21Bureau of Justice Statistics (1998). Special Report: Substance Abuse and Treatment of Adults on Proba-tion, 1995. Washington, DC: U.S. Department of Justice.22Bureau of Justice Statistics (1999). Supra.

Sentencing Trends and Correctional Treatment in Delaware
28
SENTAC
Correctional Treatment in Delaware
The number of arrestees who test positive for illicit drugs is also high. According tothe National Institute of Justice (NIJ) 1998 Arrestee Drug Abuse Monitoring(ADAM) program, the percentage of adult male arrestees testing positive for anyillicit drug (excluding alcohol) ranged from 51.4 percent to 80.3 percent, and femalearrestees testing positive ranged from 37.6 percent to 80.5 percent, at 35 testing sitesin 199723 . In addition, significant numbers of both women and men tested positivefor more than one drug.
Almost all those incarcerated are released back into the community. Nationally, in1999 about half a million individuals were released from State prisons alone, andnearly a quarter were released with no continued supervision24. In Delaware, 88 per-cent (3,586 of 4,051) sentenced offenders in jail and prison will eventually return tothe community; 475 will remain locked up as lifers or on death row.
Figure 7, entitled Drug Complaints, shows the increase in drug complaints in all threeDelaware counties. There is no question that the use of illicit drugs and alcohol is acentral factor driving correctional policy in Delaware, and nationwide.
Figure 7.
23National Institute of Justice (1999). 1998 Annual Report on Drug Use Among Adult and Juvenile Arrestees.Washington, DC: U.S. Department of Justice.
24Travis, J. (1999). Remarks to the National Assembly on Drugs, Alcohol Abuse and the Criminal Of-fender. Washington, DC. December 7.
1991 1992 1993 1994 1995 1996 1997 1998 1999 2000
0
1,000
2,000
3,000
4,000
5,000
6,000
7,000
8,000
9,000
10,000
11,000
12,000
New Castle County
Kent Co.
Sussex Co.
Drug Complaints
DelSAC March 2002
Drug Complaints

Sentencing Trends and Correctional Treatment in Delaware
29
SENTAC
Correctional Treatment in Delaware
In response to both growth in correctional populations and awareness of the relation-ship between illicit drug use and criminal activity, the State, led by SENTAC and theDepartment of Correction, expanded substance abuse treatment for offenders signifi-cantly. Correctional therapeutic community (TC) treatment services are now inter-woven with sanctions as a major component of justice in Delaware.
What is a Therapeutic Community?
Modern therapeutic communities for addictions derive from Synanon, founded in1958 by Charles Dederich with other recovering alcoholics and drug addicts25. Basi-cally a self-help approach, TCs represent a social learning model whereby recoveryand prosocial behaviors are encouraged via the creation of a milieu or communitythat serves as the primary therapeutic method.
The TC perspective consists of four broad views which guide its approach to thetreatment of substance abuse and related problems26:
❒ the view that substance abuse and criminality are symptoms of a disorderof the whole person;
❒❒❒❒❒ the view of the person which consists of the social and psychologicalcharacteristics which must be changed;
❒❒❒❒❒ the view of “right living”—the morals and values requirements whichsustain recovery; and,
❒❒❒❒❒ the view of recovery from addiction as a developmental learningprocess.
The TC approach to substance abuse treatment is a psychosocial, experiential learn-ing process that utilizes the influence of positive peer pressure within a highly struc-tured social environment. The primary therapeutic change agent is the communityitself, including staff and program participants together as members of a “family.”The culture is defined by a mutual self-help attitude where community membersconfront each other’s negative behavior and attitudes and establish an open, trustingand safe environment where personal disclosure is encouraged, and the prison cul-ture of the general population is rejected. TC residents view staff as role models andrational authorities rather than as custodians or treatment providers.
While there are many similarities between the TC methodology and traditional sub-stance abuse treatment (i.e., “medical model”), there are identifiable differences thatenable the TC to produce very positive results with chronic substance abusingoffenders. The “medical model” approach is applied in most community-based
25De Leon, George. Therapeutic communities for addictions: a theoretical framework. The InternationalJournal of the Addictions, 30(12), pp. 1603-1645, 1993.
26De Leon, G. 2000. The Therapeutic Community: Theory, Model and Method. Springer Publishing Co.

Sentencing Trends and Correctional Treatment in Delaware
30
SENTAC
Correctional Treatment in Delaware
residential and outpatient treatment and in many publicly-funded treatment systems.Some of the more significant differences are described in Table 5, entitled TC Modelvs. Medical Model.
TC Model vs. Medical Model
TC Model Medical Model
Views addiction as one of many secondary Views addiction as a primary disease, and asproblems, and views the whole person as the central problem to be addressed inthe problem treatment
Treatment utilizes a behavioral approach Treatment utilizes a disease managementapproach
Program participants are viewed as Program participants are viewed ascommunity or family “members” “clients” or “patients”
The community process is the primary Treatment is therapist-directed (i.e., doctor-therapeutic agent that occurs 24 hours patient) and often manual-driven, occurringa day, 7 days a week during sessions
Psychoeducational and didactic groups Psychoeducational and didactic group andare seen as tools to support the TC process individual methods make up the treatment
approach—the sessions are the treatment
Effective TCs utilize a mix of TC graduates, Programs are encouraged and/or requiredex-offenders, other recovering persons, to only utilize staff that are certified,and trained clinicians as staff degreed, or otherwise credentialed and
traditionally trained
Personal issues are public—confidentiality Personal issues are private—confidentialityis maintained within the TC community is maintained within the client-counselor
relationship
Staff role is defined as facilitating a mutual Staff role is defined as providing treatmentself-help positive peer process services
Greater emphasis on affective skills Greater emphasis on cognitive skillsdevelopment—feelings development—thinking
Group encounter is the primary clinical Individual counseling is the primary clinicalintervention intervention
Staff share personal information and are Staff maintain professional distance andengaged in the community process function outside the community process
Table 5.
Activities in TCs are designed to evoke feelings and identify behaviors that residentsneed to address and change, and to establish a structure whereby other residents ac-tively encourage the change process by providing honest feedback and confrontingthe individual’s self-deception. TCs are uniquely designed to treat character disor-ders. These disorders, including addiction, result from backgrounds that are oftenfilled with neglect, physical and emotional abuse, sexual abuse, exposure to criminal-ity and criminal role models, and an absence of socially acceptable morals and values.As a result, many TC residents are unable to identify, label, or express their feelings,

Sentencing Trends and Correctional Treatment in Delaware
31
SENTAC
Correctional Treatment in Delaware
and act out on those repressed and unexpressed feelings in negative ways. EffectiveTCs assist clients to access those feelings, process them in a healthy way, gain anunderstanding of how they affect current behavior, and move toward increased self-awareness, internalized locus of control, and prosocial behaviors. Through confron-tation, the program is uniquely able to help participants who are highly manipulativeand dishonest, have minimal impulse control, exhibit an inability to delay gratifica-tion and justify any actions to get what they want, when they want it.
Therapeutic Communities Have Emerged as thePreferred Treatment for Offenders
The therapeutic community (TC) has emerged as a preferred and effective methodol-ogy for treating and rehabilitating substance abusers in correctional settings (as wellas in the community). Forty-seven (47) States currently have, or are in the process ofimplementing, nearly 300 TCs in prisons and community correctional settings27.Concurrently, TCs are now operating in over 54 countries28. The State of Delawarehas one of the most comprehensive systems of TC services in the nation.
There is a growing body of research that supports the effectiveness of TCs. Majorevaluations of prison-based TCs in California, Delaware and Texas have been con-ducted over the past several years, making TCs a very well-studied model of treat-ment. Although these studies have included different measures of recidivism andused different research designs, they have all shown reductions in recidivism of vary-ing degrees for TC clients compared with similar offenders who did not receive treat-ment services. To summarize major findings:
❒❒❒❒❒ Research on the Amity prison TC in California found that only 27 percentof inmates who completed both the TC and aftercare returned to prisonwithin three years of release, compared to 75 percent of similar inmateswho had no such treatment29.
❒❒❒❒❒ A study of Delaware’s Key/Crest continuum found that offenders who com-pleted the Key TC only were marginally less likely to be arrested than thecontrol group. Offenders who completed Key and Crest work release hadrearrest rates of 57 percent compared to a 70 percent rearrest rate for thecomparison group. Those who completed Key, Crest and aftercare were sig-nificantly less likely to be rearrested (31%) compared to the comparison groupwho received no treatment services (70%)30. Although this study, con-
27Rockholz, P.B. 2000. Findings of a National Survey on Therapeutic Communities for SubstanceAbusing Offenders in State Prisons. Middletown, CT: Association of State Correctional AdministratorsNewsletter.28Source: Therapeutic Communities of America, Inc.29Wexler, Harry K.; Melnick, Gerald; Lowe, Louis and Peter, Jean. 1999. “Three year reincarcerationoutcomes for Amity in-prison therapeutic community and aftercare in California.” The Prison Journal,79(3) 32 1-336.30Martin, Steven S.; Butzin, Clifford A.; Saum, Christine A. and Inciardi, James A. 1999. “Three yearoutcomes of therapeutic community treatment for drug-involved offenders in Delaware: from prison towork release to aftercare.” The Prison Journal, 79(23), 294-320.

Sentencing Trends and Correctional Treatment in Delaware
32
SENTAC
Correctional Treatment in Delaware
ducted by the University of Delaware Center on Drug and Alcohol Studies,relied on self-reports of rearrest, the Delaware Statistical Analysis Center(SAC) verified overall research trends using criminal justice data bases.
❒❒❒❒❒ Studies of the Kyle New Vision TC in Texas found that the three-yearreincarceration rate for inmates who completed all phases of treatment was26 percent, compared with 52 percent of inmates who had no treatment.This study also found that the most significant impact of treatment was onthe most severely addicted inmates31.
❒❒❒❒❒ In addition to changes in criminal recidivism, a number of importantbyproducts were observed in these studies. The implementation of TCs ininstitutional settings has produced documented reductions in drug usewithin the institutions, dramatic reductions in levels of institutional vio-lence and disciplinary incidents, improved working conditions and reducedstress on staff, and improved morale of both staff and inmates32.
Other research findings support the efficacy of treatment for offenders. Key findingsinclude:
❒❒❒❒❒ Length of time in treatment is consistently the most important variablerelated to treatment outcome. For TC clients, research has shown that aminimum of 9-12 months is needed to produce good outcomes33.
❒❒❒❒❒ Successful outcomes may require more than one treatment experience.Many addicted individuals have multiple episodes of treatment, often witha cumulative impact34.
❒❒❒❒❒ A comprehensive continuum of treatment services, including aftercare,supports treatment effectiveness35.
❒❒❒❒❒ Treatment does not need to be voluntary to be effective36.
31Knight, Kevin; Simpson, D. Dwayne, and Hiller, Matthew L. 1999. “Three year reincarceration out-comes for in-prison therapeutic community treatment in Texas.” The Prison Journal, 79(3), 337-351.32Deitch, David; Koutsenok, M.; McGrath, P.; Ratelle, John; and Carleton, R. 1998. Outcome FindingsRegarding In-custody Adverse Behavior Between Therapeutic Community Treatment and Non-treatmentPopulations and Its Impact on Custody Personnel Quality of Life. San Diego, CA: University of Califor-nia–San Diego, Department of Psychiatry, Addiction Technology Transfer Center.33Wexler, H.K.; Falkin, G.P.; and Lipton, D.S. 1988. A model prison rehabilitation program: An evalua-tion of the Stay’n Out therapeutic community. Final report to the National Institute on Drug Abuse.34Principles of Drug Addiction Treatment: A Research-Based Guide. National Institute on Drug Abuse,1999. NIH Publication No. 99-4180.35Center for Substance Abuse Treatment. Continuity of Offender Treatment for Substance Use DisordersFrom Institution to Community. Treatment Improvement Protocol (TIP) Series, Number 30. Washing-ton, DC: U.S. Government Printing Office, 1998.36Leukefeld, C.G., and Tims, F.M., eds. Compulsory Treatment of Drug Abuse: Research and ClinicalPractice. National Institute on Drug Abuse Research Monograph, Number 86. Rockville, MD: NationalInstitute on Drug Abuse, 1988.

Sentencing Trends and Correctional Treatment in Delaware
33
SENTAC
Correctional Treatment in Delaware
In part as a result of these studies, the U.S. Department of Justice began administer-ing the Residential Substance Abuse Treatment for State Prisoners (RSAT) FormulaGrant Program. This program enabled states to access funding to develop residentialprogramming for offenders, and has resulted in the rapid expansion of TCs and othercorrectional treatment programs across the country. RSAT funds were used in Dela-ware to significantly expand the Key/Crest continuum.
In sum, the existing body of evaluation literature on prison-based TCs has supporteda widely accepted conclusion in the corrections field that TC is an effective and effi-cient means of addressing the problems of seriously addicted offenders. The researchalso indicates that completion of short-term treatment and temporary abstinencefrom drugs are probably not sufficient to habilitate most serious offenders. For livescharacterized by self-destructive acts, violence, hopelessness, and lack of meaningfulrelationships, the concept of rehabilitation is probably a misnomer. Many of theseindividuals were not previously “habilitated,” never having learned prosocial skills.At best, prisons temporarily remove offenders from society rather than transformingattitudes and values.
Successful substance abuse treatment needs to address the multiple problems thatlead to drug addiction and criminality. Ultimately, the offender, the justice system,and society are better served if time spent in prison is directed toward recovery, to-ward habilitation, and toward reintegration into society. Inmate follow-up in commu-nity-based treatment after release appears important to the consolidation of prosocialgains. The success of substance abuse treatment in a variety of settings is creatingimportant changes in correctional philosophy.
DELAWARE’S STATEWIDE CORRECTIONALTREATMENT SYSTEM
The Delaware Department of Correction established the Key Therapeutic Community(TC) in 1988 with federal funds from the Bureau of Justice Assistance. The programbegan as a 20-bed pilot program operating out of Gander Hill prison in Wilmington,and was designed as a 12- to 18-month treatment program for chronic substanceabusers with serious criminal backgrounds and other character disorders. The Uni-versity of Delaware, through a National Institute on Drug Abuse (NIDA) researchgrant, subsequently developed the Crest Outreach Center in 1991 as a work releaseTC in Delaware. Since then, through a combination of federal and state funds, theKey/Crest continuum has expanded to include a women’s TC (Key Village); institu-tional TCs for men operating out of Gander Hill (Key North), Sussex Prison (KeySouth), Webb Correctional Institution (Key West); Crest components at the PlummerCenter (Crest North), Sussex Halfway House (Crest South) and Morris Correctional
...the existingbody of
evaluationliterature onprison-based
TCs hassupported a
widelyaccepted
conclusionin the
correctionsfield that TC is
an effectiveand efficient
means ofaddressing
the problemsof seriously
addictedoffenders.

Sentencing Trends and Correctional Treatment in Delaware
34
SENTAC
Correctional Treatment in Delaware
Institution (Crest Central); and a statewide aftercare component37. Rapid expansionof these programs occurred during the mid- to late-1990s, with the Key/Crest con-tinuum currently consisting of approximately 600 institutional beds, 400 work re-lease/community-based TC beds38, and approximately 400 aftercare slots39.
In addition, the Greentree program, a self-help correctional treatment program thatoperates at the Delaware Correctional Center, expanded in 1994 to its current capac-ity of approximately 175 inmates.
Figure 8, entitled Delaware (DOC) Correctional Treatment Beds, traces the expansionof Level V and Level IV correctional treatment programs. The growth in this pro-gramming has been rapid and significant. It is important to note that the programexpansion represented in this chart primarily represents a shift from “regular” insti-tutional or work release beds to treatment beds, and does not represent an increasein prison or work release beds overall40. As Figure 8 shows, the Key and Crest pro-grams have been in a state of rapid growth and change, while the Greentree programhas been stable for quite some time.
Key/Crest Continuum
The Key/Crest continuum is designed to provide institutional TC programming foroffenders who are within two years of their release dates or who are serving “addic-tion” sentences41, community-based transitional TC programming that includes awork release component for six to nine months, followed by aftercare groups for anadditional six months. Aftercare consists of once a week group and once a monthindividual counseling, and includes a continuum of intervention activities for thosewho relapse to drug use or exhibit behavioral problems.
37Spectrum Behavioral Services, the contractor that provides Key/Crest services, also operates program-ming out of the Central Violation of Probation (VOP) Center, a program for youthful offenders at Gan-der Hill (YCOP), and educational programming at the boot camp. Analysis of these sites is not in-cluded in this report because they were not operational during the 1999 study year. In addition,Spectrum provides drug and alcohol education services at the boot camp, and boot camp graduates arerequired to participate in aftercare.38Representing approximately 800 “slots”.39The number of aftercare slots varies based on demand.40Although no new beds were added for Key per se, a number of beds were designated as Key bedswhen new construction occurred. Likewise, additional Crest beds were designated when Morris Cor-rectional Institution expanded and changed to a Level IV facility, and when the VOP centers wereconstructed.41Length of stay at the various Key sites varies somewhat by design. Most of the Key programs aredesigned to provide 12–18 months of treatment to coincide with release dates. Key West was designedto be a more short-term program of 6–9 months, and the average length of stay is currently 7.5 months.In addition, modifications have been made to establish a short-term version of Key at all the other Keyprogram sites. This modification was made to accommodate a backlog that occurred at Key West, andto satisfy court orders that call for “short-term Key” or do not contain enough Level V time to allow forextensive stays.

Sentencing Trends and Correctional Treatment in Delaware
35
SENTAC
Correctional Treatment in Delaware
Figure 8.
Each level of treatment consists of three basic phases: Orientation, Primary Treat-ment and Re-Entry. Movement among these phases is based on participant progress.A number of curriculum-based educational seminars are provided at each phase oftreatment, and individual and group counseling sessions include encounter groups(designed to teach participants how to get past attitudes, behaviors and actions thatare barriers to achieving compliance and conformity), caseload group counseling,relapse prevention, criminal thinking, and other topical groups. In addition, all resi-dents are assigned a job function within the community, and progress to more re-sponsible jobs based on their needs and progress. Job functions are designed to teachresidents skills, as well as to manage the community. Residents are also encouraged(and at some sites, required) to obtain their GED if they do not have one, or partici-pate in other educational or job training programs. During more advanced treatmentphases, residents are encouraged to work in institutional jobs, and in Crest programs,to participate in community employment through work release.
Crest was designed to serve as a transitional phase for those completing Key, as wellto examine the effects of work release TC treatment for clients who did not comefrom a prison TC42. Therefore, a number of people are also sentenced directly toCrest programming by the courts, even though they have not completed a Key pro-gram. The DOC has recently initiated a policy whereby those sentenced directly toCrest participate in short-term (three months) residential programming at the Cen-tral VOP Center, but this was not in effect during our 1999 study year. People alsomove directly to aftercare upon completion of Key.
Key and Crestprograms
have been in astate of rapidgrowth and
change, whilethe Greentreeprogram hasbeen stable
for quite sometime.
19
8
19
8
19
8
19
9
19
9
19
9
19
9
19
9
19
9
19
9
19
9
19
9
19
9
20
0
20
0
0
100
200
300
400
500
600
700
Greentree
Level V Key
Level IV Crest
DO
C T
reat
men
t B
eds/
Slo
ts
Key North Expands
Key North Expands,and New Horizon atVOP Central Opens
CrestCentralOpens
Crest South Opens
KeySouthOpensKey West Opens
Key Village Opens
Delaware (DOC) Correctional Treatment Beds
Key NorthFederalFunding Starts
Key North StateFunding Starts
Crest NorthU of D Funding Starts
Green TreeReaches Capacity
700
600
500
400
300
200
100
0
2001
2000
1999
1998
1997
1996
1995
1994
1993
1992
1991
1990
1989
1988
1987
DelSAC March 2002
42Martin et. al, 1999. Three-year outcomes of therapeutic community treatment for drug-involvedoffenders in Delaware: from prison to work release to aftercare. The Prison Journal, Volume 79, No. 3,September, 1999, pp. 294-320.

Sentencing Trends and Correctional Treatment in Delaware
36
SENTAC
Correctional Treatment in Delaware
Although basic program goals and operational procedures are the same, many varia-tions occur between and among the Key and Crest programs. Some of the programdistinctions are included in Table 6, entitled Delaware’s Key and Crest Continuum.
Greentree Program
The Greentree program was started with federal funds in the early 1970s. At thattime, alcohol and drug counselors employed by the Bureau of Alcohol and Drug Ad-diction (now the Division of Substance Abuse Services) operated what was basicallyan outpatient substance abuse treatment program for inmates confined at the Dela-ware Correctional Center. Since that time, the program has gone through substantialchanges, and is now operated exclusively by the Department of Correction. Cur-rently, 175 inmates are housed in a separate facility, and two correctional counselorssupport the program. The former Director, Ms. Frances Lewis, had been working inthe Greentree program since the late 1970s, and was formerly certified as a substanceabuse counselor. The other counselor is a former correctional officer who became acorrectional counselor in the early 1990s. A new director (Kay Sturtz), also a correc-tional counselor, has recently taken over Ms. Lewis’ duties.
Unlike the Key/Crest continuum, the Greentree program is not designed to workwith inmates pending release. While no detentioners are accepted, any inmate sen-tenced to more than six months may be eligible. In addition, the program acceptsfelony DUI offenders. Lifers are eligible, and according to staff generally want to par-ticipate if they have an upcoming parole or pardon board hearing. Many graduatesreturn to the general population, and graduation is not tied to release dates. Potentialclients write a letter to the program director and are interviewed to see if they areacceptable for admission.
Almost all of the therapeutic activities are conducted by inmates who have beenlong-term residents of Greentree, with staff making final progress decisions for resi-dents and providing program oversight43. An inmate facilitator leads each of fourtiers of approximately 44 residents. The program is offered in three versions, prima-rily depending on length of sentence. An “accelerated” six-month program is con-ducted for those court-ordered to Greentree, usually with the stipulation that theycan be released from Level V upon completion. There are also 12- and 18-month ver-sions, and inmates are assigned to these based on their histories, needs, and sentenceparameters. DUIs and others with short sentences are housed together in one of thetiers. In addition, Greentree correctional counselors provide outpatient sessions forother inmates outside the Greentree setting.
Each of these versions (6-, 12-, and 18-month) is structured into three phases follow-ing orientation. In Phase I, childhood issues are addressed; during Phase II, adultissues are addressed; and in Phase III, the client is offered an opportunity to start
Crest wasdesigned to
serve as atransitional
phase forthose
completingKey, and to
examine theeffects of
work releaseTC treatment
for clientswho did notcome from a
prison TC.
43Staff oversees therapeutic activities occasionally, and approves all program changes. Staff communi-cates frequently with facilitators about residents, and facilitators’ recommendations are taken intoconsideration regarding disciplinary actions, phase movement, and graduation readiness.

Sentencing Trends and Correctional Treatment in Delaware
37
SENTAC
Correctional Treatment in Delaware
Table 6.
Del
awar
e’s
Key
an
d C
rest
Co
nti
nu
um
Nam
eLo
cati
onBe
dsPr
ogra
m L
engt
hCl
ient
s Ser
ved
Prog
ram
Cha
ract
eris
tics
Key N
orth
Gand
er H
ill20
0-23
012
-18
mon
ths,
with
Mal
esTw
o 10
0+-b
ed b
arra
cks-
like d
orm
itorie
s fla
nk a
larg
e ope
n ar
ea. T
he o
pen
area
is u
sed
for m
ost c
linica
lw
ith a
6-9
mon
thac
tiviti
es w
ith th
e aid
of m
ovab
le ac
oust
ic pa
nels,
and
staf
f cub
icles
are l
ocat
ed ar
ound
the p
erim
eter
.sh
ort t
erm
Loca
ted
in th
e new
sect
ion
of G
ande
r Hill
, the
acou
stics
initi
ally
pre
vent
hea
ring
in n
orm
al sp
eaki
ng to
nes.
com
pone
ntSt
aff t
urno
ver h
as b
een
high
. Sec
urity
staf
f is e
xper
ienc
ed in
TC an
d is
very
supp
ortiv
e of t
he p
rogr
am. K
eyNo
rth
is a f
lags
hip
prog
ram
with
a lo
ng h
istor
y and
wel
l dev
elop
ed cu
lture
. Thi
s pro
gram
pro
vide
s asig
nific
ant i
mpr
ovem
ent i
n in
stitu
tiona
l man
agem
ent a
nd re
duce
d op
erat
iona
l cos
ts.
Key V
illag
eBa
ylor
Wom
en’s
9612
-18
mon
ths
Fem
ales
Four
24-
pers
on p
ods s
urro
und
a cen
tral a
rea t
hat i
nclu
des a
secu
rity s
tatio
n. O
ffice
and
coun
selin
g sp
ace i
sCo
rrect
iona
llim
ited.
The m
ain
area
is u
nder
-util
ized
for c
linica
l act
iviti
es d
ue, in
par
t, to
the l
ocat
ion
of th
e sec
urity
pos
t.In
stitu
tion
Whi
le so
me a
ctiv
ities
inclu
de th
e ent
ire co
mm
unity
, the
pod
s are
stru
ctur
ed in
larg
e par
t as m
ini-T
Cs.
Staf
fing
patte
rns a
re st
able
.
Key W
est
Web
b Co
rrect
iona
l90
6-9
mon
ths
Mal
es w
ho m
eet
Loca
ted
in th
e old
Pre
Tria
l Ann
ex, K
ey W
est h
as ex
perie
nced
low
staf
f tur
nove
r, and
the p
rogr
am m
akes
Inst
itutio
nm
inim
um se
curit
ycr
eativ
e us
e of
the
limite
d sp
ace
avai
labl
e.cla
ssifi
catio
nre
quire
men
ts
Key S
outh
Suss
ex Co
rrect
iona
l16
0 -1
8012
-18
mon
ths
Mal
esKe
y Sou
th ca
pacit
y flu
ctua
tes,
occu
pyin
g tw
o or
thre
e of f
our a
vaila
ble p
ods i
n th
e fac
ility
. Eac
h po
dIn
stitu
tion
cont
ains
cent
ral p
rogr
am sp
ace,
offic
e spa
ce, a
nd d
orm
itory
-sty
le h
ousin
g lo
cate
d on
the u
pper
leve
l. The
reha
s bee
n so
me s
taff
turn
over
, inclu
ding
the d
irect
or an
d cli
nica
l dire
ctor
.
Cres
t Nor
thPl
umm
er Ce
nter
140
6- 9
mon
ths
Mal
es a
nd Fe
mal
esCr
est N
orth
ope
rate
s out
of t
he P
lum
mer
Wor
k Rel
ease
Cent
er. W
omen
and
men
are r
estri
cted
to o
n-sit
eAp
prox
imat
ely 3
0ac
tiviti
es d
urin
g th
e firs
t thr
ee m
onth
s of t
heir
stay
, the
n ar
e tra
nsiti
oned
to w
ork-
rele
ase s
tatu
s. Sp
ace t
oCr
est N
orth
clie
nts
cond
uct c
linica
l act
iviti
es is
adeq
uate
. The
Plu
mm
er Ce
nter
is lo
cate
d in
a hi
gh-c
rime,
high
-dru
g ne
ighb
or-
are
wom
enho
od; r
esid
ents
are
expo
sed
to th
is en
viro
nmen
t with
rela
tivel
y few
neg
ativ
e inc
iden
ts. T
here
has
bee
nso
me s
taff
turn
over
, inclu
ding
the d
irect
or an
d cli
nica
l dire
ctor
. Thi
s pro
gram
has
stro
ng re
latio
nshi
ps w
ithth
e War
den
and
othe
r sec
urity
staf
f.
Cres
t Cen
tral
Mor
ris Co
rrect
iona
l10
06-
9 m
onth
sM
ales
Loca
ted
in th
e new
ly re
mod
eled
MCI
, the
facil
ity is
wel
l des
igne
d to
hou
se a
TC. R
esid
ents
are
enga
ged
with
Inst
itutio
nst
aff. T
he p
rogr
am st
arte
d in
199
9 an
d ha
s had
low
staf
f tur
nove
r.
Cres
t Sou
thSu
ssex
Hal
fway
150
6-9
mon
ths
Mal
es a
nd Fe
mal
esLo
cate
d in
the S
usse
x Hal
fway
Hou
se, t
he fa
cility
is au
gmen
ted
by p
refa
brica
ted
build
ings
that
offe
rHo
use
exce
llent
spac
e fo
r clin
ical a
ctiv
ities
. The
ratio
of w
omen
to m
en is
abo
ut e
ven,
ele
vatin
g th
e fo
cus o
nw
omen
’s ne
eds i
n th
is pr
ogra
m.
Afte
rcar
eAl
l thr
ee co
untie
s40
0, ba
sed
6 m
onth
sM
ales
and
Fem
ales
Afte
rcar
e pro
gram
s ope
rate
out
of C
rest
Nor
th in
Wilm
ingt
on, t
he D
over
Pro
batio
n Of
fice,
and
Cres
t Sou
th in
on d
eman
dw
ho h
ave
Geor
geto
wn.
Offe
nder
s who
hav
e com
plet
ed K
ey an
d/or
Cre
st ar
e req
uire
d to
par
ticip
ate i
n gr
oup
and
com
plet
ed a
Key
indi
vidu
al c
ouns
elin
g se
ssio
ns an
d ar
e mon
itore
d fo
r sub
stan
ce u
se an
d be
havi
oral
pro
blem
s.an
d/or
Cre
stpr
ogra
m

Sentencing Trends and Correctional Treatment in Delaware
38
SENTAC
Correctional Treatment in Delaware
“giving back” to the program44. Those in the six-month program attend all requiredgroups and seminars in an accelerated fashion. All residents are required to meet theconditions of their correctional treatment plan, which may include participation inGED classes, mental health classes, work at an institutional job, attendance at pre-release classes, etc. Almost all Greentree residents are involved in some sort of out-side activity (work in institutional jobs, etc.).
Seminars and group sessions are offered on topics such as 12 Steps, TransactionalAnalysis, DUI, Friends in Need (similar to AA/NA), and others. Inmate peer coun-selors and facilitators run all groups. All residents participate in a “hot seat” groupprior to graduation. This activity, whereby the person on the “hot seat” recalls majorlife events from birth, is designed to assess whether the client can identify thoseactivities and feelings that contributed to the client’s present life situation, as wellas the level of self-awareness and honesty the client has achieved. Morning “forma-tions” are held daily on each tier, are repeated in the afternoon for those clients whowork or have other activities during the day, and may be called in the evening if nec-essary. During formation, anybody can express concerns or share information/issues.Often, issues that arose during previous groups or through other activities are addressedduring formation. Facilitators lead formations, although all residents participate.
METHODOLOGY
As directed by the enabling legislation and per the instructions set forth by the Con-troller General and the Budget Director, this study was designed to provide a snap-shot view of comparative recidivism among the Key, Crest and Greentree programs.
A total of 1,630 cases were included in the study. Lists of offenders who were dis-charged from a Key, Crest, or Key/Crest Aftercare program during calendar year199945 were provided to the Statistical Analysis Center (SAC) by the contractor,Spectrum Behavioral Services (the substance abuse arm of Correctional Medical Ser-vices, Inc.). The lists were verified with CJIS and DOC databases to insure properidentification of inmates (by checking for validity of SBI numbers), and to verifyplacement in the correctional system. For instance, records for discharges of KeySouth were cross-checked with DOC records to make sure the inmates were classi-fied at Sussex Correctional Institution during the time they were at Key South.
The Key programs had a total of 758 discharges in 1999. 468 persons (60%) wereidentified as completers, and of these, 445 had also been released from a Level V in-stitution. Crest programs had a total of 725 discharges. Of these, 481 (66%) wereidentified as completers.
44Some residents are offered the opportunity to remain at Greentree after program completion to “payback,” and may become peer facilitators or co-counselors. Currently, approximately 20 inmates are inthis status and may remain at Greentree for quite some time.
45Calendar year 1999 was chosen to allow enough time after discharge to measure recidivism.
Compared toother national
studies, thisstudy hasused verystringent
measures ofrecidivism.

Sentencing Trends and Correctional Treatment in Delaware
39
SENTAC
Correctional Treatment in Delaware
Greentree provided a list of offenders who were discharged from the program duringcalendar year 1999. Because not all offenders are released from Level V upon comple-tion of Greentree, the last Greentree completion cohort from 1998 was also includedin the study46. Identification and classification was also verified for this population.
A total of 147 discharges were reported for Greentree. Of these, 94 (64%) wereidentified as completers. Of the 94 program completers, 66 had been released fromLevel V at the time of the study.
This study examined recidivism for completers only. Reasons for this are describedin the following section entitled “Methodological Limitations.”
Once identification was verified, criminal histories were accumulated for all studysubjects. There were a total of 96,717 charges associated with 38,661 arrest eventsfor the participants.
Post-program recidivism measures were derived using an “at-risk” assumption.Offenders were not considered at risk until they had been released from an institu-tional program as well as released from a Level V facility. For instance, graduates ofGreentree who were returned to the general population waiting release from Level Vwere not considered at-risk until they left the institutional setting47. Offenders inCrest or aftercare programs were considered at-risk upon program entry, since theywere not in a Level V facility and had some opportunity to reoffend.
Once a person is “at-risk,” any return to jail, prison, or detained status is deducted.This is referred to as “at-risk” time less time in a major institution (MI). This meth-odology provides a more accurate view of when an offender may have been rear-rested. In addition, a few offenders were not “at-risk” a full 18 months. Therefore,there is a possibility that recidivism rates will change slightly over time.
Recidivism was defined as any new felony arrest, violent felony arrest or violation ofprobation (VOP). Compared to other research studies examined (that may usereincarceration as a recidivism measure), this is a very rigorous study model.
In addition to statistical analyses, descriptive and qualitative reviews were conductedfor all correctional treatment programs by project consultants Beth Peyton andPeter B. Rockholz. Ms. Peyton is the former director of the Delaware TreatmentAccess Center, and provides consulting services to states and the federal governmentin the area of integrating treatment services into justice system processes. Mr.Rockholz is a national expert on therapeutic communities and other substance abusetreatment programming for incarcerated offenders. Mr. Rockholz is a senior associateat the Criminal Justice Institute, the organization contracted by the U.S. Departmentof Justice to provide training and technical assistance under the federal ResidentialSubstance Abuse Treatment (RSAT) initiative. He developed the initial version of
46Greentree officially discharges offenders from the program twice a year.
47Gaps between program completion and institutional discharge have a potential impact on treatmenteffect, but were not able to be factored in to this study.

Sentencing Trends and Correctional Treatment in Delaware
40
SENTAC
Correctional Treatment in Delaware
the national prison TC standards that have subsequently been released by the WhiteHouse Office of National Drug Control Policy (ONDCP). A revised version of thesestandards is currently under consideration for adoption by the American Correc-tional Association.
A series of site visits was conducted by Ms. Peyton and Mr. Rockholz, and a number ofpeople were interviewed and/or observed. Mr. Rockholz and Ms. Peyton used thedraft version of the National Prison TC Standards and the Criminal Justice Institute’sEssential Prison TC Standards as baseline guides for analysis. These standards areavailable through the American Correctional Association.
Methodological Limitations
There are several methodological limitations to the research design that preventdrawing definitive conclusions about the efficacy of correctional treatment programsin Delaware, and limit our ability to compare Delaware’s programs with findingsfrom other research. As such, the findings in this report should be considered pre-liminary, and are indicative of future research needs as much as current programeffectiveness. These methodological limitations include:
❒❒❒❒❒ No control or comparison group exists to enable us to compare outcomesof offenders who participated in treatment with similar offenders who didnot receive treatment.
❒❒❒❒❒ The nature of the population of non-completers does not allow for com-parison to completers in this snapshot view. Many offenders in the 1999non-completer category may have gone on to complete treatment later—they are actually treatment completers, but did not complete during 1999.A more comprehensive, longitudinal study would be needed to make thiscomparison.
❒❒❒❒❒ Client lists from program providers contained some errors. Client lists wereprovided by both Spectrum and Greentree, and contained between a 10percent and 20 percent error rate on identification (SBI numbers werewrong or missing). In addition, there was no way to cross check to ensurewe received complete lists of all offenders who were discharged in the1998/1999 study period. Although efforts were made to verify client par-ticipation, this baseline data may still contain some errors.
❒❒❒❒❒ Measures of success and failure were defined by the programs, and wereinconsistent. During the study period, there were inconsistent policiesamong programs regarding the criteria that constituted success and failure(definitions for discharge criteria have subsequently been standardizedamong all the Key and Crest programs). In addition, some programs useddischarge criteria that was deemed “neutral,” and due to time constraintsand lack of program consistency, the study population has not been broken
It is prematureto make
definitiveconclusions
about theeffectiveness
of correctionaltreatment in
Delawarewithout
examining theeffect of thecontinuum.

Sentencing Trends and Correctional Treatment in Delaware
41
SENTAC
Correctional Treatment in Delaware
down by detailed termination criteria. Neutral criteria could include suchthings as being medically inappropriate for the program, time running outon a sentence order, etc.
❒❒❒❒❒ The substance use history and severity, and other clinical characteristics ofclients (both completers and non-completers) is not known for the studypopulation. This information may be available in paper files, but time andresources did not allow for collection of this data for inclusion in the study.
❒❒❒❒❒ Because the study group is a snapshot population, we do not have data toexamine the effect of Delaware’s continuum of treatment on this popula-tion through longitudinal study. The literature indicates that offenderswho complete a long-term continuum of treatment achieve better resultsthan those who complete an institutional program only. It is premature tomake definitive conclusions about the effectiveness of correctional treat-ment in Delaware without examining the effect of the continuum.
❒❒❒❒❒ Program observations and site visits were conducted in November andDecember of 2001, and the study population consists of discharges from1999 who may have been in treatment even earlier. Program quality couldhave varied between the study period and the time the observations weremade.
How the System is Used—How do People get There?
Offenders are referred for admission to the Key, Crest, Greentree and aftercare pro-grams through a variety of mechanisms, including 1) court orders that specify a spe-cific program (e.g., Key, Greentree); 2) court orders that specify a particular programwith the stipulation that a portion of the Level V time may be suspended upon suc-cessful completion (“addiction” or “suspendable” sentences); 3) court orders thatcontain a condition for treatment in general; 4) parole orders; and, 5) classificationto a program by DOC. These mechanisms are not mutually exclusive since DOC ulti-mately classifies all offenders into these programs. However, court and parole ordersare taken into consideration and given priority when feasible.
Consistent with effective treatment practices, the Key/Crest/Aftercare continuumwas designed to provide intensive initial treatment in an institutional environment,followed by transitional treatment and support to assist offenders to successfullyreenter the community48. In reality, however, offenders move into and out of the con-tinuum similarly to how offenders move in the general justice system. That is, theyare placed in an initial program setting and their sanction (and treatment) levels aremodified based on their progress and compliance (or lack thereof). Sentence lengthand availability of treatment slots appear to be the biggest drivers of placement andadmission to correctional treatment programs. As a result, some of the benefits ofthis continuum may not be realized.
48The Greentree Program does not have an aftercare component as part of its program structure.
Consistentwith effective
treatmentpractices, the
Key/Crest/Aftercare
continuumwas designed
to provideintensive
initialtreatment
in aninstitutional
environment,followed bytransitional
treatment andsupportto assist
offenders tosuccessfullyreenter thecommunity.

Sentencing Trends and Correctional Treatment in Delaware
42
SENTAC
Correctional Treatment in Delaware
In this study, we found very few people who completed the Key/Crest treatment con-tinuum in a traditional fashion during the 1999 study year. This phenomenon and itsimplications will be described in more detail in a forthcoming report to focus morespecifically on offender movement throughout the treatment system. However, it isimportant to understand why many offenders are not afforded the opportunity tocomplete the full continuum of treatment:
❒❒❒❒❒ SENTAC is based on the premise that incarceration space should be reservedfor persons with serious and violent charges. Therefore, many offenderswho clinically might benefit from a long-term residential TC are placed inLevel IV at Crest. If they respond to treatment at this level, prison resourcesare conserved. If they fail to respond, they often receive a violation of pro-bation and they may be ordered to Key.
❒❒❒❒❒ Sentences may result from Rule 11 pleas49 which stipulate Level III super-vision after Key completion, thus bypassing Crest.
❒❒❒❒❒ Space is not always available in Level IV Crest programs. Although recentexpansion of Crest has created more balance between institutional and LevelIV programming, many offenders may have to wait for Crest admission,and may not be admitted at all prior to the expiration of their sentences.
❒❒❒❒❒ There are statutory and DOC policy prohibitions that prevent some Keygraduates from entering work release and therefore Crest. Class A felons,sex offenders, and habitual offenders are prohibited from work release bylaw. DOC policy prohibits the admission of inmates with detainers50, in-mates serving sentences under 4204(k)51, and inmates convicted of escapeafter conviction or escape 2nd to work release.
❒❒❒❒❒ Some offenders are ordered directly to aftercare because they have com-pleted another community-based treatment program, or have participatedin Key or Crest during previous years.
❒❒❒❒❒ Some offenders graduate from boot camp which is followed by aftercare.
Another phenomenon that affects program admission and movement is the “stutterstart.” Offenders may have multiple program admissions before they engage in treat-ment. Because the programs are voluntary, offenders may decline to participate.Leverage is used by the courts and by DOC to encourage participation, including in-creasing sanctions or restricting institutional privileges. As such, some offendersmay be admitted to programming two or more times before they fully start treatment.
49Under Court Rule 11, which has recently been rescinded, judges agree to accept a plea as well as asentence agreed upon by the prosecution and defense. If the judge refuses to accept the sentence, theplea can be withdrawn.
50Unless the detaining authority has given specific approval for work release.
51Unless the sentencing judge specifies that work release is allowed.
Anotherphenomenon
that affectsprogram
admission andmovement isthe “stutter
start.”Offendersmay havemultipleprogram
admissionsbefore theyengage intreatment.

Sentencing Trends and Correctional Treatment in Delaware
43
SENTAC
Correctional Treatment in Delaware
RESULTS
Although methodological limitations render many of the findings of this study pre-liminary, in general, it appears that program results reflect what other studies haveshown. Offenders who complete institutional programs (e.g., Key and Greentree)show measurable improvements in recidivism, but these improvements erode overtime without aftercare. Rates of recidivism for completers of Crest were lower thanthose of Key or Greentree completers, but the populations going in to these programsdiffer based on prior criminal histories. Recidivism rates are also lower for offenderswho have completed Key and Crest programs, compared to those who complete Keyonly or Greentree only.
A pre-post comparison indicates that criminal activity after program completion issubstantially reduced from pre-program levels. Given the extremely serious criminalhistories of the populations in treatment, any type of rehabilitation is a challenge,and any reduction in criminal activity should be viewed very positively.
Compared to other national studies, this study has used very stringent measures ofrecidivism. The California study of Amity used return to prison as a measure ofrecidivism; similarly, the Texas study compared reincarceration rates of offenders. TheUniversity of Delaware study of Key and Crest did not include violations of probationor parole as measures of recidivism, and relied on offender self-report of rearrest.
Violation of probation rates for Key, Crest, and Greentree completers are high, dem-onstrating that the system is holding these offenders accountable with increased sur-veillance. While some VOPs are tied to new criminal activity, other VOPs result fromrelapse or lack of compliance in treatment. As such, some VOPs may reflect adjust-ments to treatment rather than new criminal activity.
As this study progressed and reached its preliminary conclusions, it became moreand more apparent that the flow of offenders through these programs is a criticalissue in evaluating effectiveness. Although we cannot yet make a definitive state-ment, it appears that too few people are receiving primary treatment, transitionaltreatment and aftercare in an uninterrupted, consecutive fashion. And while it maynot be wise to incarcerate offenders based on treatment need, too few Key completersappear to transition to Crest and aftercare, and Greentree graduates do not appear toreceive aftercare as a general rule.
A Comparison of Key and Greentree
A snapshot look at recidivism indicates that overall, offenders who completed a Keyprogram did about as well as offenders who completed the Greentree program. Interms of rearrests for any felony, about 26 percent of Key and Greentree graduateswere arrested for any new felony 18 months after release from the program and froma Level V institution, as depicted in Figure 9, entitled Key and Greentree: Percent Re-arrested Any Felony: 1999 Completers. Key completers averaged 5.5 felony arrestsprior to program participation, and Greentree completers had even more seriouscriminal histories, with an average of 6.2 prior felony arrests.
Offenderswho completeinstitutional
programs(e.g., Key and
Greentree)show
measurableimprovementsin recidivism,
but theseimprovements
erode overtime without
aftercare.

Sentencing Trends and Correctional Treatment in Delaware
44
SENTAC
Correctional Treatment in Delaware
Table 7, entitled Key and Greentree 1999 Snapshot Recidivism: Percent Rearrested AnyFelony, compares results from the various Key programs. We would expect to see dif-ferences in program outcome, since the Key programs work with different popula-tions (Key Village is for women, Key West is a short-term program for offenders whomeet minimum security classification requirements) and were at different life cyclestages during the study year.
Figure 9.
Key and Greentree 1999 Snapshot RecidivismPercent Rearrested Any Felony
Months at risk (less Major Institution time)
6 12 18 24
Key North Completers 11.4 22.7 27.6 30.3
Key West Completers 9.8 17.6 19.6 25.5
Key South Completers 10.2 18.9 31.5 39.4
Key Village Completers 6.5 9.7 16.1 29.0
All Key Completers n = 445 10.3 19.6 26.1 31.7
Greentree Graduates n = 66 9.1 19.7 27.3 31.8
Table 7.
A pre-postcomparison
indicates thatcriminal
activity afterprogram
completion issubstantiallyreduced frompre-program
levels....
...the flow ofoffenders
through thesecorrectional
treatmentprograms is acritical issuein evaluatingeffectiveness.
6 12 18 24
Months at risk (less MI time*)
0
5
10
15
20
25
30
35
Pe
rce
nt
Rea
rre
ste
d
Greentree GraduatesAll Key Completers
DelSAC: March 2002
Key and Greentree: Percent Rearrested Any Felony1999 Completers
*MI refers to any time spent in a major institution

Sentencing Trends and Correctional Treatment in Delaware
45
SENTAC
Correctional Treatment in Delaware
Figure 10, entitled Key and Greentree: Percent Rearrested Title 11 Violent Felony: 1999Completers, shows the percentage of Key and Greentree completers who were rear-rested for Title 11 (non-drug) violent felonies.
Figure 10.
When examining rearrests for Title 11 violent felonies, the results show that the re-cidivism rates for violent felonies are about one-half of those for any felony.Greentree completers did slightly better than Key completers, although completers ofsome Key programs had lower violent felony recidivism than Greentree completers(Key West, Key Village). Table 8, entitled Key and Greentree 1999 Snapshot Recidi-vism: Percent Rearrested Title 11 Violent Felony, shows a breakdown by program site.
Key and Greentree 1999 Snapshot Recidivism Percent Rearrested Title 11 Violent Felony
Months at risk (less Major Institution time)
6 12 18 24
Key North Completers 3.8 8.6 11.9 13.5
Key West Completers 4.9 7.8 7.8 10.8
Key South Completers 5.5 11.0 18.1 20.5
Key Village Completers 6.5 9.7 12.9 12.9
All Key Completers n = 445 4.7 9.2 12.8 14.8
Greentree Graduates n = 66 3.0 6.1 10.6 13.6
Table 8.
Whenexamining
rearrests forTitle 11violent
felonies, theresults show
that therecidivism
rates forviolent
felonies areabout one-
half of thosefor any felony.
6 12 18 24
Months at risk (less MI time)
0
5
10
15
20
Pe
rce
nt
Rea
rre
ste
d
Greentree Graduates
All Key Completers
DelSAC: March 2002
pKey and Greentree: Percent RearrestedTitle 11 Violent Felony: 1999 Completers

Sentencing Trends and Correctional Treatment in Delaware
46
SENTAC
Correctional Treatment in Delaware
As with the general sentenced population, violations of probation (VOPs) representthe most frequent reason for continued contact with the justice system. Completersof institutional treatment programs receive perhaps the most intense scrutiny of anyoffender population, with the possible exception of those offenders in Operation SafeStreets. Figure 11, entitled DOCs Surveillance is High: VOPs Key and Greentree: 1999Completers, shows probation violations for Greentree and Key completers.
Figure 11.
It is important to recognize that probation violations almost always accompany newarrests or convictions of any kind, since a new arrest is an automatic violation ofprobation. In addition, relapses to drug use (including positive drug tests), failure toattend treatment, and a variety of other substantive and technical infractions canresult in a VOP. We do not know how many of the VOPs resulted in new sentencesor adjustments in sentence levels, although based on Superior Court data, about halfof all probation violations result in movement to a higher level. Perhaps as many ashalf of the VOPs actually reflect adjustments in treatment.
The level of VOPs in this population reflects SENTAC’s policy of holding offendersaccountable, and reinforces the seriousness of a sentence to treatment. Judges andcorrectional professionals expect treatment participants to toe the line and complywith program requirements. This focus on public safety is a major change that hasoccurred as a result of SENTAC, since prior to SENTAC, few offenders were violatedand did not reenter the system until they had committed new criminal offenses.
Crest Programs
In general, recidivism results for Crest completers were positive. Fewer than 20 per-cent of all Crest completers had a new felony arrest at 18 months.
6 12 18 24
Months at risk (less MI time)
0
10
20
30
40
50
60
70
Perc
ent Violated
Greentree Graduates 66
All Key Completers 445
DelSAC: March 2002
DOCs Surveillance is High: VOPs Key and Greentree1999 Completers

Sentencing Trends and Correctional Treatment in Delaware
47
SENTAC
Correctional Treatment in Delaware
The Crest population overall has a lower level of pre-program criminal activity, com-pared to the Key and Greentree populations, so we would expect to see better results.Pre-program felony arrest rates for Key and Greentree completers were substantiallyhigher than Crest completers. Crest completers have an average of 4.4 prior felonyarrests, which makes them serious criminals, but less serious than those completingKey or Greentree on average.
Offenders are admitted to Crest through a variety of mechanisms. During the 1999study period, a total of 482 Crest completers were identified. A total of 96 (20%)Crest completers were identified as having been in a Key program directly prior toadmission; 103 (21%) moved from Level V52, and 283 (59%) were direct commit-ments from the Courts. Those offenders who are sentenced directly to Crest knowthey have a lot to lose if they fail, because failure is likely to lead to incarceration.
The percentage of Crest completers who were rearrested for any felony is depicted inFigure 12, entitled All Level IV Crest Programs: Percent Rearrested Any Felony: 1999Completers.
Figure 12.
There was also some variation in outcomes based on the particular Crest programthat people completed. These site differences are shown in Table 9, entitled Level IVCrest 1999 Snapshot Recidivism: Percent Rearrested Any Felony.
Judges andcorrectional
professionalsexpect
treatmentparticipants
to toe the lineand comply
with programrequirements.
52Persons in Level V may have been in Greentree, boot camp, other programming, or nothing prior totheir transfer to Crest.
6 12 18 24
Months at risk (less MI time)
0
5
10
15
20
25
30
Pe
rce
nt
Rearre
ste
d
All Crest Completers
DelSAC: March 2002
All Level IV Crest ProgramsPercent Rearrested Any Felony: 1999 Completers

Sentencing Trends and Correctional Treatment in Delaware
48
SENTAC
Correctional Treatment in Delaware
Level IV Crest 1999 Snapshot Recidivism Percent Rearrested
Any Felony
Months at Risk (less Major Institution Time)
6 12 18 24
Crest North Completers 3.5 14.2 18.6 23.0
Crest Central Completers 1.5 8.4 21.4 29.0
Crest South Completers 1.7 11.0 17.7 21.9
All Crest Completers 2.1 11.0 18.9 24.1
Table 9.
Figure 13, entitled All Level IV Crest Programs: Percent Rearrested Title 11 ViolentFelony 1999 Completers, shows the percentage of Crest completers who were re-arrested for a Title 11 violent felony. Re-arrests for violent felonies were about halfas for all felonies. At 18 months, fewer than 10 percent of Crest completers had beenarrested for a Title 11 violent felony.
Figure 13.
Differences in rearrest rates for Violent Felonies by Crest site are shown in Table 10,entitled Level IV Crest 1999 Snapshot Recidivism: Percent Rearrested Title 11 ViolentFelony.
6 12 18 24
Months at risk (less MI time)
0
5
10
15
Perc
ent R
earre
ste
d
All Crest Completers
DelSAC: March 2002
All Level IV Crest ProgramsPercent Rearrested Title 11 Violent Felony: 1999 Completers

Sentencing Trends and Correctional Treatment in Delaware
49
SENTAC
Correctional Treatment in Delaware
Level IV Crest 1999 Snapshot RecidivismPercent Rearrested Title 11 Violent Felony
Months at risk (less Major Institution time)
6 12 18 24
Crest North Completers 0.1 4.4 7.1 8.8
Crest Central Completers 0.1 3.1 9.9 15.3
Crest South Completers 0.0 5.5 11.0 13.9
All Crest Completers 0.4 4.6 9.8 13.1
Table 10.
Consistent with SENTAC’s policy of holding offenders accountable, high levels ofsurveillance of the Crest population results in high levels of VOP’s. (See Figure 14,entitled DOCs Surveillance is High: Crest VOPs: 1999 Completers.)
Figure 14.
Again, we do not yet know how many of these VOPs result in adjustments to sen-tencing level, or how many reflect “tune-ups” or adjustments to treatment, but hopeto report this at a later time.
6 12 18 24
Months at risk (less MI time)
0
10
20
30
40
50
60
70
Pe
rce
nt Violated
All Crest Completers
DelSAC: March 2002
DOCs Surveillance is High: Crest VOPs1999 Completers

Sentencing Trends and Correctional Treatment in Delaware
50
SENTAC
Correctional Treatment in Delaware
Completion of Crest Enhances the Results of Key
Approximately 20 percent of the 1999 snapshot Crest population flowed down aftercompleting a Key program. Consistent with other research, offenders who completedboth Key and Crest had lower recidivism rates than offenders who completed onlyKey or Greentree.
Figure 15, entitled Key-Crest Comparison: Percent Rearrested Any Felony: 1999Completers, shows that completers of Key and Crest did better than Greentree-onlyor Key-only completers in terms of felony rearrests.
Figure 15.
These trends hold when comparing Key/Crest graduates to Key only or Greentreeonly graduates rearrested for violent felonies, as shown in Figure 16 entitled Key-Crest Comparison: Percent Rearrested Title 11 Violent Felony.
The maximum potency of treatment is likely to be realized with offenders who par-ticipate in a full continuum of treatment. Outcomes for both Greentree and Keycompleters should significantly improve if they receive transitional treatment andaftercare.
All offenders in the TC continuum should receive treatment in the community, butsome need institutional programming as well. Part of the success of Crest may be dueto the Key programming that precedes Crest admission for a number of clients, asKey completion prepares offenders for community-based treatment.
...offenderswho
completedBOTH
Key and Cresthad lowerrecidivismrates than
offenders whocompleted
ONLYKey or
Greentree.
6 12 18 24
Months at risk (less MI time)
0
5
10
15
20
25
30
35
Perc
ent R
earr
este
d
Greentree Graduates 66
All Key Completers 4451999 Key-Crest Completers 81
DelSAC: March 2002
Key-Crest ComparisonPercent Rearrested Any Felony: 1999 Completers

Sentencing Trends and Correctional Treatment in Delaware
51
SENTAC
Correctional Treatment in Delaware
Figure 16.
The positive cumulative effect of Key and Crest is likely to increase as Key and Crestcompleters move into and complete aftercare. Aftercare is an important and very activeprogram component in the Key/Crest continuum. Studies in Delaware and elsewherehave shown that offenders who complete a full treatment continuum including after-care demonstrate marked reductions in recidivism. Unfortunately, time did not allowfor an examination of the population of aftercare completers in Delaware.
Comparison of All Programs
When comparing all programs, in terms of felony arrests, Key and Greentree gradu-ates did about the same, with about a 25 percent recidivism rate at 18 months. Keygraduates who also completed Crest did better than Key-only or Greentree-onlygraduates. Crest completers had the lowest rate of recidivism, but they also have thelowest rate of pre-program criminal activity. Figure 17, entitled All Programs: PercentRearrested Any Felony: 1999 Completers, compares felony arrest recidivism amongthese programs.
These results are promising. In terms of felony arrest history:
❒❒❒❒❒ Crest completers averaged 4.4 prior Felony arrests;
❒❒❒❒❒ Key completers averaged 5.5 prior Felony arrests;
❒❒❒❒❒ Greentree completers averaged 6.2 prior Felony arrests.
6 12 18 24
Months at risk (less MI time)
0
5
10
15
20
Pe
rce
nt
Rea
rre
ste
d
Greentree Graduates 66
All Key Completers 445
Key-Crest Completers 81
DelSAC: March 2002
Key-Crest ComparisonPercent Rearrested Title 11 Violent Felony
The maximumpotency of
treatment islikely to be
realized withoffenders whoparticipate in
a fullcontinuum of
treatment.

Sentencing Trends and Correctional Treatment in Delaware
52
SENTAC
Correctional Treatment in Delaware
Figure 17.
Given the seriousness of these criminal histories, one would expect to see high ratesof rearrest. Because of different measurement standards, there is no way to makedirect comparisons with other states’ programs. However, we do know that in Dela-ware, an average of 39.2 percent of offenders released from prison from 1981 through1994 were returned to prison within 18 to 24 months53. Although this study used amore stringent measure of recidivism, felony rearrest, we can see that all programgraduates do better than the general population.
It may also be useful to examine how correctional treatment compares to recent bootcamp results. Table 11, entitled Felony Rearrest 18 Months at Risk: Comparison of BootCamp and Correctional Treatment Programs, shows comparative recidivism rates forcorrectional treatment programs compared to boot camp graduates.
The greater the number of prior felony arrests, the greater the likelihood that anoffender will be arrested again. Table 11 shows that in terms of prior history, bootcamp graduates had pre-program felony arrest histories that were significantly lowerthan Greentree or Key completers, and slightly lower than Crest completers. None-theless, many categories of treatment completers did better than boot camp graduateseven though we would expect to see higher recidivism based on prior history.
In terms of arrests for violent felonies, Key/Crest graduates have the lowest recidi-vism rates compared to other populations as shown in Figure 18, entitled All Pro-grams: Percent Rearrested Title 11 Violent Felony: 1999 Completers.
The positivecumulative
effect of Keyand Crest is
likely toincrease as
Key and Crestcompleters
move into andcompleteaftercare.
Aftercare is animportant and
very activeprogram
component inthe Key/Crest
continuum.
6 12 18 24
Months at risk (less MI time)
0
5
10
15
20
25
30
35
Pe
rce
nt
Rea
rre
ste
d
All Key Completers 445
Greentree Graduates 66
Key-Crest Completers 81
All Crest Completers481
DelSAC: March 2002
All ProgramsPercent Rearrested Any Felony: 1999 Completers
53DelSAC September 1997. Recidivism in Delaware 1981-1994, Phase 2. Unpublished Report.

Sentencing Trends and Correctional Treatment in Delaware
53
SENTAC
Correctional Treatment in Delaware
Felony Rearrest 18 Months at RiskComparison of Boot Camp and Correctional Treatment Programs
1999 Snapshot Completers54
Program Percent Felony Rearrest Number of Felony Priors
Greentree Completers 27.3% 6.2
Key Completers 26.1% 5.5
Boot Camp Graduates55 24.3% 4.3
Key and Crest Completers 21% na
Crest Completers 18.9% 4.4
Table 11.
Figure 18.
While these data compare outcomes of completers in terms of criminal activity, itdoes not mean that we can conclude that one program is better than another. Thepopulations who enter these programs differ based on criminal history, and we donot know how they may differ on other measures, including seriousness of substanceabuse.
6 12 18 24
Months at risk (less MI time)
0
2
4
6
8
10
12
14
16
Pe
rce
nt
Rea
rre
ste
d
All Key Completers 445
Greentree Graduates 66
Key-Crest Completers 81All Crest Completers 481
DelSAC: March 2002
All ProgramsPercent Rearrested Title 11 Violent Felony: 1999 Completers
54DelSAC 2001. Delaware’s Adult Boot Camp.
55The analysis of the correctional treatment population accounted for any time an offender was in amajor institution when calculating time at risk. If this had been done for the boot camp population,recidivism rates for boot camp would have been slightly higher.
In terms ofarrest for
violentfelonies, Key/
Crestgraduateshave the
lowestrecidivism
ratescompared to
otherpopulations.

Sentencing Trends and Correctional Treatment in Delaware
54
SENTAC
Correctional Treatment in Delaware
QUALITATIVE ANALYSIS
Delaware has an impressive continuum of correctional treatment services, with sig-nificant support for treatment as a method to reduce criminal activity by DOC ad-ministration and staff, by the judiciary, by others in the justice system, and by pro-gram providers. To a person, all wardens interviewed were very supportive of havingtreatment programs operate in their institutions. The programmatic infrastructurehas grown into a system that, when fully developed, should be able to provide maxi-mum benefit to a large number of substance-abusing offenders. The inclusion of re-quirements for treatment participation is well integrated into Delaware’s criminalsentencing practices, and the availability of correctional treatment has significantlyinfluenced criminal sentencing patterns. At the same time, in terms of organizationalgrowth, this system is in a very early stage of development.
Programming, particularly the Key/Crest continuum, is designed to coincide withmovement among the SENTAC levels, giving both the DOC and the judiciary theflexibility to access services that correlate with the supervision needs of offenders,and to respond with more intensive supervision and treatment when offenders fail torespond to less intensive interventions.
In general, all programs observed appeared to be well-run and well-organized, withparticipants seeming to be productively engaged in the treatment process. In theopinion of the consultants who conducted site visits, all programs observed, includ-ing Greentree, should be able to meet the ACA Prison Therapeutic CommunityAccreditation Standards56.
The Greentree Program
The Greentree program was observed to be a potent self-help therapeutic communityfacilitated primarily by inmates with DOC staff oversight. The Greentree program isgenerally very well designed in the context of the overall prison environment, and iseffective in addressing the behavioral, attitudinal and social habilitation needs ofinmates in a culturally proficient manner. The therapeutic community process atGreentree appears to be achieving a significant degree of clinical depth. The seniorinmates at Greentree have mastered the essential therapeutic community facilitationprocesses, and exemplify positive role modeling and genuine credibility with otherinmates. Although some of the interventions at Greentree are non-traditional andmay not be viewed favorably by traditionally trained clinicians, these are preciselythe processes that make a therapeutic community effective. In addition, there doesnot appear to be an additional cost to the DOC for the Greentree program, and theremay, in fact, be indirect savings to the institution in terms of reduced disciplinaryincidents.
It would be very difficult or impossible to replicate this program. Its quality is basedon the commitment and skills of several “lifer” inmate facilitators. In addition, anumber of long term inmates who are part of the “chain of command” provide stabil-
56These draft standards are currently being field tested.
Delaware hasan impressivecontinuum ofcorrectional
treatmentservices, with
significantsupport for
treatment as amethod to
reducecriminal
activity byDOC
administrationand staff, bythe judiciary,by others inthe justice
system, andby programproviders.

Sentencing Trends and Correctional Treatment in Delaware
55
SENTAC
Correctional Treatment in Delaware
ity and support of the positive TC culture. This program has taken years to develop,and is dependent on the mix and charisma of the inmate program leaders and long-term residents, as well as staff support.
Although Greentree could benefit from oversight by qualified TC experts, significantchanges in admission patterns, in program content, or attempts to “professionalize”the program could be disastrous. There is a chemistry in Greentree that could be al-tered by any attempt to mainstream the program57. However, the addition of after-care, preferably in the form of case management support to develop concrete after-care plans, provide advocacy at Parole Board, court and other hearings, and linkreleased residents to housing, employment, continuing care and other services wouldbenefit the program and would likely improve outcomes.
The Key/Crest Programs
The Key/Crest programs provide quality services, and are highly capable of improv-ing service delivery. Program directors and clinical supervisors at all Key/Crest sitesare highly qualified and competent in TC practices. Key/Crest has undergone a tre-mendous expansion in a relatively short period of time. Many existing programs (KeyNorth, Crest North, the Village) have expanded their capacity and/or changed loca-tion within their facilities, and new programs have developed at new sites (Key Southbecame operational in 1997, and Crest Central became operation in 1999). As a re-sult, one would expect to see some program instability and “growing pains.”
This rapid expansion has been experienced across the country, as state and localjurisdictions have taken advantage of RSAT funding to develop treatment program-ming for offenders. In a recent study of programs funded by the Residential Sub-stance Abuse Treatment (RSAT) for State Prisoners Formula Grant, the Universityof Delaware Center for Drug and Alcohol Studies found that most of the 77 sitesstudied had experienced moderate to severe start-up or expansion problems 58. Someof the problems identified in this national study have been experienced in Delaware,including high rates of staff turnover, difficulty finding staff with TC experience, andinappropriate client referrals59.
In an effort to ensure high quality services, and for lack of more appropriate alterna-tive methods, DOC requires that the Key/Crest programs meet state substance abusetreatment licensing requirements. Unfortunately, and similarly to what has occurredin several other states, the result has been the opposite of what was intended. Para-doxically, the more emphasis that is put on meeting traditional professional stan-dards, the more likely that the TC process becomes less potent and produces out-comes that are less than anticipated. This is not the fault of the licensing standards,
...in terms oforganizational
growth, theDelaware
correctionaltreatment
system is in avery early
stage ofdevelopment.
57Like Delancy Street, perhaps the most effective TC for serious offenders, Greentree would not likelymeet substance abuse treatment standards; but that does not mean that it is less effective.
58Harrison, Lana D. and Steven S. Martin. October 2002. Residential Substance Abuse Treatment(RSAT) for State Prisoners Formula Grant: Compendium of Program Implementation and Accomplish-ments. University of Delaware Center for Drug and Alcohol Studies.
59Inmates with too much or too little time remaining on their sentences.

Sentencing Trends and Correctional Treatment in Delaware
56
SENTAC
Correctional Treatment in Delaware
but rather an indirect result caused by a shift in focus to administrative and clinicalprocesses that are more traditional, that take counselors’ time away from the TC, andthat encourage the hiring of professional staff who may nonetheless lack TC experi-ence or training.
Sentencing and classification practices do not always support offender participationin a continuum of treatment services. Limitations on sentence length, laws and poli-cies that proscribe assignment to work release (Crest), and placement that is drivenby sentence length and slot availability reduce the programs’ ability to produce goodresults.
The costs associated with Key/Crest programming are offset by reductions in disci-plinary actions, reductions in security and correctional counselor staffing, and low-ered maintenance costs, particularly at some sites. At Key North, for instance, in-mates are housed in an area of Gander Hill that was difficult to manage before Keymoved in. After the Key program was located there, maintenance costs were reducedby 40 percent, and two fewer 24-hour security posts were needed (a cost reduction ofapproximately $404,400 per year60). Although these dramatic cost reductions are notapparent at all Key/Crest sites, nonetheless the programming is beneficial to the over-all discipline and management of correctional institutions.
In sum, there are a number of factors in Delaware that influence the ability of the TCsystem to produce consistent outcomes. They are summarized in Table 12, entitledFactors that Influence Correctional Treatment Effectiveness.
Factors that Influence Correctional Treatment Effectiveness
Factors supporting positive outcomes Factors limiting positive outcomes
Well established programs Few ex-offenders, TC grads on staff (Key/Crest)
Contracted services (Key/Crest) Emphasis on licensing of programs and staff credentials,absent other qualitative measures
Single provider with common approach and focus Focus on cognitive programming vs. interactive,(Key/Crest) experiential programming (Key/Crest)
Very competent program directors Emphasis on medical model (Key/Crest)
Administration and wardens very supportive of programs Promotion of participants based on time and curriculumvs. personal growth
Programs understand the justice system and have positive Sentencing and classification practices do not alwaysrelationships with criminal justice professionals support utilization of the treatment continuum
Statewide network with three levels of care Limited client tracking, MIS, ongoing evaluation capability
Rapid growth and change
Table 12.
The Greentreeprogram is
generally verywell designed
in thecontext of theoverall prisonenvironment...
but it wouldbe a challenge
to replicatethis program
since itsquality is
based on thecommitmentand skills of
several “lifer”inmate
facilitators.
60Two security posts is equivalent to about 10 correctional officer positions.

Sentencing Trends and Correctional Treatment in Delaware
57
SENTAC
Correctional Treatment in Delaware
DISCUSSION
Delaware has established a comprehensive system of therapeutic community (TC)services throughout the correctional system. National research, as well as the recidi-vism reduction apparent in this study, supports this model of treatment for offenderswith long histories of substance abuse, criminality, and other associated disorders.Correctional treatment in Delaware is interwoven into the system of sentencing andsanctioning offenders, and supports SENTAC’s goal of rehabilitating offenders. Infact, this programming supports the philosophical shift that has occurred in the jus-tice system that expects demonstrable behavioral change on the part of offenders.
Preliminary statistical research on a snapshot population of program completers in1999, consistent with other national outcome studies, shows that:
❒❒❒❒❒ Institutional treatment alone reduces recidivism, but results erode overtime without transitional care and aftercare. The programs in Delaware aretreating offenders with very serious criminal histories, and any reductionsin recidivism are significant. In addition, improvements to institutionalmanagement provided by TCs may also provide collateral benefits such asreductions in violence, reduced disciplinary incidents and improved insti-tutional control.
❒❒❒❒❒ The effects of institutional treatment are enhanced if followed by transi-tional care in the community.
❒❒❒❒❒ Greentree graduates do about as well as Key graduates. Graduates of bothprograms are likely to do better if they receive transitional and aftercareservices.
❒❒❒❒❒ The Crest program is significantly effective at further reducing recidivismfor Key graduates, as well as for offenders who enter the program directlyfollowing incarceration or who enter as direct Level IV sentences.
❒❒❒❒❒ The impact of aftercare was not examined in this study, but should haveadditional benefits according to national research.
❒❒❒❒❒ We need to more closely examine how offenders move through the correc-tional treatment continuum.
❒❒❒❒❒ Surveillance and supervision of offenders in treatment programs, and fol-lowing treatment completion, is high. The system is intervening when sub-stance abuse or behavioral slips occur by violating probation and seekingcourt action. This activity promotes public safety in a much larger measurethan was occurring pre-SENTAC, and reflects the process of supervisionrather than the product of supervision.
Other benefitsassociated
with Key/Crestprogramming
includereductions indisciplinary
actions,reductions insecurity andcorrectional
counselorstaffing, and
loweredmaintenance
costs ...

Sentencing Trends and Correctional Treatment in Delaware
58
SENTAC
Correctional Treatment in Delaware
In terms of quality, all programs observed would likely meet the American Correc-tional Associations standards for TCs, including the Greentree program. However,there are some factors that reduce the programs’ likelihood of achieving optimalresults. Among them:
❒❒❒❒❒ The Greentree program is somewhat isolated and graduates do not haveroutine access to transitional or aftercare services;
❒❒❒❒❒ In 1999, the quality of the Key and Crest programs, like other programsacross the country, had been affected due to rapid expansion; staff turn-over; limited staff TC competency and training; and an increased focus ontraditional substance abuse treatment approaches and related record-keeping requirements. Requiring these programs to meet traditional treat-ment licensing standards, absent other TC-oriented qualitative standardsand criteria, may contribute to less than optimal results.
❒❒❒❒❒ Program placement is primarily driven by length of time on sentences andslot availability instead of careful assessment of clinical need. The systemdoes not support the utilization of the continuum of treatment services tothe fullest extent possible.
❒❒❒❒❒ Communication and information management and exchange capabilitieshave not kept pace with the rapid expansion of the treatment system, andare not sufficient to accommodate the many ways offenders enter and par-ticipate in correctional treatment.
Delaware’s system of correctional treatment services is in an early stage of develop-ment, and especially given the recent expansion of services, program outcomes arehopeful. In addition, a number of things can be done to improve the management ofthis system and ultimately promote positive outcomes. Significant changes to thesystem at this time would be premature, and could have very negative consequencesin terms of offender population control and management.

Sentencing Trends and Correctional Treatment in Delaware
59
SENTAC
Recommendations
RECOMMENDATIONSThis report is intended to explain, describe, and clarify the current state of sentenc-ing practices, population trends, and correctional treatment in Delaware. The systemhas changed considerably since the inception of SENTAC. The system has evolved inboth quantitative and qualitative ways, and in ways that were predicted as well as inways that are surprising. It is clear that SENTAC has had an effect in controlling andmanaging the offender population in Delaware, and that policies, principles and goalspromulgated by SENTAC are being met in large measure. However, there are severalimportant activities that, if undertaken, would improve the management of the system.
1. Continue to examine the issues related to violations of probation (VOPs).The planned movement of offenders flowing up and flowing down the sys-tem, combined with unplanned movement that results from VOPs, isstressing the system. Better monitoring of this movement is needed toidentify how resources should be shifted or added to the system to preventeventual system problems or collapse. A scheduled follow-up study bySENTAC will provide more information regarding the VOP population.
2. Continue to support more comprehensive ways to capture and describewhat is really going on with the Level IV and V populations—those popula-tions that are included in routine DOC “institutional count” reports. It isimportant to clarify which populations are changing and it is inadequate tosimply describe this population in terms of overall numbers.
3. Expand the work release capacity in Level IV. During 1999, 371 Level IVoffenders were waiting for placement in Level V. Since then, the number ofpeople waiting has decreased to 95, but Level IV trends have importantimplications regarding new construction. In addition, although treatmentslots have increased in Level IV, overall expansion of work release andother Level IV options has not kept pace. In fact, regular “non-treatment”work release has diminished in capacity. This is an especially acute prob-lem in New Castle County where work release beds have significantly de-clined and where the largest percentage of offenders will likely reentersociety. All offenders need transitional support when they are facing thecritical time—the crisis—of reentering the community.
4. Encourage improvements in the correctional treatment continuum. TheKey/Crest continuum would benefit by adopting the American Correc-tional Association’s Standards for Therapeutic Communities, and all insti-tutional TC graduates could benefit from transitional care and aftercare.

Sentencing Trends and Correctional Treatment in Delaware
60
SENTAC
Recommendations
5. Support a process to re-examine the ways that offenders are placed in treat-ment services. The goal of this process should be to identify priority popu-lations, improve methods of movement through the continuum, and sup-port the full utilization of the continuum when possible. This process, ledby SENTAC, should include a series of seminars or discussions with justiceand treatment professionals with the assistance of outside facilitators and/or experts.
6. Restrictions on placing Key graduates into Crest programs at the end oftheir Level V sentences should be removed. SENTAC believes Keycompleters should be placed in supervised transitional services rather thanreleased directly to the streets. Identification of legal, regulatory, or policybarriers that prevent full use of the continuum should be examined andchanges should be made where feasible.
7. Provide SENTAC with the resources to monitor and examine its impact onan ongoing basis, report on the status of offender management regularly,and conduct education and training to translate findings, policies and pro-cedures throughout the system. Given the magnitude of the changes thathave taken place, we cannot afford to wait another five or six years to ex-amine the system. Continue to support the improvement of Delaware’sdata systems, and support regular comprehensive evaluations of offendermanagement programs and policies.

Sentencing Trends and Correctional Treatment in Delaware
61
SENTAC
References
REFERENCES1. Bureau of Justice Statistics (1998). Special
Report: Substance Abuse and Treatment ofAdults on Probation, 1995. Washington, DC:U.S. Department of Justice.
2. Bureau of Justice Statistics (1999). SpecialReport: Substance Abuse and Treatment, Stateand Federal Prisoners, 1997. Washington, DC:U.S. Department of Justice.
3. Center for Substance Abuse Treatment. Con-tinuity of Offender Treatment for Substance UseDisorders From Institution to Community.Treatment Improvement Protocol (TIP) Se-ries, Number 30. Washington, DC: U.S. Gov-ernment Printing Office, 1998.
4. De Leon, George. Therapeutic communitiesfor addictions: a theoretical framework. TheInternational Journal of the Addictions, 30(12),pp. 1603-1645, 1993.
5. De Leon, G. 2000. The Therapeutic Commu-nity: Theory, Model and Method. SpringerPublishing Co.
6. Deitch, David; Koutsenok, M.; McGrath, P.;Ratelle, John; and Carleton, R. 1998. OutcomeFindings Regarding In-custody Adverse Behav-ior Between Therapeutic Community Treatmentand Non-treatment Populations and its Impacton Custody Personnel Quality of Life. San Di-ego, CA: University of California–San Diego,Department of Psychiatry, Addiction Technol-ogy Transfer Center.
7. Wexler, H.K.; Falkin, G.P.; and Lipton, D.S.1988. A model prison rehabilitation program:An evaluation of the Stay’n Out therapeuticcommunity. Final report to the National Insti-tute on Drug Abuse.
8. Del. Code Ann. tit. 11, § 4204(m)(2001).
9. Del. Code Ann. tit. 11, § 6712(a)-(b)(2001).
10. Del. Code Ann. tit. 11, § 4203(I)(2001).
11. DelSAC 2001. Delaware’s Adult Boot Camp.
12. DelSAC 1989. Impact of Truth in Sentencing onPrison and Jail Populations.
13. DelSAC 2002. 1997-1999 Delaware Depart-ment of Correction Incarceration Fact Book.
14. DelSAC March 28, 2001. Letter to Representa-tive John Van Sant.
15. DelSAC September 1997. Recidivism in Dela-ware 1981-1994, Phase 2. Unpublished Report.
16. Harrison, Lana D. and Steven S. Martin.October 2002. Residential Substance AbuseTreatment (RSAT) for State Prisoners FormulaGrant: Compendium of Program Implementa-tion and Accomplishments. University of Dela-ware Center for Drug and Alcohol Studies.
17. Knight, Kevin; Simpson, D. Dwayne, and Hiller,Matthew L. 1999. “Three year reincarcerationoutcomes for in-prison therapeutic commu-nity treatment in Texas.” The Prison Journal,79(3), 337-351.
18. Leukefeld, C.G., and Tims, F.M., eds. Compul-sory Treatment of Drug Abuse: Research andClinical Practice. National Institute on DrugAbuse Research Monograph, Number 86.Rockville, MD: National Institute on DrugAbuse, 1988.
19. Martin, Steven S.; Butzin, Clifford A.; Saum,Christine A. and Inciardi, James A. 1999.“Three year outcomes of therapeutic commu-nity treatment for drug-involved offenders inDelaware: from prison to work release toaftercare.” The Prison Journal, 79(23), 294-320.
20. Martin et. al, 1999. Three-year outcomes oftherapeutic community treatment for drug-involved offenders in Delaware: from prisonto work release to aftercare. The Prison Journal,Volume 79, No. 3, September, 1999, pp. 294-320.
21. National Institute of Justice (1999). 1998Annual Report on Drug Use Among Adult andJuvenile Arrestees. Washington, DC: U.S. De-partment of Justice.
22. Principles of Drug Addiction Treatment: AResearch-Based Guide. National Institute onDrug Abuse, 1999. NIH Publication No. 99-4180.
23. Rockholz, P.B. 2000. Findings of a NationalSurvey on Therapeutic Communities forSubstance Abusing Offenders in State Pris-ons. Middletown, CT: Association of StateCorrectional Administrators Newsletter.
24. SENTAC Treatment Access Committee(March, 1994). A Coordinated Approach toManaging the Drug Involved Offender.
25. Travis. J. (1999). Remarks to the NationalAssembly on Drugs, Alcohol Abuse and theCriminal Offender. Washington, DC. Decem-ber 7.
26. Wexler, Harry K.; Melnick, Gerald; Lowe,Louis and Peter, Jean. 1999. “Three yearreincarceration outcomes for Amity in-prisontherapeutic community and aftercare in Cali-fornia.” The Prison Journal, 79(3) 32 1-336.

This page is intentionally left blank.

Sentencing Trends and Correctional Treatment in Delaware
63Appendix A – Research Plan
AP
PEN
DIX
A: R
ESEA
RC
H P
LAN
Nam
e of
stud
yQu
esti
ons t
o be
ans
wer
edDa
ta S
ourc
esNe
eds
Tim
etab
les
A. P
rogr
am S
tudy
Wha
t are
the c
ompa
rativ
e rec
idiv
ism ra
tes
1997
SAC
sent
encin
g or
der
Data
colle
ctor
s or D
OCGr
adua
te li
sts f
or 1
997-
1998
for
Prod
uct:
Data
base
, rep
ort c
ompa
ring
recid
ivism
rate
s bet
wee
nam
ong
Gree
ntre
e, Cr
est a
nd K
ey?
data
base
; DOC
dat
abas
e; DO
Cst
aff t
o be
clos
ely s
uper
-3
prog
ram
s; sa
mpl
e. Ne
ed to
parti
cipan
ts in
Gre
entre
e, Ke
y, an
d Cr
est p
rogr
ams.
case
file
s; Gr
eent
ree p
rogr
amvi
sed
by SA
C st
aff;
to th
ekn
ow m
ore i
nfor
mat
ion
toBu
dget
: $64
,000
files
; SBI
arre
st d
atab
ase
degr
ee th
at cu
rrent
SAC
estim
ate
the
task
.DT
Fst
affin
g do
es n
ot al
low,
may
nee
d to
use
SAC
OTDu
e by 1
2/ 3
0. Hi
gh p
riorit
y.
B. P
roce
ss S
tudy
of D
rug/
Wor
k Re
leas
e Pr
ogra
ms
Wha
t are
the r
esid
entia
l tre
atm
ent p
rac-
DOC
case
file
s (pr
isons
and
Cont
ract
supe
rvise
d by
SAC
1Q99
ord
ers w
/resid
entia
l dru
gPr
oduc
t: Ne
w sn
apsh
ot d
atab
ase,
repo
rt in
dica
ting
time s
pent
tices
? Do
peop
le a
ctua
lly g
et in
to th
eP/
P); 1
st Q
SAC
1999
sent
en-
staf
f/DOC
staf
f; SA
C st
aff
treat
men
t, th
en cl
assif
ied
byw
aitin
g fo
r tre
atm
ent a
nd th
e ef
fect
iven
ess o
f rea
chin
g tre
atm
ent
prog
ram
s tha
t are
ord
ered
? How
long
do
cing
orde
rs; t
he SA
C dr
aft
OT o
r add
ition
al st
aff
add.
v. no
n-ad
dict
ion.
Pilo
t 50;
and
othe
r pro
gram
sth
ey w
ait?
How
man
y nev
er g
et th
ere?
addi
ctio
n se
nten
cing
stud
yfo
llow.
Dra
ft re
port
May
30,
Budg
et: $
40,0
00 fo
r tra
vel, d
ata c
olle
ctio
n; $
20,0
00 fo
r ana
lysis
Wha
t is t
he e
ffect
of a
ddict
ion
sent
ence
s?20
02.
Cont
ract
$3,
000
in O
THo
w d
oes t
hat a
ffect
sent
encin
g pr
actic
es?
DTF
C. D
eten
tion
er S
tudy
Who
is b
eing
hel
d (b
reak
out
by g
ende
r and
DOC
Fact
Book
dat
a fro
m 1
980
Curre
nt st
aff w
ork f
or w
hoPh
ase 1
wou
ld ta
ke 8
wee
ks,
Prod
uct:
Data
base
and
repo
rt as
to w
ho is
bei
ng h
eld
for w
hat
race
)? W
hat a
re th
ey b
eing
hel
d fo
r (w
hat
to 1
999;
DOC
case
file
s; JIC
file
s;is
bein
g he
ld, h
ow lo
ng &
usin
g cu
rrent
info
rmat
ion,
(end
(Pha
se 1
). Ph
ase 2
: Rep
ort a
ddre
ssin
g th
e pro
cess
of d
eten
tion;
dat
a-st
age o
f the
pro
cess
)? H
ow lo
ng? W
hat a
reFa
mily
Cour
t and
CCP
Cour
tre
cid ra
tes.
We c
anno
t tel
lof
Dec
.). P
hase
2 (f
or fu
ture
base
mod
ifica
tion
to b
ette
r cla
rify p
urpo
ses o
f det
entio
n (d
eter
min
eth
e offe
nses
? Are
per
sons
hel
d ap
pro-
pape
r file
s; JP
Cour
t com
pute
rne
xt p
roce
ss st
ep, n
orco
nsid
erat
ion)
wou
ld in
clude
who
hel
d fo
r wha
t and
for h
ow lo
ng),
cost
ben
efit
on a
basis
of u
se o
fpr
iate
ly aw
aitin
g tri
al o
r oth
er ev
ents
? Are
files
wha
t wen
t int
o th
eno
n-co
urt h
olds
, ins/
outs
, bai
ls,de
tent
ion
for e
cono
mic
purp
oses
; rep
etiti
ve en
try a
nd re
-ent
ry o
fth
ere a
ny in
cons
isten
cies a
nd co
st sa
ving
sde
cisio
n to
hol
d th
em, n
oran
d fin
ancia
l hol
ds, w
ould
take
sam
e ind
ivid
uals;
bai
l am
ount
s and
corre
latio
n w
ith ab
ove f
acto
rs.
acco
rdin
g to
how
bai
l is s
et? W
hat i
s the
whe
ther
they
show
ed u
p6
mon
ths (
follo
win
g th
e end
of
Budg
et fo
r Pha
se 1:
$250
0ra
te fo
r fai
lure
for t
hose
with
new
conv
ic-fo
r tria
l. Etio
logy
of s
tatu
sot
her r
esea
rch)
and
wou
ld co
stPh
ase 2
Bud
get:
$20-
25,0
00tio
ns w
hile
out
on
bail?
How
man
yas
det
entio
ner i
s stil
l2
staf
f per
sons
wor
king
on
itca
tego
ries o
f det
entio
ners
are
ther
e?un
know
n.pa
rt-tim
e.
D. O
ffen
ses a
nd O
ffen
der C
hart
sFo
r wha
t offe
nses
are o
ffend
ers i
n pr
isons
?19
81-1
996,
and1
997-
1999
DOC
Curre
nt SA
C st
aff w
ithTh
is w
ould
logi
cally
be d
one
Prod
uct:
char
ts, d
atab
ase,
repo
rt o
n tre
nds
(Bre
ak o
ut ac
cord
ing
to g
ende
r and
race
)Fa
ctBo
ok d
atab
ase;
1999
SAC
poss
ible
OT t
o ex
pedi
te.
first,
and
wou
ld ta
ke 6
0 da
ys to
Budg
et: $
2500
How
long
are t
hey i
n th
e pris
ons?
Are
we
Sent
encin
g or
der d
atab
ase
do. (
April
/May
) Upd
ate d
ata-
com
plyi
ng w
ith th
e SEN
TAC
guid
elin
es?
base
as d
ata i
s ava
ilabl
e.
E. C
rimin
al L
aw S
tudy
Wha
t are
all o
f the
law
s whi
ch h
ave
Dela
war
e Cod
e and
stat
utor
yAG
reso
urce
s for
Title
s 11,
All s
tatu
tes i
dent
ified
by 6/
30/0
1.Pr
oduc
ts: In
dex o
f all
crim
inal
stat
utes
, rep
ort d
etai
ling
cons
isten
cies
crim
inal
pen
altie
s and
wha
t are
thos
ehi
stor
y; Re
leas
e Da
te Ta
sk16
and
21. S
uper
ior C
ourt
In Ju
ly SE
NTAC
mee
ting,
disc
uss
and
inco
nsist
encie
s (TI
S v. n
on-T
IS) i
n st
atut
ory p
enal
ties,
reco
mm
en-
pena
lties
and
do th
ey m
ake s
ense
or
Forc
e Fin
al R
epor
tla
w cl
erks
for t
he re
st o
fpo
licy i
mpl
icatio
ns. B
y 9/0
1,da
tions
for s
tatu
tory
chan
ge. T
he su
bsta
ntia
l pol
icy is
sues
will
be
do th
ey n
eed
to b
e rev
ised?
DE Co
de.
reco
mm
end
stat
utor
y am
end-
addr
esse
d af
ter t
he st
atist
ical a
naly
sis.
men
ts o
n co
nsist
ency
, coh
esiv
e-Bu
dget
: $2,
000
for p
ublic
atio
nne
ss o
f sta
tute
s. M
ajor
pol
icy re
com
men
datio
ns b
ased
on
stat
istica
llstu
dy w
ill fo
llow
late
r.

Sentencing Trends and Correctional Treatment in Delaware
64 Appendix A – Research Plan
Res
earc
h P
lan
(co
nti
nu
ed)
Nam
e of
stud
yQu
esti
ons t
o be
ans
wer
edDa
ta S
ourc
esNe
eds
Tim
etab
les
F. Le
vel 4
/Hol
d at
Lev
el 5
Stu
dyW
here
are t
he b
ottle
neck
s whi
ch im
pede
1997
-199
9 DO
C re
v. Fa
ctBo
okSA
C st
aff O
T19
99 o
rder
s plu
s DOC
adm
it fil
esPr
oduc
t: da
taba
se an
d re
port
det
ailin
g th
e pro
cess
for d
efen
dant
sm
ovem
ent i
n th
e sy
stem
? Are
the
sent
ence
sda
taba
se;1
999
SAC
sent
encin
gw
ill te
ll th
ose h
eld
at Le
vel 5
for
held
in p
rison
for L
evel
IV p
rogr
ams,
adm
inist
rativ
e flo
w d
owns
,ef
fect
ivel
y bei
ng ca
rried
out
? Are
ther
e an
yor
der d
atab
ase;
Prob
atio
na
slot a
t 4, a
nd w
ill te
ll Le
vel 5
reco
mm
enda
tion
for p
roce
ss ch
ange
, res
ourc
e enh
ance
men
t tha
t can
prob
lem
s with
reso
urce
s? W
hat i
s the
tim
ead
mit
files
serv
ed, t
hen
held
at 5
awai
ting
redu
ce co
sts a
nd e
nhan
ce e
ffect
iven
ess.
serv
ed at
Leve
l 5 b
efor
e re
leas
e? W
hat a
reth
e 4
slot,
as w
ell a
s typ
e of
Budg
et: $
2500
the
type
s of r
elea
se fo
llow
ing
a Lev
el 5
rele
ase.
This
coul
d be
don
e in
6ho
ld?
wee
ks (e
nd o
f Jul
y).
G. V
OP S
tudy
Wha
t are
VOP
offe
nder
s inc
arce
rate
d fo
r?19
98 Sp
ecia
l SAC
VOP
dat
abas
eSA
C st
aff O
TTh
is co
uld
be st
arte
d in
Aug
ust,
Prod
uct:
Upda
ted
data
base
, and
a re
port
disc
ussin
g th
e pro
batio
nHo
w lo
ng ar
e the
y bei
ng in
carc
erat
ed fo
r?(Q
: Did
the o
rigin
al st
udy l
ook
and
finish
ed en
d of
Sep
tem
ber.
syst
em g
ivin
g re
com
men
datio
ns as
to ap
prop
riate
use
of s
anct
ions
,Ar
e we e
ffect
ivel
y put
ting
the r
ight
peo
ple
at th
e und
erly
ing
crim
e?)
reco
mm
enda
tion
for p
roce
ss ch
ange
, res
ourc
e en
hanc
emen
t tha
t can
on p
roba
tion/
revo
king
pro
batio
n? W
hat a
rere
duce
cost
s and
enh
ance
effe
ctiv
enes
s.th
e prio
r crim
inal
hist
orie
s on
thes
e fol
ks?
Budg
et: $
2500
H. R
ule
11(e
)(1)c
Stu
dyHo
w d
oes R
ule 1
1 im
pact
upo
n se
nten
cing
SAC
Supe
rior C
ourt
Sent
encin
gPe
rcen
tage
s can
be r
unPh
ase 1
is ru
nnin
g th
e per
cen-
Prod
uct:
Upda
ted
data
base
; Rep
ort i
ndica
ting
the i
mpa
ct o
fde
cisio
ns an
d gu
idel
ines
? Wha
t is t
heor
ders
; ben
chbo
ok gu
idel
ines
;fro
m 1
999
sent
encin
gta
ges;
done
by e
nd o
f Jun
e with
Rule
11
(e)(1
)c o
n se
nten
cing
prac
tices
and
sent
encin
g gu
idel
ines
perv
asiv
enes
s of R
ule 1
1 pl
eas?
Is th
ere
SACB
urgl
ary s
tudy
orde
rs w
ith cu
rrent
curre
nt re
sour
ces.
Phas
e 2 is
Phas
e III
Prod
uct:
In co
njun
ctio
n w
ith m
anda
tory
Pha
se ll
l stu
dyeq
uity
in th
e fin
al se
nten
ces?
How
doe
sfu
ndin
g to
expl
ore
whe
ther
the
guid
elin
es a
rere
port
wou
ld sh
ow im
pact
of p
roce
dura
l rul
e use
d in
conj
unct
ion
Rule
11
and
man
dato
ry d
rug
sent
ence
seq
uity
of R
11 v.
Non
-R11
bein
g fo
llow
ed: d
one b
y end
of
with
man
dato
ry se
nten
ces a
nd it
s im
pact
upo
n se
nten
cing
decis
ions
.im
pact
upo
n se
nten
cing
decis
ions
?w
ould
requ
ire ex
traSe
ptem
ber w
ith cu
rrent
Look
ing
at si
mila
r offe
nder
s are
thos
e tak
ing
Rule
11
(e)(1
)c p
leas
reso
urce
s.re
sour
ces.
Phas
e 3 is
expl
orin
gtre
ated
the s
ame a
s tho
se en
terin
g tra
ditio
nal p
leas
.th
e equ
ity; w
ould
take
mor
eBu
dget
: $25
00 fo
r Pha
ses 1
, 2.
reso
urce
s and
coul
d be
don
e by
Budg
et fo
r Pha
se 3
: (w
ait)
Dece
mbe
r 200
2.
I. M
anda
torie
s Stu
dyW
hat a
re th
e exi
stin
g m
anda
tory
stat
utes
:De
law
are C
ode;
SAC
Supe
rior
Desc
riptiv
e st
ats r
e:Ph
ase 1
wou
ld in
clude
des
crip
-Pr
oduc
t: De
scrip
tion
of al
l man
dato
ry se
nten
cing
law
s, a d
atab
ase a
sdr
ugs,
wea
pons
, hab
itual
, etc
.? Ho
w d
oes
Cour
t sen
tenc
ing
orde
rm
anda
torie
s usin
g 19
99tiv
e st
atem
ent o
f man
dato
ryto
sent
ence
d in
mat
es o
n m
anda
tory
sent
ence
s for
Pha
ses 1
and
2.
this
impa
ct u
pon
popu
latio
n? H
ow d
oes
data
base
; DOC
Fact
Book
data
base
can
be d
one w
ithse
nten
cing
law
s, us
ing
wor
kPh
ase 3
: A re
port
show
ing
the i
mpa
ct o
f man
dato
ry se
nten
ces a
ndim
pact
on
plea
s? H
ow d
oes i
t im
pact
on
data
base
; JIC
file
s; RD
BB Ta
skcu
rrent
fund
s. Ne
edal
read
y don
e; th
is co
uld
be d
one
Rule
11
on p
lea a
nd se
nten
ce p
ract
ice an
d its
impl
icatio
ns o
n pr
ison
sent
encin
g de
cisio
ns?
Who
serv
es ti
me o
nFo
rce F
inal
Rep
ort;
2001
addi
tiona
l res
ourc
es to
by en
d of
June
200
1. Ph
ase 2
popu
latio
n.of
ple
as to
oth
er ch
arge
s whe
reHo
use M
anda
tory
Dru
gqu
antif
y prim
ary a
ndw
ould
be s
tats
(adm
, leng
th)
Budg
et fo
r Pha
se 1
: No
cost
(see
#6)
man
dato
ries w
ere i
nvol
ved?
Sent
encin
g St
udy
seco
ndar
y bed
impa
ct.
usin
g th
e 199
9 da
ta; d
one b
y end
Phas
e 2: $
2500
Dec.
2001
with
OT.
Phas
e 3 w
ould
Phas
e 3: c
ost p
ostp
oned
unt
il 20
02in
dica
te p
rimar
y and
seco
ndar
ybe
d im
pact
(and
cont
rolle
d fo
rRu
le 1
1) in
200
2.

Sentencing Trends and Correctional Treatment in Delaware
65
SENTAC
Notes
NOTES

Sentencing Trends and Correctional Treatment in Delaware
66
SENTAC
Notes
NOTES