sentiment analysis of social networking data using
TRANSCRIPT

Sentiment Analysis of Social Networking Data Using Categorized
Dictionary
Akansha Singh
*Corresponding Author, Associate Prof., Department of CSE, ASET, Amity University Uttar Pradesh,
Noida. E-mail: [email protected]
Aastha Sharma
The North Cap University, Gurgaon, India. E-mail: [email protected]
Krishna Kant Singh
Associate Prof., Department of ECE, KIET Group of Institutions, Ghaziabad, India. E-mail:
Anuradha Dhull
Assistant Prof., The North Cap University, Gurgaon, India. E-mail: [email protected]
Abstract
Sentiment analysis is the process of analyzing a person’s perception or belief about a particular subject
matter. However, finding correct opinion or interest from multi-facet sentiment data is a tedious task.
In this paper, a method to improve the sentiment accuracy by utilizing the concept of categorized
dictionary for sentiment classification and analysis is proposed. A categorized dictionary is developed
for the sentiment classification and further calculation of sentiment accuracy. The concept of
categorized dictionary involves the creation of dictionaries for different categories making the
comparisons specific. The categorized dictionary includes words defining the positive and negative
sentiments related to the particular category. It is used by the mapper reducer algorithm for the
classification of sentiments. The data is collected from social networking site and is pre-processed.
Since the amount of data is enormous therefore a reliable open-source framework Hadoop is used for
the implementation. Hadoop hosts various software utilities to inspect and process any type of big
data. The comparative analysis presented in this paper proves the worthiness of the proposed method.
Keywords: Hadoop, Big data, HDFS, Map-Reduce, Facepager, Sentiment Analysis.
DOI: 10.22059/jitm.2020.297562.2465 © University of Tehran, Faculty of Management

Sentiment Analysis of Social Networking Data Using Categorized Dictionary 106
Introduction
Big Data can be described as an extremely large database that can be analyzed to discover
patterns, trends, and associations. The analysis of big data requires high computation power as
it cannot be handled by the traditional database management applications. Clearly, when
considering the question “What is big data?” the first characteristic that comes to mind is size.
However, recently there are other characteristics of big data that have emerged. There are
many definitions of big data that have emerged. For example, Gartner has defined big data in
similar terms as “Big data is information that is high-volume, high-velocity and high-variety
assets that demand cost-effective, innovative forms of information processing for decision
making and enhanced insight ” (Gandomi & Haider, 2015). This large data have underlying
patterns and trends. If these patterns and trends are discovered effectively they can be used in
many applications for predictions and classifications. Thus, effective management of this data
is required. Big data management refers to the process of filtering, analyzing and reporting
facts from raw data by correlating and filtering it. The main goal is to ensure the best level of
quality and accessibility of data for the purpose of business intelligence and data analytics.
All huge organizations employ methods that help them to understand the growing pools for
business decisions and improvements. Big data management helps the companies to
understand the valuable information in big sets of data that is not structured as well as semi-
structured data from all the variety of sources (Chawda & Thakur, 2016). Previously when
data was generated at a steady rate, the main aim was to increase the processing power of the
system. Different scheduling algorithms were used to increase the computational power of the
systems. Then a distributed system came up in which a single job runs on multiple machines.
Hadoop was one such invention, which has the capability to store and process huge amounts
of data. HDFS (Hadoop Distributed File System) is the distributed file system used for
efficient storage of data inside Hadoop. One of the key components inside the Hadoop
framework is Map-Reduce which is used to analyze big datasets. Traditional databases such
as relational databases can handle only a few gigabytes of data where Hadoop can handle
terabytes or petabytes of data. Also, the relational databases work on structured data only, in
which there is a static schema (Kumar, 2015). Sentiment analysis greatly helps us in knowing
the customer behavior. The biggest challenge is to process the social data which exists in
unstructured or semi-structured form. The present technologies are inefficient to process such
big data in the desired way. Map Reduce is suitable for data which is unstructured data such
as text file as well as for the semi-structured data (Patidar & Sharma, 2015). The sentiment is
defined as an expression of opinion by a person about any object or any aspect. Sentiment
analysis refers to analyzing, investigating, extracting user’s opinions, sentiment and
preferences from the subjective text. Almost all human activities are opinions that are key
influencers of human behaviours (Ortigosa et al., 2014). We often seek out the opinions of
others when we need to make a decision. This is not only true for organizations but also true

Journal of Information Technology Management, 2020, Vol.12, No.4 107
for individuals. Opinions and its related concepts such as sentiments, evaluations, attitudes,
and emotions are the subjects of the study of sentiment analysis and opinion mining
(Dasgupta et al., 2015). In this paper, social networking sites data is collected to perform
sentiment analysis. The proposed work develops a categorized dictionary for different
categories of entities. The development of a categorized dictionary increases the efficiency of
sentiment classification. The search space is reduced due to the division of the dictionary into
subparts. Further, this categorized dictionary is used for sentiment analysis and classification
for different objects.
Literature Review
A lot of research has been done in the area of Sentiment Analysis. The sentiment analysis of
users considering their reviews and feedback on different subjects are used as a source to
analyze their sentiments. Most of the research has been done in the area of big data processing
(Gandomi & Haider, 2015), where the key dimension of discussion is the dimensionality of
big data. The other dimensions of big data such as velocity, variety, veracity, variability, and
value are of equal importance. The primary focus is placed on analytics in order to get valid
and valuable insights from big data. The authors have highlighted the point that predictive
analytics which deals mostly with structured data overshadows the other forms of analytics
that are applied to unstructured data. In this section, the analytics techniques for text, audio,
video, social media data, and predictive analytics have been reviewed. The 5 V’s have been
introduced in big data (Chawda & Thakur, 2016). The basic requirement of analyzing big data
is to find meaning and discover the unseen relationships in big data. The 5 key approaches
which big data tools analyze have been discussed which includes discovery tools, BI
(Business Intelligence) tools, In-Database Analytics, Hadoop (High-availability distributed
object-oriented platform) and Decision Management. All the tools and frameworks provided
by various organization and their comparison table is presented. The best tool so far is
Infosphere. The future work included is to develop their own Hadoop system and comparing
with Apache Spark, Storm and Map Reduce with performance analysis using K-Means. The
concept of big data along with 3 V’s which include Volume, Velocity, and Variety of big data
(Kumar, 2015). The problems faced in processing big data are also addressed. These
challenges have been addressed so that there can be fast and efficient processing of big data.
The challenges include lack of structure, error handling, privacy, provenance, visualization,
timeliness, and heterogeneity at all the stages from data acquisition to result in interpretation.
The analysis tools and techniques for the analysis of big data and components of Hadoop are
presented (Patidar & Sharma, 2015). One of the best tools for analysis of big data is Hadoop
due to its scattered architecture. Hadoop has proved to be scalable, reliable, fault-tolerant and
used to be commodity hardware. In comparison to traditional RDBMS, it is more powerful as
it can use functional programming, key-value pairs and is able to support offline batch

Sentiment Analysis of Social Networking Data Using Categorized Dictionary 108
processing. Numerous machine-learning algorithm has been developed by the researchers for
analyzing the movie reviews and getting the rating based on the reviews analysed (Gupta et
al., 2016). For processing the review dataset Hadoop has been utilized used. In this paper the
rating based mechanism is proposed in which the real dataset is collected from twitter and
based on the positive and negative rating given by the reviewers, normal and abnormal posts
are distinguished. The results findings show that the proposed approach detects the abnormal
posts successfully in a large manner as compared to the existing techniques. In this research
article, a new method has been proposed for sentiment analysis which includes extraction of
information about the user’s sentiment polarity (positive, negative or neutral). The messages
written and transmitted by a user are used for identifying the polarity of the sentiments for
emotional changes (Ortigosa et al., 2014).
The method is implemented in SentBuk, which is a Facebook application. SentBuk
classifies the messages written by users on Facebook according to their polarity, showing the
results to the users through an interactive interface. It also supports the detection of emotional
change, emotion finding of a friend, classification dependency on how the users interact with
messages and their statistics among each other. A hybrid approach is presented in this paper
followed by the classification method implemented in SentBuk which includes the
combination of the techniques which are based on machine learning and lexical analysis. An
illustration is done for sentiment analysis from Facebook data using open source technologies
(Dasgupta et al., 2015). A significant advancement in the in-memory computation capabilities
can be obtained in the open-source world through Spark with Resilient Distributed Datasets
(RDD). The combination of Spark RDD and Hadoop provides significant computational
capabilities with low price commodity hardware in a fault-tolerant cluster setup. This
platform provides an information analytics layer on top of Hadoop that embraces the
MapReduce paradigm and the resilience of Spark RDD’s through R along with advanced
statistical analysis layer with design-time and run-time optimizations of the open-source
stack. Although this paper provides a new approach that mines sentiment information which
is unstructured. Refinement in this approach can be made through the iterative process of
cleaning /pre-processing, which would ultimately eliminate the data source from outliers and
noise.
The method is proposed by Gupta et al. (2015) which the opinions of the people have
been assigned a positive or negative score. For storing the data, HDFS (Hadoop Distributed
file system) is used for performing the sentiment analysis in the MapReduce component of
Hadoop. A computational framework is proposed by Selvan & Moh (2015) for opinion
mining providing fast feedback. The input to the framework given is a real-time Twitter data
stream to filter and analyze the obtained data in order to provide quick feedback through
sentiment analysis. Data accuracy is very important for sentiment analysis and the Apache
Hadoop framework provides an accurate result of 84% when there is abundant data produced

Journal of Information Technology Management, 2020, Vol.12, No.4 109
from social media. The services provided exist on the Cloudera version of Hadoop. A demerit
of this paper was not giving accurate results for the sentiment dictionary used for text.
However, possibly efficient answers were given by the words which were divided into nine
categories. Tayal & Yadav (2016) have proposed an approach for faster retrieval of sentiment
analysis wherein to store and process the large set of data Hadoop has been used. When
Hadoop is implemented with bloom filter the results of sentiment analysis can be retrieved at
a faster rate and also in an accurate manner. Bloom filter is a data structure that supports add,
find and sometimes delete operation if the element is in a set widely used for testing,
especially if the set is huge (Goswami et al., 2019; Alaei et al., 2019). Some other researchers
have also performed sentiment analysis based on these methods (Chang, 2018; Kang et al.,
2017). In this paper, a categorized dictionary approach for sentiment analysis from social
networking data is used. The categorized dictionary includes words defining the positive and
negative sentiments related to the particular category. The categorized dictionary includes
words defining the positive and negative sentiments related to the particular category.
Proposed Method
A number of people sharing their personal feelings and reviews using social media are
increasing day by day. A potential user relies on every minute opinion, reviews that are being
expressed online by various users to make decisions with respect to purchasing an item or
developing software when it comes to an organization that provides services. It is of utmost
importance to analyze these reviews, opinions or feedbacks from time to time. Ideas of people
are influenced by the opinions of other people. For the analysis of reviews given by people lot
of research has been going on. To obtain customer feedback about their products, many
companies face difficulty. The proposed method includes the extraction of data to pre-
processing of data for retrieval of a number of positive and negative words which are then
used for calculating the sentiment accuracy for providing better feedback to companies about
the feedback of their products. Fig 1 presents the general layout of the proposed approach.
Discussed below is step by step description of various steps involved in sentiment analysis:
Step 1. The user’s comments/reviews are extracted by using software Facepager in the form
of text or csv file format.
Step 2. The input file is loaded to HDFS (Hadoop Distributed File System) and processed in
the Mapper phase of Apache Hadoop.

Sentiment Analysis of Social Networking Data Using Categorized Dictionary 110
Figure 1. General Layout of the proposed method
Step 3. In Mapper function, the input file is scanned for identifying the category to which the
data belongs. This is done by comparing the words in input file consisting of posts and
comments on product of a particular brand which will also include the brand name with the
data sets of all the brand names which have their accounts on Facebook.

Journal of Information Technology Management, 2020, Vol.12, No.4 111
Step 4. From above (step 3) the brand name can be used to identify the category to which the
data belongs, which will be used by the Reducer.
Step 5. Then the input data file is preprocessed to lower case, removing punctuations, special
characters, symbols and emoticons to get the file consisting of data set of individual words.
Step 6. The result data set file obtained from above step is used as an input to the Reducer
phase.
Step 7. In Reducer function, the data set of input file obtained from Mapper is compared with
the categorized positive and negative words dictionary consisting of the words which are
specifically related to a particular category. The category is obtained from the Mapper.
Step 8. On comparison from above step the number of positive and negative words is
obtained, which can be used to calculate the sentiment accuracy.
Data Extraction
The data extraction is done for retrieving the customer’s feedback/response about a brand of
product from Facebook. For this activity, software named Facepager is used for retrieving
comments or posts from Facebook.
Introduction to Facepager
Facepager is a software that is used to extract user’s comments and reviews from Facebook.
In this work, the data for the 4 categories have been fetched using Facepager and is used for
sentiment analysis. The categories include food, automobiles, clothing, and electronics. The
brands include Star Bucks, Hyundai, Levis, and Samsung.
Preprocess Data
Once the data is retrieved for different categories in the form of text file or csv file, it is
loaded onto HDFS (Hadoop Distributed File System). Then it is pre-processed by the Mapper
and Reducer phase of Apache Hadoop to get the number of positive and negative words
which are used to calculate the sentiment accuracy.
Mapper Phase
The Mapper gets the data file consisting of comments and posts fetched from Facebook. The
first step is to analyse the category to which the data file belongs. For this a set of all the
brands names which have their Facebook accounts are taken in a data set and compared to the
data file consisting of posts or comments for a particular brand. On comparing the brand name
from input file which will be consisting of the brand name in posts of the brand will be
matched with the data set of all the brand names with Facebook accounts. This will give the

Sentiment Analysis of Social Networking Data Using Categorized Dictionary 112
match for the brand to which the input data file belongs. The brand name will then be
compared to the category to which that brand belongs. This category will be used in the
Reducer phase to compare the data set with the categorized dictionary which will be
introduced in the Reducer phase. The second step includes pre-processing the input data file
for filtering the data by converting the words to lower case, removing punctuations,
emoticons, special characters and symbols. The stop words are not removed in this method
considering the case of comparison of dictionary words with the data set retrieved from the
input file after pre-processing. So the stop words will automatically be skipped on
comparisons and will be neglected. A data file is generated by the Mapper which consists of a
set of individual words which can be positive, negative or neutral which is used by the
Reducer as an input. Fig 2 presents the mapper algorithm utilized in the proposed approach.
1: class MAPPER
2: method MAP(LongWritable key, Text value, Context context)
3: Set line ← convert ‘value’ to string
4: Set itr ← convert ‘line’ to token
5: Start while loop
6: while ‘itr’ has tokens do
7: Set token ← convert ‘itr’ to lowercase
8: if ‘token’ has first character equal to alphabet
9: Set token ← remove special characters
10: if ‘token’ is equal to list of Food category words
11: Set foodFlag ← 1
12: else if ‘token’ is equal to list of Clothing category words
13: Set clothingFlag ← 1
14: else if ‘token’ is equal to list of Electronics category words
15: Set electronicsFlag ← 1
16: else if ‘token’ is equal to list of Automobiles category words
17: Set automobilesFlag ← 1
18: Set word ← token
19: Set context ← word
20: EMIT(key, value, context)
21: End While loop
22: method getFoodFlag
23: EMIT(foodFlag)
24: method getclothingFlag
25: EMIT(clothingFlag)
26: method getelectronicsFlag
27: EMIT(electronicsFlag)
28: method getautomobilesFlag
29: EMIT(automobilesFlag)
Figure 2. Mapper algorithm for proposed method
Journal of Information Technology Management, 2020, Vol.12, No.4 113
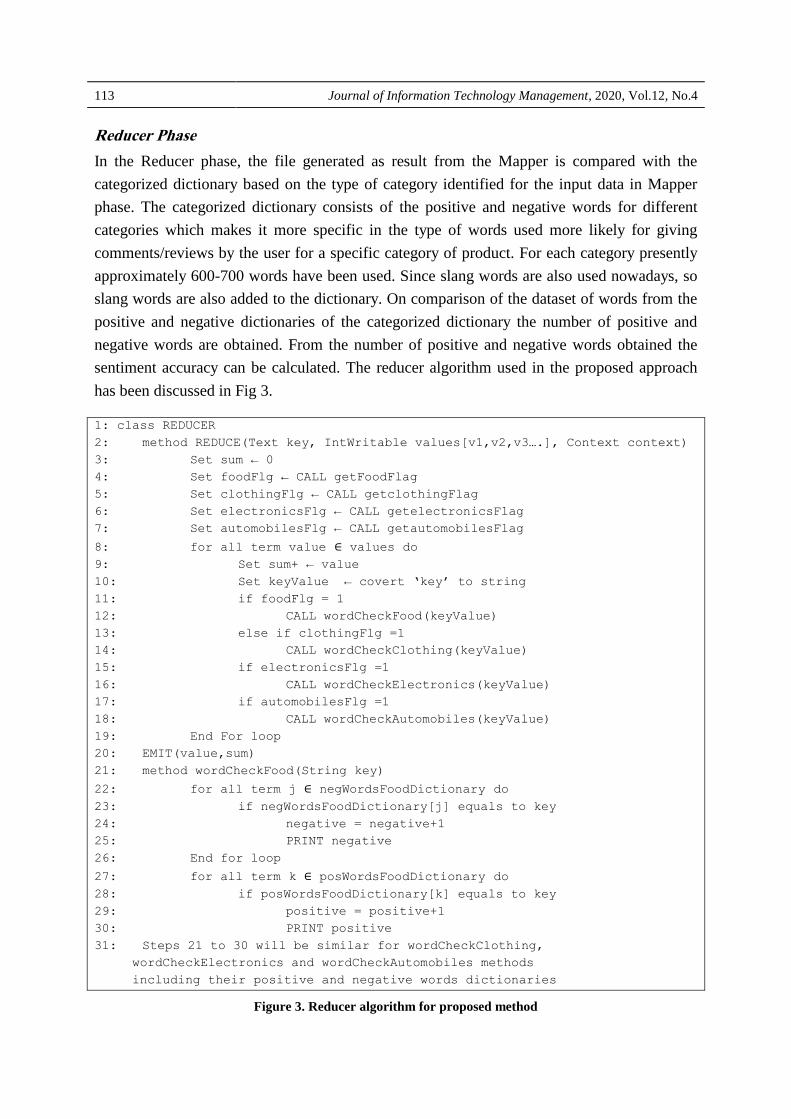
Reducer Phase
In the Reducer phase, the file generated as result from the Mapper is compared with the
categorized dictionary based on the type of category identified for the input data in Mapper
phase. The categorized dictionary consists of the positive and negative words for different
categories which makes it more specific in the type of words used more likely for giving
comments/reviews by the user for a specific category of product. For each category presently
approximately 600-700 words have been used. Since slang words are also used nowadays, so
slang words are also added to the dictionary. On comparison of the dataset of words from the
positive and negative dictionaries of the categorized dictionary the number of positive and
negative words are obtained. From the number of positive and negative words obtained the
sentiment accuracy can be calculated. The reducer algorithm used in the proposed approach
has been discussed in Fig 3.
1: class REDUCER
2: method REDUCE(Text key, IntWritable values[v1,v2,v3….], Context context)
3: Set sum ← 0
4: Set foodFlg ← CALL getFoodFlag
5: Set clothingFlg ← CALL getclothingFlag
6: Set electronicsFlg ← CALL getelectronicsFlag
7: Set automobilesFlg ← CALL getautomobilesFlag
8: for all term value ∈ values do
9: Set sum+ ← value
10: Set keyValue ← covert ‘key’ to string
11: if foodFlg = 1
12: CALL wordCheckFood(keyValue)
13: else if clothingFlg =1
14: CALL wordCheckClothing(keyValue)
15: if electronicsFlg =1
16: CALL wordCheckElectronics(keyValue)
17: if automobilesFlg =1
18: CALL wordCheckAutomobiles(keyValue)
19: End For loop
20: EMIT(value,sum)
21: method wordCheckFood(String key)
22: for all term j ∈ negWordsFoodDictionary do
23: if negWordsFoodDictionary[j] equals to key
24: negative = negative+1
25: PRINT negative
26: End for loop
27: for all term k ∈ posWordsFoodDictionary do
28: if posWordsFoodDictionary[k] equals to key
29: positive = positive+1
30: PRINT positive
31: Steps 21 to 30 will be similar for wordCheckClothing,
wordCheckElectronics and wordCheckAutomobiles methods
including their positive and negative words dictionaries
Figure 3. Reducer algorithm for proposed method

Sentiment Analysis of Social Networking Data Using Categorized Dictionary 114
Sentiment Accuracy
From the number of positive and negative words obtained the sentiment accuracy can be
calculated. The overall accuracy percentage of the analysis for the categorized data is
computed as:
( )
( ) (1)
Where the actual number of positive and negative words is verified from the comments
as positive words (a+) and negative words (a
-).The positive words in the comments which
matches with the prediction can be represented as m+. The negative words in the comments
which matches with the prediction is represented as m-.
Dataset Used
The data is fetched using Facepager for approximately 200 posts and comments, which
retrieves data from Facebook accounts online. This feature of the software is used to fetch the
comments and posts of customers on product brands online. The data fetched can be saved in
the form of a text or CSV file. This file can be used for further pre-processing the data to get
the desired results. Specifically for this work, the data has been fetched for 4 categories which
include food, clothing, electronics, and automobiles. In Facepager specific number is given
for the number of comments to be fetched. The data retrieved consists of the fields which
include id, parent_id, level, objected, object type, query status, query time, query type and
message. The required field is the message field which consists of the posts and comments.
The rest of the fields are ignored and not considered for further preprocessing the data. For
the 4 categories the different brands considered are as follows:
Food: Haldirams
Clothing: Levis
Electronics: Samsung
Automobiles: Hyundai
Experimental Results
The results are provided for the data fetched from Facebook which is related to the different
categories. This data is then compared with the categorized dictionary consisting of positive
and negative words which are related to the sentiments of a particular category to which the
data belongs to.

Journal of Information Technology Management, 2020, Vol.12, No.4 115
Steps for Execution process in Apache Hadoop
Step 1: The data fetched from Facepager is in the form of csv file format which is loaded into
the HDFS from the local file system using the following command:
hadoop fs –copyFromLocal Haldirams.csv
Step 2: The data file gets loaded in HDFS and can be viewed in its directory using the
command:
hadoop fs –ls
Step 3: Once the file gets loaded in HDFS, it is used for pre-processing firstly by the Mapper
class and then by the Reducer class. In the Mapper phase, the input file is pre-processed for
filtering the data such as converting the entire data to lower case, removing punctuations,
special characters and symbols and finally getting a dataset of individual words with their
count on the number of occurrences. The entire program for this logic is written in Java
programming language using the Eclipse interface. The entire logic on saving gets saved as a
jar file at the specified location. This jar is executed to get the desired results. The command
used for the execution of the jar file is:
hadoop jar Haldirams.jar WordCount Haldirams.txt out
Step 4: In the Reducer phase, the result file from Mapper phase, is used as an input file which
is compared with the categorized dictionary based on the type of category to which the data
belongs which will be retrieved from the Mapper phase. The final result of the Reducer phase
is given by the count on the number of positive and negative words after comparison from the
categorized dictionary.
Step 5: From the number of positive and negative words received from the Reducer phase the
sentiment accuracy is calculated from the specified formula (1). Further the results are
discussed with examples on the calculation of sentiment accuracy.
Illustration Using Example
To calculate the accuracy a stratified random technique is used according to which any 25
random comments are taken from the data fetched for the categories and results are obtained
manually and from the proposed method. The results are then used to calculate the sentiment
accuracy from the given formula.
( )
( ) (2)

Sentiment Analysis of Social Networking Data Using Categorized Dictionary 116
The actual number of positive and negative words is verified from the comments as
positive words (a+) and negative words (a-). The positive words in the comments which
match with the prediction can be represented as m+. The negative word in the comments
which matches with the prediction is represented as m -.
Considering the case of data related to the food category where the comments are
fetched from Facebook for Haldirams (which is a brand for food). We have got the following
results:
Total number of random comments considered = 25
Total number of positive words verified manually (a+) = 10
Total number of negative words verified manually (a-) = 5
Number of positive words which matched with categorized dictionary (m+) = 11
Number of negative words which matched with categorized dictionary (m-) = 2
Sentiment Accuracy = (11+2) / (10+5) *100
= 86.66%
Table 1 presents the sentiment accuracy achieved for different categories used for
sentiment analysis. It can be seen that the highest accuracy is found for clothing (88.21%) and
least for automobiles (86.50).
Table 1. Sentiment Accuracy for categories
Category Accuracy(%)
Food 86.66
Clothing 88.21
Automobiles 86.50
Electronics 87.56
Results for different Categories
On applying the stratified random sampling technique on random samples of comments or
reviews of customers, the sentiment accuracy is calculated by using data belonging to
different categories. The results are calculated as per positive word samples taken from
categorized dictionaries (Table 2). The positive sentiment comment data for different
categories have been shown in Table 3.
Mean value of accuracy achieved = 87.23%

Journal of Information Technology Management, 2020, Vol.12, No.4 117
Table 2. Positive words samples from categorized dictionaries
Food Clothing Automobiles Electronics
Yummy Fashionable Speedy Durable
Tasty Comfortable Powerful Stylish
Flavorful Elegant Safe Sleek
Table 3. Sample data from Facebook comments for different categories
Categories Sentiment Facebook Comments
Food
Positive
Yummy we love this !!!
Clothing Positive I have always like the levis brand .best brand ever
Automobiles Positive realy a nice car it is just like a spice jet journey
Electronics Negative Very bad experience gear s3 watch don't bye bad back glass not
Gorilla easily crack
Results for different categories
The results obtained from different categories such as food, clothing, automobiles, and
electronics can be represented graphically using a bar graph. The four categories used for the
calculation of sentiment accuracy show results better than the previous techniques and have
improved the percentage of accuracy. The bar graph in Fig. 4 displays the category on the x-
axis and the sentiment accuracy calculated for 4 categories on the y-axis. Since the Stratified
random sampling technique is used so the data is selected randomly in sets of 25 each from
approximately 1000-2000 comments/reviews given by customers on different brands Fig. 5.
Fig 4. Graphical representation of
sentiment accuracy for different
categories

Sentiment Analysis of Social Networking Data Using Categorized Dictionary 118
The random data selected provided with varied results. The mean accuracy calculated
proved to give better results since the comparisons on the positive and negative sentiments of
words were specific to the provided categorized dictionary.
Fig 5. Graphical representation of
positive and negative sentiments for
different categories using stratified
random sampling technique
Discussions and Implications
Predictive Analysis from Results
The results obtained reveal that the accuracy calculated gives an insight to the producer or
company of the brand. This can be used as a feedback of their products which are being used
and how many products are getting popular and widely getting used by the customer. These
results can be used as information by various brands to improve the quality of their products
in case of less number of positive comments or reviews obtained. The total number of positive
and negative comments obtained as a result can be used to predict the positive and negative
feedback to the users. Based on the results the companies can get feedback and take necessary
actions in the future.
Comparison with existing techniques
The results show that the proposed method has increased accuracy in comparison to the
previous techniques available in the literature. The categorized dictionary provides a
comparison of the data from the user’s reviews/comments for a product belonging to a
particular category. This makes the comparison more specific and provides more efficient
results for the number of positive and negative words to be obtained hence increasing
sentiment accuracy. The improved accuracy provides better feedback to the companies about
their products and gives them an insight into how improvements can be made to improve their
reviews and provide customer satisfaction. The comparison from previous techniques shows
improved accuracy with the proposed method in Table 4.

Journal of Information Technology Management, 2020, Vol.12, No.4 119
Table 4. Performance Accuracy
Method Accuracy(%)
SVM + Lexicon-based tagging (Ortigosa et al., 2014) 83.27
Hadoop based open source technology (Dasgupta et al., 2015) 67.6
Proposed Method 87.23
Conclusion and Future Work
Various sentiment analysis techniques have been proposed and implemented by researchers in
the literature aimed at providing better sentiment analysis with a minimum error rate. The
limitations of these techniques affect the retrieval of feedback and there by decreases user’s
satisfaction. The major contributions of the proposed work are to provide an efficient method
capable of increasing sentiment accuracy and give better results to the companies in terms of
feedback from users online. In this work, an effort is made to improve the sentiment accuracy
by making an addition of the concept of categorized dictionary in the previously implemented
techniques, which resulted in improved accuracy. The concept of categorized dictionary
involves the creation of dictionaries differently for different categories making the
comparisons specific. The categorized dictionary employed words defining the positive and
negative sentiments related to the particular category. The result findings prove the worth of
the proposed method in increasing sentiment accuracy. The future work would be to improve
the proposed approach by improving the categorized dictionary by adding emoticons,
including spelling checks and trying to add the negation checker which will further increase
the results with better accuracy.
References
Alaei, A. R., Becken, S., & Stantic, B. (2019). Sentiment analysis in tourism: capitalizing on big
data. Journal of Travel Research, 58(2), 175-191.
Chang, V. (2018). A proposed social network analysis platform for big data analytics. Technological
Forecasting and Social Change, 130, 57-68.
Chawda, R. K., & Thakur, G. (2016, March). Big data and advanced analytics tools. In 2016
symposium on colossal data analysis and networking (CDAN) (pp. 1-8). IEEE.
Dasgupta, S. S., Natarajan, S., Kaipa, K. K., Bhattacherjee, S. K., & Viswanathan, A. (2015, October).
Sentiment analysis of Facebook data using Hadoop based open source technologies. In 2015
IEEE International Conference on Data Science and Advanced Analytics (DSAA) (pp. 1-3).
IEEE.
Gandomi, A., & Haider, M. (2015). Beyond the hype: Big data concepts, methods, and analytics.
International journal of information management, 35(2), 137-144.

Sentiment Analysis of Social Networking Data Using Categorized Dictionary 120
Goswami, S., Nandi, S., & Chatterjee, S. (2019). Sentiment analysis based potential customer base
identification in social media. In Contemporary Advances in Innovative and Applicable
Information Technology (pp. 237-243). Springer, Singapore.
Gupta, P., Kumar, P., & Gopal, G. (2015). Sentiment analysis on Hadoop with Hadoop streaming.
International Journal of Computer Applications, 121(11).
Gupta, P., Sharma, A., & Grover, J. (2016, September). Rating based mechanism to contrast abnormal
posts on movies reviews using MapReduce paradigm. In 2016 5th International Conference on
Reliability, Infocom Technologies and Optimization (Trends and Future Directions)(ICRITO)
(pp. 262-266). IEEE.
Kang, G. J., Ewing-Nelson, S. R., Mackey, L., Schlitt, J. T., Marathe, A., Abbas, K. M., & Swarup, S.
(2017). Semantic network analysis of vaccine sentiment in online social media. Vaccine,
35(29), 3621-3638.
Kumar, B. (2015). An encyclopedic overview of ‘big data’analytics. International Journal of Applied
Engineering Research, 10(3), 5681-5705.
Ortigosa, A., Martín, J. M., & Carro, R. M. (2014). Sentiment analysis in Facebook and its application
to e-learning. Computers in human behavior, 31, 527-541.
Patidar, K., & Sharma, I. (2015). Study of Big Data Analysis Tools and Techniques.
Selvan, L. G. S., & Moh, T. S. (2015, June). A framework for fast-feedback opinion mining on Twitter
data streams. In 2015 International Conference on Collaboration Technologies and Systems
(CTS) (pp. 314-318). IEEE.
Tayal, D. K., & Yadav, S. K. (2016, March). Fast retrieval approach of sentimental analysis with
implementation of bloom filter on Hadoop. In 2016 International Conference on Computational
Techniques in Information and Communication Technologies (ICCTICT) (pp. 14-18). IEEE.
Bibliographic information of this paper for citing:
Singh, Akansha, & Sharma, Aastha, & Kant Singh, Krishna, & Dhull, Anuradha (2020). Sentiment Analysis of
Social Networking Data Using Categorized Dictionary. Journal of Information Technology Management, 12(4),
105-120.
Copyright © 2020, Akansha Singh, Aastha Sharma, Krishna Kant Singh and Anuradha Dhull.